
FOR RELEAS
Ru
Ne
Uk
Ame
Sou
RECOMMENDE
SE JULY 9, 2014
ussi
egat
krai
erica
ur Dra
ED CITATION: Pew
ia’s G
tive
ine
ans’ a
amat
w Research Center
Glo
am
and E
tically
r, July, 2014, “Ru
obal
mid C
urop
y
ssia’s Global Ima
l Im
Cris
peans
FOR FURTH
ON THIS RE
Katie Simm
James Bell,
Russ Oates,
202.419.43
www.pewres
age Negative amid
NUMBERS, FAC
mage
sis i
s’ View
HER INFORMATIO
EPORT:
ons,
Senior Rese
Director, Internat
,
Communications
372
search.org
d Crisis in Ukraine
CTS AND TRENDS
e
in
ws
ON
archer
tional Survey Res
s Manager
e”
S SHAPING THE W
search
WORLD

1
PEW RESEARCH CENTER
www.pewresearch.org
About the Report
This report examines global attitudes towards Russia, as well as views about Russian President
Vladimir Putin. It is based on 48,643 interviews in 44 countries with adults 18 and older,
conducted from March 17 to June 5, 2014. For more details, see survey methods and topline
results.
The report is a collaborative effort based on the input and analysis of the following individuals:
Katie Simmons
,
Senior Researcher
Richard Wike
,
Director, Global Attitudes Research
James Bell
,
Director, International Survey Research
Jill Carle
,
Research Associate
Danielle Cuddington
,
Research Assistant
Claudia Deane
,
Director, Research Practice
Kat Devlin
,
Research Analyst
Bruce Drake
,
Senior Editor
Jacob Poushter
,
Research Associate
Steve Schwarzer
,
Research Methodologist
Bruce Stokes
,
Director, Global Economic Program
About Pew Research Center
Pew Research Center is a nonpartisan fact tank that informs the public about the issues, attitudes
and trends shaping America and the world. It does not take policy positions. It conducts public
opinion polling, demographic research, media content analysis and other empirical social science
research. The center studies U.S. politics and policy views; media and journalism; internet and
technology; religion and public life; Hispanic trends; global attitudes and U.S. social and
demographic trends. All of the center’s reports are available at
www.pewresearch.org
. Pew
Research Center is a subsidiary of The Pew Charitable Trusts.
Alan Murray
,
President
Michael Dimock
,
Vice President, Research
Elizabeth Mueller Gross
,
Vice President
Paul Taylor
,
Executive Vice President, Special Projects
Andrew Kohut
,
Founding Director
© Pew Research Center 2014
2
PEW RESEARCH CENTER
www.pewresearch.org
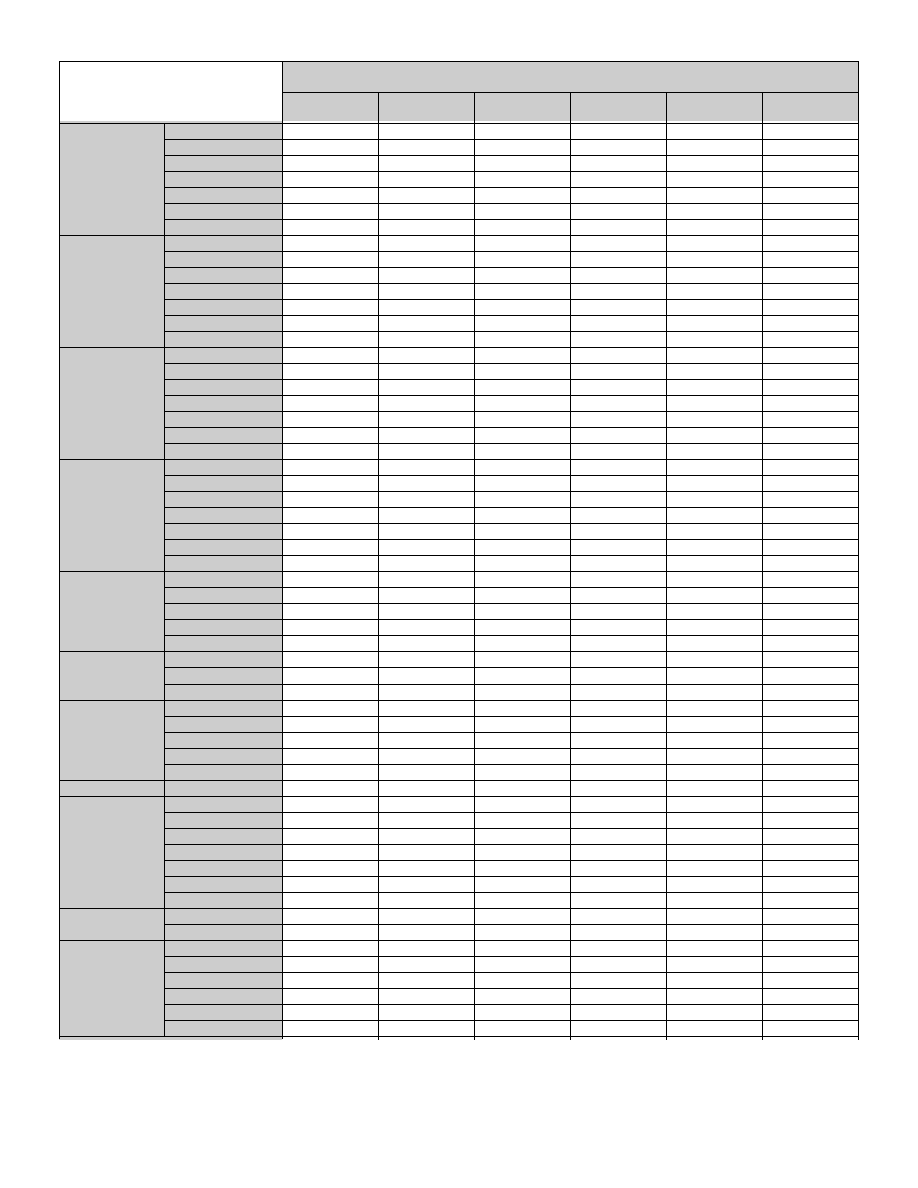
64
43
54
36
38
27
20
80
2013
2014
%
74 Europe
45 Latin Am.
41 Asia
68 Mid. East
72 U.S.
31 Africa
Russia’s Global Image Negative amid Crisis in
Ukraine
Americans’ and Europeans’ Views Sour Dramatically
As the European Union considers further
sanctions on Russia for its role in the standoff
in Ukraine, Russia is broadly unpopular in
many countries around the globe and
increasingly disliked in Europe and the United
States. President Vladimir Putin’s leadership
also continues to inspire little confidence
worldwide, according to a new Pew Research
Center survey. The former Cold War power’s
negative global image contradicts Russians’
expectations
that Putin’s actions in Ukraine
would improve their country’s international
reputation.
1
And while Putin expresses concerns about
Russian minorities’ rights in Ukraine, the world
gives Moscow poor marks on its record of
respecting its own citizens’ personal freedoms.
These are among the key findings of a survey by
the Pew Research Center conducted from March 17 to June 5, 2014 among 48,643 respondents in
44 countries, including Russia. Nearly all interviews were conducted after Putin’s statement on
March 18
th
that Russia would annex Crimea. A majority of interviews in France, Germany, Greece,
Italy, Poland, Spain and the United Kingdom were completed within a week of the announcement.
1
We asked Russians “In your opinion, has President Putin’s handling of the situation in Ukraine led people in other countries to have a more
favorable opinion of Russia, a less favorable opinion, or has it made no difference?” More than four-in-ten (43%) said more favorable, 26%
said less favorable and 22% said no difference. For more on Russians’ and Ukrainians’ views of the situation in Ukraine, see
Despite
Concerns about Governance, Ukrainians Want to Remain One Country. May 8, 2014)
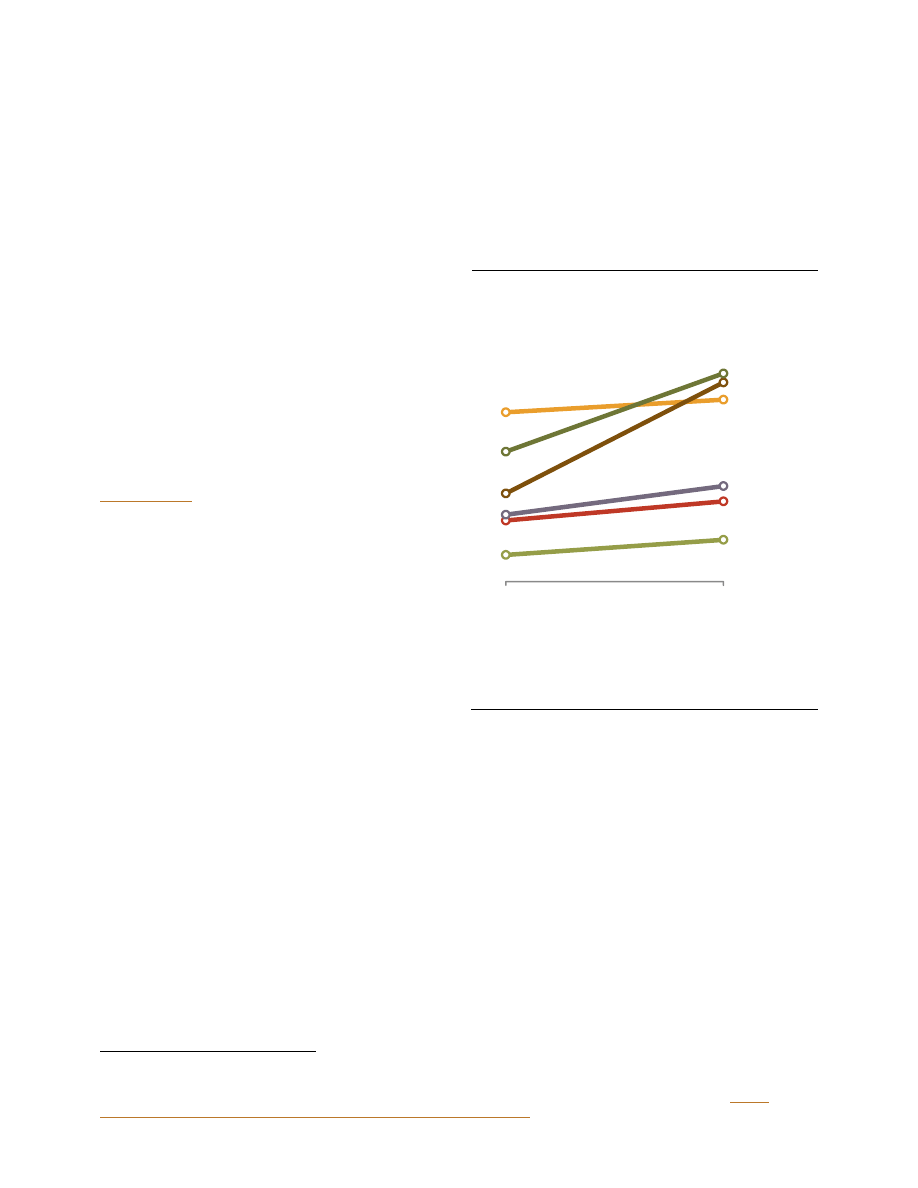
Unfavorable Views of Russia on the Rise
Median unfavorable view of Russia
Note: Median among 35 countries surveyed in 2013 and 2014, not
including Russia.
Source: Spring 2014 Global Attitudes survey. Q15e.
PEW RESEARCH CENTER
3
PEW RESEARCH CENTER
www.pewresearch.org
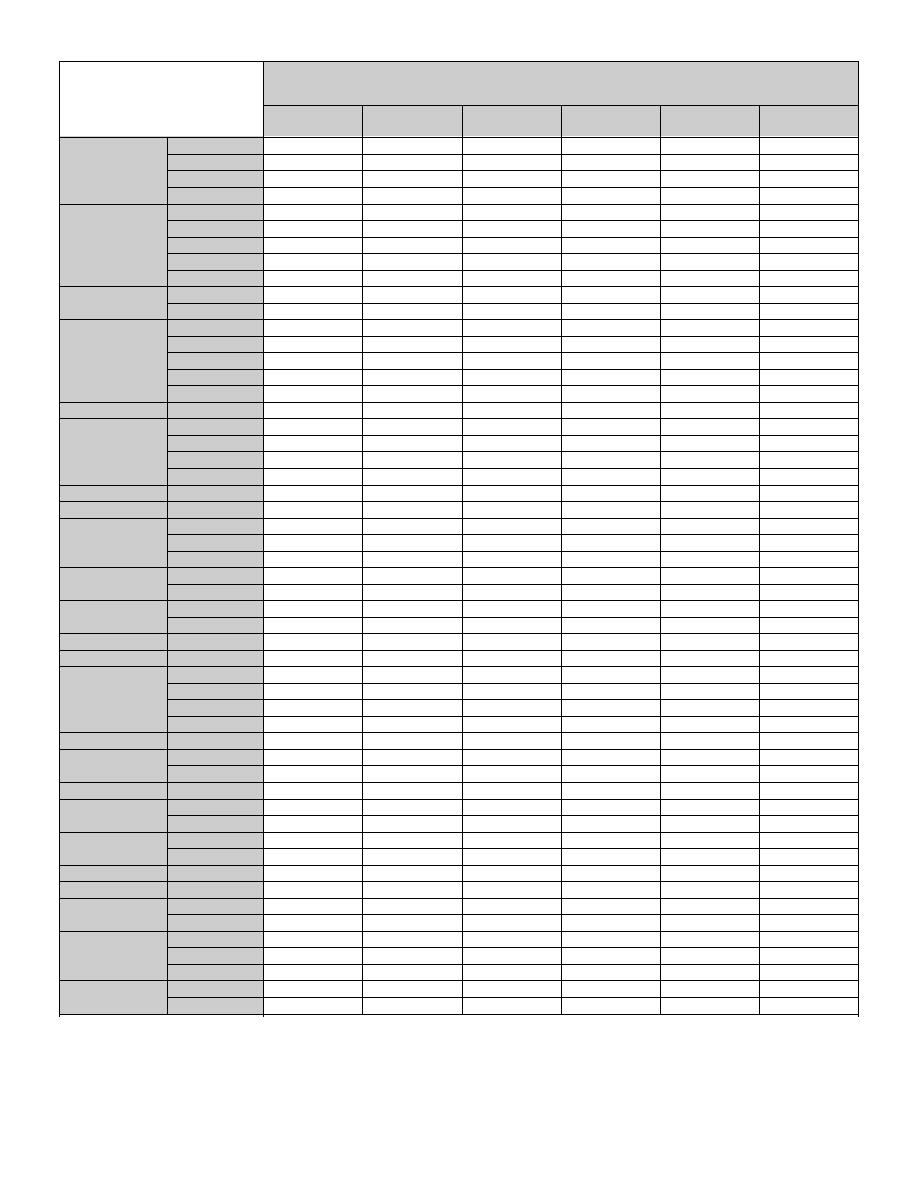
Russia Increasingly Unpopular
Across the 44 countries surveyed, a median
percentage of 43% have unfavorable opinions of
Russia, compared with 34% who are positive.
Negative ratings of Russia have increased
significantly since 2013 in 20 of the 36
countries surveyed in both years, decreased in
six and stayed relatively similar in the
remaining 10.
Americans and Europeans in particular have
soured on Russia over the past 12 months.
More than six-in-ten in Poland, Germany, Italy,
Spain, France, the U.S. and the UK have an
unfavorable image of Russia. And in all but one
of these countries negative reviews are up by
double digits since last year, including by 29
percentage points in the U.S., 27 points in
Poland, 24 points in the UK and 23 points in
Spain. Greeks stand out among their European
counterparts – just 35% dislike Russia, virtually
unchanged from last year.
Ukrainians’ attitudes toward Russia also have
changed significantly over time. Six-in-ten in
Ukraine rate Russia unfavorably today,
compared with just 11% in 2011, the last time
the question was asked. Within Ukraine, there
are deep divides by region and language. More
than eight-in-ten in the country’s west (83%)
give Russia low marks, compared with 45% in
the east and only 4% in Crimea. Within the
east, Russian-only speakers (28%) are less
negative toward Russia than their neighbors
(58%).
2
2
For purposes of this report, the results in Ukraine are analyzed by three regions: The west, which includes the central region around Kyiv, as
well as portions of the country that border Poland, Slovakia and Hungary; the east, which includes areas along the Black Sea and the border
with Russia; and the territory of Crimea. “Russian-only speakers” in Ukraine are those who say they usually speak Russian at home and then
mention no other languages spoken at home or during the day.
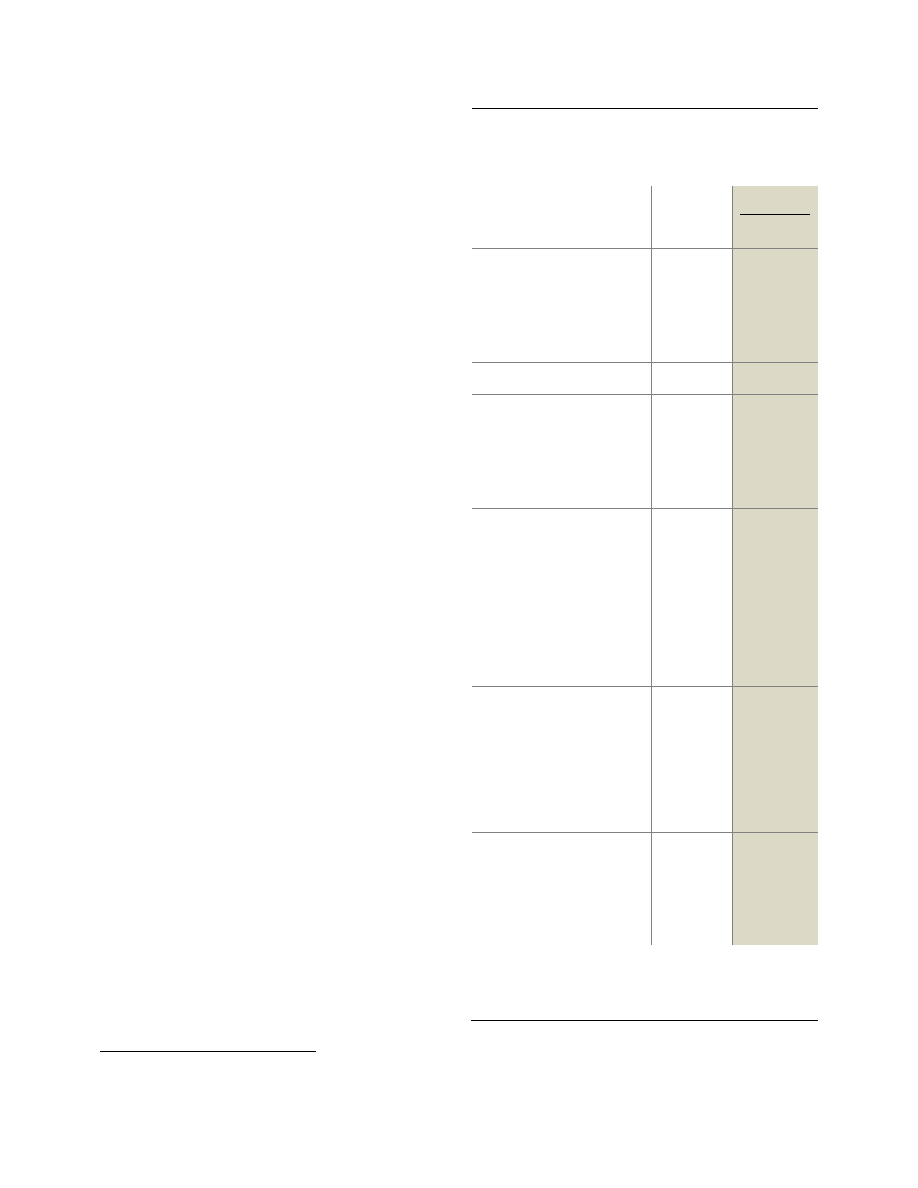
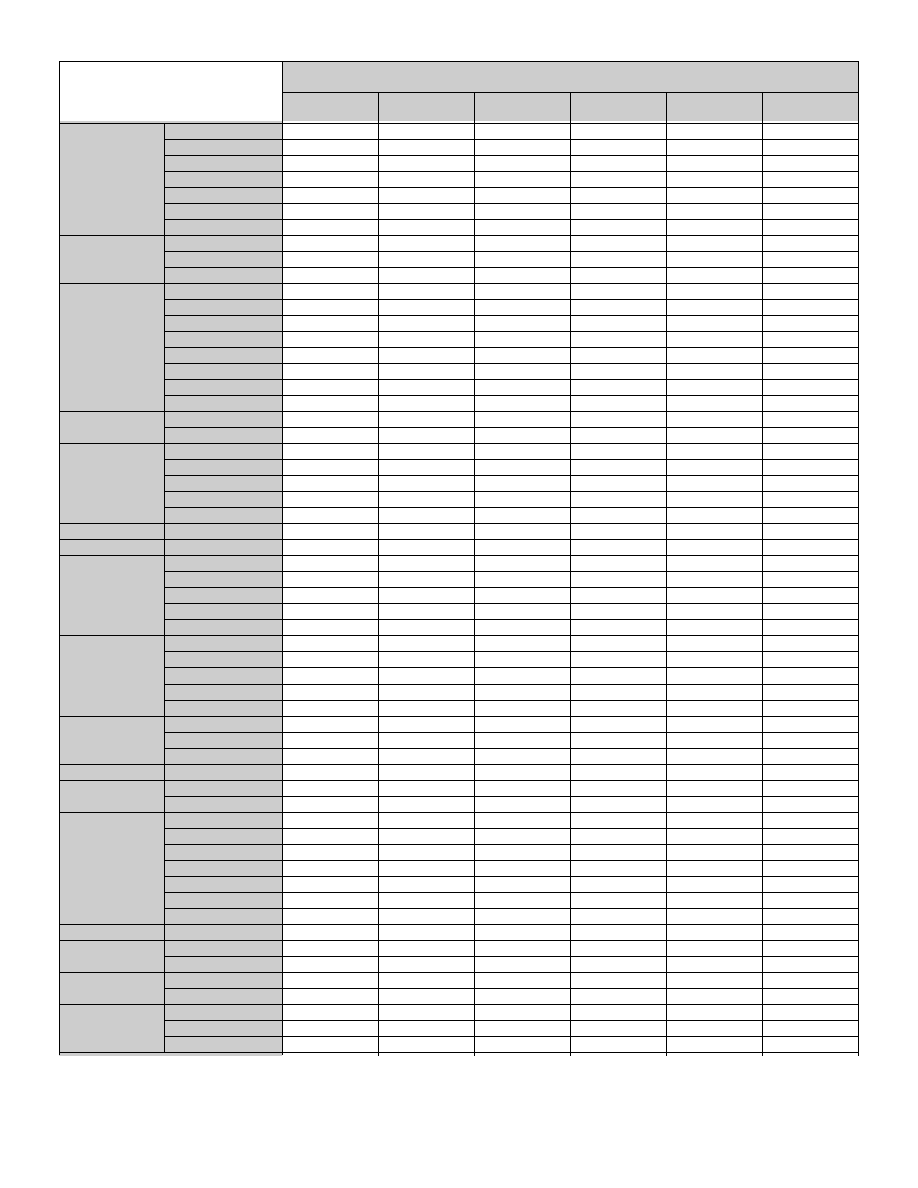
Europeans, Americans More Negative
toward Russia
Do you have a favorable or unfavorable view of Russia?
2013
2014
13-14 Change
unfavorable
Fav Unfav Fav Unfav
%
%
% %
U.S.
37
43
19 72
+29
Poland
36
54
12 81
+27
UK
38
39
25 63
+24
Spain
38
51
18 74
+23
Germany
32
60
19 79
+19
Italy
31
56
20 74
+18
France
36
64
26 73
+9
Greece
63
33
61 35
+2
Russia
83
14
92 6
-8
Ukraine
--
--
35 60
--
Turkey
19
66
16 73
+7
Egypt
30
64
24 71
+7
Jordan
25
70
22 75
+5
Lebanon
46
53
45 54
+1
Tunisia
35
37
35 38
+1
Israel
21
77
30 68
-9
Palest. ter.
29
57
41 46
-11
Malaysia
47
22
34 38
+16
South Korea
53
33
43 48
+15
Indonesia
43
33
38 43
+10
Japan
27
64
23 69
+5
Pakistan
19
32
11 29
-3
India
45
23
39 16
-7
Philippines
35
52
46 43
-9
China
49
39
66 23
-16
Bangladesh
--
--
60 33
--
Thailand
--
--
48 29
--
Vietnam
--
--
75 14
--
Venezuela
40
41
36 51
+10
Argentina
26
29
19 37
+8
Brazil
34
52
24 59
+7
Chile
39
38
34 45
+7
El Salvador
27
29
23 36
+7
Mexico
28
38
21 44
+6
Colombia
--
--
24 37
--
Peru
--
--
34 35
--
Nicaragua
--
--
45 27
--
Uganda
28
22
34 31
+9
Senegal
42
21
39 30
+9
Ghana
49
26
42 31
+5
Kenya
47
27
49 32
+5
South Africa
26
53
25 51
-2
Nigeria
38
30
41 27
-3
Tanzania
--
--
49 25
--
Note: India data from Winter 2013-2014 survey.
Source: Spring 2014 Global Attitudes survey. Q15e.
PEW RESEARCH CENTER

4
PEW RESEARCH CENTER
www.pewresearch.org
As has been the case in previous years, Russia is also unpopular with publics in the Middle East.
More than half in most countries surveyed in the region have an unfavorable opinion of Russia,
including seven-in-ten or more Jordanians, Turks and Egyptians. The Palestinians and Tunisians
are less negative. In Lebanon, attitudes vary significantly by religious group. Majorities of Sunni
Muslims (80%) and Christians (63%) give Russia unfavorable ratings, compared with just 12% of
Shia Muslims.
Russia is increasingly disliked in many Latin American countries, though the change has not been
as dramatic as in the U.S. and Europe. And while, on balance, most publics hold negative views of
Russia, substantial percentages have no opinion. More than four-in-ten in Brazil, Venezuela, Chile
and Mexico give Russia unfavorable ratings. Significant increases in Russia’s unpopularity since
last year occurred in Venezuela, Argentina, Brazil, Chile, El Salvador and Mexico.
In Asia, there are deep divisions between nations over their opinions of Russia. Roughly seven-in-
ten in Japan (69%) rate Russia unfavorably compared with a quarter or fewer in China (23%) and
Vietnam (14%). China is one of the few countries where negative reviews have declined
substantially in the past year (-16 percentage points).
African nations remain the least likely among the regions surveyed to rate Russia unfavorably. In
fact, pluralities in most countries, with South Africa being the major exception, give Russia high
marks, though many people do not express an opinion either way.
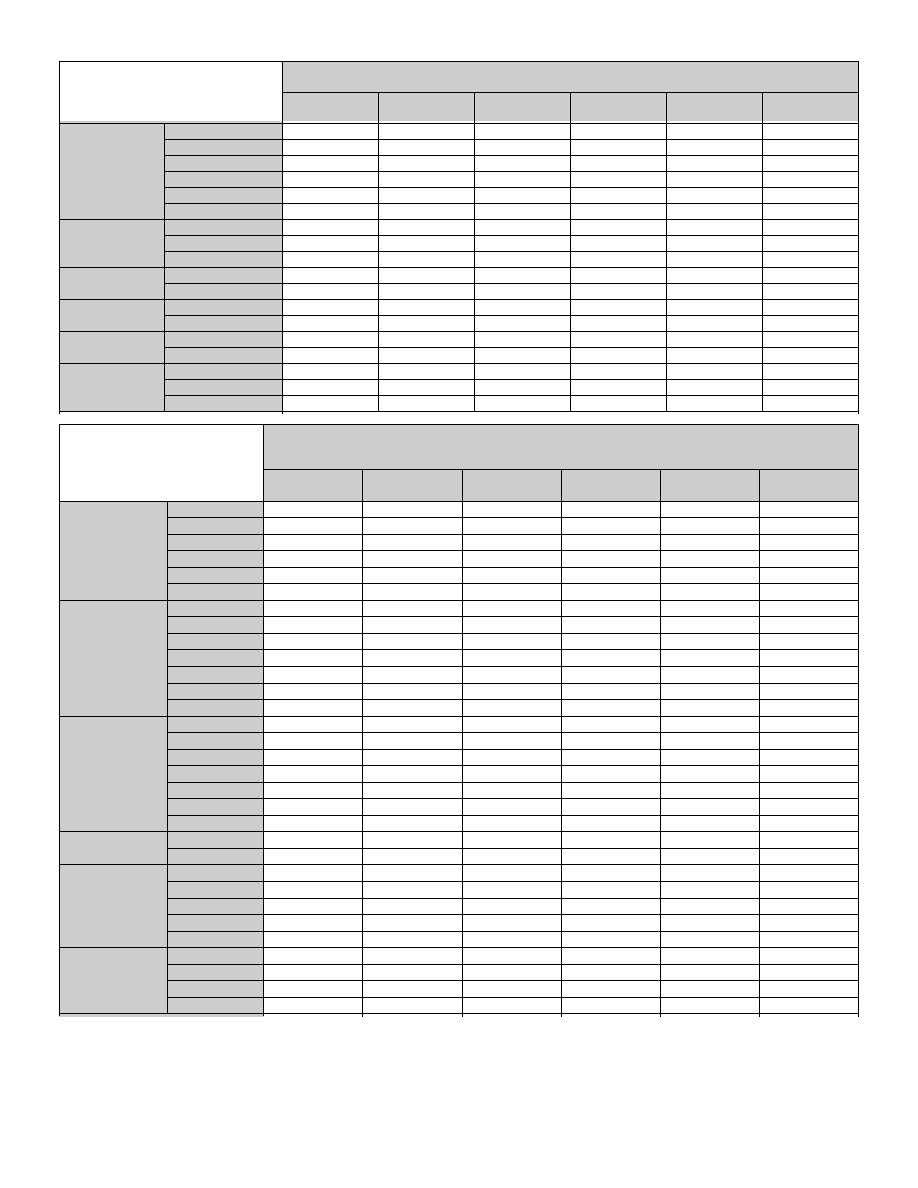
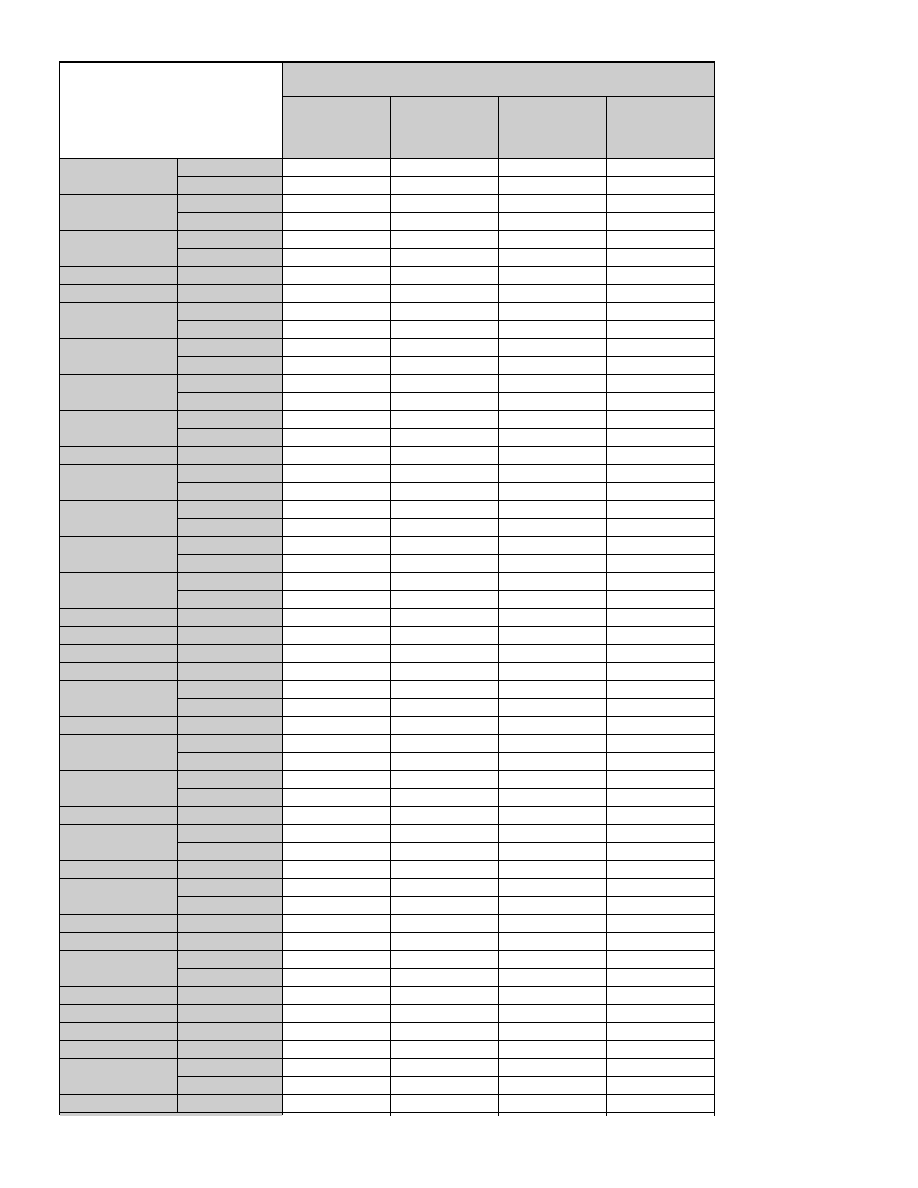
Little Confidence in Putin
Majorities or pluralities in 25 of the 44 countries surveyed say they lack confidence in Putin to do
the right thing in world affairs.
As with opinions on Russia generally, attitudes toward Putin are more uniformly negative in the
U.S. and Europe. Eight-in-ten Americans say they have not too much or no confidence at all in the
Russian leader, and majorities in every country surveyed in Europe agree.
More than seven-in-ten Ukrainians also express disappointment with Putin. Broad majorities of
Ukrainians in the west (89%) and the east (66%) express no confidence in Russia’s president,
while just 5% of residents of Crimea say the same. About half of Russian-only speakers (51%) in
the east lack confidence in Putin’s foreign policy compared with 43% who say they trust him.
Majorities or pluralities in most nations surveyed in the Middle East and Latin America also give
Putin a failing grade on foreign policy. And six-in-ten or more of Japanese and South Koreans do
the same.
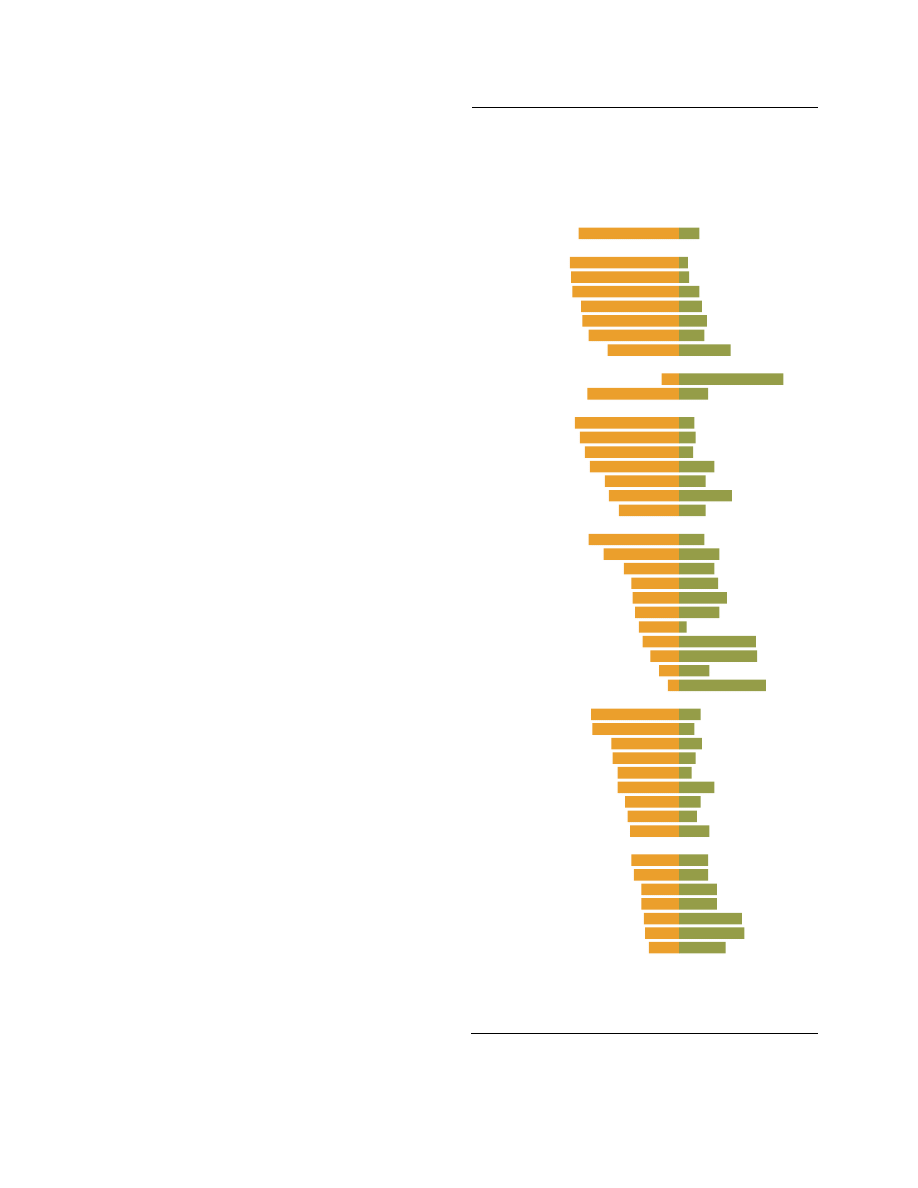
5
PEW RESEARCH CENTER
www.pewresearch.org
80%
87
86
85
78
77
72
57
14
73
83
79
75
71
59
56
48
72
60
44
38
37
35
32
29
23
16
9
70
69
54
53
49
49
43
41
39
38
36
30
30
28
27
24
16%
7
8
16
18
22
20
41
83
23
12
13
11
28
21
42
21
20
32
28
31
38
32
6
61
62
24
69
17
12
18
13
10
28
17
14
24
23
23
30
30
50
52
37
U.S.
Spain
Poland
France
Italy
Germany
UK
Greece
Russia
Ukraine
Egypt
Jordan
Turkey
Israel
Palest. ter.
Lebanon
Tunisia
Japan
South Korea
Indonesia
Thailand
Philippines
Malaysia
Pakistan
Bangladesh
China
India
Vietnam
Venezuela
Brazil
Chile
Mexico
Argentina
Nicaragua
Peru
Colombia
El Salvador
South Africa
Senegal
Uganda
Nigeria
Kenya
Tanzania
Ghana
No confidence Confidence
Don't
know
5%
5
4
0
4
1
7
2
3
5
6
7
14
1
20
2
31
7
7
28
31
26
33
62
10
15
60
21
13
18
28
34
41
23
39
46
37
38
41
40
40
22
21
39
Negative opinions of Putin in the U.S. rose 26
percentage points since the last time Pew
Research asked the question in 2012 (54%).
Negative ratings for Putin have also increased
by double-digits over the past two years in
Poland (+12 percentage points) and Brazil
(+13). In Ukraine, lack of confidence has
jumped 40 points since the question was last
asked in 2007.
Vietnam (69%), China (62%), Bangladesh
(61%), Tanzania (52%) and Kenya (50%) are
the only countries besides Russia where at least
half of the public has confidence in Putin’s
handling of international affairs. In Russia,
83% trust their leader’s foreign policy, up from
69% in 2012. Significant percentages in the
remaining countries do not express an opinion
about the Russian president.
Confidence in Putin Low Worldwide
How much confidence do you have in Russian President
Putin to do the right thing regarding world affairs?
Source: Spring 2014 Global Attitudes survey. Q41b.
PEW RESEARCH CENTER

6
PEW RESEARCH CENTER
www.pewresearch.org
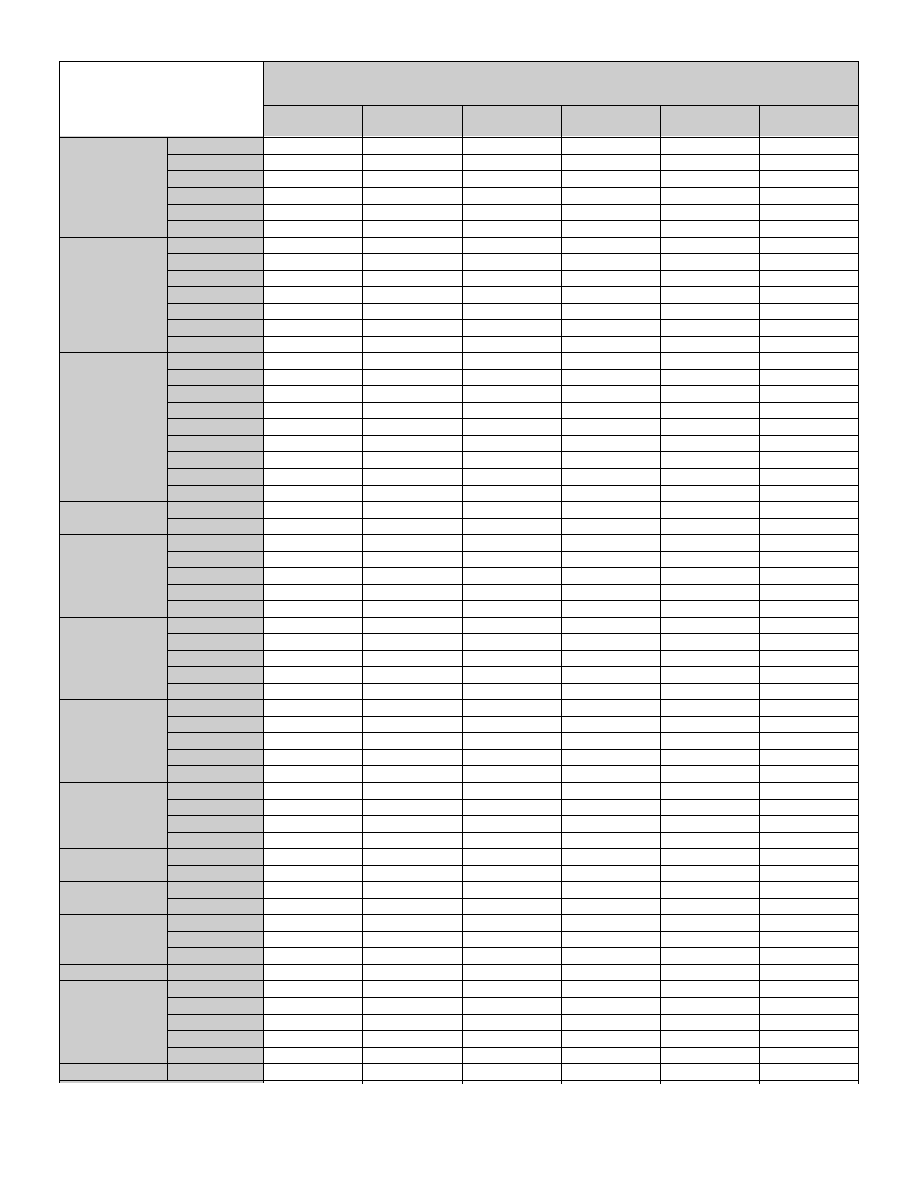
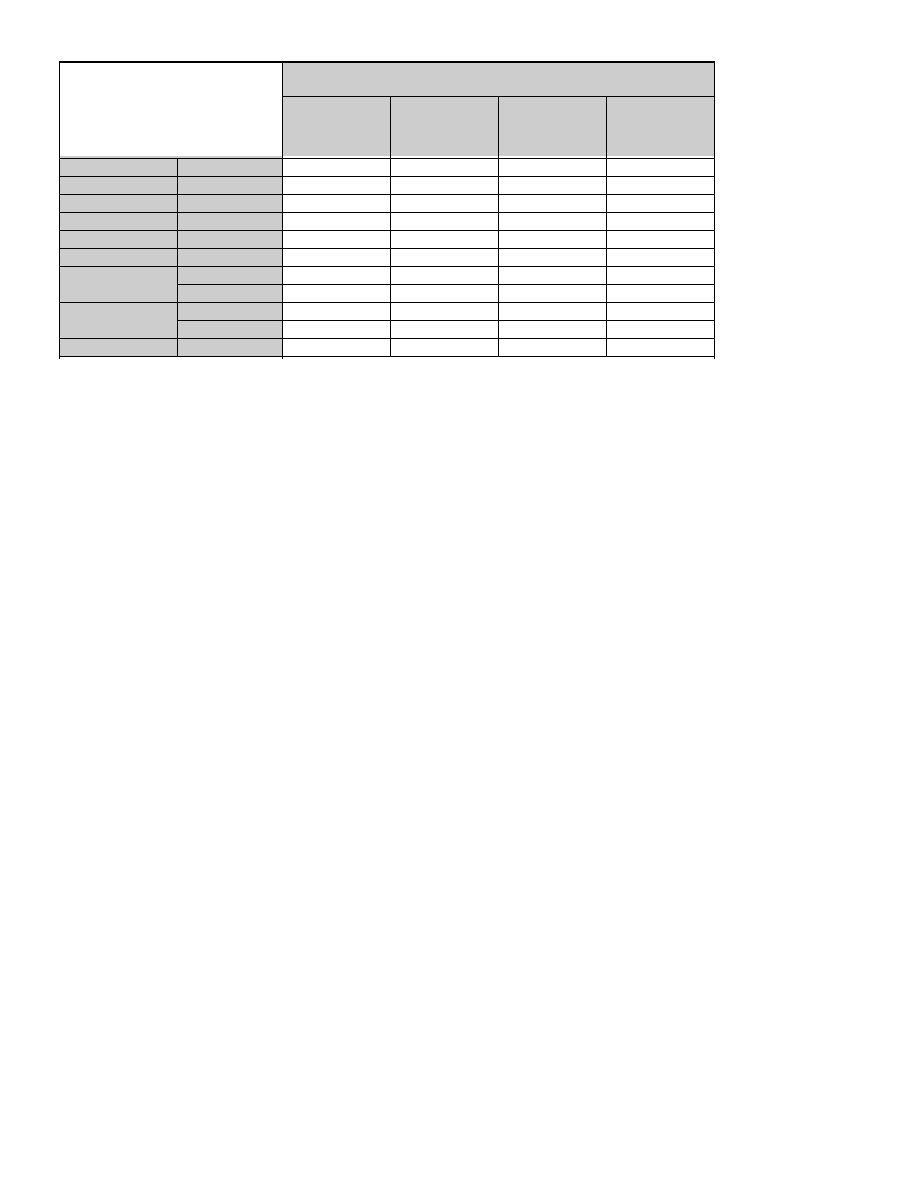
Moscow Seen as Not Protecting
Civil Liberties
Majorities or pluralities in 16 of the 44
countries surveyed say the Russian government
does not respect the personal freedoms of its
people. In many of the remaining countries,
large percentages have no opinion on this
question.
Americans and Europeans have a particularly
negative image of Moscow’s record on civil
liberties. Roughly three-quarters or more in
Germany, France, the U.S., Poland, Spain, the
UK and Italy think Russia does not respect
personal freedoms. This view has increased
dramatically since the previous time Pew
Research asked the question in 2008 in the
U.S. (+22 points), Spain (+16) and the UK
(+12).
Meanwhile, the Vietnamese (76% say Russia
respects personal freedoms) and the Chinese
(63%) give Moscow its highest marks on civil
liberties. A majority of Russians (57%) do the
same – a significant shift from 2008, when the
public was divided (45% does respect personal
freedoms, 44% does not).
Lack of Respect for Personal Freedoms
Does the government of Russia respect the personal
freedoms of its people?
Yes
No
Don’t
know
%
% %
U.S.
10
81 8
Germany
8
89 3
France
13
86 1
Poland
11
80 9
Spain
11
80 9
UK
12
76 12
Italy
15
72 13
Greece
40
53 7
Ukraine
24
60
16
Russia
57
32
11
Egypt
25
60 15
Israel
28
59 13
Lebanon
51
41 8
Turkey
38
40 22
Jordan
47
40 13
Palest. ter.
55
27 18
Tunisia
46
26 27
Japan
16
70 14
South Korea
32
55 12
Indonesia
35
36 29
Bangladesh
57
30 13
Thailand
37
29 35
Malaysia
31
28 41
Philippines
49
26 25
India
30
15 55
China
63
14 23
Pakistan
24
12 64
Vietnam
76
7 16
Brazil
23
57 20
Chile
16
49 35
Venezuela
28
40 32
Peru
22
39 40
Nicaragua
27
39 34
Mexico
18
38 44
Colombia
14
37 49
Argentina
14
32 54
El Salvador
17
32 51
South Africa
21
35 44
Tanzania
37
27 36
Kenya
49
24 28
Senegal
26
21 53
Ghana
49
18 34
Nigeria
34
15 51
Uganda
40
14 45
Source: Spring 2014 Global Attitudes survey. Q109d.
PEW RESEARCH CENTER

7
PEW RESEARCH CENTER
www.pewresearch.org
Methods in Detail
About the 2014 Spring Pew Global Attitudes Survey
Results for the survey are based on telephone and face-to-face interviews conducted under the
direction of Princeton Survey Research Associates International. Survey results are based on
national samples. For further details on sample designs, see below.
The descriptions below show the margin of sampling error based on all interviews conducted in
that country. For results based on the full sample in a given country, one can say with 95%
confidence that the error attributable to sampling and other random effects is plus or minus the
margin of error. In addition to sampling error, one should bear in mind that question wording and
practical difficulties in conducting surveys can introduce error or bias into the findings of opinion
polls.
Country: Argentina
Sample design:
Multi-stage cluster sample stratified by locality size
Mode:
Face-to-face adults 18 plus
Languages:
Spanish
Fieldwork dates:
April 17 – May 11, 2014
Sample size:
1,000
Margin of Error:
±3.9 percentage points
Representative:
Adult population (excluding dispersed rural population, or 6.5% of the
population)
Country: Bangladesh
Sample design:
Multi-stage cluster sample stratified by administrative division and urbanity
Mode:
Face-to-face adults 18 plus
Languages:
Bengali
Fieldwork dates:
April 14 – May 11, 2014
Sample size:
1,000
Margin of Error:
±3.8 percentage points
Representative: Adult
population

8
PEW RESEARCH CENTER
www.pewresearch.org
Country: Brazil
Sample design:
Multi-stage cluster sample stratified by region and size of municipality
Mode:
Face-to-face adults 18 plus
Languages:
Portuguese
Fieldwork dates:
April 10 – April 30, 2014
Sample size:
1,003
Margin of Error:
±3.8 percentage points
Representative: Adult
population
Country: Chile
Sample design:
Multi-stage cluster sample stratified by region and urbanity
Mode:
Face-to-face adults 18 plus
Languages:
Spanish
Fieldwork dates:
April 25 – May 5, 2014
Sample size:
1,000
Margin of Error:
±3.8 percentage points
Representative:
Adult population (excluding Chiloe and other islands, or about 3% of the
population)
Country: China
Sample design:
Multi-stage cluster sample stratified by region and urbanity
Mode:
Face-to-face adults 18 plus
Languages:
Chinese (Mandarin, Fuping, Renshou, Suining, Xichuan, Hua, Shanghai,
Chenzhou, Anlong, Chengdu, Yingkou, Guang’an, Zibo, Jinxi, Yantai,
Feicheng, Leiyang, Yuanjiang, Daye, Beijing, Yangchun, Nanjing, Shucheng,
Linxia, Yongxin, Chun’an, Xinyang, Shangyu, Baiyin, Ruichang, Xinghua,
and Yizhou dialects)
Fieldwork dates:
April 11 – May 15, 2014
Sample size:
3,190
Margin of Error:
±3.5 percentage points
Representative:
Adult population (excluding Tibet, Xinjiang, Hong Kong, and Macau, or
about 2% of the population). Disproportionately urban. The data were
weighted to reflect the actual urbanity distribution in China.
Note:
The results cited are from Horizonkey’s self-sponsored survey.

9
PEW RESEARCH CENTER
www.pewresearch.org
Country: Colombia
Sample design:
Multi-stage cluster sample stratified by region and urbanity
Mode:
Face-to-face adults 18 plus
Languages:
Spanish
Fieldwork dates:
April 12 – May 8, 2014
Sample size:
1,002
Margin of Error:
±3.5 percentage points
Representative:
Adult population (excluding region formerly called the National Territories
and the islands of San Andres and Providencia, or about 4% of the
population)
Country:
Egypt
Sample design:
Multi-stage cluster sample stratified by governorate and urbanity
Mode: Face-to-face adults 18 plus
Languages:
Arabic
Fieldwork dates:
April 10 – April 29, 2014
Sample size:
1,000
Margin of Error:
±4.3 percentage points
Representative:
Adult population (excluding frontier governorates, or about 2% of the
population)
Country:
El Salvador
Sample design:
Multi-stage cluster sample stratified by department and urbanity
Mode: Face-to-face adults 18 plus
Languages:
Spanish
Fieldwork dates:
April 28 – May 9, 2014
Sample size:
1,010
Margin of Error:
±4.5 percentage points
Representative:
Adult population

10
PEW RESEARCH CENTER
www.pewresearch.org
Country:
France
Sample design:
Random Digit Dial (RDD) sample of landline and cell phone households
with quotas for gender, age and occupation and stratified by region and
urbanity
Mode:
Telephone adults 18 plus
Languages:
French
Fieldwork dates:
March 17 – April 1, 2014
Sample size:
1,003
Margin of Error:
±4.1 percentage points
Representative:
Telephone households (roughly 99% of all French households)
Country:
Germany
Sample design:
Random Digit Dial (RL(2)D) probability sample of landline households,
stratified by administrative district and community size, and cell phone
households
Mode:
Telephone adults 18 plus
Languages:
German
Fieldwork dates:
March 17 – April 2, 2014
Sample size:
1,000
Margin of Error:
±4.0 percentage points
Representative:
Telephone households (roughly 99% of all German households)
Country:
Ghana
Sample design:
Multi-stage cluster sample stratified by region and settlement size
Mode:
Face-to-face adults 18 plus
Languages:
Akan (Twi), English, Dagbani, Ewe
Fieldwork dates:
May 5 – May 31, 2014
Sample size:
1,000
Margin of Error:
±3.8 percentage points
Representative:
Adult population

11
PEW RESEARCH CENTER
www.pewresearch.org
Country:
Greece
Sample design:
Multi-stage cluster sample stratified by region and urbanity
Mode:
Face-to-face adults 18 plus
Languages:
Greek
Fieldwork dates:
March 22 – April 9, 2014
Sample size:
1,000
Margin of Error:
±3.7 percentage points
Representative:
Adult population (excluding the islands in the Aegean and Ionian Seas, or
roughly 6% of the population)
Country:
India
Sample design:
Multi-stage cluster sample stratified by region and urbanity
Mode:
Face-to-face adults 18 plus
Languages:
Hindi, Bengali, Tamil, Telugu, Marathi, Kannada, Gujarati, Odia
Fieldwork dates:
April 14 – May 1, 2014
Sample size:
2,464
Margin of Error:
±3.1 percentage points
Representative:
Adult population in 15 of the 17 most populous states (Kerala and Assam
were excluded) and the Union Territory of Delhi (roughly 91% of the
population). Disproportionately urban. The data were weighted to reflect
the actual urbanity distribution in India.
Country:
Indonesia
Sample design:
Multi-stage cluster sample stratified by province and urbanity
Mode: Face-to-face adults 18 plus
Languages:
Bahasa Indonesian
Fieldwork dates:
April 17 – May 23, 2014
Sample size:
1,000
Margin of Error:
±4.0 percentage points
Representative:
Adult population (excluding Papua and remote areas or provinces with
small populations, or 12% of the population)

12
PEW RESEARCH CENTER
www.pewresearch.org
Country:
Israel
Sample design:
Multi-stage cluster sample stratified by district, urbanity, and
socioeconomic status, with an oversample of Arabs
Mode:
Face-to-face adults 18 plus
Languages:
Hebrew, Arabic
Fieldwork dates:
April 24 – May 11, 2014
Sample size:
1,000 (597 Jews, 388 Arabs, 15 others)
Margin of Error:
±4.3 percentage points
Representative:
Adult population (The data were weighted to reflect the actual distribution
of Jews, Arabs and others in Israel.)
Country:
Italy
Sample design:
Multi-stage cluster sample stratified by region and urbanity
Mode:
Face-to-face adults 18 plus
Languages:
Italian
Fieldwork dates:
March 18 – April 7, 2014
Sample size:
1,000
Margin of Error:
±4.3 percentage points
Representative:
Adult population
Country: Japan
Sample design:
Random Digit Dial (RDD) probability sample of landline households
stratified by region and population size
Mode:
Telephone
adults 18 plus
Languages:
Japanese
Fieldwork dates:
April 10 – April 27, 2014
Sample size:
1,000
Margin of Error:
±3.2 percentage points
Representative:
Landline households (roughly 86% of all Japanese households)
Country: Jordan
Sample design:
Multi-stage cluster sample stratified by governorate and urbanity
Mode:
Face-to-face adults 18 plus
Languages:
Arabic
Fieldwork dates:
April 11 – April 29, 2014
Sample size:
1,000
Margin of Error:
±4.5 percentage points
Representative: Adult
population

13
PEW RESEARCH CENTER
www.pewresearch.org
Country: Kenya
Sample design:
Multi-stage cluster sample stratified by province and settlement size
Mode:
Face-to-face adults 18 plus
Languages:
Kiswahili,
English
Fieldwork dates:
April 18 – April 28, 2014
Sample size:
1,015
Margin of Error:
±4.0 percentage points
Representative: Adult
population
Country: Lebanon
Sample design:
Multi-stage cluster sample stratified by region and urbanity
Mode:
Face-to-face adults 18 plus
Languages:
Arabic
Fieldwork dates:
April 11 – May 2, 2014
Sample size:
1,000
Margin of Error:
±4.1 percentage points
Representative:
Adult population (excluding a small area in Beirut controlled by a militia
group and a few villages in the south of Lebanon, which border Israel and
are inaccessible to outsiders, or about 2% of the population)
Country: Malaysia
Sample design:
Multi-stage cluster sample stratified by state and urbanity
Mode:
Face-to-face adults 18 plus
Languages:
Bahasa
Malaysia, Mandarin Chinese, English
Fieldwork dates:
April 10 – May 23, 2014
Sample size:
1,010
Margin of Error:
±3.8 percentage points
Representative:
Adult population (excluding difficult to access areas in Sabah and Sarawak,
or about 7% of the population)
Country: Mexico
Sample design:
Multi-stage cluster sample stratified by region and urbanity
Mode:
Face-to-face adults 18 plus
Languages:
Spanish
Fieldwork dates:
April 21 – May 2, 2014
Sample size:
1,000
Margin of Error:
±4.0 percentage points
Representative: Adult
population

14
PEW RESEARCH CENTER
www.pewresearch.org
Country: Nicaragua
Sample design:
Multi-stage cluster sample stratified by department and urbanity
Mode:
Face-to-face adults 18 plus
Languages: Spanish
Fieldwork dates:
April 23 – May 11, 2014
Sample size:
1,008
Margin of Error:
±4.0 percentage points
Representative:
Adult population (excluding residents of gated communities and multi-story
residential buildings, or less than 1% of the population)
Country: Nigeria
Sample design:
Multi-stage cluster sample stratified by region and urbanity
Mode:
Face-to-face adults 18 plus
Languages:
English, Hausa, Yoruba, Igbo
Fieldwork dates:
April 11 – May 25, 2014
Sample size:
1,014
Margin of Error:
±4.3 percentage points
Representative:
Adult population (excluding Adamawa, Borno, Cross River, Jigawa, Yobe,
and some areas in Taraba, or roughly 12% of the population)
Country: Pakistan
Sample design:
Multi-stage cluster sample stratified by province and urbanity
Mode:
Face-to-face adults 18 plus
Languages:
Urdu,
Pashto,
Punjabi, Saraiki, Sindhi
Fieldwork dates:
April 15 – May 7, 2014
Sample size:
1,203
Margin of Error:
±4.2 percentage points
Representative:
Adult population (excluding the Federally Administered Tribal Areas,
Gilgit-Baltistan, Azad Jammu and Kashmir for security reasons, areas of
instability in Khyber Pakhtunkhwa [formerly the North-West Frontier
Province] and Baluchistan, military restricted areas and villages with less
than 100 inhabitants – together, roughly 18% of the population).
Disproportionately urban. The data were weighted to reflect the actual
urbanity distribution in Pakistan.

15
PEW RESEARCH CENTER
www.pewresearch.org
Country: Palestinian territories
Sample design:
Multi-stage cluster sample stratified by region and urban/rural/refugee
camp population
Mode:
Face-to-face adults 18 plus
Languages:
Arabic
Fieldwork dates:
April 15 – April 22, 2014
Sample size:
1,000
Margin of Error:
±4.4 percentage points
Representative:
Adult population (excluding Bedouins who regularly change residence and
some communities near Israeli settlements where military restrictions make
access difficult, or roughly 5% of the population)
Country: Peru
Sample design:
Multi-stage cluster sample stratified by region and urbanity
Mode:
Face-to-face adults 18 plus
Languages: Spanish
Fieldwork dates:
April 11 – May 2, 2014
Sample size:
1,000
Margin of Error:
±4.0 percentage points
Representative: Adult
population
Country: Philippines
Sample design:
Multi-stage cluster sample stratified by region and urbanity
Mode:
Face-to-face adults 18 plus
Languages:
Tagalog,
Cebuano,
Ilonggo, Ilocano, Bicolano
Fieldwork dates:
May 1 – May 21, 2014
Sample size:
1,008
Margin of Error:
±4.0 percentage points
Representative: Adult
population
Country:
Poland
Sample design:
Multi-stage cluster sample stratified by province and urbanity
Mode:
Face-to-face adults 18 plus
Languages:
Polish
Fieldwork dates:
March 17 – April 8, 2014
Sample size:
1,010
Margin of Error:
±3.6 percentage points
Representative:
Adult population

16
PEW RESEARCH CENTER
www.pewresearch.org
Country:
Russia
Sample design:
Multi-stage cluster sample stratified by Russia’s eight geographic regions,
plus the cities of Moscow and St. Petersburg, and by urban-rural status.
Mode:
Face-to-face adults 18 plus
Languages:
Russian
Fieldwork dates:
April 4 – April 20, 2014
Sample size:
1,000
Margin of Error:
±3.6 percentage points
Representative:
Adult population (excludes Chechen Republic, Ingush Republic and remote
territories in the Far North – together, roughly 3% of the population)
Country:
Senegal
Sample design:
Multi-stage cluster sample stratified by region and urbanity
Mode:
Face-to-face adults 18 plus
Languages:
Wolof, French
Fieldwork dates:
April 17 – May 2, 2014
Sample size:
1,000
Margin of Error:
±3.7 percentage points
Representative:
Adult population
Country:
South Africa
Sample design:
Multi-stage cluster sample stratified by metropolitan area, province and
urbanity
Mode:
Face-to-face adults 18 plus
Languages:
English, Zulu, Xhosa, South Sotho, Afrikaans, North Sotho
Fieldwork dates:
May 18 – June 5, 2014
Sample size:
1,000
Margin of Error:
±3.5 percentage points
Representative:
Adult population

17
PEW RESEARCH CENTER
www.pewresearch.org
Country:
South Korea
Sample design:
Random Digit Dial (RDD) probability sample of adults who own a cell
phone
Mode:
Telephone adults 18 plus
Languages:
Korean
Fieldwork dates:
April 17 – April 30, 2014
Sample size:
1,009
Margin of Error:
±3.2 percentage points
Representative:
Adults who own a cell phone (roughly 96% of adults age 18 and older)
Country:
Spain
Sample design:
Random Digit Dial (RDD) probability sample of landline and cell phone-
only households stratified by region
Mode:
Telephone adults 18 plus
Languages:
Spanish/Castilian
Fieldwork dates:
March 17 – March 31, 2014
Sample size:
1,009
Margin of Error:
±3.2 percentage points
Representative:
Telephone households (roughly 97% of Spanish households)
Country: Tanzania
Sample design:
Multi-stage cluster sample stratified by region and urbanity
Mode:
Face-to-face adults 18 plus
Languages: Kiswahili
Fieldwork dates:
April 18 – May 7, 2014
Sample size:
1,016
Margin of Error:
±4.0 percentage points
Representative:
Adult population (excluding Zanzibar, or about 3% of the population)
Country: Thailand
Sample design:
Multi-stage cluster sample stratified by region and urbanity
Mode:
Face-to-face adults 18 plus
Languages: Thai
Fieldwork dates:
April 23 – May 24, 2014
Sample size:
1,000
Margin of Error:
±3.9 percentage points
Representative:
Adult population (excluding the provinces of Narathiwat, Pattani, and Yala,
or about 3% of the population)

18
PEW RESEARCH CENTER
www.pewresearch.org
Country: Tunisia
Sample design:
Multi-stage cluster sample stratified by governorate and urbanity
Mode:
Face-to-face adults 18 plus
Languages:
Tunisian
Arabic
Fieldwork dates:
April 19 – May 9, 2014
Sample size:
1,000
Margin of Error:
±4.0 percentage points
Representative: Adult
population
Country: Turkey
Sample design:
Multi-stage cluster sample stratified by region, urbanity and settlement size
Mode:
Face-to-face adults 18 plus
Languages:
Turkish
Fieldwork dates:
April 11 – May 16, 2014
Sample size:
1,001
Margin of Error:
±4.5 percentage points
Representative: Adult
population
Country: Uganda
Sample design:
Multi-stage cluster sample stratified by region and urbanity
Mode:
Face-to-face adults 18 plus
Languages:
Luganda, English, Runyankole/Rukiga, Luo, Runyoro/Rutoro, Ateso,
Lugbara
Fieldwork dates:
April 25 – May 9, 2014
Sample size:
1,007
Margin of Error:
±3.9 percentage points
Representative: Adult
population

19
PEW RESEARCH CENTER
www.pewresearch.org
Country: Ukraine
Sample design: Multi-stage cluster sample stratified by Ukraine’s six regions plus ten of the
largest cities – Kyiv (Kiev), Kharkiv, Dnipropetrovsk, Odessa, Donetsk,
Zaporizhia, Lviv, Kryvyi Rih, Lugansk, and Mikolayev – as well as three
cities on the Crimean peninsula – Simferopol, Sevastopol, and Kerch.
Mode: Face-to-face adults 18 plus
Languages: Russian, Ukrainian
Fieldwork dates: April 5 – April 23, 2014
Sample size: 1,659
Margin of Error: ±3.3 percentage points
Representative: Adult population (Survey includes oversamples of Crimea and of the South,
East and Southeast regions. The data were weighted to reflect the actual
regional distribution in Ukraine.)
Country:
United Kingdom
Sample design:
Random Digit Dial (RDD) probability sample of landline households,
stratified by government office region, and cell phone-only households
Mode:
Telephone adults 18 plus
Languages:
English
Fieldwork dates:
March 17 – April 8, 2014
Sample size:
1,000
Margin of Error:
±3.4 percentage points
Representative:
Telephone households (roughly 98% of all households in the United
Kingdom)
Country:
United States
Sample design:
Random Digit Dial (RDD) probability sample of landline and cell phone
households
Mode:
Telephone adults 18 plus
Languages:
English, Spanish
Fieldwork dates:
April 22 – May 11, 2014
Sample size:
1,002
Margin of Error:
±3.5 percentage points
Representative:
Telephone households with English or Spanish speakers (roughly 96% of
U.S. households)

20
PEW RESEARCH CENTER
www.pewresearch.org
Country: Venezuela
Sample design:
Multi-stage cluster sample stratified by region and parish size
Mode:
Face-to-face adults 18 plus
Languages: Spanish
Fieldwork dates:
April 11 – May 10, 2014
Sample size:
1,000
Margin of Error:
±3.5 percentage points
Representative:
Adult population (excluding remote areas, or about 4% of population)
Country: Vietnam
Sample design:
Multi-stage cluster sample stratified by region and urbanity
Mode:
Face-to-face adults 18 plus
Languages: Vietnamese
Fieldwork dates:
April 16 – May 8, 2014
Sample size:
1,000
Margin of Error:
±4.5 percentage points
Representative: Adult
population

21
PEW RESEARCH CENTER
www.pewresearch.org
Topline Results
Pew Research Center
Spring 2014 survey
July 9, 2014 Release
Methodological notes:
Survey results are based on national samples. For further details on sample designs, see
Survey Methods section.
Due to rounding, percentages may not total 100%. The topline “total” columns show 100%,
because they are based on unrounded numbers.
Since 2007, the Global Attitudes Project has used an automated process to generate
toplines. As a result, numbers may differ slightly from those published prior to 2007.
Spring, 2011 survey in Pakistan was fielded before the death of Osama bin Laden (April 10
– April 26), while the Late Spring, 2011 survey was conducted afterwards (May 8 – May
15).
Throughout this report, trends from India in 2013 refer to a survey conducted between
December 7, 2013, and January 12, 2014 (Winter 2013-2014).
For some countries, trends for certain years are omitted due to differences in sample
design or population coverage. Omitted trends often reflect less representative samples
than more recent surveys in the same countries. Trends that are omitted include:
‐
Bangladesh prior to 2014
‐
Vietnam prior to 2014
‐
India prior to Winter 2013-2014
‐
Senegal prior to 2013
‐
Venezuela prior to 2013
‐
Brazil prior to 2010
‐
Nigeria prior to 2010
‐
South Africa in 2007
‐
Indonesia prior to 2005
‐
Pakistan in May 2003
‐
Poland in March 2003
‐
Russia in March 2003 and Fall 2002
‐
Egypt in Summer 2002

22
PEW RESEARCH CENTER
www.pewresearch.org
Not all questions included in the Spring 2014 survey are presented in this topline. Omitted
questions have either been previously released or will be released in future reports.
Q15e Please tell me if you have a very favorable, somewhat favorable, somewhat unfavorable or
very unfavorable opinion of: e. Russia
Very
favorable
Somewhat
favorable
Somewhat
unfavorable
Very
unfavorable
DK/Refused
Total
United States
Spring, 2014
Spring, 2013
Spring, 2012
Spring, 2011
Spring, 2010
Spring, 2009
Spring, 2007
France
Spring, 2014
Spring, 2013
Spring, 2012
Spring, 2011
Spring, 2010
Spring, 2009
Spring, 2007
Germany
Spring, 2014
Spring, 2013
Spring, 2012
Spring, 2011
Spring, 2010
Spring, 2009
Spring, 2007
Greece
Spring, 2014
Spring, 2013
Spring, 2012
Italy
Spring, 2014
Spring, 2013
Spring, 2012
Spring, 2007
Poland
Spring, 2014
Spring, 2013
Spring, 2012
Spring, 2011
Spring, 2010
Spring, 2009
Spring, 2007
Spain
Spring, 2014
Spring, 2013
Spring, 2012
Spring, 2011
Spring, 2010
Spring, 2009
Spring, 2007
United Kingdom
Spring, 2014
Spring, 2013
Spring, 2012
Spring, 2011
Spring, 2010
Spring, 2009
Spring, 2007
Russia
Spring, 2014
Spring, 2013
Spring, 2012
Spring, 2011
Spring, 2010
Spring, 2009
Spring, 2007
Ukraine
Spring, 2014
Spring, 2011
Spring, 2007
Summer, 2002
3
16
34
38
9
100
4
33
29
14
20
100
5
32
27
13
24
100
8
41
22
10
19
100
7
42
24
8
19
100
7
36
27
12
18
100
4
40
24
11
21
100
4
22
34
39
1
100
3
33
41
23
0
100
3
33
41
23
0
100
4
49
37
11
0
100
3
48
37
12
0
100
2
41
42
14
1
100
2
33
48
17
0
100
1
18
59
20
2
100
1
31
49
11
7
100
3
30
55
9
3
100
2
45
42
7
5
100
3
47
38
7
5
100
2
40
41
10
7
100
2
32
52
10
4
100
13
48
24
11
4
100
13
50
23
10
5
100
13
48
22
14
4
100
2
18
42
32
5
100
4
27
35
21
13
100
2
21
37
30
10
100
2
35
41
8
14
100
2
10
37
44
7
100
3
33
42
12
9
100
3
31
40
20
7
100
3
32
41
12
11
100
6
39
35
11
7
100
2
31
40
16
10
100
4
30
39
19
8
100
3
15
48
26
7
100
10
28
34
17
12
100
9
27
34
20
11
100
10
36
31
14
10
100
4
36
35
9
16
100
3
33
35
9
20
100
3
32
37
12
17
100
4
21
38
25
12
100
4
34
30
9
23
100
3
35
32
11
19
100
7
43
24
7
19
100
6
40
26
6
22
100
5
40
26
7
21
100
4
43
26
5
23
100
51
41
5
1
2
100
29
54
11
3
3
100
42
43
9
2
4
100
41
43
9
2
5
100
43
44
7
2
4
100
40
47
8
2
3
100
47
42
7
1
4
100
12
23
25
35
5
100
35
49
9
2
4
100
39
42
13
3
3
100
60
27
9
3
1
100
www.pewresearch.org
23
PEW RESEARCH CENTER
Q15e Please tell me if you have a very favorable, somewhat favorable, somewhat unfavorable or
very unfavorable opinion of: e. Russia
Very
favorable
Somewhat
favorable
Somewhat
unfavorable
Very
unfavorable
DK/Refused
Total
Turkey
Spring, 2014
Spring, 2013
Spring, 2012
Spring, 2011
Spring, 2010
Spring, 2009
Spring, 2007
Egypt
Spring, 2014
Spring, 2013
Spring, 2012
Spring, 2011
Spring, 2010
Spring, 2009
Spring, 2007
Jordan
Spring, 2014
Spring, 2013
Spring, 2012
Spring, 2011
Spring, 2010
Spring, 2009
Spring, 2007
Lebanon
Spring, 2014
Spring, 2013
Spring, 2012
Spring, 2011
Spring, 2010
Spring, 2009
Spring, 2007
Palest. ter.
Spring, 2014
Spring, 2013
Spring, 2011
Spring, 2009
Spring, 2007
Tunisia
Spring, 2014
Spring, 2013
Spring, 2012
Israel
Spring, 2014
Spring, 2013
Spring, 2011
Spring, 2009
Spring, 2007
Bangladesh
Spring, 2014
China
Spring, 2014
Spring, 2013
Spring, 2012
Spring, 2011
Spring, 2010
Spring, 2009
Spring, 2007
India
Spring, 2014
Winter 2013-2014
Indonesia
Spring, 2014
Spring, 2013
Spring, 2011
Spring, 2010
Spring, 2009
Spring, 2007
3
13
16
57
11
100
1
18
23
43
15
100
3
13
15
48
20
100
3
15
23
44
16
100
1
15
17
48
18
100
2
11
14
49
24
100
1
16
16
48
18
100
4
20
38
33
5
100
6
24
35
29
6
100
6
25
37
28
5
100
4
31
38
24
3
100
6
34
33
25
2
100
7
41
29
23
0
100
9
37
26
24
4
100
3
19
36
39
3
100
4
21
38
32
5
100
4
22
43
27
5
100
5
26
39
24
7
100
6
31
38
20
5
100
8
34
36
22
1
100
10
38
31
18
3
100
23
22
27
27
1
100
18
28
28
25
1
100
16
32
28
20
3
100
14
39
25
18
5
100
12
43
25
15
4
100
13
44
27
11
6
100
13
35
22
25
5
100
9
32
26
20
14
100
3
26
30
27
14
100
3
31
42
20
4
100
3
30
27
31
9
100
4
26
32
27
11
100
11
24
19
19
27
100
9
26
15
22
29
100
13
27
24
16
20
100
5
25
46
22
3
100
3
18
47
30
1
100
3
26
38
31
2
100
6
25
38
27
4
100
5
24
41
25
5
100
21
39
23
10
6
100
13
53
17
6
11
100
7
42
28
11
12
100
7
41
28
10
14
100
5
42
26
11
16
100
5
44
32
8
11
100
5
41
35
8
12
100
5
49
27
5
14
100
17
22
10
6
45
100
18
27
13
10
32
100
4
34
36
7
19
100
9
34
25
8
24
100
4
31
31
13
21
100
2
36
35
9
19
100
3
29
33
8
28
100
3
33
36
5
23
100
www.pewresearch.org
24
PEW RESEARCH CENTER
Q15e Please tell me if you have a very favorable, somewhat favorable, somewhat unfavorable or
very unfavorable opinion of: e. Russia
Very
favorable
Somewhat
favorable
Somewhat
unfavorable
Very
unfavorable
DK/Refused
Total
Japan
Spring, 2014
Spring, 2013
Spring, 2012
Spring, 2011
Spring, 2010
Spring, 2009
Spring, 2007
Malaysia
Spring, 2014
Spring, 2013
Spring, 2007
Pakistan
Spring, 2014
Spring, 2013
Spring, 2012
Late Spring, 2011
Spring, 2011
Spring, 2010
Spring, 2009
Spring, 2007
Philippines
Spring, 2014
Spring, 2013
South Korea
Spring, 2014
Spring, 2013
Spring, 2010
Spring, 2009
Spring, 2007
Thailand
Spring, 2014
Vietnam
Spring, 2014
Argentina
Spring, 2014
Spring, 2013
Spring, 2010
Spring, 2009
Spring, 2007
Brazil
Spring, 2014
Spring, 2013
Spring, 2012
Spring, 2011
Spring, 2010
Chile
Spring, 2014
Spring, 2013
Spring, 2007
Colombia
Spring, 2014
El Salvador
Spring, 2014
Spring, 2013
Mexico
Spring, 2014
Spring, 2013
Spring, 2012
Spring, 2011
Spring, 2010
Spring, 2009
Spring, 2007
Nicaragua
Spring, 2014
Peru
Spring, 2014
Spring, 2007
Venezuela
Spring, 2014
Spring, 2013
Ghana
Spring, 2014
Spring, 2013
Spring, 2007
1
22
50
19
7
100
1
26
53
11
10
100
2
20
53
19
6
100
1
27
48
14
10
100
1
29
48
12
10
100
1
22
50
18
9
100
2
20
50
17
11
100
2
32
30
8
28
100
5
42
16
6
31
100
3
43
22
7
25
100
1
10
11
18
61
100
6
13
11
21
49
100
4
16
14
31
35
100
1
14
12
30
42
100
2
9
15
31
43
100
2
9
16
35
40
100
1
9
17
37
36
100
4
14
18
24
40
100
7
39
29
14
11
100
2
33
36
16
12
100
1
42
43
5
8
100
3
50
31
2
14
100
1
39
35
10
15
100
1
49
32
3
15
100
2
52
26
4
17
100
8
40
23
6
23
100
38
37
11
3
11
100
3
16
23
14
45
100
3
23
20
9
45
100
2
22
20
14
41
100
3
20
19
9
48
100
1
18
19
15
47
100
1
23
48
11
17
100
2
32
41
11
14
100
2
25
34
22
16
100
2
31
33
14
21
100
1
37
34
9
19
100
4
30
32
13
21
100
5
34
29
9
23
100
8
39
25
4
24
100
7
17
16
21
38
100
7
16
14
22
42
100
2
25
21
8
43
100
4
17
22
22
36
100
4
24
25
13
35
100
5
20
17
20
37
100
1
22
32
16
29
100
4
21
18
13
45
100
6
23
22
14
36
100
5
33
25
11
26
100
21
24
11
16
28
100
5
29
26
9
30
100
5
32
19
9
35
100
11
25
20
31
13
100
14
26
19
22
20
100
13
29
17
14
27
100
15
34
19
7
26
100
16
39
19
8
18
100
www.pewresearch.org
25
PEW RESEARCH CENTER
Q15e Please tell me if you have a very favorable, somewhat favorable, somewhat unfavorable or
very unfavorable opinion of: e. Russia
Very
favorable
Somewhat
favorable
Somewhat
unfavorable
Very
unfavorable
DK/Refused
Total
Kenya
Spring, 2014
Spring, 2013
Spring, 2011
Spring, 2010
Spring, 2009
Spring, 2007
Nigeria
Spring, 2014
Spring, 2013
Spring, 2010
Senegal
Spring, 2014
Spring, 2013
South Africa
Spring, 2014
Spring, 2013
Tanzania
Spring, 2014
Spring, 2007
Uganda
Spring, 2014
Spring, 2013
Spring, 2007
16
33
24
8
19
100
17
30
20
7
26
100
8
26
26
19
20
100
16
31
31
11
11
100
10
25
21
18
25
100
17
40
26
9
8
100
15
26
12
15
32
100
7
31
15
15
32
100
18
35
19
12
16
100
14
25
18
12
31
100
17
25
14
7
37
100
5
20
26
25
24
100
6
20
25
28
20
100
16
33
15
10
26
100
20
30
11
9
30
100
12
22
16
15
35
100
10
18
12
10
50
100
10
22
14
12
42
100
Q41b Tell me how much confidence you have in each leader to do the right thing regarding world
affairs – a lot of confidence, some confidence, not too much confidence, or no confidence at all. b.
Russian President Vladimir Putin
A lot of
confidence
Some
confidence
Not too much
confidence
No confidence
at all
DK/Refused
Total
United States
Spring, 2014
Spring, 2012
Spring, 2008
Spring, 2007
Spring, 2006
May, 2003
France
Spring, 2014
Spring, 2012
Spring, 2008
Spring, 2007
Spring, 2006
May, 2003
August, 2001
Germany
Spring, 2014
Spring, 2012
Spring, 2008
Spring, 2007
Spring, 2006
May, 2003
August, 2001
Greece
Spring, 2014
Spring, 2012
Italy
Spring, 2014
Spring, 2012
Spring, 2007
May, 2003
August, 2001
Poland
Spring, 2014
Spring, 2012
Spring, 2008
Spring, 2007
3
13
27
53
5
100
4
24
29
25
18
100
2
26
22
26
25
100
2
28
25
25
21
100
3
30
26
19
22
100
2
39
28
19
13
100
4
12
26
59
0
100
2
10
31
57
0
100
1
16
30
52
1
100
2
17
36
45
0
100
2
22
33
43
1
100
5
43
27
25
1
100
2
12
39
38
9
100
3
19
33
44
1
100
4
18
39
38
2
100
7
31
31
29
2
100
5
27
37
29
2
100
5
45
29
17
4
100
24
51
18
6
1
100
4
37
31
24
4
100
9
32
31
26
2
100
7
32
29
29
3
100
2
16
40
38
4
100
2
15
38
35
10
100
2
24
36
24
14
100
5
39
35
12
8
100
3
21
36
13
28
100
1
7
29
57
4
100
3
16
37
37
8
100
1
13
38
40
7
100
0
7
37
44
12
100
www.pewresearch.org
26
PEW RESEARCH CENTER
Q41b Tell me how much confidence you have in each leader to do the right thing regarding world
affairs – a lot of confidence, some confidence, not too much confidence, or no confidence at all. b.
Russian President Vladimir Putin
A lot of
confidence
Some
confidence
Not too much
confidence
No confidence
at all
DK/Refused
Total
Spain
Spring, 2014
Spring, 2012
Spring, 2008
Spring, 2007
Spring, 2006
May, 2003
United Kingdom
Spring, 2014
Spring, 2012
Spring, 2008
Spring, 2007
Spring, 2006
May, 2003
August, 2001
Russia
Spring, 2014
Spring, 2012
Spring, 2011
Spring, 2010
Spring, 2009
Spring, 2008
Spring, 2007
Spring, 2006
May, 2003
Ukraine
Spring, 2014
Spring, 2007
Turkey
Spring, 2014
Spring, 2012
Spring, 2008
Spring, 2007
Spring, 2006
Egypt
Spring, 2014
Spring, 2012
Spring, 2008
Spring, 2007
Spring, 2006
Jordan
Spring, 2014
Spring, 2012
Spring, 2008
Spring, 2007
Spring, 2006
Lebanon
Spring, 2014
Spring, 2012
Spring, 2008
Spring, 2007
Palest. ter.
Spring, 2014
Spring, 2007
Tunisia
Spring, 2014
Spring, 2012
Israel
Spring, 2014
Spring, 2007
May, 2003
Bangladesh
Spring, 2014
China
Spring, 2014
Spring, 2012
Spring, 2008
Spring, 2007
Spring, 2006
India
Spring, 2014
1
6
29
58
5
100
2
8
42
45
4
100
1
9
32
48
11
100
2
5
33
43
17
100
1
9
31
46
13
100
5
26
24
33
13
100
5
15
32
40
7
100
3
18
34
36
9
100
3
25
24
32
16
100
3
34
26
21
16
100
3
30
27
24
16
100
10
43
23
13
10
100
1
25
35
22
17
100
52
31
11
3
3
100
37
32
16
8
7
100
36
39
14
5
6
100
45
32
12
4
7
100
39
42
11
3
4
100
53
30
10
3
4
100
46
38
8
2
6
100
27
48
13
4
8
100
28
48
19
3
1
100
12
11
16
57
5
100
24
32
21
12
10
100
4
7
19
56
14
100
3
11
15
55
15
100
2
7
8
62
21
100
1
9
11
60
20
100
1
8
6
62
22
100
3
9
35
48
6
100
5
10
40
35
10
100
2
14
41
33
10
100
1
17
42
28
12
100
1
18
47
25
9
100
1
12
38
41
7
100
2
15
37
35
12
100
1
16
36
36
11
100
1
19
32
32
17
100
2
12
45
33
8
100
25
17
17
39
2
100
6
27
28
35
4
100
7
30
27
32
4
100
7
26
28
33
6
100
5
16
25
34
20
100
2
14
22
49
12
100
6
15
14
34
31
100
3
14
16
35
32
100
7
21
37
34
1
100
2
15
34
41
8
100
10
27
27
28
8
100
21
40
22
7
10
100
17
45
18
5
15
100
13
37
20
9
21
100
9
37
18
8
28
100
11
47
19
4
19
100
13
37
16
2
32
100
9
15
10
6
60
100
www.pewresearch.org
27
PEW RESEARCH CENTER
Q41b Tell me how much confidence you have in each leader to do the right thing regarding world
affairs – a lot of confidence, some confidence, not too much confidence, or no confidence at all. b.
Russian President Vladimir Putin
A lot of
confidence
Some
confidence
Not too much
confidence
No confidence
at all
DK/Refused
Total
Indonesia
Spring, 2014
Spring, 2008
Spring, 2007
Spring, 2006
Japan
Spring, 2014
Spring, 2012
Spring, 2008
Spring, 2007
Spring, 2006
Malaysia
Spring, 2014
Spring, 2007
Pakistan
Spring, 2014
Spring, 2012
Spring, 2008
Spring, 2007
Spring, 2006
Philippines
Spring, 2014
South Korea
Spring, 2014
Spring, 2008
Spring, 2007
May, 2003
Thailand
Spring, 2014
Vietnam
Spring, 2014
Argentina
Spring, 2014
Spring, 2008
Spring, 2007
Brazil
Spring, 2014
Spring, 2012
Chile
Spring, 2014
Spring, 2007
Colombia
Spring, 2014
El Salvador
Spring, 2014
Mexico
Spring, 2014
Spring, 2012
Spring, 2008
Spring, 2007
Nicaragua
Spring, 2014
Peru
Spring, 2014
Spring, 2007
Venezuela
Spring, 2014
Ghana
Spring, 2014
Spring, 2007
Kenya
Spring, 2014
Spring, 2007
Nigeria
Spring, 2014
Senegal
Spring, 2014
South Africa
Spring, 2014
Spring, 2008
Tanzania
Spring, 2014
Spring, 2008
Spring, 2007
Uganda
Spring, 2014
Spring, 2007
5
23
35
9
28
100
1
17
25
12
45
100
1
21
37
10
31
100
2
19
29
11
38
100
1
19
52
20
7
100
2
25
47
21
6
100
3
25
41
21
10
100
1
18
46
22
14
100
2
38
44
11
5
100
7
25
25
10
33
100
3
19
22
14
43
100
1
5
10
22
62
100
0
3
8
27
62
100
1
4
7
35
53
100
1
5
12
45
38
100
1
6
11
30
51
100
6
32
24
13
26
100
3
29
47
13
7
100
1
26
40
6
26
100
0
24
44
7
25
100
3
34
39
8
16
100
4
27
30
8
31
100
33
36
7
2
21
100
1
9
20
29
41
100
1
6
13
38
43
100
0
5
13
31
51
100
1
11
37
32
18
100
2
17
28
28
25
100
2
16
31
23
28
100
3
17
26
21
33
100
4
10
20
21
46
100
7
17
14
25
37
100
2
11
19
34
34
100
2
14
22
23
39
100
3
7
21
31
39
100
5
18
21
27
29
100
8
20
18
31
23
100
2
15
22
21
39
100
1
15
22
24
38
100
4
13
27
43
13
100
11
26
12
12
39
100
14
37
20
7
22
100
21
29
17
11
22
100
11
39
27
9
14
100
8
22
14
16
40
100
7
16
19
17
41
100
6
17
19
19
38
100
3
13
12
15
57
100
16
36
21
6
21
100
14
27
15
9
35
100
13
29
13
13
32
100
9
21
12
18
40
100
3
15
18
12
51
100
www.pewresearch.org
28
PEW RESEARCH CENTER
Q109d Do you think the government of ____ respects the
personal freedoms of its people, or don’t you think so? d. Russia
Yes - respects
personal
freedoms
No – does not
respect
personal
freedoms
DK/Refused
Total
United States
Spring, 2014
Spring, 2008
France
Spring, 2014
Spring, 2008
Germany
Spring, 2014
Spring, 2008
Greece
Spring, 2014
Italy
Spring, 2014
Poland
Spring, 2014
Spring, 2008
Spain
Spring, 2014
Spring, 2008
United Kingdom
Spring, 2014
Spring, 2008
Russia
Spring, 2014
Spring, 2008
Ukraine
Spring, 2014
Turkey
Spring, 2014
Spring, 2008
Egypt
Spring, 2014
Spring, 2008
Jordan
Spring, 2014
Spring, 2008
Lebanon
Spring, 2014
Spring, 2008
Palest. ter.
Spring, 2014
Tunisia
Spring, 2014
Israel
Spring, 2014
Bangladesh
Spring, 2014
China
Spring, 2014
Spring, 2008
India
Spring, 2014
Indonesia
Spring, 2014
Spring, 2008
Japan
Spring, 2014
Spring, 2008
Malaysia
Spring, 2014
Pakistan
Spring, 2014
Spring, 2008
Philippines
Spring, 2014
South Korea
Spring, 2014
Spring, 2008
Thailand
Spring, 2014
Vietnam
Spring, 2014
Argentina
Spring, 2014
Spring, 2008
Brazil
Spring, 2014
Chile
Spring, 2014
Colombia
Spring, 2014
El Salvador
Spring, 2014
Mexico
Spring, 2014
Spring, 2008
Nicaragua
Spring, 2014
10
81
8
100
23
59
19
100
13
86
1
100
14
86
0
100
8
89
3
100
16
80
5
100
40
53
7
100
15
72
13
100
11
80
9
100
12
79
9
100
11
80
9
100
17
64
18
100
12
76
12
100
18
64
18
100
57
32
11
100
45
44
12
100
24
60
16
100
38
40
22
100
37
27
36
100
25
60
15
100
28
57
15
100
47
40
13
100
27
60
13
100
51
41
8
100
38
52
10
100
55
27
18
100
46
26
27
100
28
59
13
100
57
30
13
100
63
14
23
100
52
17
31
100
30
15
55
100
35
36
29
100
32
31
38
100
16
70
14
100
22
63
15
100
31
28
41
100
24
12
64
100
33
13
54
100
49
26
25
100
32
55
12
100
28
52
20
100
37
29
35
100
76
7
16
100
14
32
54
100
22
31
46
100
23
57
20
100
16
49
35
100
14
37
49
100
17
32
51
100
18
38
44
100
28
38
34
100
27
39
34
100
www.pewresearch.org
29
PEW RESEARCH CENTER
Q109d Do you think the government of ____ respects the
personal freedoms of its people, or don’t you think so? d. Russia
Yes - respects
personal
freedoms
No – does not
respect
personal
freedoms
DK/Refused
Total
Peru
Spring, 2014
Venezuela
Spring, 2014
Ghana
Spring, 2014
Kenya
Spring, 2014
Nigeria
Spring, 2014
Senegal
Spring, 2014
South Africa
Spring, 2014
Spring, 2008
Tanzania
Spring, 2014
Spring, 2008
Uganda
Spring, 2014
22
39
40
100
28
40
32
100
49
18
34
100
49
24
28
100
34
15
51
100
26
21
53
100
21
35
44
100
28
25
48
100
37
27
36
100
50
22
28
100
40
14
45
100
www.pewresearch.org
30
PEW RESEARCH CENTER
Wyszukiwarka
Podobne podstrony:
Przepisownia Bułki wrocławskie poznańskie 2014 07 09
eco-sciaga, wains knsia 07-09, Ekonomia
ekonomia do 2 kolokwium, wains knsia 07-09, Ekonomia
dziecko 2014 07
2014 vol 09 UE i FR PORÓWNANIE SKUTECZNOŚCI PROWADZENIA POLITYKI BEZPIECZEŃSTWA ENERGETYCZNEGO [NABU
Mechanika budowli I egzamin (03 07 09)(2)
2014 vol 09 RYNEK ENERGII ELEKTRYCZNEJ LITWY A BEZPIECZEŃSTWO ENERGETYCZNE
Prez 07 09 45
DGP 2014 07 28 rachunkowosc i audyt
DGP 2014 07 28 podatki i ksiegowosc
DGP 2014 07 31 ubezpieczenia i swiadczenia
2002 07 09
HARMONOGRAM NZ semestr letni 2013 2014 07 01 2014
DGP 2014 07 14 rachunkowosc i audyt
DGP 2014 07 29 firma i prawo
DGP 2014 06 09 rachunkowosc i audyt
DGP 2014 07 07 rachunkowosc i audyt
Tekst nr. 9 opracowanie (rzadzenie i rozkazywanie - woroniecki), wains knsia 07-09, Etyka
więcej podobnych podstron