
Solar Energy Vol. 65, No. 3, pp. 143–157, 1999
1999 Elsevier Science Ltd
Pergamon
P I I : S 0 0 3 8 – 0 9 2 X ( 9 8 ) 0 0 1 3 9 – X
All rights reserved. Printed in Great Britain
0038-092X / 99 / $ - see front matter
DESIGN OF HYBRID-PHOTOVOLTAIC POWER GENERATOR, WITH
OPTIMIZATION OF ENERGY MANAGEMENT
†
M. MUSELLI , G. NOTTON and A. LOUCHE
´
`
Universite de Corse-URA CNRS 2053, Centre de Recherches Energie et Systemes, Route des Sanguinaires,
F-20 000 Ajaccio, France
Received 26 February 1998; revised version accepted 14 October 1998
Communicated by ROBERT HILL
Abstract—A methodology is developed for calculating the correct size of a photovoltaic (PV)-hybrid system
and for optimizing its management. The power for the hybrid system comes from PV panels and an
engine-generator – that is, a gasoline or diesel engine driving an electrical generator. The combined system is a
stand-alone or autonomous system, in the sense that no third energy source is brought in to meet the load. Two
parameters were used to characterize the role of the engine-generator: denoted SDM and SAR, they are,
respectively, the battery charge threshold at which it is started up, and the storage capacity threshold at which
it is stopped, both expressed as a percentage of the nominal battery storage capacity. The methodology
developed is applied to designing a PV-hybrid system operating in Corsica, as a case study. Various sizing
configurations were simulated, and the optimal configuration that meets the autonomy constraint (no loss of
load) was determined, by minimizing of the energy cost. The influence of the battery storage capacity on the
solar contribution is also studied. The smallest energy cost per kWh was obtained for a system characterized by
an SDM 5 30% and an SAR 5 70%. A study on the effects of component lifetimes on the economics of
PV-hybrid and PV stand-alone systems has shown that battery size can be reduced by a factor of two in
PV-hybrid systems, as compared to PV stand-alone systems.
1999 Elsevier Science Ltd. All rights
reserved.
1. INTRODUCTION
the physical, technical and economical hypothesis,
in Section 2, in which the detailed sizing meth-
As opposed to the PV-only system, the PV-hybrid
odology is also explained. Section 3 examines the
system – consisting of a photovoltaic system
effect of the battery storage capacity on the solar
backed-up by an engine-generator set – has
contribution
and
the
effect
of
the
engine-
greater reliability for electricity production, and it
generator’s operating strategy on the energy costs.
often represents the best solution for electrifying
Finally, an economic study is reported that com-
remote areas (van Dijk, 1996). The engine-
pares the roles of the various subsystems in
generator set (or simply engine-generator) reduces
determining the lifetime of the total system.
the PV component size, while the PV system
decreases the operating time of the generator,
reducing its fuel consumption, O&M, and replace-
2. SIZING METHODOLOGY
ment costs. This study’s primary objectives have
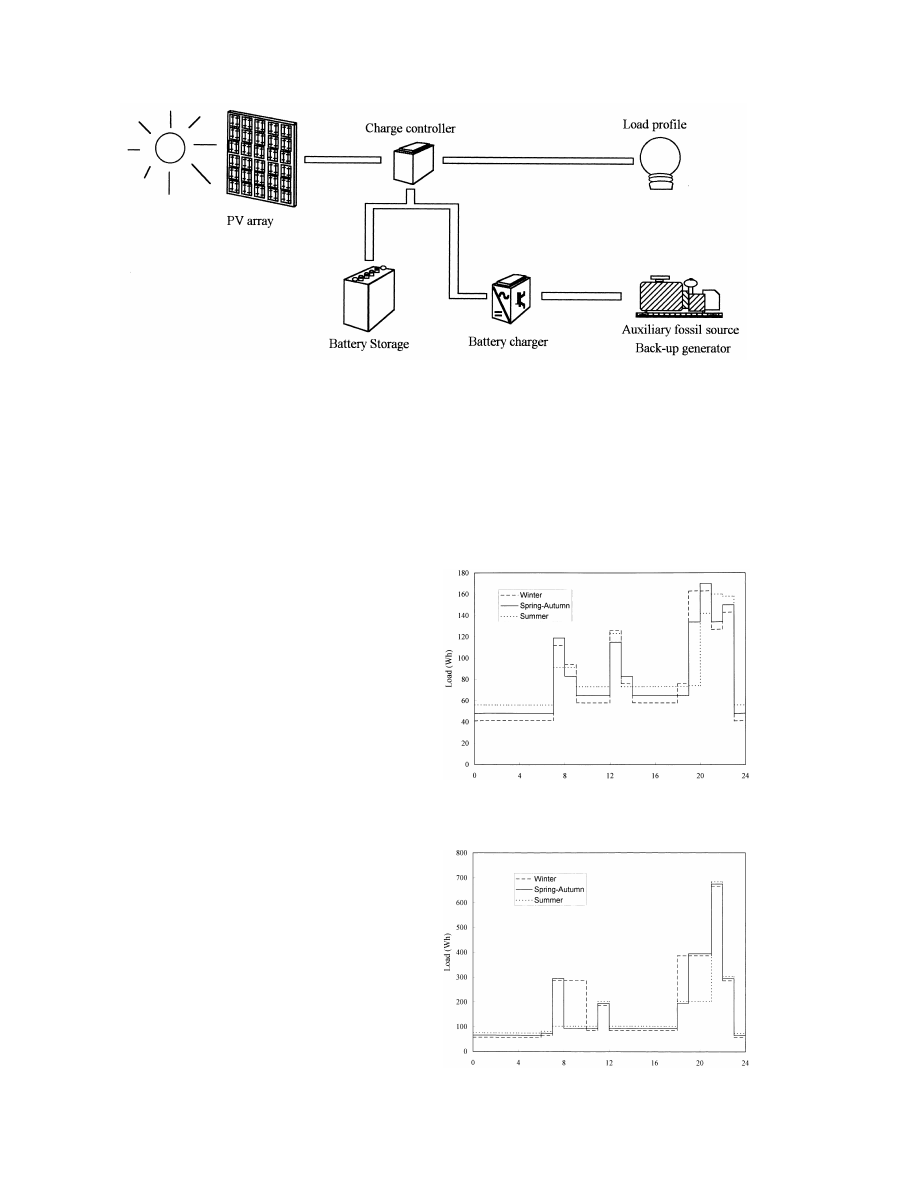
2.1. System configuration
been (i) to develop a sizing methodology for
PV-hybrid systems that supply small and medium
The system (Fig. 1) consists of a PV array, a
power levels to remote areas, and (ii) to study the
battery bank, a back-up generator (3000 rpm or
influence of load profiles and of certain engine-
1500 rpm) driven by a gasoline- or diesel-engine,
generator parameters, such as their type, starting
a charge controller, and an AC / DC converter.
threshold, and stopping threshold. A case study of
The engine-generator will be used only as a
the approach developed is performed for Ajaccio,
battery charger (this reduces its required rated
Corsica (418559N, 88399E).
power), and so its rated power is directly linked to
A brief description of the overall sizing meth-
the nominal battery capacity, C
.
max
odology is presented in Section 1. The paper gives
2.2. Description of the sizing method
The system must be autonomous, i.e. the load
must be totally met by the system at all times.
†Author to whom correspondence should be addressed. Tel.:
Such a constraint still permits an infinite number
133-4-9552-4141;
fax:
133-4-9552-41
2;
e-mail:
muselli@vignola.univ-corse.fr
of possible system configurations. From solar
143
144
M. Muselli et al.
Fig. 1. Sketch of the PV-hybrid system studied.
radiation data and from assumed daily load pro-
and have a higher price than conventional
files, the system behavior can be simulated, and a
appliances.
system meeting the constraints can be sized.
In our study, two possible hourly DC-load profiles
However, finding the best system must be done on
have been chosen to represent the load. The first,
the basis of an overall systems approach. First,
the ‘Low Consumption’ profile (Fig. 2), is based
certain physical and technical constraints are used
on ‘adapted’ loads. It has a mean daily energy
to reduce the system parameters to a realistic
consumption of 1.8 kWh per day and a peak
domain. Then minimizing the energy cost leads to
the optimal solution.
3. OPERATING AND DESIGN SIMULATIONS
3.1. Solar irradiation and load profiles
The sizing of PV-hybrid systems for Ajaccio
will be based on 19 years of hourly total irradia-
tion on a horizontal plane, collected at the site.
The PV modules will be tilted, and so hourly total
irradiation on tilted planes had to be computed,
and this was done using the models of Hay and
Davies (1980); Orgill and Hollands (1977). The
resulting errors (RMBE 5 1.4% and RRMSE 5
Fig. 2. ‘Low Consumption’ load profile used in the study.
7% for Hay and Davies model; RMBE 5 2
2.41% and RRMSE 5 8.81% for the Orgill and
Hollands model) have been shown to be quite
small (Poggi, 1995) for the site. In this way,
hourly values of solar irradiation, I (t), on the PV
b
array were calculated for a tilt angle of 308, and
this data provided the input data of the simula-
tions.
Two different types of load can be identified:
1. That provided by ‘conventional’ appliances
available on the market that typically have a
low energy efficiency and have been optimized
not from an energy point of view, but rather
from a quality–price point of view;
2. That provided by ‘adapted’ or ‘high efficiency’
appliances that are rather scarce on the market
Fig. 3. ‘Standard’ load profile used in the study.
Design of hybrid-photovoltaic power generator, with optimization of energy management
145
power demand of 170 W, which occurs in spring
and for these supports, the average price falls to
and autumn. The second, the ‘Standard’ profile
$US 0.83 / Wp (0.69 ECU / Wp).
(Fig. 3), is based on the French utility data
Battery bank: The battery bank can be char-
(EDF), as reported by Eliot (1982). It has a daily
acterized by its nominal capacity C
, its (maxi-
max
average load of 3.7 kWh per day and a peak
mum) depth of discharge DOD, taken in this study
power of 680 W, the latter occurring in the
to be 70% (Tsuda et al., 1994), and two conver-
summer. For each profile, the consumption is
sion efficiencies r
and r
, respectively, for
ch
dch
represented by a sequence of powers P (t), each
charge and discharge, which were taken to equal
c
taken as constant over the simulation time-step,
to 85% (Oldham France, 1992; Manninen and
Dt, which is normally taken as 1 h.
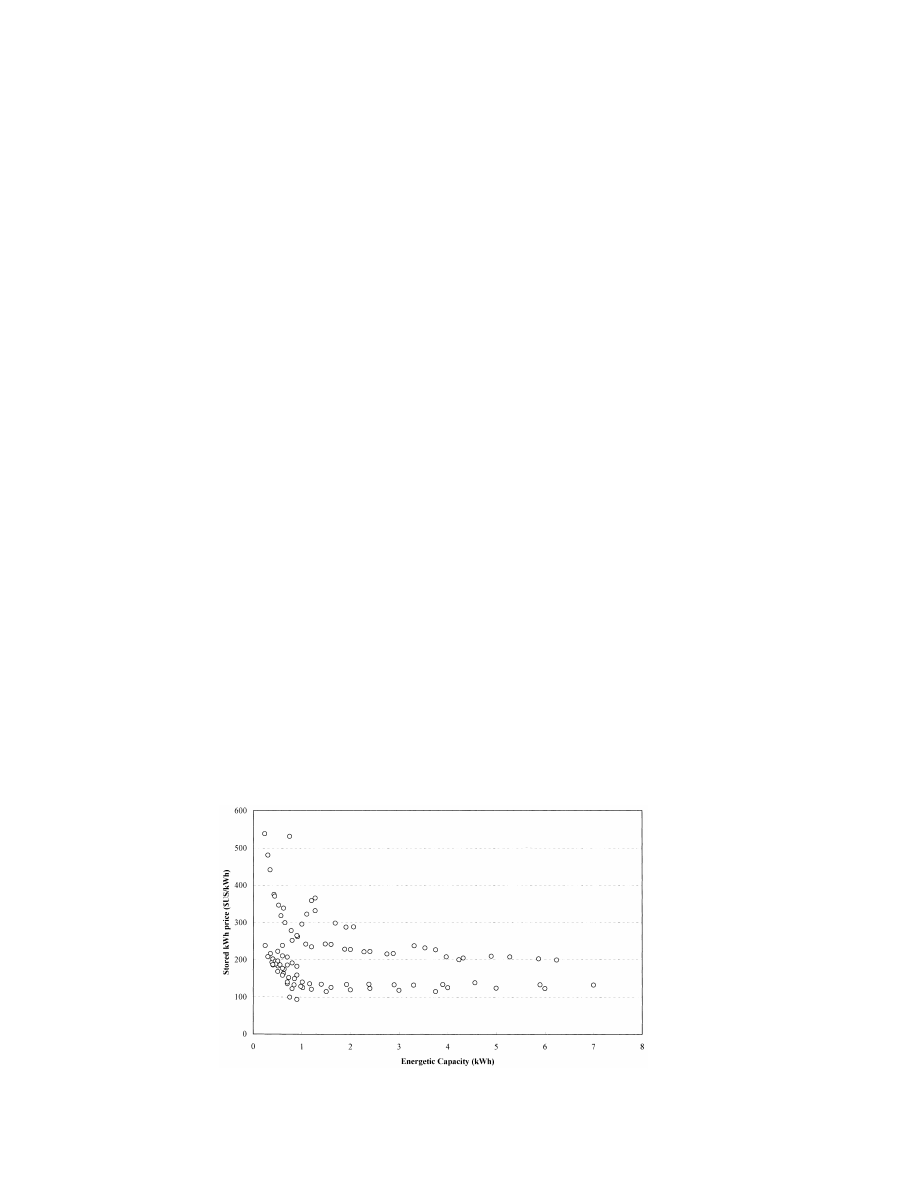
Lund, 1989). The cost of the battery is quite
significant, because the initial investment is high
and the battery has to be replaced several times
3.2. System characteristics
during the PV system lifetime. The battery bank
3.2.1. Photovoltaic subsystem. PV modules:
typically accounts for about 40% of the total
For the PV subsystem, we assume a constant PV
system cost (Notton et al., 1996a). Costs of
efficiency h
of 10%. The PV power production
batteries per kilowatt-hour stored capacity are
PV
P (t) is then computed as the product of the PV
plotted in Fig. 4, for the various battery types
p
efficiency, the hourly irradiation I (t) and the PV
marketed by several French suppliers. The battery
b
module area, as has been proposed by several
cost is strongly affected by its type; in particular,
works (Iskander and Scerri, 1996). The ‘peak-
whether it is the stationary type used in many PV
Watt’ (or ‘Wp’) price was used as a fixed econ-
applications or the starter type more readily
omic parameter, as has been done by several
available in developing countries. Frequently-en-
authors (Keller and Afolter, 1995; Biermann et
countered are costs of $US 130 / kWh and $US
al., 1995). It was set equal to $US 5.8 / Wp (5
217 / kWh (110 and 183 ECU / kWh). Thus, an
ECU / Wp), in accordance with the prices of the
average price of $US 180 / kWh (150 ECU / kWh)
French producer PHOTOWATT and others sup-
may be used for estimating the battery cost. The
pliers.
battery lifetime is linked to physical parameters,
Module supports: A literature survey shows
such as the charge–discharge rate, temperature
that the costs of module supports are in the range
and maximum discharge; it is very difficult to
$US 0.35 / Wp (0.28 ECU / Wp) to $US 1.9 / Wp
correlate the lifetime with these parameters. Based
(1.5 ECU / Wp) (Imamura et al., 1992; Palz and
on our own experiences, a battery lifetime equal
Schmid, 1990). Using data collected from four
to five years has been considered in this work.
PV suppliers (Wind and Sun, Eurosolare, Photo-
Charge controller: Regulator costs vary widely.
watt, Siemens), support costs per Wp versus the
Not all regulators work on the same electronic
number of modules per frame are equal to $US
principle, and they can include special options,
1.63 / Wp (1.28 ECU / Wp). However, generally
such as lightning protection, digital displays, etc.
PV frames are used with four modules or more,
We estimated the average price to be $US 0.65 /
Fig. 4. Price of battery storage as a function of the nominal battery storage capacity.

146
M. Muselli et al.
Wp (0.55 ECU / Wp) (Iskander and Scerri, 1996),
where P
and Q are the generator power (kW)
G
v
0
0
which is close to the GTZ value (Biermann et al.,
and the hourly consumption (l / h), P
and Q are
G
v
1995), and we based our model on this price.
respectively the rated power and the consumption
Photovoltaic subsystem installation cost: There
at this rated power, and PCI is the heating value
v
21
is considerable experience in the installation of
of the fuel (PCI
510.08 kWh?l
and
v / diesel
21
small PV systems. In some PV-system projects in
PCI
59.43 kWh?l
).
v / gasoline
0
0
Corsica, the installation cost was 25% of the PV
The ratio Q /P
is the specific consumption,
v
G
panel cost, and this is in agreement with some
defined as the fuel consumption required to
references (Illiceto et al., 1994; Paish et al., 1994;
produce, at nominal power, one kilowatt-hour of
Abenavoli, 1991). Thus this percentage was used
energy. Using a power law model for the con-
for the present study.
sumption at rated power of gasoline engines we
Photovoltaic subsystem O&M cost: Concerning
have:
the maintenance of the PV subsystem, we have
20.2954
0
0
Q 5 0.7368.P
(3)
considered an annual O&M equal to 2% of the
v
G
PV system investment, and a PV system lifetime
and assuming a constant value of 0.3 l / kWh
of 20 years (Notton et al., 1998).
(Thabor, 1988; Calloway, 1986) for diesel en-
3.2.2. Engine-generator
subsystem.
Engine-
gines, allows the determination of the reduced
generators may be compared using many different
consumption versus reduced power:
characteristics, including fuel consumption, motor
speed, continuous or periodic output, load factor,
Q
P
v
G
]
]
2 for diesel generators:
5 0.22 1 0.78
0
0
and noise level, etc. The higher the engine speed,
Q
P
v
G
the faster the wear of the parts and the shorter the
(4)
lifetime; thus, a 3000 or 3600-rpm engine can
only be used for a short time whereas a 1500 or
Q
v
]
2 for gasoline generators:
5
1800-rpm engine can be used continuously. One
0
Q
v
must also compare gasoline engines with 1500
P
10.2954
10.2954
and 3000-rpm diesel engines. In this study, just
G
0
0
]
f
1 2 0.576P
g
1 0.576P
(5)
G
G
0
two parameters, ‘SDM’ and ‘SAR’ are used as
P
G
indices of the engine-generator‘s role, at least so
As an example, g 50.22 and j 50.78 for all diesel
far as the simulations are concerned. SDM and
generators, and g 50.29 and j 50.71 for a 2-kW
SAR are the thresholds in battery charge at which
gasoline engine. We note the presence of a
the engine-generator is switched on or off, respec-
consumption at zero load: 20% and 30% of the
tively, each expressed as a fraction of the battery
full
load
for
diesel
and
gasoline
back-up
capacity.
generators. These results are in agreement with
Fuel consumption: A back-up generator is
recent works (Beyer et al., 1995a).
characterized by its efficiency h and its consump-
c
By using data collected from back-up generator
tion in relation to the produced electrical power as
manufacturers, we have computed the efficiencies
follows:
for each type of generator, and summarize these
P
G
results in Table 1.
]]]
h 5
(1)
c
PCI Q
Engine-generator price: The engine price de-
v
v
pends on nominal power, the price per unit kW,
Q
P
v
G
tending to decrease with increasing nominal
]
]
5
g 1 j
0
0
Q
P
power. To represent this scale effect, a power law
v
G
has been used:
0
0
P
P
P
G
G
G
]]]]
]]]]
]
0
2
a
5 1 2
1
F
G F
G
0
0
0
C 5 C (P )
(6)
G
0
G
h .PCI .Q
h .PCI .Q
P
c
v
v
c
v
v
G
(2)
where C
is the cost per kW of engine-generator
G
0
Table 1. Nominal engine generator efficiencies (h )
c
Minimum
Maximum
Standard
Average
value (%)
value (%)
deviation (%)
value (%)
Gasoline
16.5
30.9
3.4
21.1
Diesel 3000 rpm
29.8
44.6
4.8
35.3
Diesel 1500 rpm
22.3
40.2
3.2
29.9

Design of hybrid-photovoltaic power generator, with optimization of energy management
147
Table 2. Statistical coefficients for the prices of back-up generators (Eq. (6))
MBE
RMSE
RMBE
RRMSE
Type
C
a
($US / kW)
($US / kW)
(%)
(%)
0
Gasoline
718.1
20.585
226.3
180.3
5.4
23.2
Diesel 3000 rpm
704.1
20.2626
210.8
100.6
2.3
22.0
Diesel 1500 rpm
3362.2
20.7184
212.3
145.8
1.5
17.2
capacity, C the cost coefficient, and a the scale
way, 1986; Cramer et al., 1990; Energie Relais,
0
factor. The coefficients in this equation, obtained
1995;
Sandia
National
Laboratories,
1990;
by fits to data provided by French suppliers, are
Energelec, 1995) are very different; we used a
presented in Table 2.
lifetime of 6000 h and 10 000 h for diesel 3000-
Components of the engine-generator: We have
rpm and 1500-rpm engine generators respectively.
allowed for a fuel storage tank, at a price of $US
Engine-generator installation cost: According to
1.7 / l (1.43 ECU / l), in accordance with literature
Paish et al. (1994); Calloway (1986), the engine-
from the French manufacturer GENELEC. The
generator installation cost is equal to 10% of the
storage capacity is taken to be the equivalent of
initial investment for the engine-generator. This
20 h of continuous engine-generator operation (in
includes bedding, exhaust, and automatic control
fact the engine runs for only a few hours a day, on
costs.
average).
Engine generator subsystem O&M cost: While
The fuel price is strongly dependent on the
the installation cost of an engine-generator system
energy policy of the country. A study (Hille and
is relatively low, the annual O&M cost is rela-
Dienhart, 1992) illustrated the diversity of fuel
tively high. It is often estimated as being propor-
prices. Prices range from $US 0.02 / l (0.016
tional to the total hardware cost (Biermann et al.,
ECU / l) to $US 0.75 / l (0.63 ECU / l), the last
1995; Paish et al., 1994; EGAT, 1990). The
figure representing that in developing countries.
proportionality constant ranges from 5% to 20%.
Transport costs can increase the fuel price by $US
However, such an hypothesis must be considered
0.12–$US 0.23 / l (0.1 ECU–0.19 ECU / l) for
prudently, because the more an engine-generator
each 1000 kilometers of distance the fuel must be
runs, the more costly is its annual maintenance;
moved by ground transport, and this is increased
thus, it is good to take into account the annual
by a factor of nearly 40, if air transport is used.
operating
time
of
the
engine-generator
We have considered a price of $US 0.55 / l (0.46
(Abenavoli, 1991; Calloway, 1986). Recently,
ECU / l) and $US 1.15 / l (0.97 ECU / l) for diesel
some authors have calculated the maintenance
and gasoline fuels, respectively.
cost as a fixed cost per kWh, thus linking it to the
Engine generator lifetime: The engine-genera-
operating time (Benyahia, 1989).
tor lifetime is expressed as a function of the
Faced with all these various assumptions in the
operating hours. Table 3 summarizes the predic-
literature, we estimated the O&M cost based on
tions available in the literature. For gasoline
the cost and occurrence of various maintenance
engines, in accordance with the great majority of
operations; thereby, the O&M cost (including oil
authors (Sandia National Laboratories, 1990;
changes) is linked to the operating time. Our
Energelec, 1995), we have used the mean value of
assumptions are (i) that oil (costing 4.49 $US (3.8
the range, which is an engine lifetime equals to
ECU) per l) is replaced every 100 h for all
3500 h. For diesel engines, the 1500-rpm diesel
gasoline and all 3000-rpm diesel engines, and
lifetime is greater than the 3000-rpm diesel life-
every 150 h for all 1500-rpm diesel engines; (ii)
time, because of the reduced rotational speed of
that skilled laborer costs are $US 21.8 / h (18.5
the generator. The literature predictions (Callo-
ECU / h); (iii) that each oil change, complete with
Table 3. Back-up generator lifetime in hours (literature)
References
Type
Operating hours
Abenavoli (1991)
Gasoline
15 000
Calloway (1986)
Diesel
5000
Beyer et al. (1995a)
Diesel
30 000
Energie Relais (1995)
Diesel
1200
Sandia National Laboratories (1990)
Gasoline
2000 to 5000
Sandia National Laboratories (1990)
Diesel
6000
Energelec (1995)
Gasoline
1800
Energelec (1995)
Diesel 3000
8000
Energelec (1995)
Diesel 1500
12 000

148
M. Muselli et al.
an air-filter cleaning, requires 40 min of skilled
consumed energy L
(T) over the same period.
labour, (14.80 $US or 12.5 ECU); (iv) that the oil
Thus
filter (costing 9.10 $US or 7.7 ECU) is replaced
T
after every two oil changes; (v) that the air-filter
L(T ) 5
O
P (t).dt 5h
.S
.H (T )
(11)
c
PV
Ref
b
(10.9 $US or 9.2 ECU), and the fuel filter (5.4
$US or 4.6 ECU for gasoline and 10.9 $US or 9.2
where H (T ) is the global daily irradiation inci-
b
ECU for diesel engine) and the spark plugs (4.6
dent on PV modules inclined with an angle b and
$US or 3.9 ECU for gasoline engine) are changed
the summation is taken over all the days in the
after four oil changes. Each of these operations
period T. We then define the dimensionless PV
take 2 h (43.7 $US or 37 ECU). Accordingly, the
area S
as the ratio of the actual module area to
Dim
O&M costs (in ECU / h) are to be computed from
the reference area S
.
Ref
the following equations:
We also define a dimensionless storage capacity
(i) for gasoline engines, C
5
(0.4005
C, which is expressed in terms of days of
O
& M
autonomy. C is obtained by dividing the actual
1 0.1532.P
) 3 15.2 1 120.1
/ 400
(7)
gene
storage capacity by the annual mean of the daily
load consumption:
(ii) for 3000 rpm diesel engines, C
O
& M
C
5
(0.747 1 0.1184.P
) 3 15.2 1 120.8
/ 400
max
gene
]]
C 5
(12)
¯
L
daily
(8)
3.4. PV-hybrid system behavior. Simulation
(iii) for 1500 rpm diesel engines, C
O
& M
calculations
5
(0.242 1 0.3505.P
) 3 15.2 1 120.8
/ 600
gene
The system simulation is performed by consid-
(9)
ering a Loss of Load Probability equal to 0%; in
other words, the system reliability is 100%,
Notton et al. (1997) have shown that the above
leading to autonomy for the system.
costing hypothesis is consistent with the findings
Given the values of irradiation on tilted planes
of several earlier studies.
and the consumption patterns previously de-
Battery charger: The nominal power of the
scribed, the system behavior can be simulated
battery charger is related to its nominal storage
using an hourly time step-several workers (Man-
capacity. One must take into account that the
ninen and Lund, 1989; Beyer et al., 1995b)
electrical current produced by the generator must
having shown that the simulation of PV systems
not be greater than one fifth of the ampere-hour
requires only an hourly series of solar data. Based
capacity of the battery (Sandia National Lab-
on a system energy balance and on the storage
oratories, 1990):
continuity equation, the simulation method used
C
max
0
here is similar to that used by others (Sidrach de
]]
P
5
(10)
charger
5
Cardona and Mora Lopez, 1992; Kaye, 1994).
Considering the battery charger output power
A battery charger’s efficiency h
is equal to
charger
P
(t), the PV output power P (t) and the load
90% according to the manufacturers MASTER-
charger
p
power P (t) on the simulation step Dt, the battery
VOLT and PRIMAX. For its cost, a power law
c
energy benefit during a charge time Dt is given
relationship was used. The different parameters
1
by (Dt ,Dt):
and the statistical errors associated are as follows:
1
C 51099, a 5 20.691, MBE5 2113 $US / kW,
0
RMSE5418
$US / kW,
RMBE5 20.5%
and
C (t) 5 r
E
[P (t) 1 P
(t) 2 P (t)] dt
(13)
RRMSE519%.
1
ch
p
charger
c
Dt
1
3.3. Relevant dimensionless variables
The battery energy loss during a discharge time
Two dimensionless variables characterize the
Dt is given by (Dt ,Dt):
2
2
PV-hybrid system: the PV module surface and the
battery storage capacity; both are independent of
1
the daily load. For the PV area, we first define a
]]
C (t) 5
E
[P (t) 1 P
(t) 2 P (t)] dt
2
S D
2
p
charger
c
reference area, S
as the PV module area (m )
r
ref
dch
Dt
2
that will produce, over the simulation period T
(say 19 years), an electrical energy equal to the
(14)
Design of hybrid-photovoltaic power generator, with optimization of energy management
149
The state of charge of the battery is defined
SOC is compared with the intrinsic parameters
during a simulation time-step Dt by:
(maximum and minimum capacities). If SOC(t),
C
the system is failing and if SOC(t).C
,
min
max
C(t) 5 C(t 2 Dt) 1 C (t) 1 C (t)
(15)
1
2
the system produces wasted energy.
By simulating many PV-hybrid systems having
If C
(t) reaches SAR by an energy benefit C (t)
1
the same load, one can, in principle, find an
during the charge period with the engine-genera-
infinite set of physical solutions, each solution
tor working, the generator has to be stopped and
being characterized by a PV module area S
, a
Dim
the charge time Dt
during Dt is calculated
1
storage capacity C
, and a nominal engine-
max
assuming a linear relation:
generator power. Each solution defines a ‘pair’
Dt
SAR 2 C(t 2 Dt)
1
(S
, C
). Several technical constraints, for
Dim
max
]
]]]]]
5
(16)
U
U
Dt
C (t)
example, the available products, reduces the
1
infinite number of solutions to a finite number of
Moreover, if during the discharge period when the
configurations. For each configuration, some
engine generator is stopped, C(t) reaches SDM,
physical variables are calculated by simulations:
the motor is started and the discharge time Dt
2
the wasted energy, the working time and the fuel
during Dt is calculated by a linear relation as:
consumption of the engine- generator, and the
times when certain subsystems need replacement.
Dt
C(t 2 Dt) 2 SDM
2
]
]]]]]
5
(17)
U
U
The energy cost is then computed for each pair,
Dt
C (t)
2
and the minimization of this parameter yields the
optimal operating configuration.
As an input of a simulation time-step Dt (taken as
1 h), several variables must be determined: PV
output power, load power, battery state of charge,
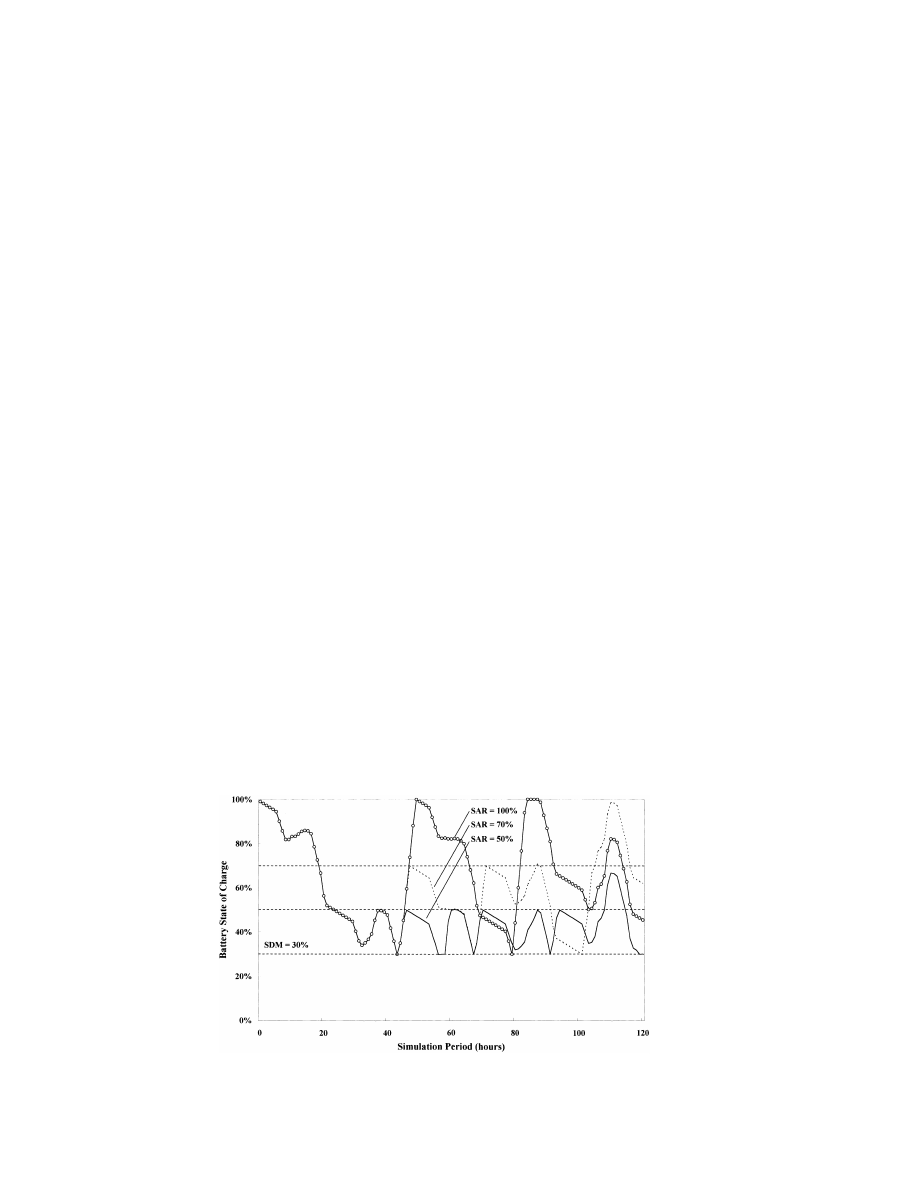
4. SIMULATION RESULTS
and back-up generator state (ON or OFF) in the
previous time-step. A battery energy balance
4.1. Operating mode
indicates the operating strategy of the PV-hybrid
To illustrate the battery energy state evolution
system: charge (energy balance positive) or dis-
as a function of the engine-generator thresholds,
charge (energy balance negative). Some tests are
we have plotted in Figs. 5 and 6, which show,
necessary to study the SOC variations as com-
respectively, the energy stored and the engine-
pared to the starting and stopping thresholds. If
generator operating hours as a function of time,
SOC(t) falls below SDM, the motor is started; and
over five days. Assumed parameter settings for
if SOC(t) exceeds SAR, it is stopped. So, the
the figures are as follows: C 5two days, the initial
charge and discharge times (Eqs. (16) and (17))
charge on the battery5100% of capacity, dimen-
must be calculated on the simulation time-step in
sionless PV module surface50.94, SDM530%
order to compute the different energy flows in the
and SAR550%, 70% and 100%. Also, the ‘Low
system (Eqs. (13) and (14)). Then, the battery
Fig. 5. Evolution of the battery state of charge for several assumed values of the thresholds (SDM, SAR) governing the operation
of the engine-generator.
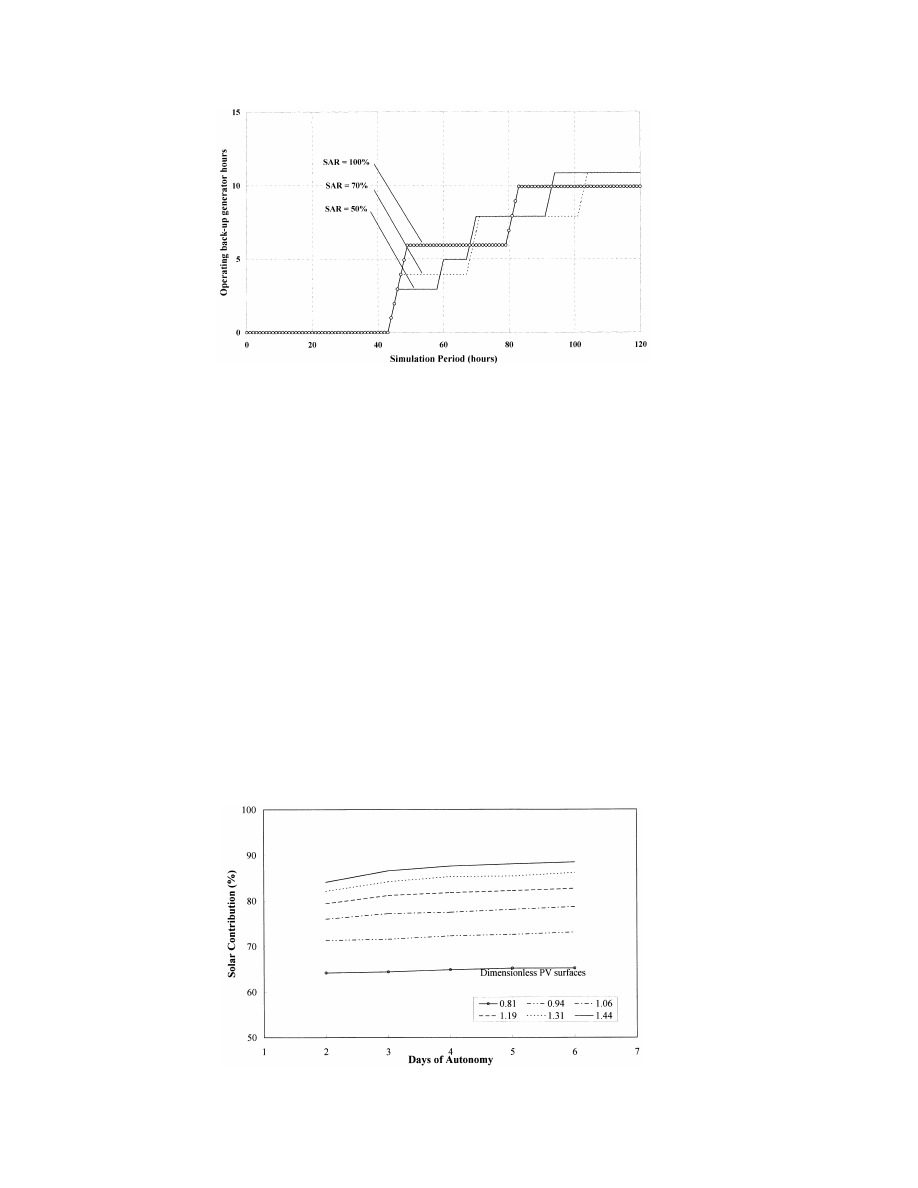
150
M. Muselli et al.
Fig. 6. Plot of the back-up generator operating time for several assumed values of the thresholds (SDM, SAR) governing the
operation of the engine-generator.
Consumption’ load profile was used, and a
nominal engine-generator power is undersized and
gasoline engine was assumed.
the autonomy constraint is not respected. Thus, in
the remainder of this paper, only batteries with
4.2. PV-hybrid system sizing curves
capacities greater than to two days will be consid-
Fig. 7 presents the solar contribution (defined
ered.
as the percentage that the PV production is of the
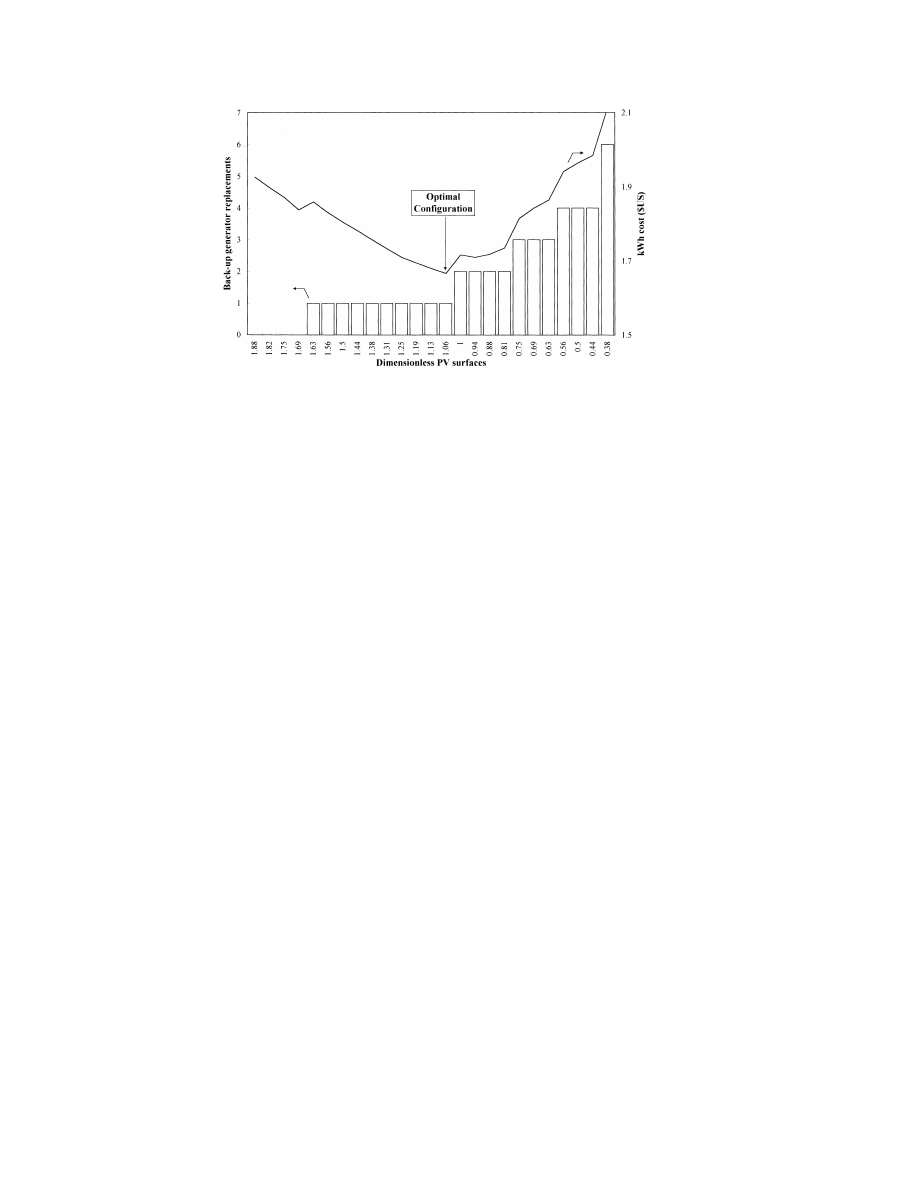
Fig. 8 presents the sizing curve, as obtained
total energy production) versus dimensionless
assuming the Standard load profile, the SDM and
storage capacities (one to six days). These plots
SAR are equal to 30% and 80%, respectively, and
have been parameterized using dimensionless PV
a gasoline-driven engine. The existence of some
areas ranging from 0.81 to 1.44. We concluded
‘discontinuities’ in Fig. 8 are due to the number of
that it was not necessary to consider a PV-hybrid
changes of the engine-generator with the decrease
system with a storage capacity greater than two or
in dimensionless PV areas. The optimal configura-
three days of autonomy. Sidrach de Cardona and
tion, i.e., the one corresponding to the lowest
Mora Lopez (1992) have obtained the same
energy cost, is determined for each sizing curve.
conclusion considering a PV-hybrid system in
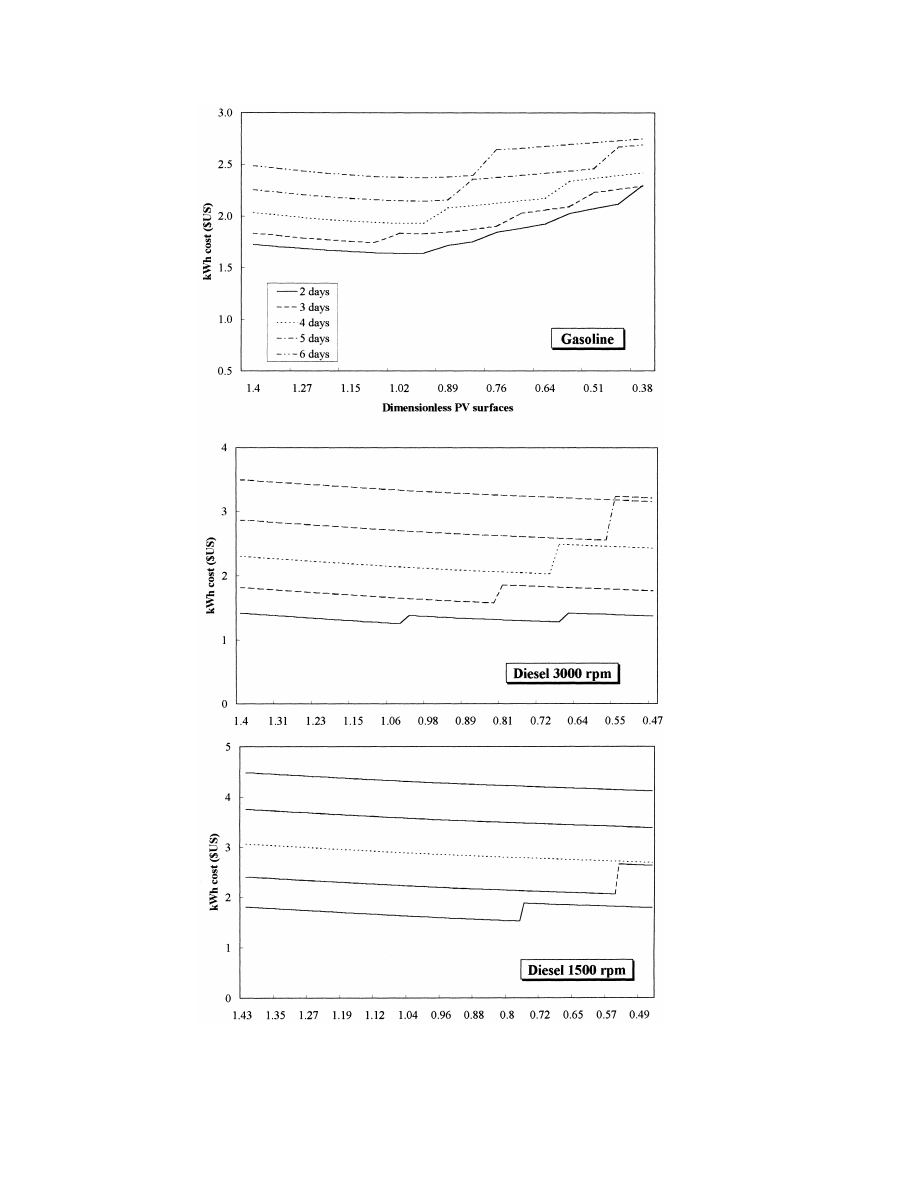
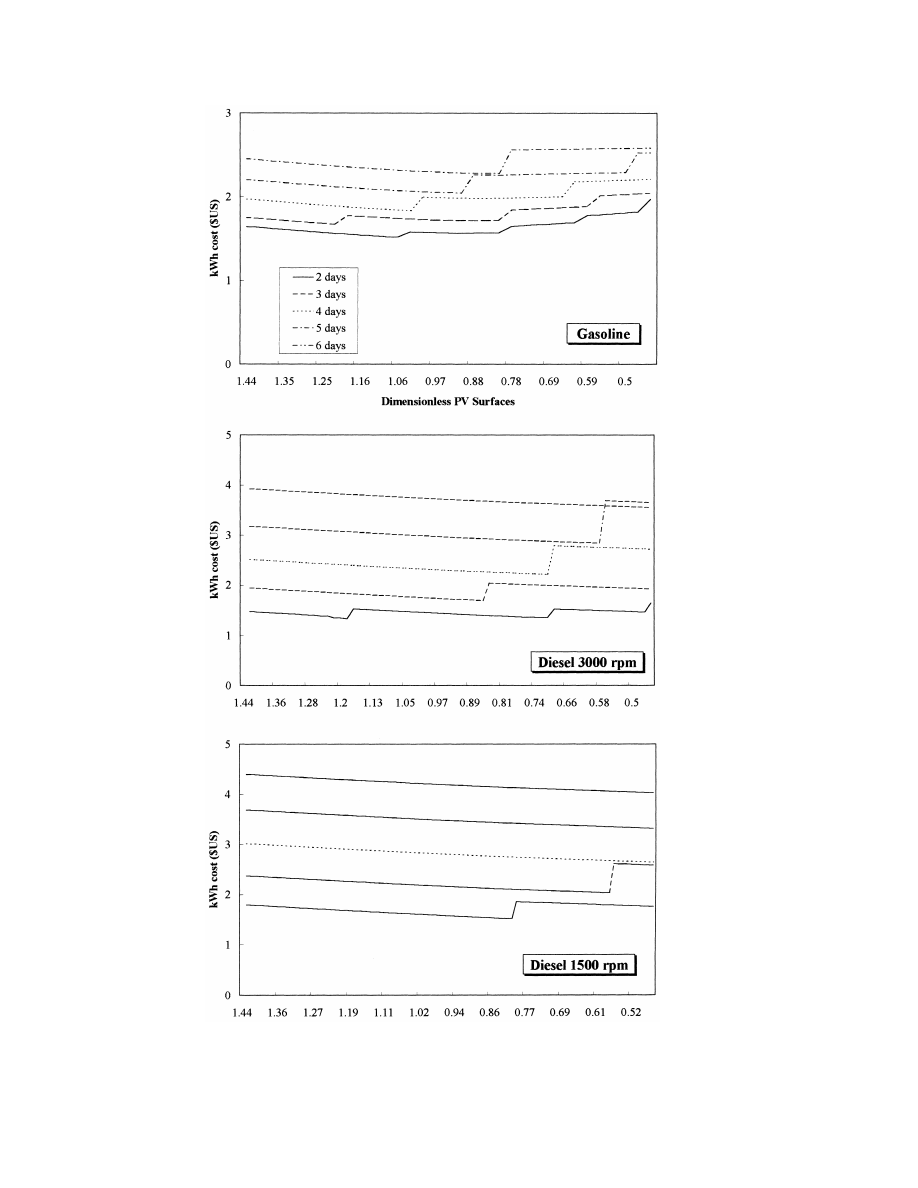
In Figs. 9 and 10 (which apply to ‘Low Consump-
which the back-up generator was applied directly
tion’ and ‘Standard’ profiles respectively), we
to the load and to a battery charger, at the same
have plotted the sizing curves parameterized by
time. The simulations demonstrate that for a
the storage capacities (two to six days) for
system with only one day of autonomy, the
SDM530% and SAR580%.
Fig. 7. Solar contribution (%) as a function of dimensionless storage capacities 2 to 6 days.
Design of hybrid-photovoltaic power generator, with optimization of energy management
151
Fig. 8. Sizing curve of PV-hybrid systems for a gasoline engine, ‘Standard’ load profile, and SDM and SAR equal to 30% and
80%, respectively.
The lowest points on the curve define the
(S
50.97, 0.95 and 0.73 for the three cases in
Dim
optimal configuration. Although the locations of
Fig. 11). The optimal size of the engine generator
the lowest points are indistinct around the optimal
is easily deduced from the optimal capacity (two
point, the optimal configuration is always ob-
days) and from Eq. (10), by dividing the battery
tained when the storage capacity equals two days
charger rated power by the charger efficiency
of autonomy. These findings have been confirmed
h
.
charger
for other values of the starting and stopping
For the combinations of SDM and SAR and for
thresholds.
the optimal pairs (S
, C
) of Fig. 11, we have
Dim
max
To make these results more general, a sensitivi-
combined the solar contribution curves obtained
ty analysis of the energy costs to various parame-
for a battery capacity of two days to deduce
ters must be performed. A short sensitivity study
optimal solar and fossil fuel contributions for each
presented in a previous paper (Notton et al.,
engine-generator type, and these are given in
1998) confirmed the main conclusions shown
Table 4.
here.
In previous works in our laboratory Notton et
al. (1996b) applied such an optimization to a
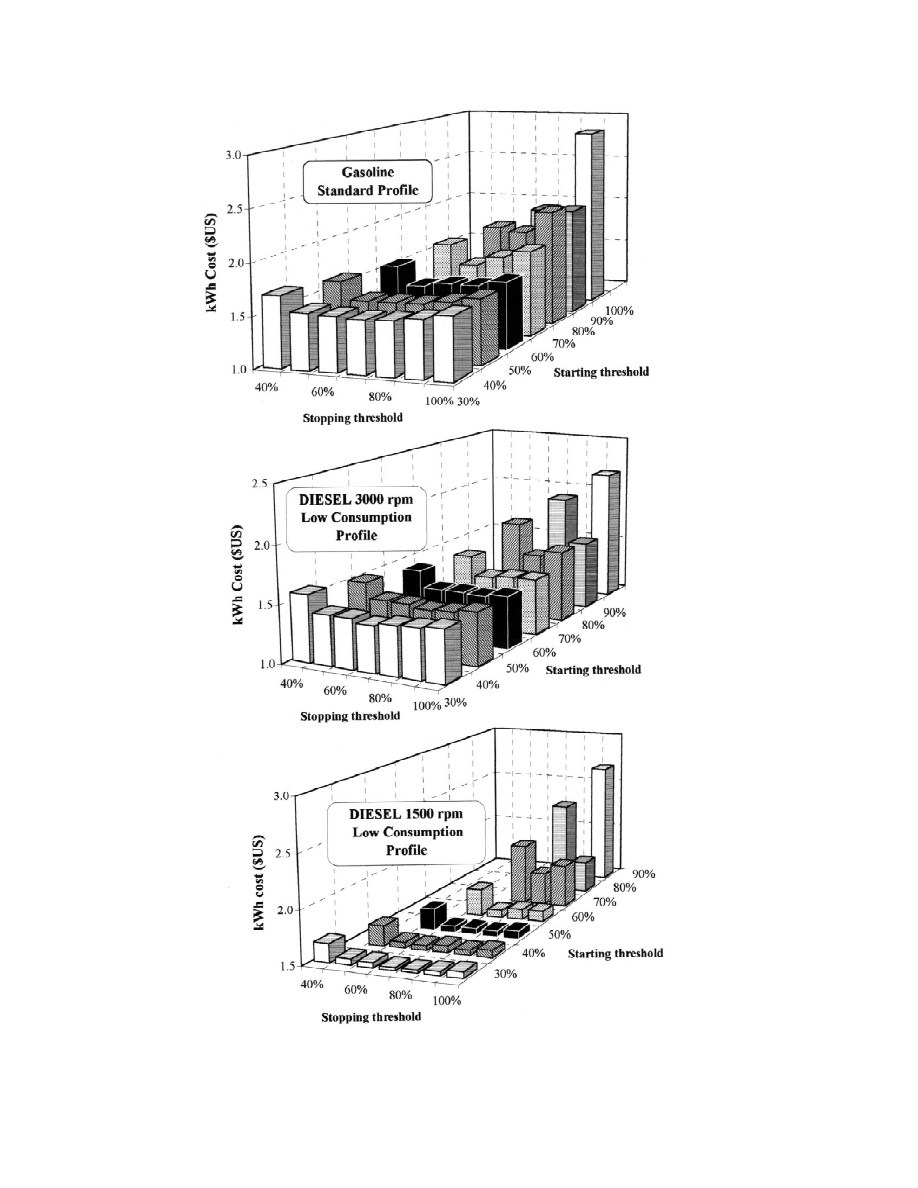
4.3. Influence of the back-up generator
hybrid-system, but without including the engine-
operating strategy
generator behavior in the system simulation. In
In accordance with the above results, a storage
that work, the stand-alone PV system without the
capacity of two days will be used for the analysis
engine-generator had been sized for several loss-
of the back-up generator operating strategy. Also,
of-load probabilities, and then the energy deficit
the energy cost has been calculated for various
was supplied by the engine-generator. This con-
combinations of SDM and SAR, by varying them
figuration has led to identical optimal contribu-
by steps of 10%, (i.e., SDM[[30%; 90%] and
tions (75% solar and 25% fossil), whichever the
SAR[[40%; 100%]). For each combination, we
engine type. In this study, the results have been
computed the optimal pair leading to the lowest
found to depend on the engine type. The varia-
energy cost. Fig. 11 presents the results for each
tions in the contributions for the diesel 1500-rpm
engine type and for both load profiles. The
type can be linked to its longer lifetime, which
optimal configuration is obtained when SDM5
leads to reduced replacement costs. The results
30% and SAR570%, regardless of the load
are very dependent on the lifetime and mainte-
profile and the engine-generator type.
nance of the engine, and have been calculated by
Thus we have now demonstrated that the
optimizing these two parameters (Notton et al.,
optimal size of the battery capacity is two days
1997).
and the best energy management is obtained when
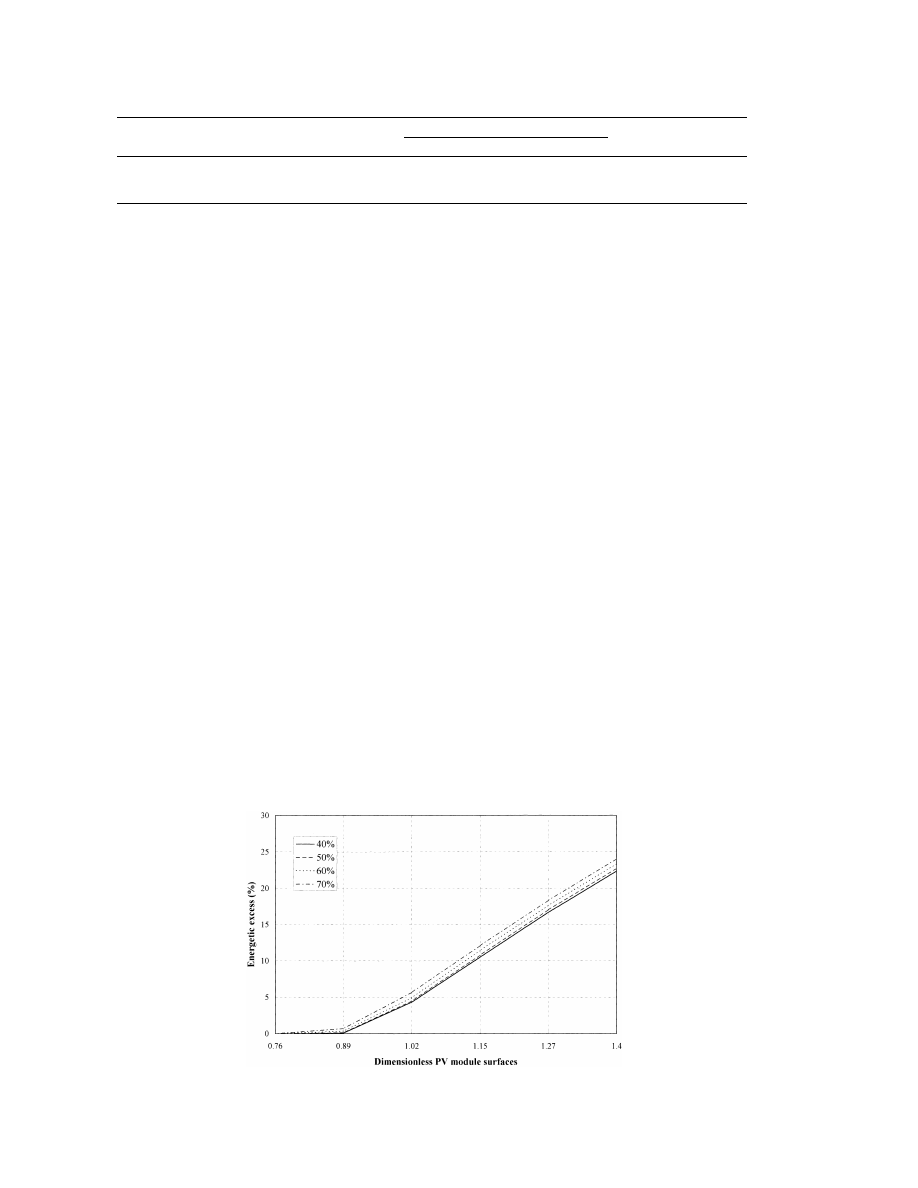
4.4. Wasted energy
SDM and SAR are respectively equal to 30% and
70% of the nominal storage capacity. The optimal
We have also studied, over a given time period,
PV area for each configuration is close to unity
say T, the influence of the engine-generator
152
M. Muselli et al.
Fig. 9. Sizing curves obtained for a storage capacity ranging from 2 to 6 days of autonomy, for each engine type (The Low
Consumption load profile is assumed).
Design of hybrid-photovoltaic power generator, with optimization of energy management
153
Fig. 10. Sizing curves obtained for storage capacities ranging from 2 to 6 days of autonomy, for each engine type (Standard load
profile is assumed.)
154
M. Muselli et al.
Fig. 11. Influence of back-up generator operating strategy according to engine type.
Design of hybrid-photovoltaic power generator, with optimization of energy management
155
Table 4. Optimal contributions for each back-up generator type
Optimal contributions
Motor type
Load profiles
Solar source (%)
Fossil source (%)
Gasoline
Low consumption / standard
75
25
Diesel 3000 rpm
Low consumption / standard
80
20
Diesel 1500 rpm
Low consumption / standard
65
35
operating strategy on the wasted energy WE(T )
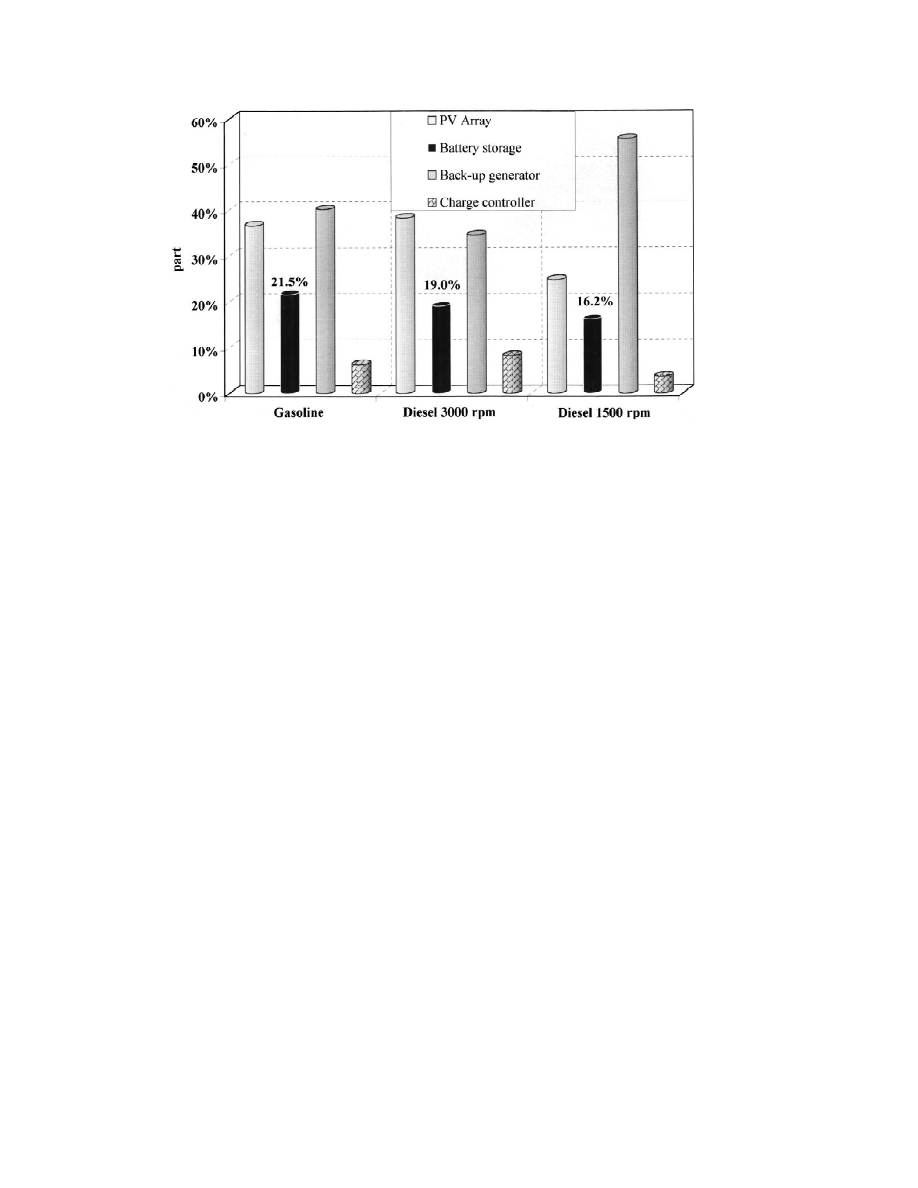
subsystem during its lifetime. The results are
produced by the system,
presented in Fig. 13. For hybrid systems using
gasoline and 3000-rpm diesel engine-generators,
T
the PV contribute 35% and the engine contributes
WE(T ) 5
O
[P (t) 2 P (t)] dt
(18)
p
c
40% of the total cost. The total investment cost is
P (t ).P (t )
p
c
made up of the following: PV modules about
C(t ).C
max
30%, engine-generator about 20%, PV support
For example, for a gasoline engine the influence
about 4%, O&M for the engine-generator about
of the stopping threshold (SAR[[40%; 70%]) on
5%, and the charge controller about 3.5%. With
the wasted energy for a given starting threshold
the lifetime of a gasoline engine being lower than
(SDM530%) is shown in Fig. 12. We found a
the lifetime of a 3000-rpm diesel engine, the
trivial result: increasing the PV module increases
gasoline engine must be replaced during the
the energy excess. On the other hand, the charge
hybrid-system lifetime, whereas the diesel engine
strategy represented by the SAR variation is not
does not. Moreover, the fuel consumption cost is
significant. The increase of SAR causes an in-
greater for the gasoline engine, because its fuel
crease from 2 to 4% of the energy surplus over all
consumption and its fuel prices are higher than
PV area ranges. We note that, considering the
those for a 3000-rpm diesel engine. For the
optimal configurations previously given (S
5
Dim
system using the 1500-rpm diesel engine, the
0.97 for gasoline engine), the energy surplus is
initial costs are more important: the PV and
inferior to 5%; this demonstrates the competitive-
engine-generator investment (about 20% and
ness of hybrid-PV systems, as compared to stand-
50%), PV support parts (about 3%), the O&M
alone PV/ battery systems with an energy excess
back-up generator (about 3%), and the charge
about 50%.
controller investment (about 3%). We note that the
battery contribution to the cost is about 20%
4.5. Economical study on the PV-hybrid system
(made up of about 9% for investment and 11% for
lifetime
replacement) regardless of the engine type. This
result agrees with previous findings (Notton et al.,
From optimal configurations previously de-
1996a) relating to stand-alone PV/ battery sys-
scribed (SDM530% and SAR570%), for each
tems, for which the storage represents 40% on the
engine type and for the Low Consumption load
total lifetime cost. Thus the addition of a back-up
profile, we have determined the investment,
generator to a traditional PV system cuts the
maintenance and replacement costs for each
Fig. 12. Influence of the stopping threshold on the energy excess (SDM set equal to 30%).
156
M. Muselli et al.
Fig. 13. Breakdown of the contributions (investment, maintenance, replacement) of each subsystem in determining the PV-hybrid
system lifetime.
battery’s contribution to the total cost by a factor
FOSSIL, the contribution of fossil in the latter
combination being higher, because of the longer
of two. Previously, Notton et al., 1996b showed
lifetime of a diesel engine. The work has demon-
that the energy cost produced by a PV hybrid
strated the competitiveness of PV-hybrid systems,
system is half of a traditional PV/ battery stand-
which can work with an energy excess as low as
alone system.
5% and a battery storage half of that of the
traditional stand-alone PV system, based on the
5. CONCLUSIONS
system lifetime. In conclusion, the approach
presented here appears to be a valuable tool for
In this paper, we have studied the behavior of a
the design and evaluation of PV-hybrid systems
stand-alone PV-hybrid (PV and engine-generator)
supplying power in remote areas.
system. We have considered the sizing of PV
systems by using hourly total irradiation values on
NOMENCLATURE
tilted surfaces and hourly load profiles taken as
constant over the seasons. The study has shown
Dimensionless battery storage
C
that the optimal configuration, i.e., the configura-
capacity
tion that minimizes the energy cost, is obtained
C(t)
Battery state of charge
Wh
with a battery storage capacity of two days. The
C (t)
Battery energy benefit during the
Wh
1
influence of the engine-generator’s operating
period Dt
C2(t)
Battery energy loss during the
Wh
strategy has also been studied. It was found that
period Dt
an optimal configuration is one where the engine-
C
Cost coefficient
$US
0
generator is switched on when the battery charge
C
kW price
$US
G
is at 30% of maximum battery capacity and where
C
Nominal storage capacity
Wh
max
it is turned off when the battery charge is 70% of
C
Minimal storage capacity
Wh
min
DOD
Depth of discharge
%
maximum battery capacity. The study has de-
22
H (T )
Solar irradiation received by PV
Wh?m
b
termined optimal contributions for both solar and
modules on a tilted plane
fossil fuel energy sources. For gasoline powered
22
I (t)
Hourly solar irradiation on tilted
Wh?m
b
engine-generators,
the
combination
of
75%
plane
SOLAR with 25% FOSSIL are the most econ-
L(T )
Energy consumed by load in the
Wh
period T
omical solutions, and 3000-rpm diesel powered
P (t)
Instantaneous power to the load
W
c
engine-generators, 80% SOLAR and 20% FOS-
PCI
Heating value of fuel
kWh per l
v
SIL are the most economical solutions. For 1500-
P
Generator power
W
G
rpm diesel powered engine-generators, the opti-
P (t)
Instantaneous power represent-
W
c
mal combination is 65% SOLAR with 35%
ing the load

Design of hybrid-photovoltaic power generator, with optimization of energy management
157
Hille G. and Dienhart H. (1992) Economic analysis of hybrid
P
Generator power
W
G
0
systems for decentral electricity generation in developing
P
Nominal power of the battery
W
charger
countries. In Proceedings of the
11th European Photo-
charger
voltaic Solar Energy Conference, pp. 1559–1563, Mon-
P
Power of the battery charger
W
charger(t )
treux.
available at the instant t
Illiceto A., Previ A. and Zuccaro C. (1994) Experiences of
0
P
Rated
power
of
the
engine
W
G
rural electrification in southern Italy by means of PV plants.
generator
In Proceedings of the
12th European Photovoltaic Solar
P (t)
Instantaneous
PV
produced
W
Energy Conference, pp. 210–211, Amsterdam.
p
Imamura M.S., Helm P., and Palz W. (1992) In Photovoltaic
power
System Technology
: An European Handbook, Stephen H. S.
Q
Back-up generator consumption
l / h
v
and Associates (Eds), Commission of the European Com-
per h
0
munities, Bedford.
Q
Consumption of the motor at
l / h
v
Iskander C. and Scerri E. (1996) Performance and cost
this rated power per h
evaluation of a stand-alone photovoltaic system in Malta.
SAR
Stopping threshold
Wh
World Renewable Energy Congress 8, 1–4, pp. 437–440,
S
Dimensionless PV surface
Dim
Denver, Colorado.
SDM
Starting threshold
Wh
Kaye J. (1994) Optimizing the value of photovoltaic energy in
2
S
PV Reference surface
m
electricity supply systems with storage. In Proceedings of
ref
the
12th European Photovoltaic Solar Energy Conference,
WE(T )
Wasted energy on the period T
Wh
pp. 431–434, Amsterdam.
a
Scale factor
Keller L. and Afolter P. (1995) Optimizing the panel area of a
h
Back-up generator efficiency
%
c
PV system in relation to the static inverter–practical results.
h
Battery charger efficiency
%
charger
Solar Energy 55, 1–7.
h
PV array efficiency
%
PV
Manninen L.M. and Lund P.D. (1989) Dynamic simulation
r , r
Charge and discharge battery
%
ch
dch
and sizing of photovoltaic and wind power systems. In
efficiencies
Proceedings of the
9th European Photovoltaic Solar Energy
Dt
Simulation time-step
h
Conference, pp. 546–549, Freiburg.
Dt
Battery charge time during the
h
Notton G., Muselli M., Poggi P. and Louche A. (1996)
1
period Dt
Autonomous photovoltaic systems: influencies of some
parameters on the sizing: simulation time-step, input and
Dt
Battery discharge time during
h
2
output power profile. Renewable Energy 7, 353–369.
the period Dt
Notton G., Muselli M. and Louche A. (1996) Autonomous
hybrid photovoltaic power plant using a back-up generator:
a case study in a Mediterranean island. Renewable Energy
REFERENCES
7, 371–391.
Notton G., Muselli M., Poggi P. and Louche, A. (1997) What
Abenavoli R. I. (1991) Technical and economic comparison of
hypothesis used for an economic study of electric generators
electric generators for rural area. Solar Energy 47, 127–135.
for rural area? literature survey and new suggestions. In
Benyahia Z. (1989) Economic viability of photovoltaic sys-
Proceedings of the
14th European Photovoltaic Solar
tems as an alternative to diesel power plants. In Proceedings
Energy Conference, pp. 2534–2537, Barcelona.
of the
9th European Photovoltaic Solar Energy Conference,
Notton G., Muselli M. and Poggi P. (1998) Costing of a
pp. 173–175, Freiburg.
stand-alone photovoltaic system. Energy 23(4), 289–308.
Beyer H. G., Degner T. and Gabler H. (1995) Operational
Oldham France S.A. (1992) Technical documentation.
behavior of wind diesel systems incorporating short-term
Orgill J. F. and Hollands K. T. G. (1977) Correlation equation
storage: an analysis via simulation calculations. Solar
for hourly diffuse radiation on horizontal surface. Solar
Energy 54, 429–439.
Energy 19, 357–359.
Beyer H. G., Bolhen M. and Schumacher, J. (1995b) GENG.
Paish O., MacNellis B. and Derrick A. (1994) Solar Electrici-
A solar modelisation data generation for the simulation
ty. Ch. V: Applications, John Wiley and Sons.
system INSES. In Proceedings of the
13th European
Palz W. and Schmid J. (1990) Electricity production costs
Photovoltaic Solar Energy Conference, pp. 982–985, Nice.
from photovoltaic systems at several selected sites within
¨
Biermann E., Corvinus F., Herberg T. and Hofling H. (1995)
the European Community. Int
. J. Solar Energy 8, 227–231.
Basic Electrification for Rural Household. GTZ (Deutsche
`
´
Poggi P. (1995) Contribution a l’etude de l’insertion de
Gesselschaft fur Technische Zuzammenarbeit).
`
¨
´
systemes photovoltaıques dans un reseau insulaire. Ph.D.
Calloway T.M. (1986) Design of an intermediate-sized au-
Thesis, University of Corsica.
tonomous photovoltaic–diesel power plant. Sandia National
Sandia National Laboratories (1990) Stand-alone Photovoltaic
Laboratory Report, SAND85-2136.
Systems. SAND87-7023.
Cramer G., Kleinkauf W. and Schott T. (1990) Wind / diesel /
Sidrach de Cardona M. and Mora Lopez L.I. (1992) Optimiz-
battery systems – Applications, experience, economy of
ing of hybrid photovoltaic generator systems for installa-
different system configurations and sizes. European Com-
tions of rural electrification. In Proceedings of the
11th
munity Wind Energy Conference, pp. 575–579, Madrid.
European Photovoltaic Solar Energy Conference, pp. 1287–
EGAT (1990) Economic analysis of photovoltaic system.
1290, Montreux.
EGAT Report.
Thabor M.Z. (1988) Small diesel power. International Confer-
´
Eliot P. (1982) Analyses d’un habitat PV en site isole. Ph.D.
ence on Small Power Supplies, Tasmanie.
Thesis, University of Nice.
Tsuda I., Kurokawa K. and Nozaki K. (1994) Annual simula-
ENERGELEC Back-Up Generators (1995) Technical Docu-
tion results of PV system with redox flow battery. Solar
mentation (French suppliers).
Energy Mater
. Solar Cells 35, 503–508.
ENERGIE RELAIS Back-Up Generators (1995) Technical
van Dijk V.A.P. (1996) Hybrid photovoltaic solar energy
Documentation (French suppliers).
systems: design, operation and optimization of the Utrecht
Hay, J.E. and Davies J.A. (1980) Calculation of the solar
PBB system. Ph.D. Thesis, University of Utrecht.
radiation incident on an inclined surface. In Proceedings
First Canadian Solar Radiation Data Workshop, pp. 59–72.
Wyszukiwarka
Podobne podstrony:
Dynamic Simulation Of Hybrid Wind Diesel Power Generation System With Superconducting Magnetic Energ
Design of the Zephyros Z72 wind turbine with emphasis onthe direct drive PM generator
DESIGN OF A SWITCHING MODE POWER SUPPLY WITH UPS FEATURES
Design and Simulation of a Stand alone Wind Diesel Generator with a Flywheel
Eurocode 5 EN 1995 1 1 Design Of Timber Structures Part 1 1 General Rules
Design Guide 02 Design of Steel and Composite Beams with Web Openings
Eurocode 5 EN 1995 1 1 Design Of Timber Structures Part 1 1 General Rules
Eurocode 6 Part 1 2 1996 2005 Design of Masonry Structures General Rules Structural Fire Design
Eurocode 8 Part 1 1998 2004 Design of Structures for Earthquake Resistance General Rules Seism
Eurocode 3 Part 1 4 2006 Design of Steel Structures General rules Supplementary Rules for Stainl
Bearden EXPLANATION OF THE MOTIONLESS ELECTROMAGNETIC GENERATOR WITH 0(3) ELECTRODYNAMICS
Design Of Direct Driven Permanent Magnet Generators For Wind Turbines
Eurocode 5 Part 1 2 1995 2004 Design of Timber Structures General Structural Fire Design UK Ann
Eurocode 3 Part 1 3 2006 UK NA Design of steel structures General rules Supplementary rules for
Eurocode 2 Part 1 1 2004 NA UK Design of concrete structures General rules and rules for buildin
Eurocode 3 Part 1 11 2006 Design of Steel Structures Design of Structures With Tension Components
Eurocode 3 Part 1 11 2005 UK NA Design of Steel Structures Design of Structures with Tension Com
Eurocode 3 Part 1 2 2005 UK NA Design of steel structures General rules Structural fire design
więcej podobnych podstron