
Warsaw, December 2002
M o n e t a r y t r a n s m i s s i o n
m e c h a n i s m i n P o l a n d
T h e s t r e n g h t a n d d e l a y s
M AT E R I A ¸Y I S T U D I A
Tomasz ¸yziak
P a p e r n o 2 6

2
Small structural model of monetary transmission mechanism in Poland
N a t i o n a l B a n k o f P o l a n d
Design:
Oliwka s.c.
Layout and print:
NBP Printshop
Published by:
National Bank of Poland
Department of Information and Public Relations
00-919 Warszawa, 11/21 Âwi´tokrzyska Street
phone: (22) 653 23 35, fax (22) 653 13 21
© Copyright by the National Bank of Poland, 2002
http://www.nbp.pl

Contents
MATERIA¸Y I STUDIA PAPER 26
3
Contents
List of figures . . . . . . . . . . . . . . . . . . . . . . . . . . . . . . . . . . . . . . . . . . . . . . 4
Abstract . . . . . . . . . . . . . . . . . . . . . . . . . . . . . . . . . . . . . . . . . . . . . . . . . . 5
1. Small structural model of monetary transmission mechanism in Poland . . 6
2. Individuals’ inflationary expectations in the small structural model of
monetary transmission mechanism in Poland . . . . . . . . . . . . . . . . . . . . . . . 10
3. Monetary transmission mechanism in Poland – new empirical findings . 13
4. Supply shocks and the reaction of monetary policy . . . . . . . . . . . . . . . . 16
5. Conclusions . . . . . . . . . . . . . . . . . . . . . . . . . . . . . . . . . . . . . . . . . . . . . 20
6. Appendix 1:
Measuring the nominal and real effective exchange rate . . . . . . . . . . . . . . 22
7. Appendix 2:
Basic diagnostics of the model’s equations . . . . . . . . . . . . . . . . . . . . . . . . 25
8. References . . . . . . . . . . . . . . . . . . . . . . . . . . . . . . . . . . . . . . . . . . . . . . .26

4
List of figures
N a t i o n a l B a n k o f P o l a n d
List of figures
Scheme 1. Small structural model of monetary transmission mechanism in
Poland . . . . . . . . . . . . . . . . . . . . . . . . . . . . . . . . . . . . . . . . . . . 9
Figure 1. Inflationary expectations approaching the actual inflation
ex-post in the long run . . . . . . . . . . . . . . . . . . . . . . . . . . . . . . .. 12
Figure 2. Response functions of selected variables to the interest rate
impulse . . . . . . . . . . . . . . . . . . . . . . . . . . . . . . . . . . . . . . . . . . . 13
Figure 3. Response functions of quarterly dynamics of food prices,
oil price and remaining items of the CPI basket to the interest
rate impulse . . . . . . . . . . . . . . . . . . . . . . . . . . . . . . . . . . . . . . . 14
Figure 4. Response functions of annual dynamics of food prices, oil price
and remaining items of the CPI basket to the interest
rate impulse . . . . . . . . . . . . . . . . . . . . . . . . . . . . . . . . . . . . . . . 14
Figure 5. Response of the interest rate and the real exchange rate to
a rise in food prices . . . . . . . . . . . . . . . . . . . . . . . . . . . . . . . . . . 16
Figure 6. Response of the output gap to a rise in food prices . . . . . . . . . . 16
Figure 7. Response of annual inflation to a rise in food prices . . . . . . . . . . 16
Figure 8. Response of the interest rate and the real exchange rate to
a rise in the oil price . . . . . . . . . . . . . . . . . . . . . . . . . . . . . . . . . 17
Figure 9. Response of the output gap to a rise in the oil price . . . . . . . . . 17
Figure 10. Response of annual inflation to a rise in the oil price . . . . . . . . .17
Figure 11. Response functions of the output gap to the interest rate
impulse in Poland (primary and new version of the small
structural model of monetary transmission mechanism:
MSMTM 2001, MSMTM 2002) and in the UK . . . . . . . . . . . . . . 19
Figure 12. Response functions of annual inflation to the interest rate
impulse in Poland (primary and new version of the small
structural model of monetary transmission mechanism:
MSMTM 2001, MSMTM 2002) and in the UK . . . . . . . . . . . . . . 20
Figure 13. Nominal and real effective exchange rate in Poland
(1995-2001) . . . . . . . . . . . . . . . . . . . . . . . . . . . . . . . . . . . . . . . 22

Monetary transmission in Poland
The strength and delays
1
Tomasz ¸yziak
2
Abstract
Monetary transmission mechanism is in the core of central banking. Its understanding
however seems to be especially important within direct inflation targeting strategy. In particular, it
facilitates the adequate setting of headline interest rates, consistent with declared objectives of the
monetary policy. This paper looks into the strength of the monetary transmission mechanism in
Poland as well as the delays in this process. It does so by using a new version of the small struc-
tural model of monetary transmission mechanism in Poland. There are three major differences
between the new version of the model and the previous one, discussed in detail in ¸yziak (2001).
Firstly, in the version of the model presented in this paper, the interest rate channel and the bank-
lending channel are modelled jointly. Secondly, due to the use of more adequate measures of the
real exchange rate and a change of the sample period, both direct and indirect (demand) effects of
the exchange rate channel are captured. Thirdly, in the new version of the model price behaviour
of selected items of the consumer basket – i.e. foodstuffs, oil and remaining items – is modelled
separately. Based on the model simulations, the paper confirms that the effectiveness of the
monetary transmission mechanism in Poland has increased. It is reflected in a relatively stronger
impact of interest rate impulses on inflation relative to the conclusions from the previous version of
the model.
Abstract
MATERIA¸Y I STUDIA PAPER 26
5
1
This paper has benefited from helpful discussions with Dr Ryszard Kokoszczyƒski, Dr Lavan Mahadeva, Bojan Markovic
and Ewa Wróbel. Any remaining errors are the responsibility of the author. The views expressed in this paper are those
of the author and do not necessarily reflect those of the National Bank of Poland.
2
Bureau of Macroeconomic Research, National Bank of Poland, Tomasz.Lyziak@mail.nbp.pl.

6
1
Small structural model of monetary transmission mechanism in Poland
N a t i o n a l B a n k o f P o l a n d
1
Small structural model of monetary transmission
mechanism in Poland
The small structural model of monetary transmission mechanism in Poland is grounded on
three fundamental relationships suggested by the theory of macroeconomics, which are treated as
key elements of models describing the monetary transmission mechanism. They contain the
aggregate demand curve, uncovered interest rate parity condition and the Phillips curve
3
. The
complete set of the model’s equations is as follows (standard errors in parentheses)
4
:
[1]
[2]
[3]
[4]
[5]
[6]
[7]
[8]
[9]
[10]
where:
– real GDP (a measure of aggregate demand);
– potential GDP (measured with the Hodrick-Prescott filter);
– one-month interbank interest rate (WIBOR1M) in nominal terms;
π
π
π
t
e
t
e
t
=
⋅
+
⋅
−
0 82
0 13
0 05
1
0 05
.
.
( .
)
( .
)
π
π
t
e
t
e
=
⋅
0 72
.
log
log
( )
e
e
i
i
t
r
t
r
t
r
t
r f
( )
−
( )
= −
+
1
log
log
log
/
/
e
e
w
e
t
USD PLN
t
n
t
EUR
EUR USD
(
)
=
( )
−
⋅
(
)
i
y
y
t
t
t
t
t
=
⋅
( )
−
( )
+
⋅
−
(
)
∗
∗
0 5
1 5
.
log
log
.
π π
y
y
∗
i
log
log
.
.
log
log
.
.
log
( .
)
( .
)
( .
)
y
y
y
y
i
e
t
t
t
t
t
r
t
r
( )
−
( )
= −
+
⋅
( )
−
( )
−
⋅
−
⋅
( )
∗
−
−
∗
−
−
0 07
0 41
0 32
0 09
0 15
1
1
0 15
2
0 02
1
π
π
t
C
t
e
t
t
t
r
y
y
e
s
= −
+
+
⋅
( )
−
( )
−
⋅
( )
+
⋅
−
−
∗
−
0 02
0 34
0 02
0 01
0 12
3
3
0 00
1
0 00
1
.
.
log
log
.
log
.
( .
)
( .
)
( .
)
( )
π
π
π
t
F
t
t
F
t
F
t
p
p
= −
+
⋅ −
⋅
−
⋅
( )
−
( )
(
)
−
−
−
0 02 1 48
0 48
0 11
0 09
0 09
1
0 05
1
1
.
.
.
.
log
log
( .
)
( .
)
( .
)
π
t
O
t
USD
t
USD
t
USD PLN
t
USD PLN
b
b
e
e
=
( )
−
( )
−
(
)
+
(
)
−
−
log
log
log
log
/
/
1
1
π
π
π
π
t
t
C
t
C
t
F
t
F
t
O
t
O
w
w
w
=
⋅
+
⋅
+
⋅
3
M. Woodford (2002), p. 11.
4
Detailed estimation results in the Appendix 2.

1
Small structural model of monetary transmission mechanism in Poland
MATERIA¸Y I STUDIA PAPER 26
7
– one-month interbank interest rate (WIBOR1M) in real terms;
– foreign interest rate in real terms;
– nominal effective exchange rate
5
;
– real effective exchange rate;
– nominal USD/PLN exchange rate;
– nominal EUR/USD exchange rate;
– weight of euro used in the calculation of the nominal effective exchange rate;
– quarterly dynamics of consumer prices excluding foodstuffs and oil (core inflation);
– quarterly dynamics of foodstuffs prices;
– quarterly dynamics of oil prices;
– weight of items excluding foodstuffs and oil in the CPI basket;
– weight of foodstuffs in the CPI basket;
– weight of oil in the CPI basket;
– price of oil in international markets (USD per barrel);
– quarterly inflation;
– inflation target;
– foodstuffs’ price level;
– price level;
– individuals’ inflationary expectations in quarterly terms;
– adjusted measure of individuals’ inflationary expectations in quarterly terms, which
approaches actual inflation in a long-run
6
;
– seasonal dummy, equal to 1 in the quarter i .
Equation [1] is the aggregate demand curve, in which the output gap depends upon its
lagged value, the real interest rate and the real effective exchange rate. Its analytical formula is
similar to IS curves used in McCallum and Nelson (1997) and Svensson (1998) models, which have
microfoundations in dynamic general equilibrium models with price stickiness. The only exception
from those specifications is that in the aggregate demand curve of the small structural model of
monetary transmission mechanism in Poland the expected future output gap, which is a relevant
argument in theoretical fully forward-looking IS curves, is suppressed and instead the lag is used
for simplicity. Such a modification is implemented in a number of empirical works
7
– for instance
in Batini and Haldane (1999), Muinhos (2001) as well as de Freitas and Muinhos (2001) models.
In the recent version of the model, price behaviour of selected items of the consumer basket
– namely: foodstuffs, oil and remaining groups – is modelled separately. Equation [2] explains
quarterly dynamics of prices of CPI basket items excluding food and oil (i.e. the core inflation) with
the output gap, the real effective exchange rate and individuals’ inflationary expectations as
explanatory variables. It should be noted that in the Phillips curve adjusted measures of individuals’
i
r f
( )
e
n
e
USD PLN
/
e
EUR USD
/
w
EUR
π
C
π
F
π
O
w
C
w
F
w
O
b
USD
π
π
∗
P
F
P
π
e
π
e
s
i
( )
i
=
{
}
(
)
1 2 3 4
, , ,
5
According to a convention applied, the exchange rate is defined as a number of units of foreign currency equivalent
to one unit of domestic currency. Hence the rise in the exchange rate is the appreciation of the domestic currency. The
way, in which the nominal and real effective exchange rates are calculated, is described in detail in the Appendix 1.
6
Remarks on the measurement of individual’s inflationary expecytations and their use in the Phillips curve are presented
in the next paragraph.
7
Razzak (2002) characterizes the aggregate demand curve without forward-looking component as the empirical
version of the IS curve.
See: W. A. Razzak (2002), p. 26.
e
r
i
r

8
1
Small structural model of monetary transmission mechanism in Poland
N a t i o n a l B a n k o f P o l a n d
inflationary expectations are used. Those measures – defined in the equation [7] – according to a
long-run solution of the equation [6], gradually approach actual inflation.
The specification of equation [3] refers to error correction mechanism (ECM). Slightly
modified form of this relationship
8
relates the quarterly dynamics of foodstuffs prices to the core
inflation, quarterly dynamics of the oil price, lagged change of food prices as well as the relative
price of food in the previous period.
Oil price setting is defined in the equation [4]. It is assumed that changes in the oil price in
international markets (denominated in USD) as well as PLN/USD exchange rate movements are fully
passed into changes of the oil price denominated in domestic currency.
According to the identity [5], inflation, measured by the consumer price index (CPI), is a
weighted average of price changes of analysed items of the basket. Nowadays the proportion of
foodstuffs in the CPI basket accounts for 29.73% and the weight of oil for 3.71%.
9
The exchange rate in the small structural model of monetary transmission mechanism in
Poland is driven by the uncovered interest rate parity (UIP) condition, expressed in the equation [8].
It is formulated in terms of the real effective exchange rate and real interest rates, which – as far as
a measure of the real exchange rate used in the model is concerned – is equivalent to the analogous
rule expressed in nominal terms. Uncovered interest rate parity is often rejected in studies of
exchange rate movements, although there is little consensus on why it fails. However, Meredith and
Chinn (1998) using G-7 countries data show that the perverse relationship between interest rates
and exchange rates is a feature of the short-horizon data. They point out that in the short-run, the
failure of uncovered interest rate parity condition results from risk premium shocks, but in the long-
run exchange rate movements are driven by the "fundamentals", leading to a relationship between
interest rates and exchange rates consistent with UIP. A recent paper by Bekaert, Wei and Xing
(2002) concludes that deviations from uncovered interest rate parity are less pronounced than
previously documented and seem to be connected rather with currencies taken into account than
with the horizon.
There are two nominal exchange rates appearing in the small structural model of monetary
transmission mechanism in Poland: the nominal effective exchange rate and the USD/PLN exchange
rate. The arbitrage condition leads to the relationship [9], which relates the USD/PLN exchange rate
to the nominal effective exchange rate and the EUR/USD exchange rate, treated as exogenous
variable in the model.
10
The equation [10] is the monetary policy reaction function, based on the conventional Taylor
rule. The nominal interest rate depends on the difference between the model-consistent inflation
forecasts and the inflation target as well as on the output gap.
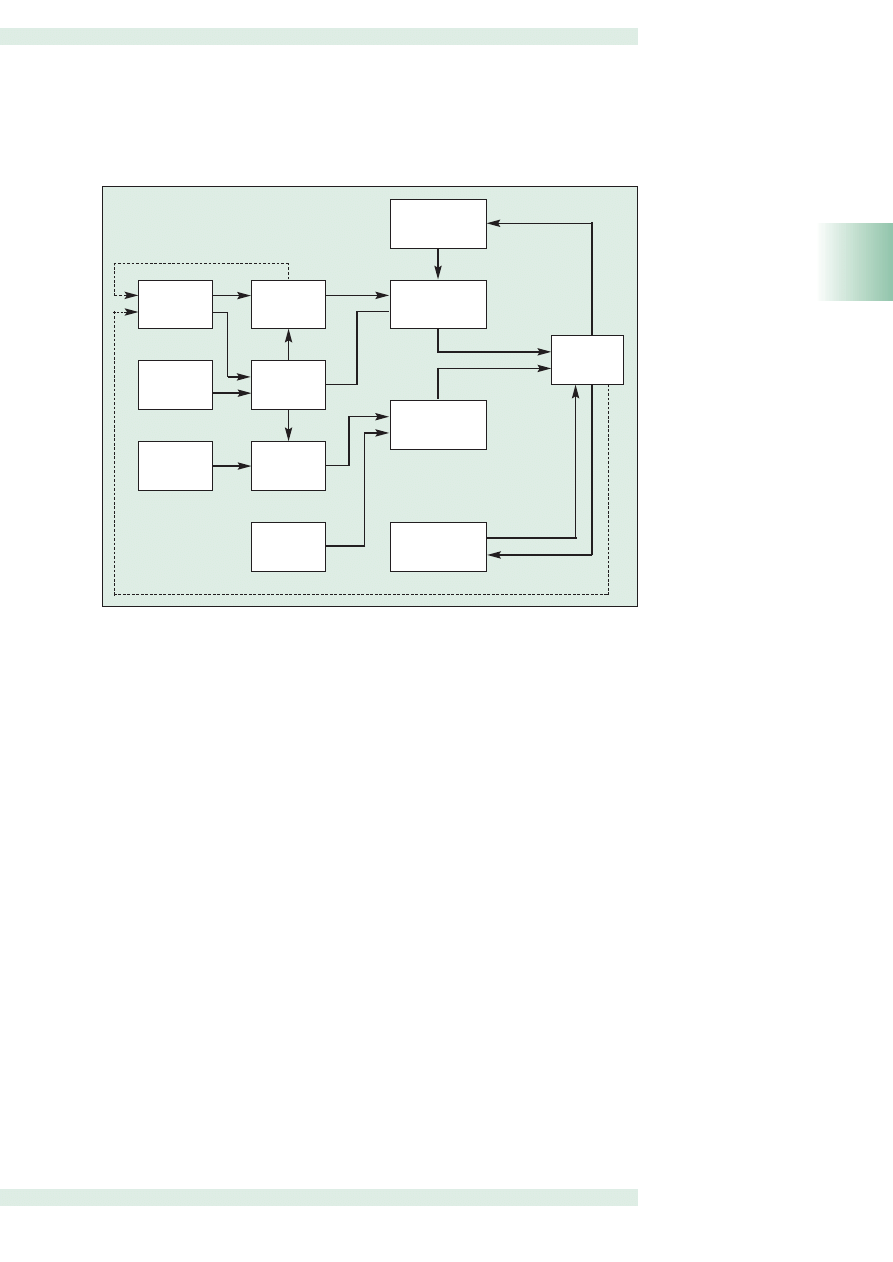
The scheme below (Scheme 1) presents basic interactions considered in the small structural
model of monetary transmission mechanism in Poland.
8
Using the condition [5], the general form of the equation [3]:
[a]
can be transformed into a following relationship:
[b]
9
In previous years the weight of foodstuffs in the CPI basket was equal to: 39.23% in 1995, 39.60% in 1996, 36.85%
in 1997, 36.27% in 1998, 31.62% in 1999, 30.45% in 2000 and 30.10% in 2001, while the weight of oil was equal
to: 2.68% in 1995, 2.50% in 1996, 2.61% in 1997, 2.50% in 1998, 2.43% in 1999, 2.79% in 2000 and 3.48% in 2001.
10
The equation [9] is derived and discussed in the Appendix 1.
π
α
α π α π
α
t
F
t
t
F
t
F
t
p
p
=
+
⋅ +
⋅
+
⋅
( )
−
( )
−
−
−
0
1
2
1
3
1
1
log
log
π
α
α
α
α
π
α
α
π
α
α
π
α
α
t
F
t
F
t
O
t
F
t
O
t
C
t
F
t
C
t
F
t
F
t
F
t
F
t
w
w
w
w
w
w
w
p
p
=
−
⋅
+
⋅
−
⋅
⋅
+
⋅
−
⋅
⋅
+
−
⋅
⋅
+
−
⋅
⋅
( )
−
( )
−
−
−
0
1
1
1
1
1
2
1
1
3
1
1
1
1
1
1
1
1
log
log
1
Small structural model of monetary transmission mechanism in Poland
MATERIA¸Y I STUDIA PAPER 26
9
Scheme 1. Small structural model of monetary transmission mechanism in Poland
Domestic
interest rate
Output gap
Core inflation
(excluding food-
stuffs and oil)
Dynamics
of oil prices
Dynamics
of food prices
Individuals’
inflationary
expectations
Effective
exchange rate
USD/PLN
exchange rate
Oil price
in international
markets (USD)
Foreign
interest rate
EUR/USD
exchange rate
Inflation
[10]
[10]
[1]
[2]
[2]
[1]
[8]
[8]
[9]
[9]
[4]
[4]
[2]
[6]
[5]
[5]
[5]
[3]

10
2
Indyviduals’ inflationery expectations in the small structural model of monetary transmission mechanism in Poland
N a t i o n a l B a n k o f P o l a n d
2
Individuals’ inflationary expectations in the small structural model
of monetary transmission mechanism in Poland
Individuals’ inflationary expectations play an important role in the small structural model of
monetary transmission mechanism in Poland. The relationship given by the equation [6] attempts
to explain their character, while the Phillips curve (equation [2]) enlightens how those measures
influence inflation.
Individuals’ inflationary expectations indices are quantified on the basis of Ipsos-Demoskop
survey with the use of adjusted Carlson and Parkin (1975) probability method. The survey question
concerning inflationary expectations is designed in a qualitative way, i.e. the respondents do not
give precise quantitative answers regarding inflation in future, but declare the expected direction
of change, comparing their foresights with current price movements. They respond to the following
question: "Given what is currently happening, do you believe that prices over next 12 months: (1)
will increase faster; (2) will increase at the same rate; (3) will increase at a slower rate; (4) will be
stable; (5) will fall; (6) I do not know". The adjusted Carlson and Parkin (1975) quantification
procedure assumes that individuals’ inflationary expectations are normally distributed as well as
that among respondents who choose point answers, i.e. options (2) and (4), there are agents
whose expectations fall within sensibility intervals centred on the current rate of inflation and a zero
rate of price changes respectively
11
.
Before substituting inflationary expectations’ measures into the Phillips curve of the small
structural model of monetary transmission mechanism in Poland, they are subject to an additional
correction. Starting from a general form of the equation [6], which can be written as:
[11]
adjusted indices of inflationary expectations, , which approach the actual inflation in a long-
run, are derived. This concept presupposes that even if expectations can be biased in a short-run,
a kind of learning process leads to a fulfilment of the rational expectations hypothesis in a long-
run
12
.
A long-run solution of the equation [11] can be written in the following manner:
[12]
The assumption that economic agents learn so that in a long-run their expectations gradually
approach actual inflation figures means that the coefficient in the above written equation
π
ϖ π
ϖ π
t
e
t
e
t
=
⋅
+
⋅
−
1
1
2
π
ϖ
ϖ
π
e
=
−
⋅
2
1
1
11
Detailed description of this approach can be found in: T. ¸yziak (2000).
12
A frequent assumption made in macroeconomics models is that inflationary expectations are rational, which means
that economic agents fully exploit all available information and do not make systematic forecast errors. In other words,
their expectations are unbiased and efficient predictors of current inflation: actual inflation is equal to expected inflation
on average and equal to expected inflation plus a random forecast error period by period. Empirical studies show that
Polish individuals’ inflationary expectations do not fulfil rational expectations hypothesis.
See: T. ¸yziak (2001), pp. 15-18; M. Brzoza-Brzezina. B. K∏os, A. Kot., T. ¸yziak (2002), pp. 33-36.
π
e
ϖ
ϖ
2
1
1
−

2
Indyviduals’ inflationery expectations in the small structural model of monetary transmission mechanism in Poland
SYSTEM P¸ATNICZY W POLSCE PAPER 26
11
should be equal to 1. The estimation of the equation [6] on Polish data does not produce such a
value (parameters and are equal, respectively, to: 0.82 and 0.13).
Assuming that the adjusted measures of individuals’ inflationary expectations, which meet
the rational expectations hypothesis in a long-run, are proportional to indices obtained from the
quantification procedure:
[13]
the equation [12] can be transformed in the following way:
[14]
Since the adjusted measure of individuals’ inflationary expectation is supposed to approach
actual inflation in a long-run, the coefficient should be equal to , i.e. 0.72.
There are two major reasons for adjusting individuals’ inflationary expectations in the above
presented manner. The first one refers to a theoretical assumption that the inflation-output trade-
off appears only in a short time, while in a long-run the Phillips curve is vertical, i.e. there is no long-
run relationship between the output gap and inflation. This feature imposes so-called dynamic
homogeneity restriction on the right hand side of the Phillips curve, which means that coefficients
on all nominal variables (price indices, expectations, exchange rate) should sum to one
13
. Adjusted
measures of Polish individuals’ inflationary expectations make the dynamic homogeneity property
accepted more easily relative to unadjusted ones. Another reason implying the need of such an
adjustment refers to a notion that not only the character of individuals’ inflationary expectations,
but also measurement errors may lead to a conclusion that the rational expectations hypothesis is
not fulfilled even in a long-run
14
. There are two types of measurement errors, namely quantification
errors and survey errors. The first category refers to the procedure of quantification implemented,
namely to errors generated by assumptions of the adjusted Carlson and Parkin (1975) method. The
second category contains errors covering the extent, to which the sample of respondents is
statistically not fully representative as well as those resulting from possible misunderstanding of the
survey question and options of answer. For instance, it seems that some of respondents’ opinions
reflect rather the scenario they are afraid of than the one which in their view is the most probable,
therefore the measure of expectations obtained from the quantification procedure may be biased.
The concept of inflationary expectations approaching actual inflation in a long-run is pictured
below (Figure 1). It is assumed that at the starting point inflationary expectations are 1 percentage
point above the actual inflation and in successive periods they follow a rule:
[15]
The sum of coefficients on the right hand side of the equation [15] is equal to 1, thus in a
long-run inflationary expectations reach the level of actual inflation. The speed of adjustment
depends on the coefficient : the higher is , the quicker is the learning process.
π
δ π
t
e
t
e
= ⋅
π
ϖ
ϖ δ
π
e
=
−
(
)
⋅
⋅
2
1
1
ϖ
1
ϖ
2
δ
ϖ
ϖ
2
1
1
−
13
See: Bank of England (1999), pp. 77-82; 99.
14
It should be noted that majority of international studies on survey measures of inflationary expectations conclude
that those expectations are not rational. References to studies on the character of survey measures of inflationary
expectations are listed in: T. ¸yziak (2001), p. 18.
π
ρ π
ρ π
t
e
t
e
t
= −
(
)
⋅
+ ⋅
−
1
1
ρ
ρ

12
2
Indyviduals’ inflationery expectations in the small structural model of monetary transmission mechanism in Poland
N a t i o n a l B a n k o f P o l a n d
Figure 1. Inflationary expectations approaching the actual inflation ex-post in the long
run
* – value of parameter
in Poland.
According to response functions presented above, if the coefficient
is equal to 1,
inflationary expectations, after a temporary shock pushing them above the actual inflation ex-post,
adjust immediately in the next quarter. If the value of the coefficient
amounts to 0.5, the learning
process takes approximately 6 periods, while when it is equal to 0.18 (like in the Polish case
15
),
inflationary expectations approach actual inflation after 5 years. If
oscillates around 0.1, the
adjustment process takes as many as 9 years.
ρ
ρ
ρ
ρ
15
According to the equation [14], the coefficient in Poland is equal to , i.e. 0.18.
0
2
4
6
8 10 12 14 16 18 20 22 24 26 28 30 32 34 36 38 40 42 44 46 48 50 52 54 56 58
=0.1
=0.18*
=0.5
=1
0.0
0.1
0.2
0.3
0.4
0.5
0.6
0.7
0.8
0.9
1.0
%
quarter after the rise of inflationary expectations above the actual inflation ex-post
ρ
ϖ
δ
2
ρ
ρ
ρ
ρ

3
Monetary transmission mechanism in Poland
MATERIA¸Y I STUDIA PAPER 26
13
3
Monetary transmission mechanism in Poland
– new empirical findings
In order to characterize the strength and the speed of monetary transmission mechanism in
Poland, a simulation describing the pass-through of the interest rate impulse is run
16
. It is assumed
that there is an unexpected rise in the short-term interest rate controlled by the central bank, which
lasts four quarters. Within this period the monetary policy reaction function is fixed, while in
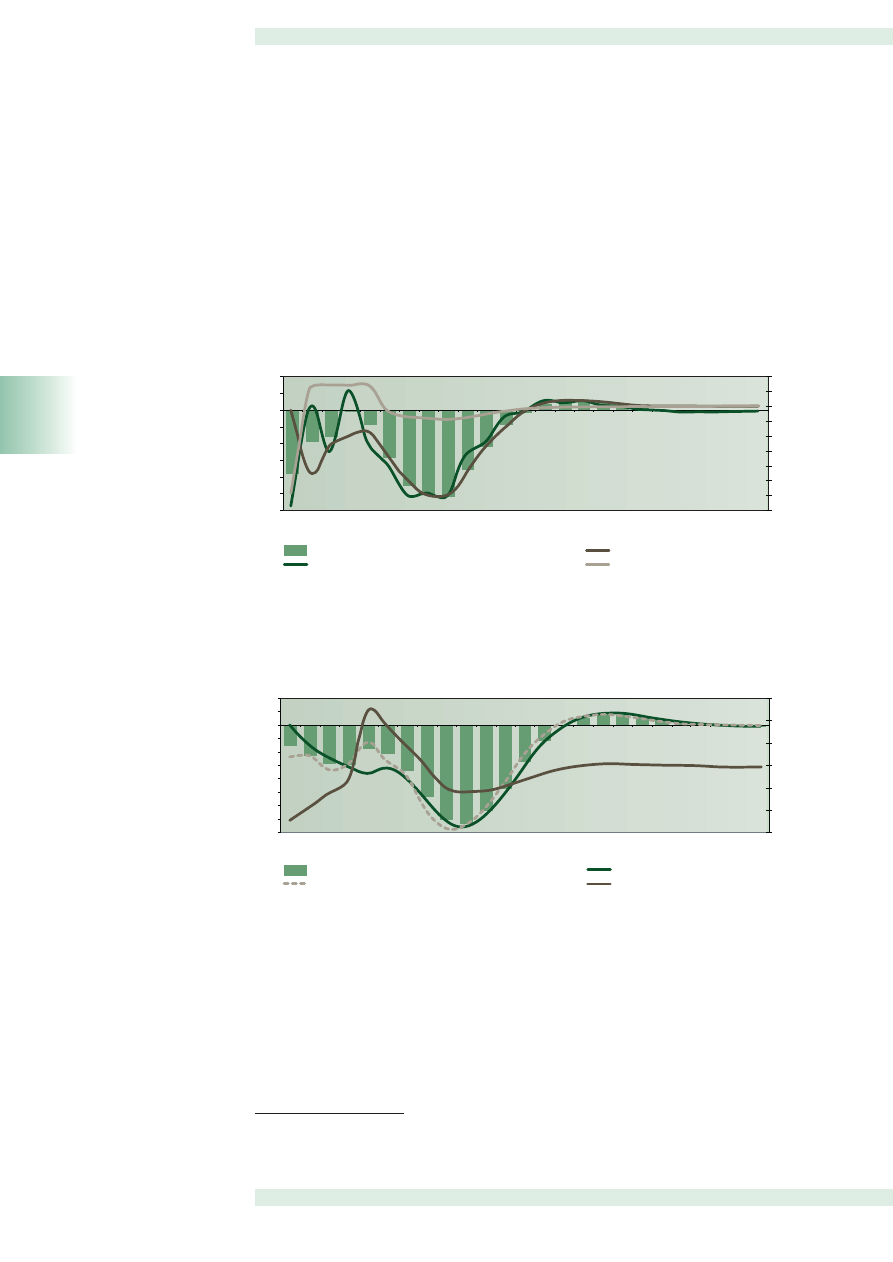
subsequent quarters monetary authorities follow the Taylor rule. The figure below (Figure 2)
presents the impulse responses of selected variables to such an impulse.
Figure 2. Response functions of selected variables to the interest rate impulse
The real effective exchange rate reacts immediately after the interest rate impulse. Its
appreciation amounts to more than 1% in the quarter, when the interest rate impulse is imposed
and then gradually disappears. The maximum fall in the output gap, equal to 0.2 percentage point,
takes place in the second and the third quarter after the interest rate impulse. According to
response functions presented above, after four quarters of the monetary policy tightening, interest
rates are reduced below their benchmark level along with the Taylor rule.
Response functions of quarterly and annual price dynamics are double-dip-shaped. The first
fall in inflation reflects direct effects of the exchange rate channel (a reduction of import prices
expressed in domestic currency), while the second one is caused by a joint operation of the interest
rate channel and the bank–lending channel, amplified by indirect effects of the exchange rate
channel. The influence of the monetary policy impulse on quarterly inflation reaches its momentum
in the seventh and eighth quarter after the impulse, when the quarterly inflation is reduced by 0.1
percentage point relative to the benchmark path. The maximum fall in annual inflation is equal to
0.35-0.4 percentage point and takes place in the eighth and ninth quarter after the interest rate
impulse.
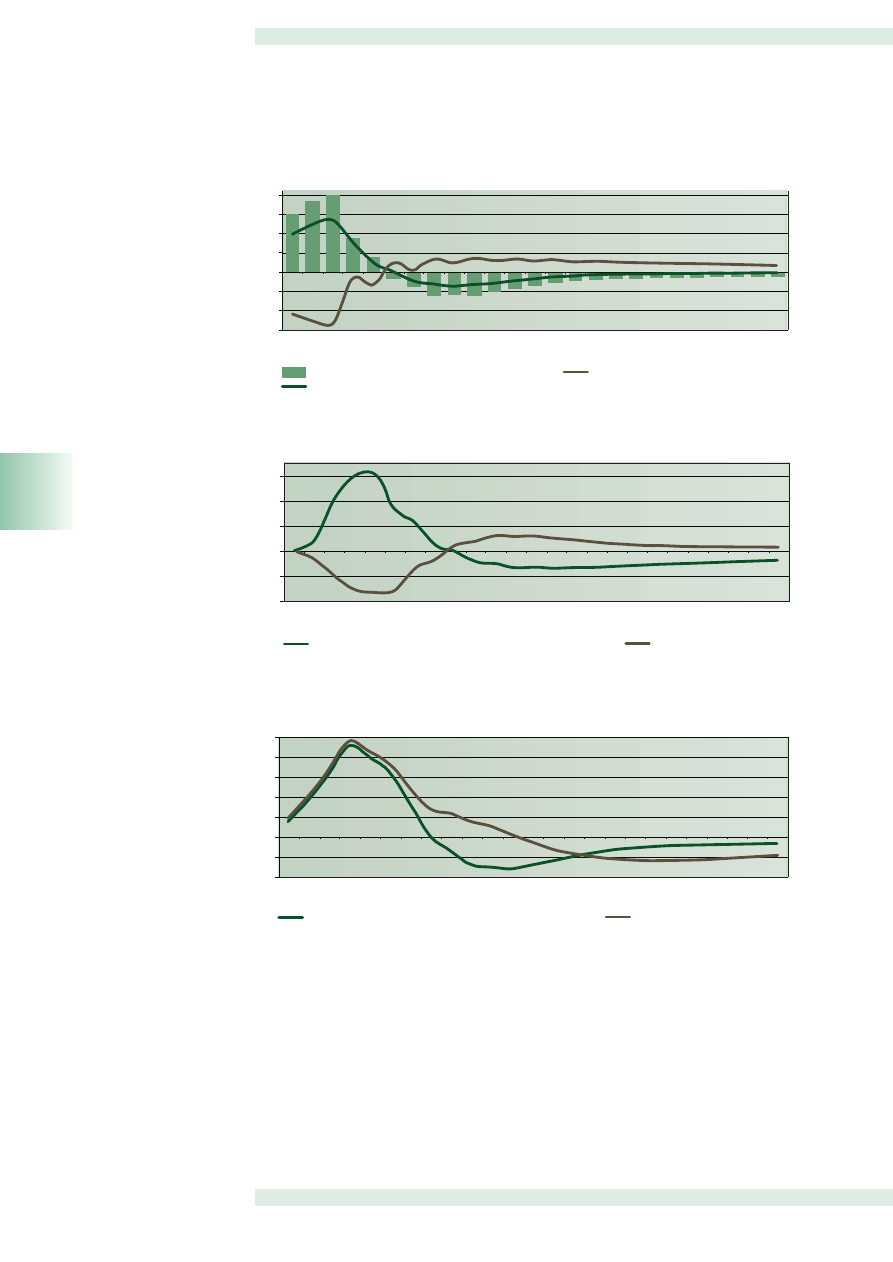
Successive figures (Figure 3, Figure 4) present how price indices of selected items of
consumer basket, i.e. foodstuffs, oil and remaining items, react to the interest rate impulse. As it
can be noted, prices of oil and food respond immediately to the monetary policy impulse.
According to the equation [4], oil price dynamics is linked directly to the PLN/USD exchange rate,
thus it is obvious that its adjustment to interest rate changes is very quick. As far as food price
changes are concerned, the equation [3] suggests that they react rapidly to price movements of
-0.4
0
1
2
3
4
5
6
7
8
9
10
11
12
13
14
15 16
17 18
19
20
21
22
23
24
-0.3
-0.2
-0.1
0.0
0.1
0.2
0.3
%
-0.4
-0.2
0.0
0.2
0.4
0.6
0.8
1.0
1.2
%
output gap (left axis)
real effective exchange rate (right axis)
quarterly inflation (left axis)
interest rate in quarterly terms (left axis)
annual inflation (left axis)
quarter after the interest rate impulse
16
Winsolve 3.50.5 software was used.
14
3
Monetary transmission mechanism in Poland
N a t i o n a l B a n k o f P o l a n d
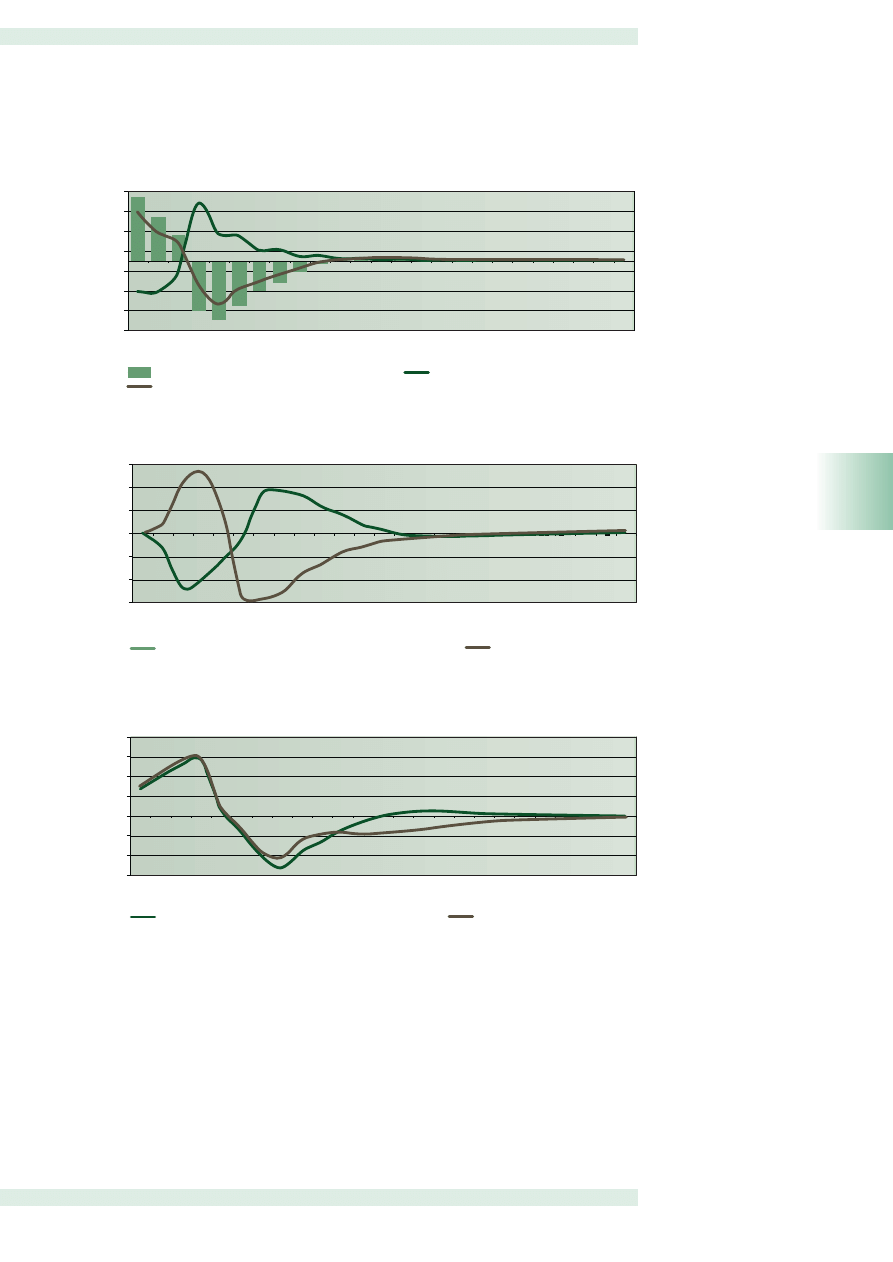
remaining consumer basket items, including oil prices. This link substitutes – at least to some extent
– another relationship, which is not included explicitly in the small structural model of monetary
transmission mechanism in Poland, namely the impact of exchange rate movements on food prices.
Previous studies have shown that this impact is fairly strong
17
. Price indices of remaining items of
the consumer basket, respond to the interest rate impulse both through the impact of exchange
rate changes on import prices denominated in the domestic currency as well as due to a reduction
in the demand pressure in the economy.
Figure 3. Response functions of quarterly dynamics of food prices, oil price and
remaining items of the CPI basket to the interest rate impulse
Figure 4. Response functions of annual dynamics of food prices, oil price and remaining
items of the CPI basket to the interest rate impulse
0
1
2
3
4
5
6
7
8
9
10
11
12
13
14
15 16
17 18
19
20
21
22
23
24
-0.12
-0.10
-0.08
-0.06
-0.04
-0.02
0.00
0.02
0.04
%
-1.4
-1.2
-1.0
-0.8
-0.6
-0.4
-0.2
0.0
0.2
0.4
%
quarterly dynamics of food prices (left axis)
quarterly core inflation (left axis)
quarterly inflation (left axis)
quarterly dynamics of oil prices (right axis)
quarter after the interest rate impulse
0
1
2
3
4
5
6
7
8
9
10
11
12
13
14
15 16
17 18
19
20
21
22
23
24
-0.40
-0.35
-0.30
-0.25
-0.20
-0.15
-0.10
-0.05
-0.00
0.05
0.10
%
%
-1.5
-1.0
-0.5
0.0
0.5
1.0
1.5
annual dynamics of food prices (left axis)
annual core inflation (left axis)
annual inflation (left axis)
annual dynamics of oil prices (right axis)
quarter after the interest rate impulse
17
See: R. Kokoszczyƒski [ed.] (1999), p. 41.

4
Supply shocks and the reaction of monetary Policy
MATERIA¸Y I STUDIA PAPER 26
15
4
Supply shocks and the reaction of monetary policy
Understanding the monetary transmission mechanism, which in transition economies is
subject to permanent changes, constitutes a crucial factor conditioning the effectiveness of
monetary policy. However even a deep insight in monetary transmission channels and stages is not
sufficient to make the central bank capable to meet pre-announced objectives of monetary policy.
Polish experiences clearly show that supply shocks, such as unexpected changes of oil price in
international markets or movements in food prices – given the composition of the consumer basket
– may have a grave impact on inflation. Hence it is important to analyse the effects of supply shocks
on price movements in the economy and to verify whether the monetary policy should react to
temporary supply shocks to constrain their second-round effects (increase of inflationary
expectations and of the pressure on wages).
In order to address those issues, supply shocks simulations are run on the basis of the small
structural model of monetary transmission mechanism in Poland. In the food price shock it is
assumed that the impulse is equal to 1 percentage point, uniformly distributed throughout
subsequent four quarters. In the oil price shock it is supposed that within one quarter the prices of
the oil barrel in international markets go up by 1% relative to the benchmark level. In those
simulations two scenarios of the monetary policy response to a temporary supply shock are taken
into account: monetary authorities either follow the Taylor rule, tightening the interest rate policy
after the shock (monetary policy active) or do not react to the shock (monetary policy passive).
Response functions of selected variables to supply shocks conditioned on the reaction of monetary
policy are presented in figures below.
16
4
Supply shocks and the reaction of monetary Policy
N a t i o n a l B a n k o f P o l a n d
Figure 5. Response of the interest rate and the real exchange rate to a rise in food prices
Figure 6. Response of the output gap to a rise in food prices
Figure 7. Response of annual inflation to a rise in food prices
0
1
2
3
4
5
6
7
8
9
10
11
12
13
14
15 16
17 18
19
20
21
22
23
24
-0.04
-0.02
0.00
0.02
0.04
0.06
%
output gap (active monetary policy)
output gap (passive monetary policy)
quarter after the impulse of food prices
0
1
2
3
4
5
6
7
8
9
10
11
12
13
14
15 16
17 18
19
20
21
22
23
24
-0.2
-0.1
0.0
0.1
0.2
0.3
0.4
0.5
%
annual inflation (passive monetary policy)
annual inflation (active monetary policy)
quarter after the impulse of food prices
0
1
2
3
4
5
6
7
8
9
10
11
12
13
14
15 16
17 18
19
20
21
22
23
24
-0.15
-0.10
-0.05
0.00
0.05
0.10
0.15
0.20
%
real effective exchange rate (passive monetary policy)
real effective exchange rate (active monetary policy)
interest rate (active monetary policy)
quarter after the impulse of food prices
4
Supply shocks and the reaction of monetary Policy
MATERIA¸Y I STUDIA PAPER 26
17
Figure 8. Response of the interest rate and the real exchange rate to a rise in the oil price
Figure 9. Response of the output gap to a rise in the oil price
Figure 10. Response of annual inflation to a rise in the oil price
0
1
2
3
4
5
6
7
8
9
10
11
12
13
14
15 16
17 18
19
20
21
22
23
24
-0.07
-0.05
-0.03
-0.01
0.01
0.03
0.05
0.07
%
real effective exchange rate (active monetary policy)
real effective exchange rate (passive monetary policy)
interest rate (active monetary policy)
quarter after the impulse of oil price
0
1
2
3
4
5
6
7
8
9
10
11
12
13
14
15 16
17 18
19
20
21
22
23
24
-0.015
-0.010
-0.005
0.000
0.005
0.010
0.015
%
output gap (active monetary policy)
output gap (passive monetary policy)
quarter after the impulse of oil price
0
1
2
3
4
5
6
7
8
9
10
11
12
13
14
15 16
17 18
19
20
21
22
23
24
-0.15
-0.10
-0.05
0.00
0.05
0.10
0.15
0.20
%
annual inflation (passive monetary policy)
annual inflation (active monetary policy)
quarter after the impulse of oil price

18
4
Supply shocks and the reaction of monetary Policy
N a t i o n a l B a n k o f P o l a n d
The maximum impact of the food price impulse on annual inflation appears in the third
quarter after the impulse and amounts to 0.45-0.5 percentage point. The maximum reaction of
annual inflation to the oil price shock takes place in the third quarter after the shock and amounts
to 0.15 percentage point. It should be underlined that the maximum reaction of annual inflation
to both supply shocks does not depend substantially upon the scenario of the monetary authorities’
reaction. Given the delays in the Polish monetary transmission mechanism, differences between
annual inflation impulse responses assuming active and passive monetary policy begin to be more
evident (especially as far as the food price shock is concerned) after the seventh quarter after the
impulse. Despite of the fact that in a shorter horizon the increase of interest rates in the active
monetary policy scenario does not affect inflation considerably, it has adverse effects on the real
sector of the economy, reflected in a fall in the output gap. In contradistinction to the active
monetary policy scenario, in the passive one the real effective exchange rate depreciation, caused
by a fall in real interest rates, pushes the output gap up.
Taking as a criterion the impact of monetary policy on price behaviour, it seems that the
effectiveness of responding actively to temporary supply shocks is rather constrained. Obviously
stronger reactions of the interest rate policy than those imposed by the Taylor rule could generate
better effects, however they would be accompanied by a larger fall in the output below its potential
level.

5
Conclusions
MATERIA¸Y I STUDIA PAPER 26
19
5
Conclusions
The version of the small structural model of monetary transmission mechanism in Poland
presented in this paper was estimated on an updated and shortened sample period relative to the
primary version of the model. Although the bank-lending channel, which constituted a focus point
in the previous version of the model, is not addressed separately in the actual one, nevertheless the
treatment of the exchange rate channel seems to be much more complete. Both its direct and
indirect (demand) effects are explicitly captured. Moreover, in the recent version of the model, price
dynamics of different items of the consumer basket is modelled disjointedly.
Due to vigorous structural, institutional and behavioural changes in the Polish economy, the
monetary transmission mechanism is under ongoing evolution. Elasticities, lags and the character
of different relationships within the chain of interactions between the nominal interest rate and
inflation change instantaneously.
It seems that in the new version of the small structural model of monetary transmission
mechanism in Poland the statistical significance of the output gap in fundamental relationships
suggested by the theory of macroeconomics has increased. Response functions pictured below
(Figure 11) suggest that the maximum reaction of the demand pressure in the economy to the
interest rate impulse takes place earlier (in the third quarter after the interest rate impulse – like in
the UK Batini and Haldane (1999) model
18
) than it resulted from previous studies (the sixth quarter
after the impulse). On the other hand, the reaction of the output gap in the new version of the
model seems to be smaller than in the primary one. However, it does not mean that the second
stage of monetary transmission mechanism – i.e. the relationship between the interest rate and the
aggregate demand – has become weaker. It rather reflects different measures of the output gap
used in the primary version of the model and in the recent one
19
.
Figure 11. Response functions of the output gap to the interest rate impulse in Poland
(primary and new version of the small structural model of monetary transmission
mechanism: MSMTM 2001, MSMTM 2002) and in the UK
18
See: L. Mahadeva, P. Sinclair [ed.] (2001).
19
In the primary version of the model the output gap was estimated on the basis of GDP figures covering years 1992-
1999, while in the recent one: 1994-2001. The recently used measure of the output gap is relatively less volatile,
therefore the impact of analogous interest rates changes on it seems to be smaller, while its influence on inflation
stronger than previously.
0
1
2
3
4
5
6
7
8
9
10
11
12
13
14
15 16
17
18
19
20
21
22 23
24
25
-0.8
-0.7
-0.6
-0.5
-0.4
-0.3
-0.2
-0.1
0.0
0.1
0.2
0.3
%
UK
Poland (MSMTM 2002)
Poland (MSMTM 2001)
quarter after the interest rate impulse
20
5
Conclusions
N a t i o n a l B a n k o f P o l a n d
Taking into consideration the relationship between interest rates and inflation, it occurs that
the monetary transmission mechanism gradually becomes stronger than in the past. The response
function of annual inflation to the interest rate impulse obtained from the new version of the small
structural model lies between the response function obtained from the primary version of the
model and the impulse response from the UK Batini and Haldane (1999) model. Interpreting those
results one should bear in mind that they probably reflect not exclusively the evolution of monetary
transmission mechanism itself, but also changes in the model structure. Those changes, including
the update of the sample period, could make data problems, affecting the model picture of the
propagation of monetary impulses in Poland, less important than previously.
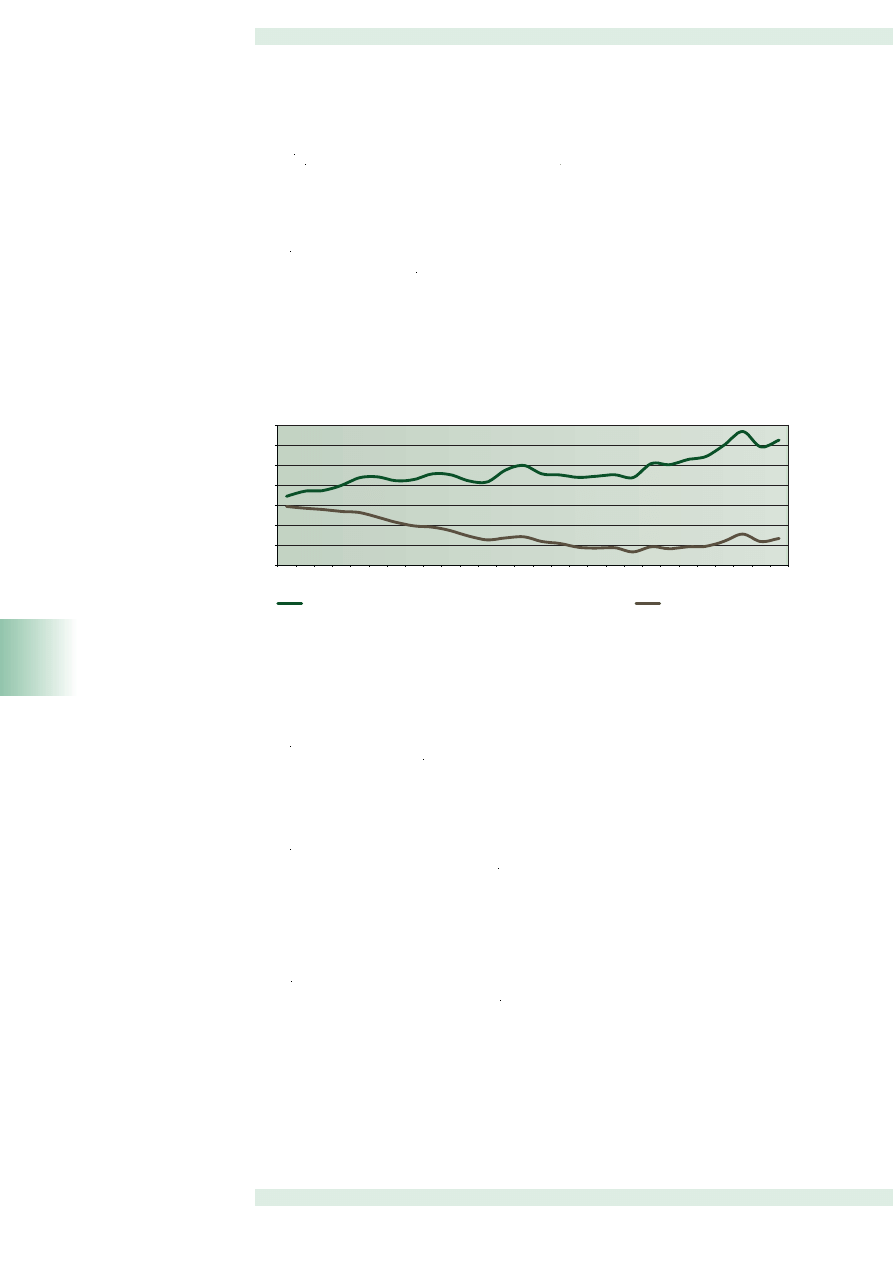
Figure 12. Response functions of annual inflation to the interest rate impulse in Poland
(primary and new version of the small structural model of monetary transmission
mechanism: MSMTM 2001, MSMTM 2002) and in the UK
The maximum fall in annual inflation resulting from the previous version of the small
structural model of monetary transmission mechanism in Poland, was equal to 0.2 percentage
point, while in the recent one it amounts to 0.35-0.4 percentage point. Though the maximum
reaction of annual inflation in both versions of the model takes place in the ninth quarter after the
interest rate impulse, it should be noted that also in a shorter horizon, i.e. until the fourth quarter
after the impulse, the response of price dynamics obtained from the new version of the model is
substantially stronger than in previous studies.
On the other hand the monetary transmission mechanism in Poland still seems to be relatively
weak and slow relative to developed economies. The maximum reaction of annual inflation in
Poland is twice lower and twice slower than in the United Kingdom. Simulations presented in this
paper suggest that due to long lags in the monetary transmission mechanism in Poland, the
monetary policy is rather inefficient in responding to temporary supply shocks.
0
1
2
3
4
5
6
7
8
9
10
11
12
13
14
15 16
17
18
19
20
21
22 23
24
-0,8
-0,7
-0,6
-0,5
-0,4
-0,3
-0,2
-0,1
-0,0
0,1
p.p.
25
UK
Poland (MSMTM 2002)
Poland (MSMTM 2001)
quarter after the interest rate impulse

6
Appendix 1
MATERIA¸Y I STUDIA PAPER 26
21
6
Appendix 1: Measuring the nominal and real effective exchange rate
In the new version of the small structural model of monetary transmission mechanism in
Poland a measure of the nominal effective exchange rate , based on EUR/PLN and
USD/PLN exchange rates is used. According to a convention applied, the exchange rate
is defined as a number of units of foreign currency per one unit of domestic currency. Hence the
rise in the exchange rate is the appreciation of the domestic currency.
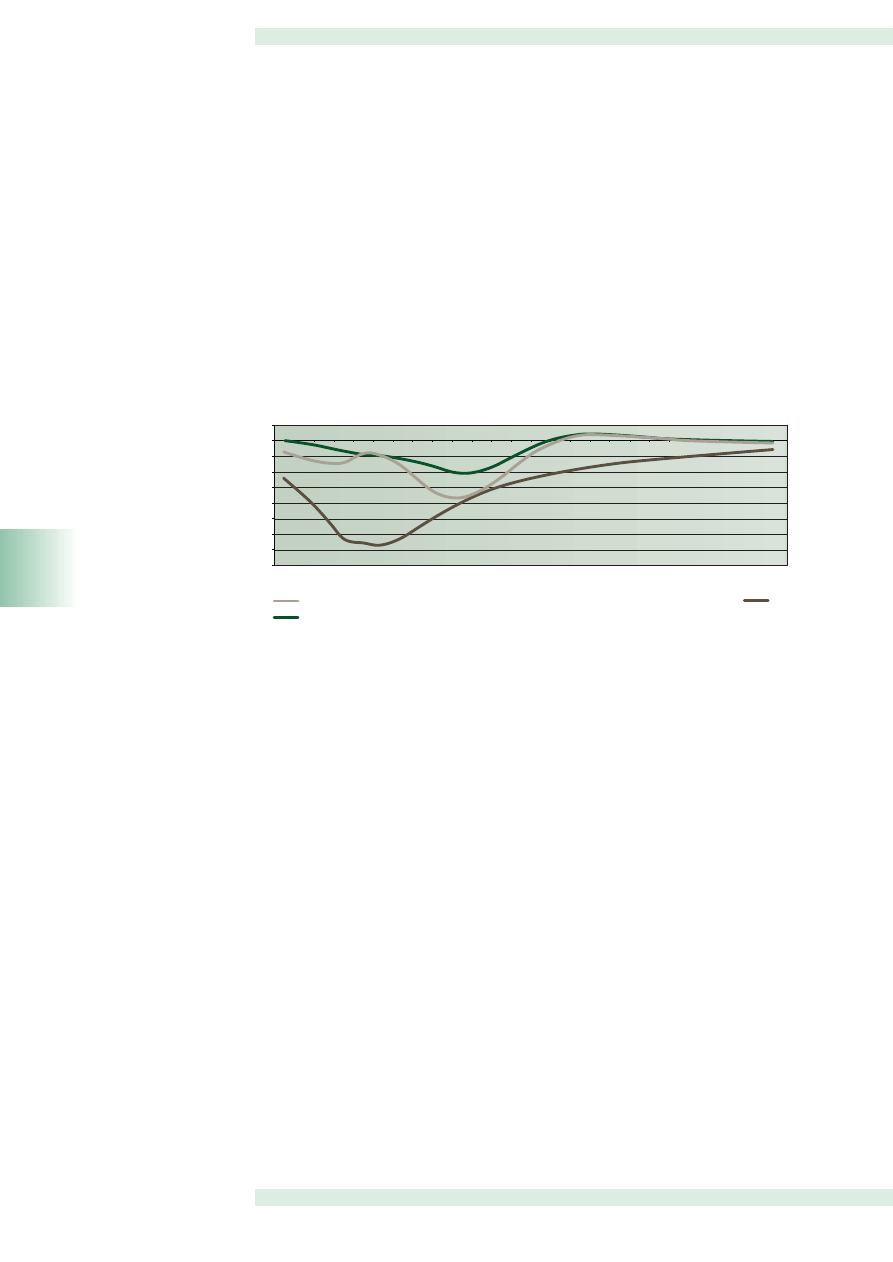
The nominal effective exchange rate is calculated as a weighted average of bilateral exchange
rates. Ellis (2001) points out that even if the arithmetic average is more familiar, there are strong
theoretical and statistical reasons to prefer the geometric average. In contradistinction to geometric
averages, percentage movements in the arithmetic indices differ in magnitude depending on
whether bilateral exchange rates are expressed as units of domestic currency per foreign currency
unit or the other way around. In addition, the logarithm of a geometric average is the arithmetic
average of logarithms of bilateral exchange rates. This is a particularly useful feature, which
simplifies the modelling
20
.
Therefore the nominal effective exchange rate used in the small structural model of monetary
transmission mechanism in Poland is defined in the following way:
[16]
where and denote arbitrarily chosen weights, reflecting a currency structure of interna-
tional trade and summing to 1:
[17]
The equation [16] can be transformed into a logarithmic form. After substituting the
condition [17] into [16], it can be written as:
[18]
Defining the nominal effective exchange rate it is assumed that and
The real effective exchange rate is the nominal effective exchange rate adjusted for relative
price levels:
[19]
e
e
e
n
EUR PLN w
USD PLN w
EUR
USD
=
(
)
⋅
(
)
/
/
w
w
EUR
USD
+
=
1
log
log
log
/
/
e
w
e
w
e
n
EUR
EUR PLN
EUR
USD PLN
( )
=
⋅
(
)
+ −
(
)
⋅
(
)
1
w
EUR
w
USD
w
EUR
=
0 75
.
w
USD
=
0 25
.
e
EUR PLN
/
(
)
e
n
( )
e
EUR PLN
/
(
)
e
e
P
P
r
n
= ⋅
∗
20
L. Ellis (2001), pp. 3-4.
22
6
Appendix 1
N a t i o n a l B a n k o f P o l a n d
where denotes the level of domestic prices while the level of foreign prices, calculated as a
weighted average of price levels in the Economic and Monetary Union and in the United States.
Weights used to compute the foreign price level are exactly the same as those used while
calculating the nominal effective exchange rate:
[20]
The nominal effective exchange rate and the real effective exchange rate computed in a
manner described above are presented below (Figure 13).
Figure 13. Nominal and real effective exchange rate in Poland (1995-2001)
There are two nominal exchange rates appearing in the small structural model of monetary
transmission mechanism in Poland: the nominal effective exchange rate as well as the USD/PLN
exchange rate. The arbitrage condition leads to the relationship [21]:
[21]
which is equivalent to a condition as follows:
[22]
Substituting the equation [22] into the equation [18] one can derive the following
relationship:
[23]
The equation [23] is applied in the small structural model of monetary transmission in Poland
to determine changes in the USD/PLN exchange rate reflecting movements in the nominal effective
exchange rates, caused by exogenous disturbances or the operation of the uncovered interest rate
parity condition.
0,20
1995.1
1995.
3
199
6
.1
199
6
.3
199
7
.1
199
7
.3
199
8
.1
199
8
.3
1999.1
1999.
3
2000
.1
2000
.3
200
1.1
200
1.
3
0,25
0,30
0,35
0,40
0,45
0,50
0,55
nominal effective exchange rate
real effective exchange rate
e
e
e
EUR PLN
EUR USD
USD PLN
/
/
/
=
⋅
log
log
log
/
/
/
e
e
e
EUR PLN
EUR USD
USD PLN
(
)
=
(
)
+
(
)
P
P
∗
P
P
P
EUR w
USD w
EUR
USD
∗
=
( )
⋅
( )
log
log
log
/
/
e
e
w
e
USD PLN
n
EUR
EUR USD
(
)
=
( )
−
⋅
(
)

7
Appendix 2
MATERIA¸Y I STUDIA PAPER 26
23
7
Appendix 2: Basic diagnostics of the model’s equations
Aggregate demand curve – equation [1]
TSLS
Sample: 1997.1-2002.1
R
2
: 0.82
R
2
adjusted: 0.78
DW: 2.10
Phillips curve – equation [2]
OLS
Sample: 1995.1-2001.4
R
2
: 0.89
R
2
adjusted: 0.88
DW: 1.77
The value of intercept was imposed in order to make the sign of the coefficient on the real effective
exchange rate consistent with the theory. To avoid excessive subjectivism, the choice of this value was
done in two steps. In the first one, the Phillips curve was estimated without the real effective exchange
rate. In the second step the equation [2] was estimated in its above written form with such a value of
intercept, which made the coefficient on the output gap equal to that one from the estimation within
the first step. Since the real effective exchange rate is used to capture direct effects of the exchange
rate channel, its appearance in the Phillips curve should not change the output gap coefficient.
Food price dynamics – equation [3]
OLS
Sample: 1997.1-2002.1
R
2
: 0.76
R
2
adjusted: 0.74
DW: 2.02
Individuals’ inflationary expectations – equation [6]
OLS
Sample: 1997.1-2001.4
R2: 0.95
R2 adjusted: 0.94
DW: 2.21
log
log
.
.
log
log
.
.
log
( .
)
( .
)
( .
)
y
y
y
y
i
e
t
t
t
t
t
r
t
r
( )
−
( )
= −
+
⋅
( )
−
( )
−
⋅
−
⋅
( )
∗
−
−
∗
−
−
0 07
0 41
0 32
0 09
0 15
1
1
0 15
2
0 02
1
π
π
t
C
t
e
t
t
t
r
y
y
e
s
= −
+
+
⋅
( )
−
( )
−
⋅
( )
+
⋅
−
−
∗
−
0 02
0 34
0 02
0 01
0 12
3
3
0 00
1
0 00
1
.
.
log
log
.
log
.
( .
)
( .
)
( .
)
( )
π
π
π
t
F
t
t
F
t
F
t
p
p
= −
+
⋅ −
⋅
−
⋅
( )
−
( )
(
)
−
−
−
0 02 1 48
0 48
0 11
0 09
0 09
1
0 05
1
1
.
.
.
.
log
log
( .
)
( .
)
( .
)
π
π
π
t
e
t
e
t
=
⋅
+
⋅
−
0 82
0 13
0 05
1
0 05
.
.
( .
)
( .
)

24
8
References
N a t i o n a l B a n k o f P o l a n d
8
References
Bank of England (1999): Economic models at the Bank of England. London.
Batini N., Haldane A. (1999): Forward-looking rules for monetary policy. Bank of England Working
Paper, No. 91, January.
Bekaert G., Wei M., Xing Y. (2002): Uncovered interest rate parity and the term structure. NBER
Working Paper, No. 8795, February.
Bernanke B. S., Blinder A. S. (1988): Credit, money and aggregate demand. In: „American Economic
Review", No. 78, May, pp. 435-439.
Brzoza-Brzezina M., K∏os B., Kot A., ¸yziak T. (2002): Hipoteza neutralnoÊci pieniàdza [Money
neutrality hypothesis]. „Materia∏y i Studia”, No. 142, National Bank of Poland.
Ehrmann M. (2000): Comparing monetary policy transmission across European countries. In:
„Weltwirtschaftliches Archiv. Review of World Economics". Kiel Institute of World Economics, Tübingen.
Ellis L. (2001): Measuring the real exchange rate: pitfalls and practicalities. Research Discussion
Paper 2001-04, Reserve Bank of Australia, August.
Freitas P. S., Muinhos M. K. (2001): A simple model for inflation targeting in Brazil. Working Paper
Series, No. 18, Banco Central do Brasil, April.
Kokoszczyƒski R. [ed.] (1999): Mechanizm transmisji impulsów polityki pieni´˝nej: przeglàd
g∏ównych teorii oraz specyfikacja transmisji w Polsce [Monetary transmission mechanism in Poland.
Review of principal theories and specification of the transmission in Poland]. „Materia∏y i Studia",
No. 91, National Bank of Poland.
¸yziak T. (2000): Badanie oczekiwaƒ inflacyjnych podmiotów indywidualnych na podstawie ankiet
jakoÊciowych [Examination of individuals’ inflationary expectations on the basis of qualitative
surveys]. In: „Bank i Kredyt”, No. 6, National Bank of Poland.
¸yziak T. (2001): Monetary transmission mechanism in Poland. Theoretical concepts vs. evidence.
NBP Paper, No. 19, National Bank of Poland, March.
Mahadeva L., Sinclair P. (2001): The transmission mechanism of monetary policy. Material prepared
for the Central Bank Governors’ Symposium at the Bank of England on 8 June 2001, Centre for
Central Banking Studies, typescript.
McCallum B., Nelson E. (1999): An optimising IS-LM specification for monetary policy and business
cycle analysis. In: „Journal of Money, Credit and Banking", No. 31
Meredith G., Chinn M. D. (1998). Long-horizon uncovered interest rate parity. NBER Working Paper,
No. 6797, November.
Muinhos M. K. (2001): Inflation targeting in an open financially integrated emerging economy: the
case of Brazil. Working Paper Series, No. 26, Banco Central do Brasil, August.
Razzak W. A. (2002). Monetary policy and forecasting inflation with and without the output gap.
DP2002/03, Reserve Bank of New Zealand, March.
Svensson L. E. O. (1998). Open-economy inflation targeting. „Journal of International Economics",
No. 50 (2000), pp. 155-183.
Woodford M. (2002): Interest and Prices. Foundations of a Theory of Monetary Policy, Princeton
University Press, forthcoming.
Wyszukiwarka
Podobne podstrony:
antropomotoryka 26 2004 id 6611 Nieznany (2)
26 33 id 31365 Nieznany (2)
Active Listening en id 51008 Nieznany (2)
BPMN2 0 Poster EN id 92566 Nieznany (2)
mizan Z2 MECH EN id 778695 Nieznany
Agenda en id 52847 Nieznany (2)
55 en id 41488 Nieznany
cat 6AD en id 108772 Nieznany
iecp en id 209519 Nieznany
26 749 e id 31367 Nieznany
Kolo E4 26 maj id 239780 Nieznany
26 Wskazniki w C id 31425 Nieznany (2)
KS SF 12 006 EN id 252123 Nieznany
7 ZKM marzec 26 2012 id 45512 Nieznany
Makros powerPLmC E30 en id 1627 Nieznany
lab11 RapidPrototyping EN id 25 Nieznany
iteiit21v9n1 en id 220860 Nieznany
DVP rtu 485 manual en id 144512 Nieznany
25 en id 31087 Nieznany (2)
więcej podobnych podstron