S t a t i s t i c s i n f o c u s
Population and social conditions
Authors: Cynthia TAVARES, Geoffrey THOMAS,
Fethullah BULUT
6/2012
Crime and Criminal Justice, 2006-2009
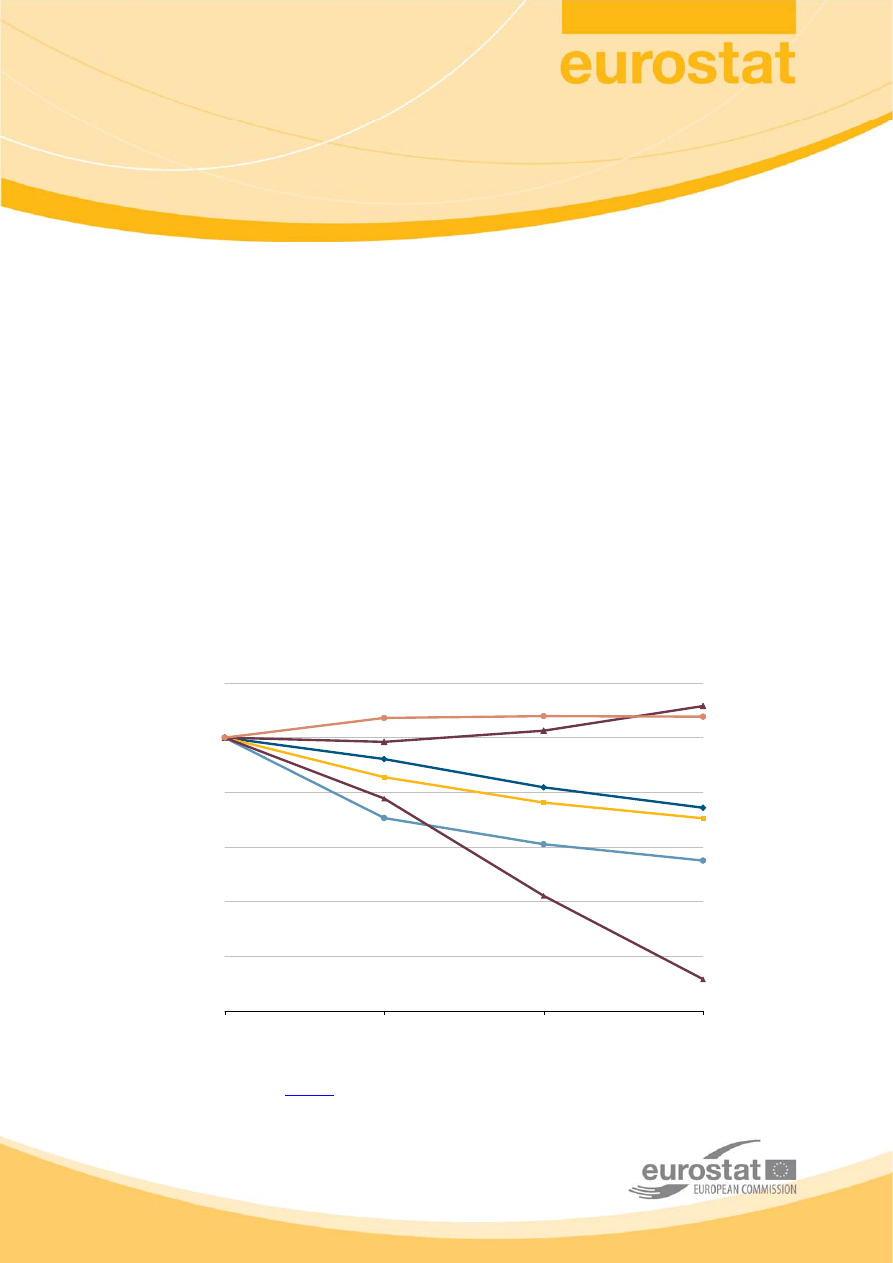
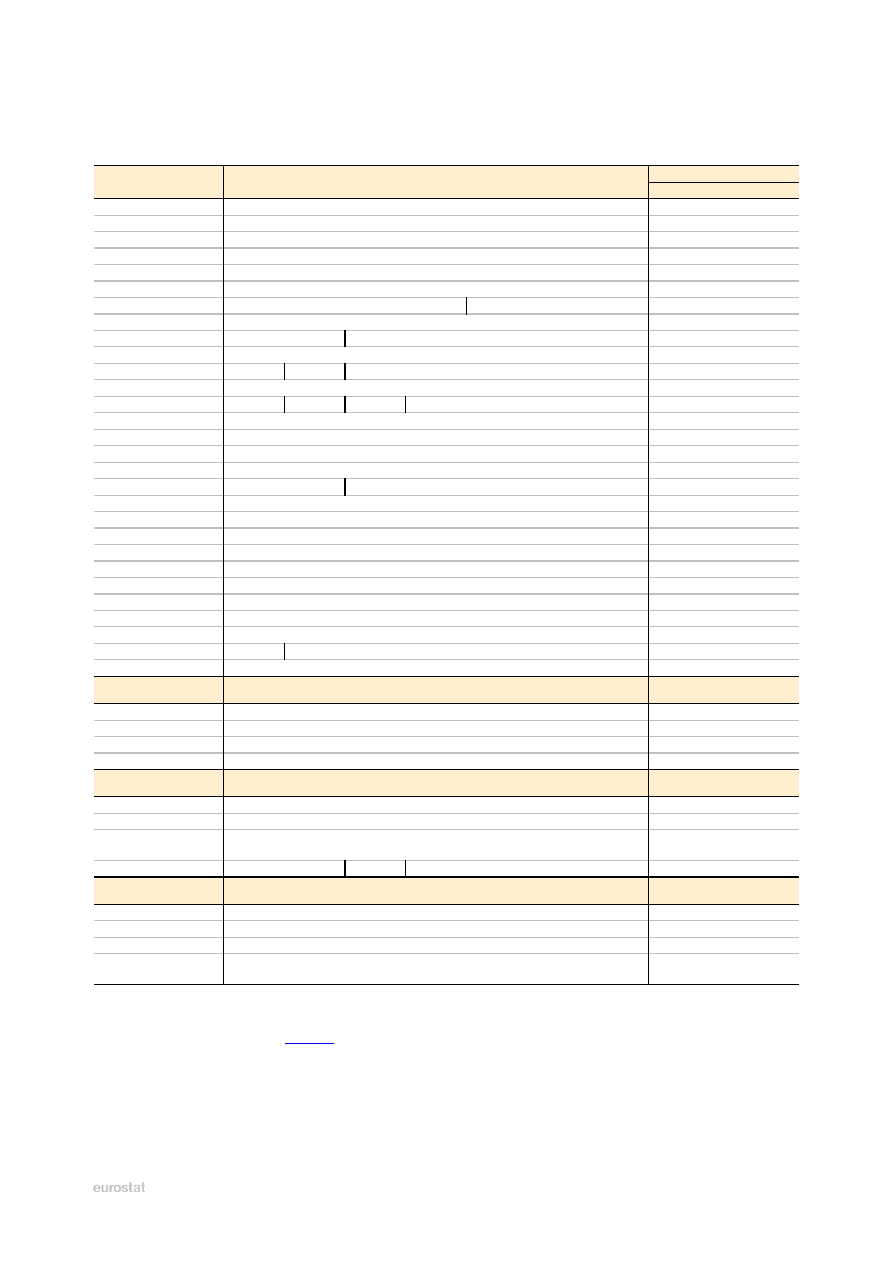
Recent work to improve the comparability of
statistics on crime and criminal justice reveals
some significant developments in criminality in
the European Union. This analysis is based on
the number of offences recorded by the police
for the period 2006-2009 (see Figure 1), with
some reference to earlier trends.
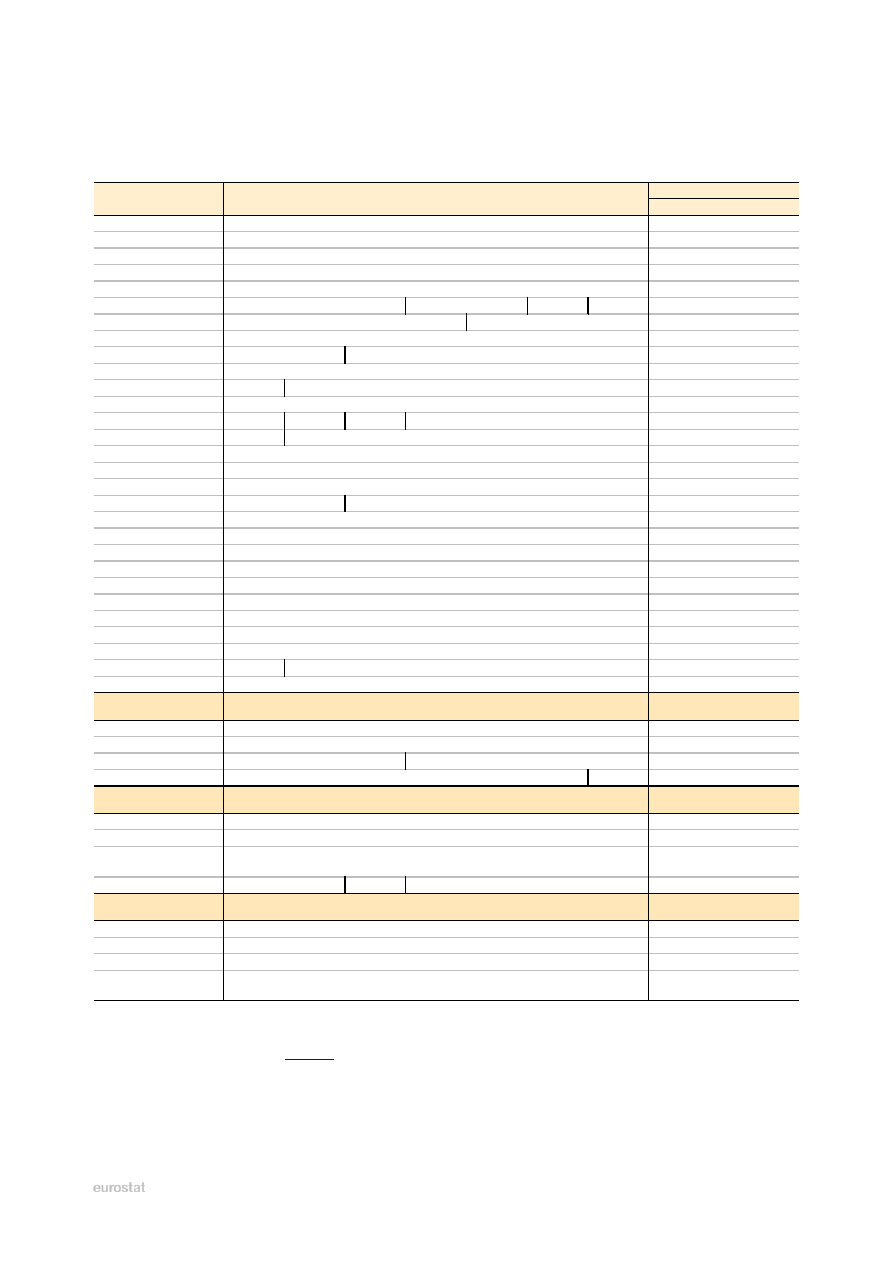
The number of crimes recorded by the police in the
European Union has fallen constantly since about
2002, but during the period 2006-2009 this trend
showed signs of slowing down. Towards the end of
this period, the police recorded more crimes in a
number of Member States (particularly, for
domestic burglary and drug trafficking).
On the other hand the type of recorded crime which
showed the most substantial decrease was theft of
motor vehicles.
The highest homicide rates are found in Lithuania
and Estonia, and the lowest in Austria, Slovenia,
Germany and Spain. Homicide rates for the major
cities tend to mirror the national trends while being,
in general, rather higher.
The largest prison populations relative to the
number of inhabitants are in Latvia and Estonia
whereas the smallest are Iceland, Finland, Denmark
and Slovenia.
Figure 1:
Recorded c
rime trends in the European Union, 2006
-
2009*
Total crime
Violent crime
Robbery
Domestic burglary
Motor vehicle theft
Drug trafficking
75
80
85
90
95
100
105
2006
2007
2008
2009
Offence
s
r
ecor
d
e
d
by the
po
li
ce
, I
ndex
20
06 = 1
0
0
* for countries where consistent time series are available (25 or 26 EU Member States).
Source: Eurostat (online data code:
)

2
6/2012 — Statistics in focus
Crimes recorded by the police
Introduction
The crime statistics in this publication cover
offences recorded by the police in the EU Member
States and other countries.
There are differences between countries in systems
of legal and criminal justice; in definitions of
crimes(
); methods of reporting, recording and
counting crimes; and the proportion of reported to
unreported crime(
). So it is not usually possible to
make direct comparisons of crime types and levels
between countries: a picture has to be built up by
considering trends over time (assuming that
background circumstances remain unchanged).
It should also be recognised that these crime
figures cannot provide a full description of the
extent of crime in Europe as some crime goes
unreported, and trends for particular offences may
reflect the focus of police activity in those areas.
The EU Safety Survey (due to be conducted in
2013) will provide additional knowledge of crime
in the EU. This victim survey will have
standardised features which will make it possible to
extract EU-wide comparable statistics on people’s
experience of crime.
Total crime (Table 1)
The figures for total crime(
) include offences
against the penal or criminal code. Less serious
crimes (misdemeanours) are generally excluded.
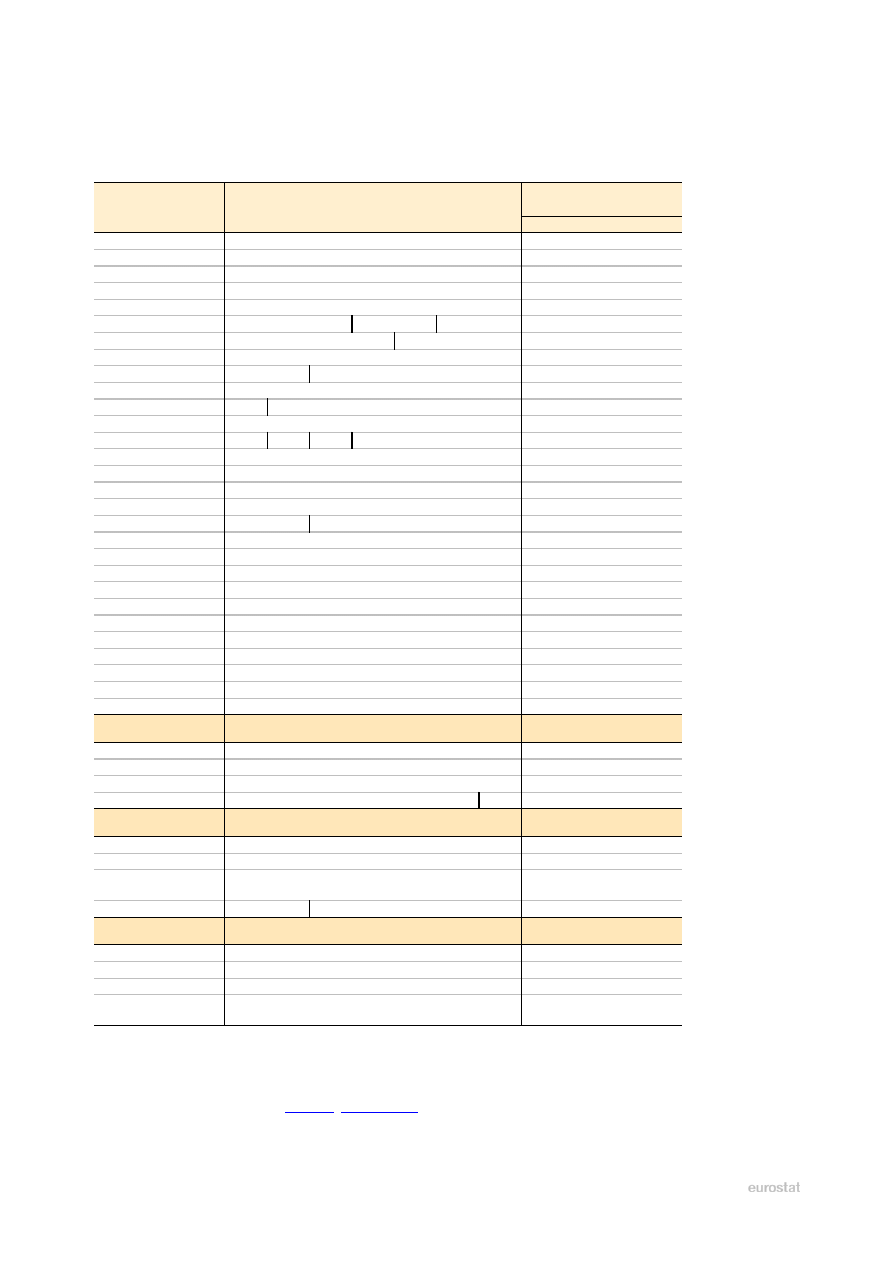
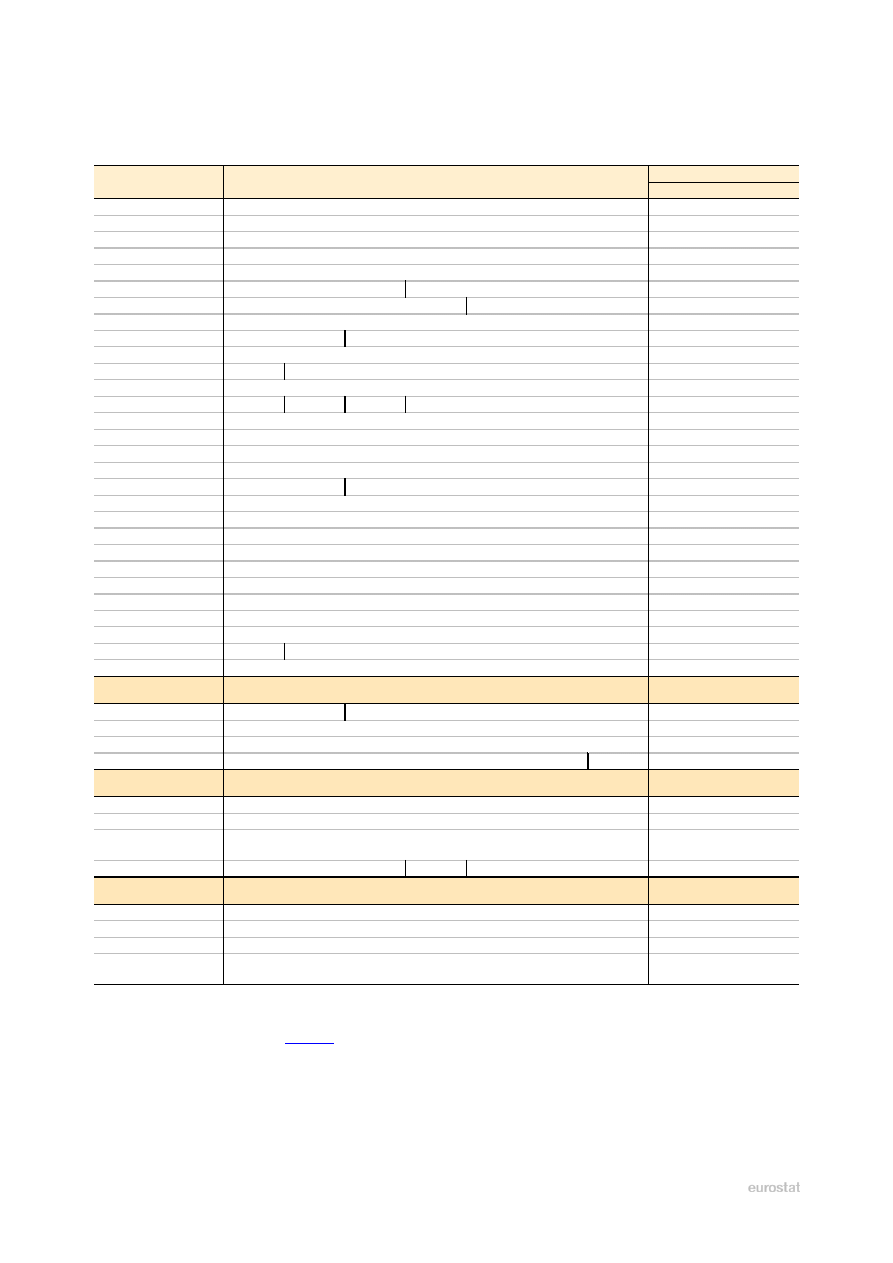
In most EU countries, crime levels have been
decreasing consistently since about 2002 (see
Figure 2). This trend continued in the EU as a
whole in the period 2006 to 2009, though the
tendency was upwards in a number of individual
Member States, including Romania, Luxembourg,
Denmark, Sweden, Portugal and Finland. Rises
were also recorded in Iceland and Liechtenstein.
The countries where the decrease in total crime has
remained most noticeable since 2006 are Malta, the
United Kingdom, Greece, Poland and Cyprus. But
underlying these general tendencies there are
considerable differences in the development of
specific types of crime.
(
1
) For example, Greece, Cyprus, Luxembourg, Iceland and
Liechtenstein do not distinguish "domestic burglary", and count all
burglary (in shops, garages etc.). Their figures cannot therefore be
compared directly with other countries which only include burglary in
a dwelling.
(
2
) For further details of the factors which influence the crime figures,
please consult the Methodological Notes on page 15.
(
3
) The figures for violent crime, property crime and drugs offences do
not show a complete breakdown of total crime; they are presented as a
closer look at selected offences.
Figure
2
: Trend for total
recorded
crime,
1998
-
2009*
14.5
15.0
15.5
16.0
16.5
1998
2000
2002
2004
2006
2008
Numbe
r of
o
ffe
nce
s
r
e
c
or
ded by
t
he pol
ic
e
(
in
mi
ll
ions
)
* for countries where consistent time series are available (about
a half of the EU Member States).
Source: Eurostat (online data code:
Violent crime (Table 2)
The figures for violent crime include violence
against the person (such as physical assault),
robbery (stealing by force or threat of force) and
sexual offences (including rape and sexual assault).
Close analysis of this class of crime is made more
difficult because not all Member States use the
standard definition but the general trends show a
decline in the EU of about 7% for the period 2006-
2009 in the number of these offences reported to
the police.
At country level, the picture is mixed, with
significant rises in Cyprus, Denmark, Luxembourg,
Greece and Sweden and notable falls in Latvia,
Lithuania, Slovakia, the United Kingdom, Poland
and the Czech Republic.
Homicide (Table 3) is a type of violent crime, and
is defined as the intentional killing of a person,
including murder, manslaughter, euthanasia and
infanticide. It excludes death by dangerous driving,
abortion and help with suicide.
Because of its seriousness, homicide is fairly
consistently reported, and definitions vary less
between countries than for some other types of
crime. Homicides are normally counted in numbers
of victims (rather than numbers of cases as for
other types of crime). The figures are for completed
homicides(
) but, in some countries, the police
register any death that cannot immediately be
attributed to other causes, as homicide. It may,
therefore, be over represented in the statistics.
(
4
) Except for Latvia, where the figures include attempted homicide.
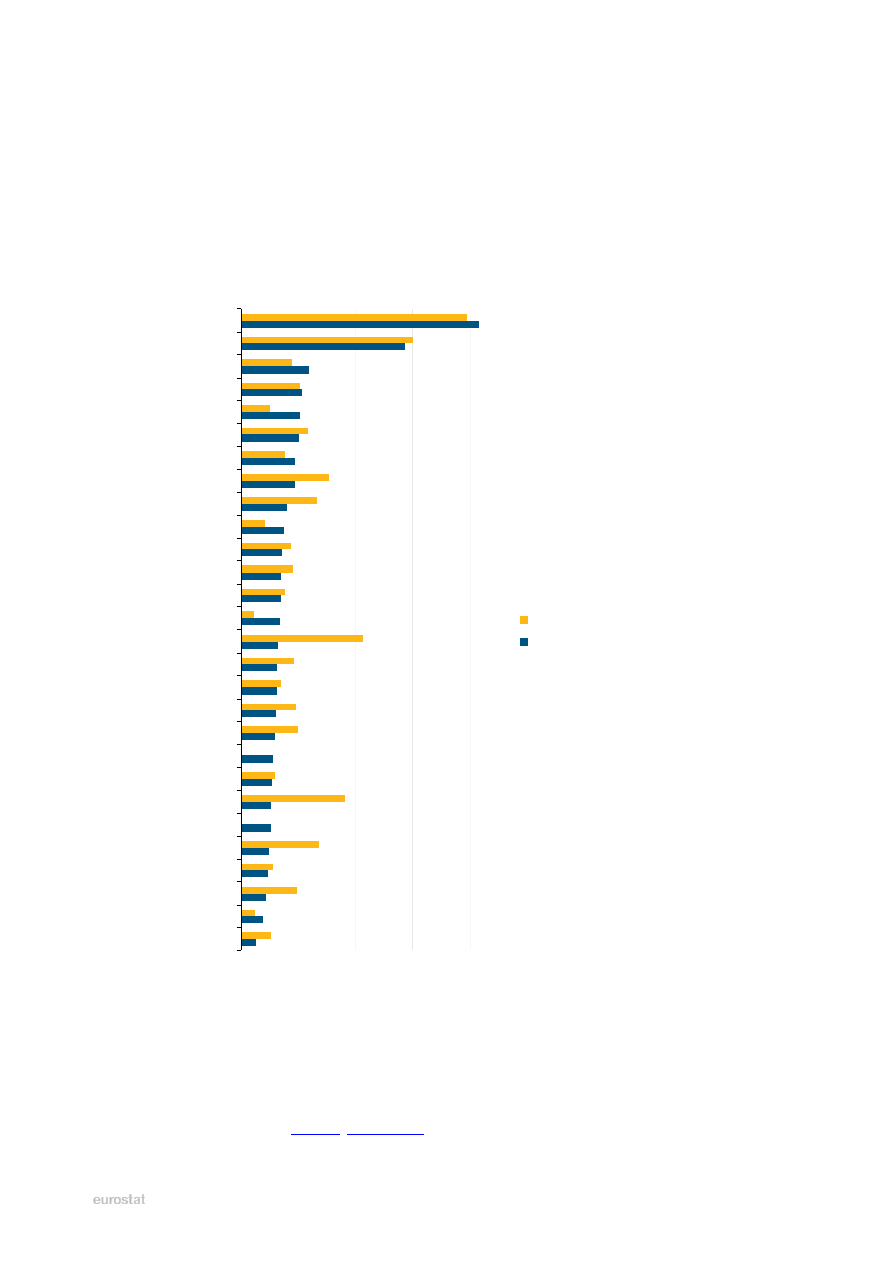
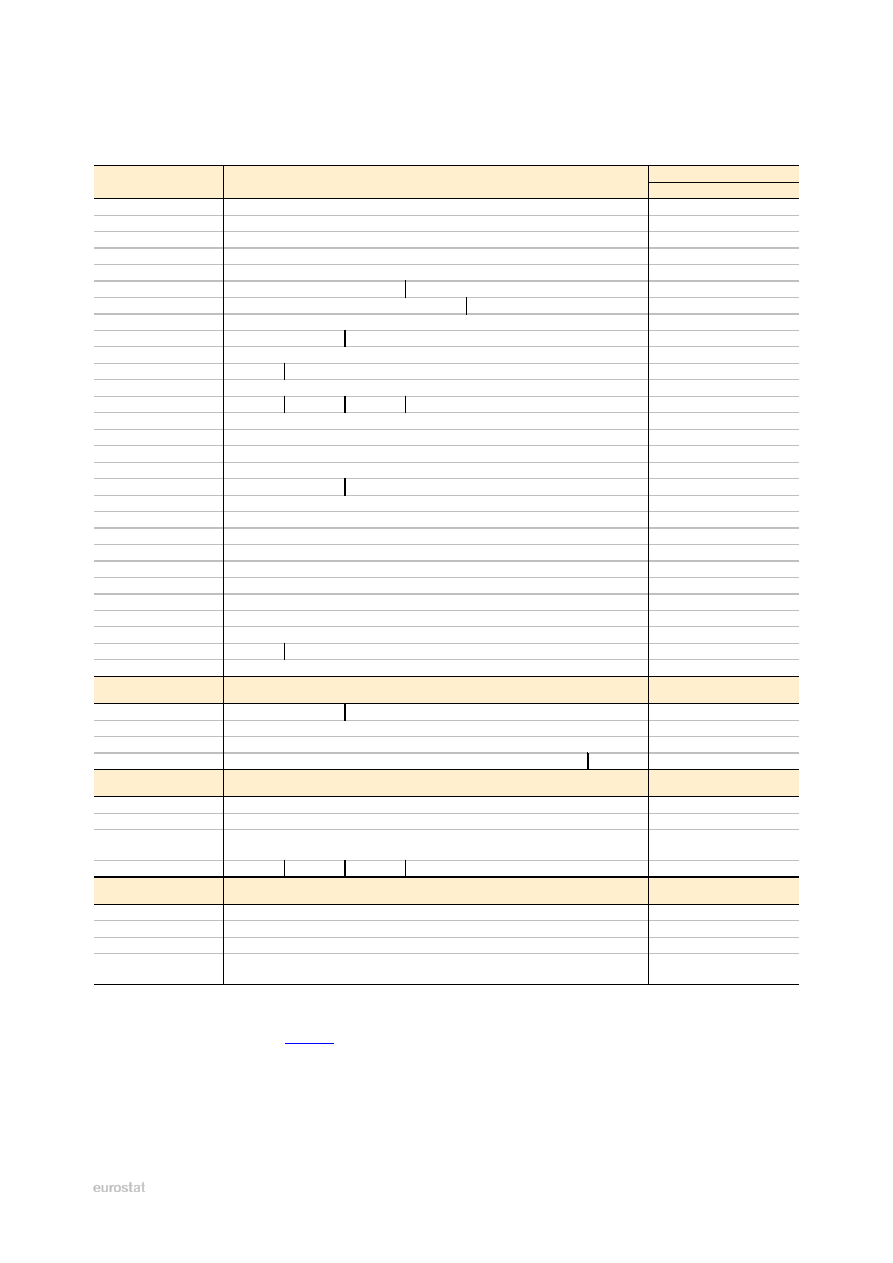
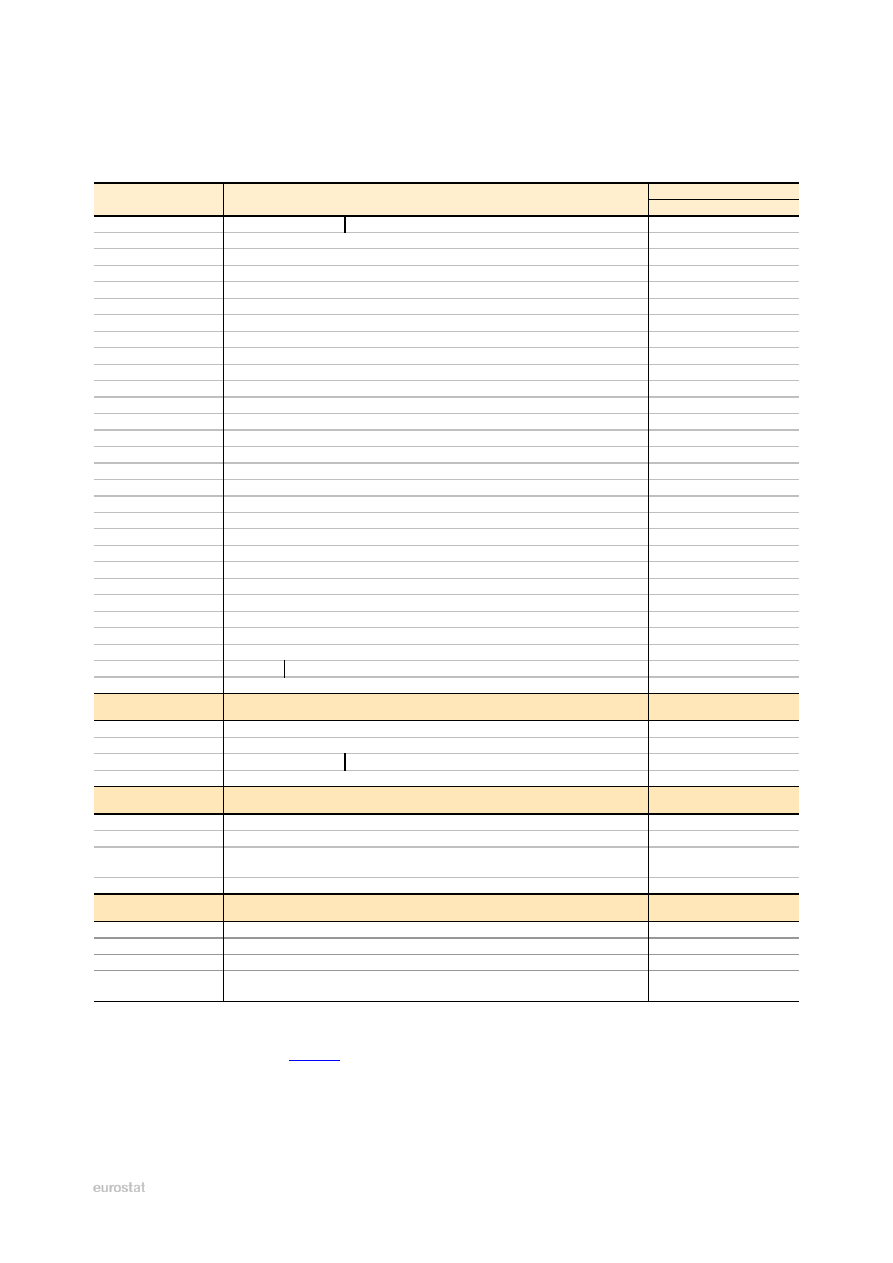
The national figures indicate (see Figure 3) that
Lithuania and Estonia have by far the highest
incidence of homicides (over 8 and 5 victims
respectively per 100 000 population). The only
other EU Member States reporting more than
2 homicides per 100 000 inhabitants were Finland,
Bulgaria, Romania and Ireland, while the lowest
rates (less than 1 per 100 000) were observed in
Austria, Slovenia, Germany and Spain.
Homicide rates for EU capital cities (see Figure 3)
are typically rather higher than for the country as a
whole. They generally follow the national trends,
with the highest figures being recorded in Vilnius
(on average almost 8 victims per 100 000
inhabitants) and Tallinn (about 6).
Figure
3
: Homicide rate per 100 000 population, average per year, 2007
-
2009
0
2
4
6
8
Austria
Slovenia
Germany
Spain
Czech Republic
Sweden
Netherlands
Italy
Malta
Greece
UK: England & Wales
France
Poland
Luxembourg
Portugal
Hungary
Denmark
UK: Northern Ireland
Cyprus
Slovakia
Belgium
UK: Scotland
Ireland
Romania
Bulgaria
Finland
Estonia
Lithuania
rate per 100 000 population
Capital city
Country
Notes
Tallinn (Estonia) and Estonia: 2008-2009 only.
Valetta (Malta): there were no homicides.
Stockholm (Sweden): figures not available.
Prague (Czech Republic) and Czech Republic: 2009 only.
Riga (Latvia) and Latvia: rate not calculated as figures include attempted homicide.
Source: Eurostat (online data codes:
,
)
Statistics in focus — 6/2012
3

Robbery (Table 4) is another type of violent
crime, and is defined as stealing by force or by
threat of force. It includes mugging (bag-snatching)
and theft with violence.
Whilst police recorded robbery offences have
fallen by about 11% since 2006 in the EU as a
whole, significant rises were reported in Greece,
Cyprus, Luxembourg, Bulgaria, the Netherlands,
Hungary, Sweden and particularly in Denmark
(where the figures more than doubled).
In contrast, there were sharp falls in Romania,
Latvia, Poland, Italy, Estonia, the United Kingdom,
and Lithuania.
Property crime
This class of crime covers the stealing or
destruction of property. Data for two such types of
crime, domestic burglary and theft of a motor
vehicle, are presented below.
Domestic burglary (Table 5) is defined as gaining
access to a dwelling by force in order to steal
goods. It rose by about 3% on average in the EU in
the period 2006 to 2009. In the majority of the EU
Member States, there were rises of between 5% and
10%, with sharper rises (over 20%) in Denmark,
Greece, Sweden and Romania.
Falls of more than 20% were recorded in a few
countries including Poland, Estonia, Malta and
Cyprus.
Theft of a motor vehicle (Table 6) covers thefts of
cars, motorcycles, buses, lorries, construction and
agricultural vehicles. The figures have fallen
steadily in recent years, perhaps partly as a result of
technical improvements in automobile security
systems. The great majority of Member States
recorded decreases of over 10% in vehicle thefts
between 2006 and 2009.
However, some Member States, reported
substantial increases, the largest being in Greece
and Cyprus (over 20% for the period 2006-2009)
and in Romania (which has fewer cars per head
than any other EU Member State), with a two-fold
rise in the number of offences over this period.
Drugs offences
Drug trafficking (Table 7) is a sub-set of the
broader class of drugs offences. It includes the
illegal possession, cultivation, production,
supplying, transportation, importing, exporting and
financing of drug operations)
Drug trafficking has generally been increasing
consistently in the EU since 2002. In 2006-2009,
these offences continued to increase, with the
majority of Member States recording increases of
over 10%. However there were falls of over 20% in
Hungary and Germany, which have both witnessed
a steady gradual decrease in crimes of this type
since 2005, and of 12% in Austria, where a similar
if less consistent trend is visible.
Police officers
Police officers (Table 8) include criminal police,
traffic police, border police, gendarmerie,
uniformed police, city guard and municipal police,
while excluding civilian staff, customs officers, tax
police, military police, secret service police, special
duty police reserves, cadets and court police.
However, this definition is not uniformly applied
and there are some differences between countries in
the inclusion of some sectors of their law
enforcement personnel in the figures.
Whilst recognising these differences, it is,
nevertheless, evident that the number of police
officers has remained virtually unchanged in most
EU Member States over the period 2006-2009 but
rises of over 10% were seen in Hungary, Ireland,
Spain and Luxembourg and falls of more than 5%
in Latvia, Romania and the Czech Republic.
4
6/2012 — Statistics in focus
Prison population
The prison population figures (Table 9) include
both adult and juvenile convicted prisoners and
pre-trial detainees in all types of prison
establishments but exclude non-criminal prisoners
held for administrative purposes such as pending
investigation into their immigration status.
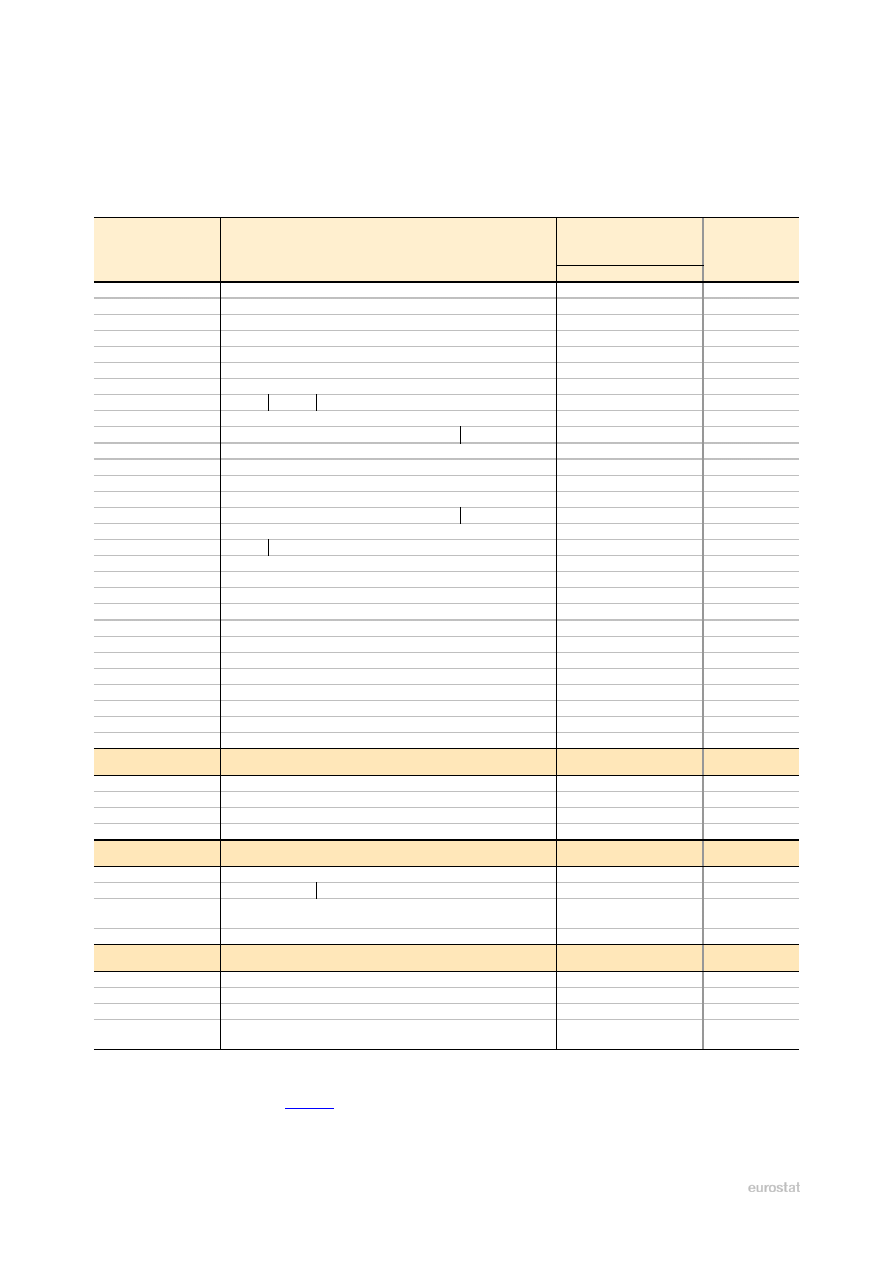
In 2009, there were over 630 000 prisoners in the
EU. This gives a rate of about 129 prisoners per
100 000 population in the EU Member States
(averaged over the period 2007-2009). By
comparison, the incarceration rate in the USA was
much higher, at 784 per 100 000 population.
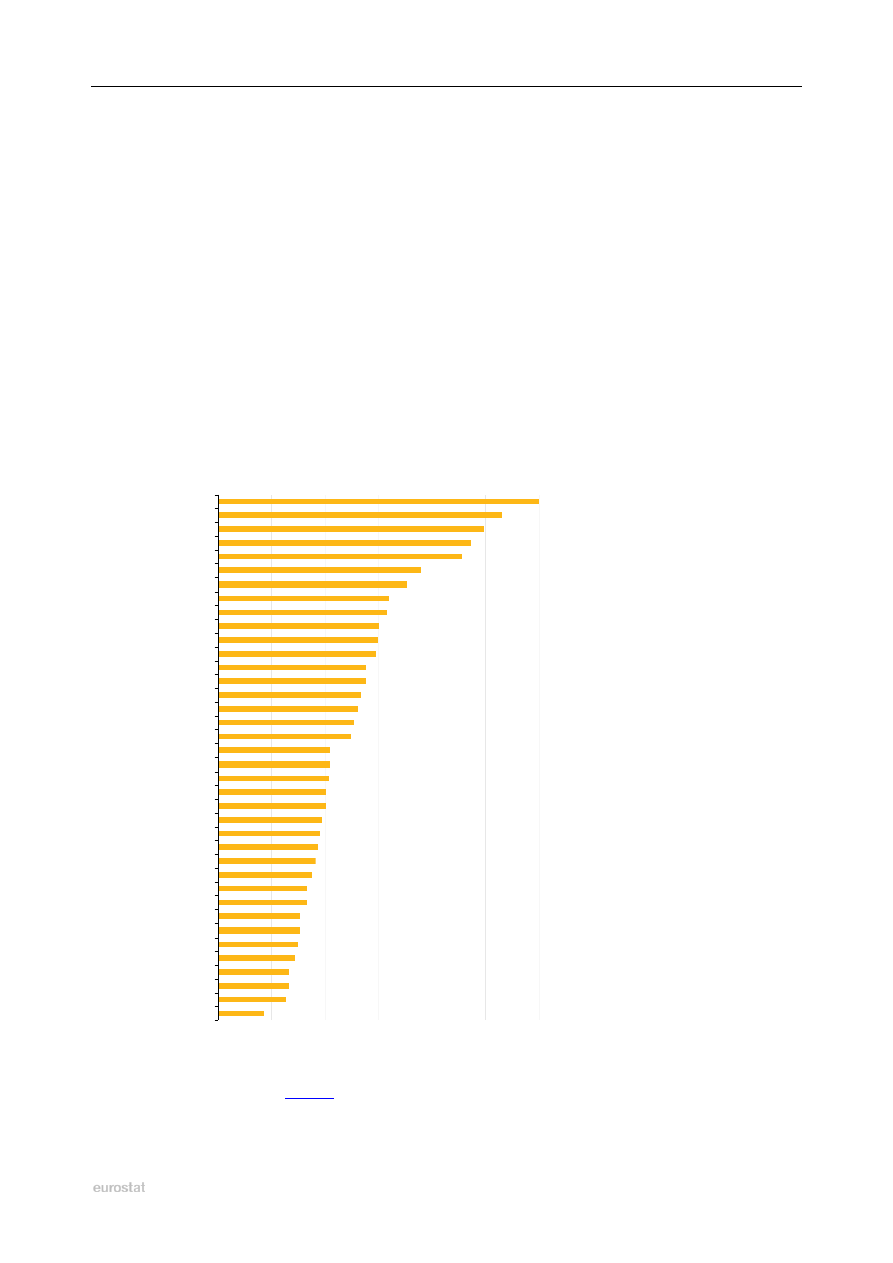
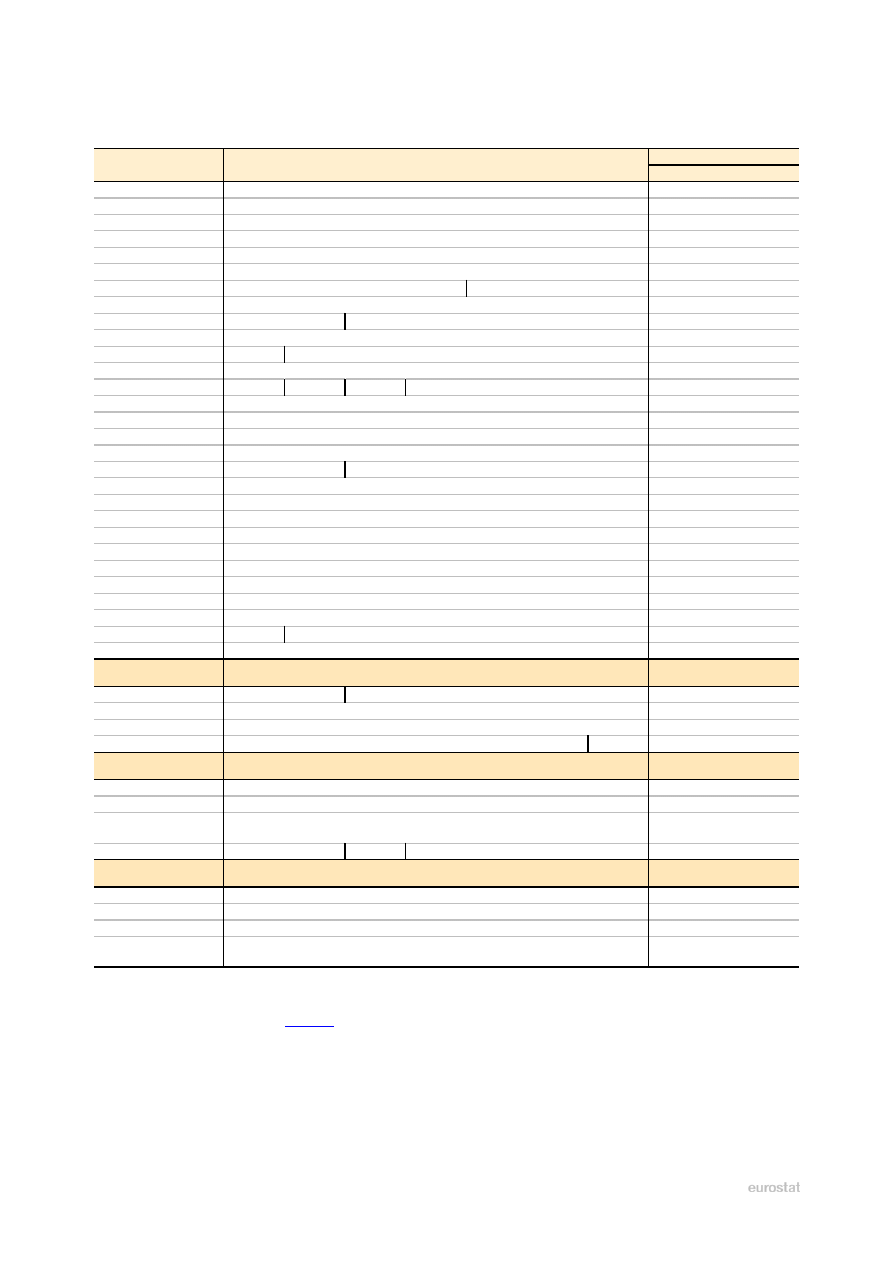
The highest numbers of prisoners in relation to the
national population (see Figure 4) are found in
Latvia, Lithuania, Estonia and Poland (each of
which had over 230 prisoners per 100 000
inhabitants). The Czech Republic and Slovakia had
over 150 prisoners per 100 000. Spain and the
United Kingdom (except Northern Ireland) also
saw steady rises in recent years.
Noticeable increases in prison populations may
also be observed in some of the EU candidate or
potential candidate countries, such as Turkey,
Montenegro, Croatia, Serbia and the former
Yugoslav Republic of Macedonia.
On the other hand, Iceland, Finland, Denmark and
Slovenia had the lowest numbers of prisoners per
head of population in Europe, with fewer than
70 prisoners per 100 000 population, while the rate
in Sweden and Norway was marginally higher.
Figure
4
: Prison population
rate per 100 000 population,
average per year,
2007
-
2009
0
50
100
150
200
250
300
Iceland
Finland
Denmark
Slovenia
Norway
Sweden
Ireland
Switzerland
Cyprus
UK: Northern Ireland
Germany
Netherlands
Belgium
Italy
Greece
Austria
France
Croatia
FYR of Macedonia
Portugal
Malta
Romania
Bulgaria
Serbia
Turkey
Luxembourg
Hungary
UK: Scotland
UK: England & Wales
Slovakia
Spain
Montenegro
Czech Republic
Poland
Lithuania
Liechtenstein
Estonia
Latvia
rate per 100 000 population
Source: Eurostat (online data code:
Statistics in focus — 6/2012
5
6
6/2012 — Statistics in focus
Tables
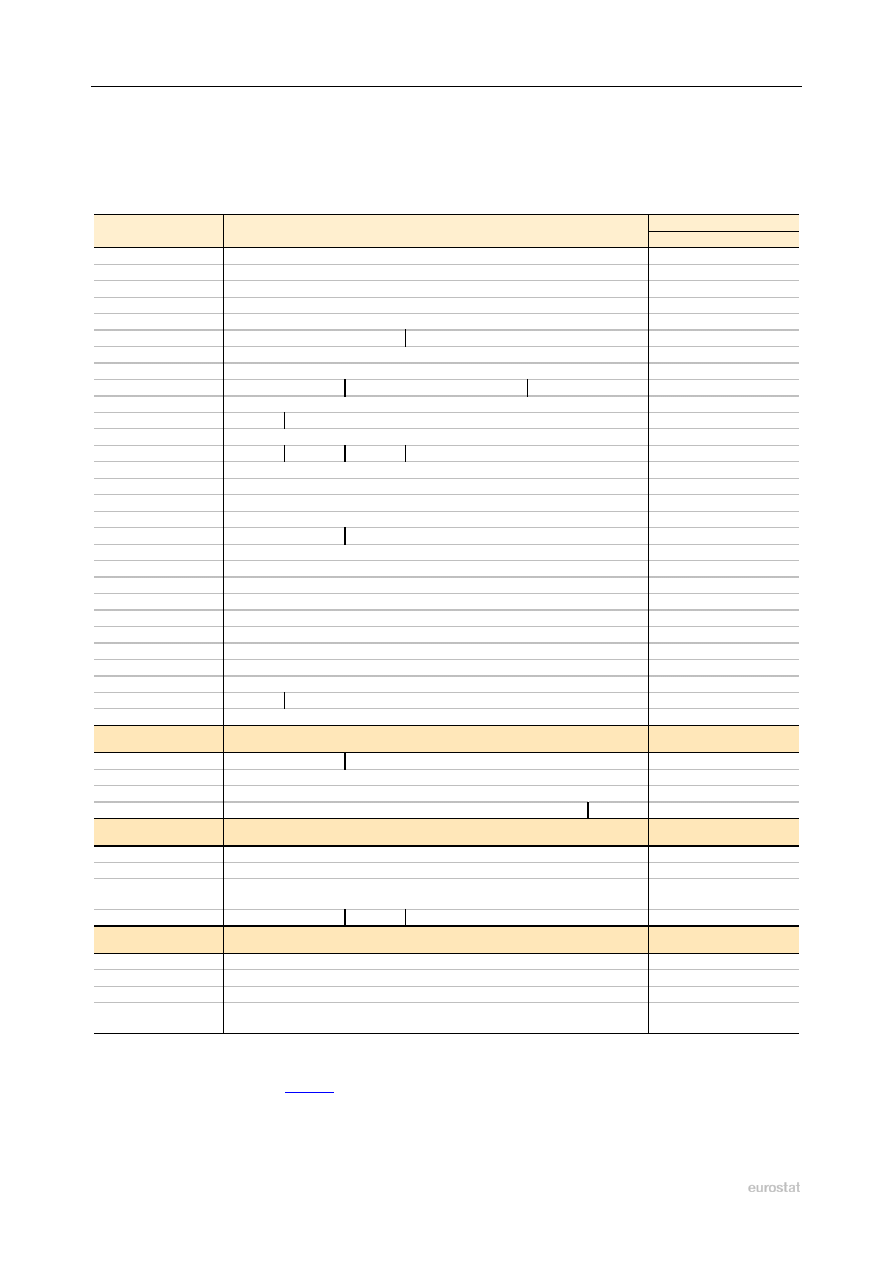
Table 1:
Crimes recorded by the police: Total crime, 2003-2009
These figures include offences against the penal code (or criminal code). Less serious crimes
(misdemeanours) are generally excluded. For exceptions to the standard definition, see the metadata files
on the Eurostat website.
Index (base year 2006 = 100)
Country
2003
2004
2005
2006
2007
2008
2009
2007
2008
2009
Belgium
1 001 818
1 005 925
992 375
1 014 349
1 021 184
1 024 390
1 044 242
101
101
103
Bulgaria
143 921
142 093
137 800
136 410
134 685
126 673
138 105
99
93
101
Czech Republic
357 740
351 629
344 060
336 446
357 391
343 799
332 829
106
102
99
Denmark
486 174
474 419
432 704
425 093
445 271
476 953
491 792
105
112
116
Germany
6 572 135
6 633 156
6 391 715
6 304 223
6 284 661
6 114 128
6 054 330
100
97
96
Estonia
53 595
53 048
52 916
51 834
50 375
50 977
48 359
97
98
93
Ireland
103 462
99 244
102 206
103 178
:
:
:
:
:
:
Greece
441 839
405 627
455 952
463 750
423 422
417 391
386 893
91
90
83
Spain
2 144 155
2 141 295
2 230 906
2 267 114
2 309 859
2 371 535
2 335 034
102
:
:
France
3 974 694
3 825 442
3 775 838
3 725 588
3 589 293
3 558 329
3 521 256
96
96
95
Italy
2 456 887
2 417 716
2 579 124
2 771 490
2 933 146
2 709 888
2 629 831
106
98
95
Cyprus
7 256
7 615
7 212
7 917
7 556
7 341
7 104
95
93
90
Latvia
51 773
62 173
51 435
62 328
55 620
57 475
56 748
89
92
91
Lithuania
79 072
84 136
82 074
75 474
67 990
71 972
76 291
90
95
101
Luxembourg
26 163
26 907
25 321
25 913
28 252
28 210
32 378
109
109
125
Hungary
413 343
418 833
436 522
425 941
426 914
408 407
394 034
100
96
93
Malta
17 739
18 384
18 580
16 527
15 005
13 803
11 953
91
84
72
Netherlands
1 369 271
1 319 482
1 336 860
1 285 535
1 286 849
1 261 340
1 232 482
100
98
96
Austria
643 286
643 648
605 272
589 495
594 240
572 695
591 597
101
97
100
Poland
1 466 643
1 461 217
1 379 962
1 287 918
1 152 993
1 082 057
1 129 577
90
84
88
Portugal
417 383
416 420
392 714
399 563
398 575
430 486
426 040
100
108
107
Romania
276 841
231 637
208 239
232 658
281 457
289 331
299 889
121
124
129
Slovenia
76 643
86 568
84 379
90 354
88 197
81 917
87 465
98
91
97
Slovakia
111 893
131 244
123 563
115 152
110 802
104 758
104 905
96
91
91
Finland
443 481
445 465
432 302
416 131
435 824
440 711
431 598
105
106
104
Sweden
1 255 371
1 248 743
1 241 843
1 224 958
1 306 324
1 377 854
1 405 626
107
112
115
UK: England & Wales
6 013 759
5 637 511
5 555 172
5 427 558
4 951 173
4 702 717
4 338 604
91
87
80
UK: Scotland
406 979
438 121
417 785
419 257
385 509
377 433
338 028
92
90
81
UK: Northern Ireland
127 953
118 124
123 194
121 144
108 468
110 094
109 139
90
91
90
EFTA countries
Iceland
17 515
16 565
12 028
13 483
13 038
14 578
15 966
97
108
118
Liechtenstein
1 138
1 043
1 059
1 189
1 075
1 112
1 216
90
94
102
Norway
303 824
287 821
275 684
277 016
271 712
264 199
277 121
98
95
100
Switzerland
379 343
389 415
352 723
335 157
326 232
323 235
676 309
97
96
:
EU candidate countries
Montenegro
8 613
8 227
9 579
9 564
9 258
8 277
8 101
97
87
85
Croatia
80 377
85 416
79 946
81 049
75 857
74 571
73 497
94
92
91
The former Yugoslav
Republic of Macedonia
22 547
22 663
22 634
22 024
26 224
28 327
:
119
129
:
Turkey
495 886
528 576
668 559
978 383
946 207
986 319
:
97
101
:
EU potential candidates
Albania
:
:
:
:
:
58 063
:
:
:
:
Bosnia & Herzegovina
:
:
:
:
:
:
:
:
:
:
Serbia
90 419
99 866
102 093
99 244
104 862
106 031
102 369
106
107
103
Kosovo
under UNSCR 1244/99
:
:
:
:
:
36 196
33 131
:
:
:
: Data not available.
| Break in the series.
Source: Eurostat (online data code:
)
Statistics in focus — 6/2012
7
Table 2:
Crimes recorded by the police: Violent crime, 2003-2009
These figures include violence against the person (such as physical assault), robbery (stealing by force or
by threat of force), and sexual offences (including rape and sexual assault). For exceptions to the
standard definition, see the metadata files on the Eurostat website.
Table 4 Crimes recorded by the police: Violent crime
Index (base year 2006 = 100)
Country
2003
2004
2005
2006
2007
2008
2009
2007
2008
2009
Belgium
100 876
101 555
104 316
107 369
108 689
112 666
115 019
101
105
107
Bulgaria
12 796
11 284
10 623
8 766
8 696
8 538
9 229
99
97
105
Czech Republic
22 763
24 025
22 079
19 454
19 976
18 187
17 367
103
93
89
Denmark
19 283
19 443
19 135
19 670
20 673
24 928
26 320
105
127
134
Germany
204 124
211 172
212 832
215 471
217 923
210 885
208 446
101
98
97
Estonia
2 411
3 287
4 755
5 154
5 834
9 082
7 406
113
:
:
Ireland
9 955
9 362
8 906
8 980
17 586
19 152
18 614
:
:
:
Greece
10 140
10 145
10 271
10 427
10 851
11 220
12 242
104
108
117
Spain
109 798
108 820
112 426
114 205
113 473
116 567
112 926
99
102
99
France
292 658
292 088
307 501
326 065
324 765
331 778
341 942
100
102
105
Italy
111 165
131 764
136 322
145 209
153 997
146 598
131 610
106
101
91
Cyprus
294
383
325
319
301
319
452
94
100
142
Latvia
3 200
3 366
2 879
2 750
1 919
1 928
1 866
70
70
68
Lithuania
6 042
6 566
6 561
5 498
4 754
4 372
4 204
86
80
76
Luxembourg
2 124
2 433
2 367
2 471
3 233
3 197
3 264
131
129
132
Hungary
31 484
33 364
32 760
29 728
29 645
33 035
32 046
100
111
108
Malta
:
406
403
390
422
382
376
108
98
96
Netherlands
106 410
109 887
131 860
131 388
131 495
126 679
126 770
100
96
96
Austria
148 758
172 115
148 748
135 121
133 546
129 613
134 142
99
96
99
Poland
77 152
74 614
68 141
61 399
54 629
52 122
51 128
89
85
83
Portugal
23 414
24 266
23 232
24 157
21 734
24 455
24 421
90
101
101
Romania
6 281
6 388
6 469
7 240
7 044
6 842
6 781
97
95
94
Slovenia
2 893
2 928
2 856
3 069
3 087
2 638
2 804
101
86
91
Slovakia
13 724
13 755
12 906
10 896
9 620
9 030
8 337
88
83
77
Finland
35 293
36 450
37 105
38 037
41 664
42 215
39 595
110
111
104
Sweden
83 782
86 107
94 205
98 154
104 627
108 448
111 702
107
110
114
UK: England & Wales
1 133 506
1 201 967
1 219 861
1 205 065
1 099 321
1 035 008
1 001 322
91
86
83
UK: Scotland
27 423
27 400
26 558
27 618
25 182
24 777
21 632
91
90
78
UK: Northern Ireland
32 735
32 512
34 408
35 223
32 545
32 694
33 100
92
93
94
EFTA countries
Iceland
:
:
:
:
:
:
:
:
:
:
Liechtenstein
109
96
107
88
86
93
95
98
106
108
Norway
20 039
21 360
21 381
22 591
23 205
23 848
24 261
103
106
107
Switzerland
10 151
11 917
11 544
12 784
13 537
12 560
15 360
106
98
:
EU candidate countries
Montenegro
3 940
4 281
3 787
3 537
3 070
2 577
3 205
87
73
91
Croatia
10 032
11 292
12 405
13 235
12 966
12 985
12 220
98
98
92
The former Yugoslav
Republic of Macedonia
860
1 094
1 133
993
1 037
905
:
104
91
:
Turkey
103 685
114 594
125 377
164 972
140 416
167 323
:
85
101
:
EU potential candidates
Albania
:
:
:
:
:
241
:
:
:
:
Bosnia & Herzegovina
:
:
:
:
:
1 510
1 841
:
:
Serbia
25 513
27 950
29 068
28 864
29 316
29 582
32 061
102
102
111
Kosovo
under UNSCR 1244/99
:
:
:
:
:
17 186
16 199
:
:
:
:
: Data not available.
| Break in the series.
Source: Eurostat (online data code:
)
8
6/2012 — Statistics in focus
Table 3:
Crimes recorded by the police: Homicide, 2003-2009
This is defined as intentional killing of a person, including murder, manslaughter, euthanasia and
infanticide. Attempted (uncompleted) homicide is excluded. Causing death by dangerous driving, abortion
and help with suicide are also excluded. The counting unit for homicide is normally the victim (rather than
the case). For exceptions to the standard definition, see the metadata files on the Eurostat website.
Rate per 100 000 population,
average per year, 2007-2009
Country
2003
2004
2005
2006
2007
2008
2009
Country
City
Belgium
230
268
224
226
213
199
185
1.87
Brussels
3.09
Bulgaria
247
240
196
183
169
172
150
2.14
Sofia
2.06
Czech Republic
:
:
:
:
:
:
105
1.00
Prague
2.74
Denmark
82
60
70
45
76
79
79
1.42
Copenhagen
1.81
Germany
859
868
869
808
757
722
706
0.89
Berlin
1.93
Estonia
147
91
113
91
93
84
70
5.74
Tallinn
6.03
Ireland
52
46
65
68
85
89
92
2.02
Dublin
2.33
Greece
116
111
132
110
128
139
144
1.22
Athens
1.98
Spain
587
520
518
476
482
408
412
0.96
Madrid
1.14
France
987
990
976
879
826
839
699
1.27
Paris
1.40
Italy
765
767
648
663
685
654
626
1.10
Rome
1.20
Cyprus
15
15
15
12
11
9
16
1.52
Lefkosia
0.86
Latvia
220
199
127
148
117
119
109
:
Riga
:
Lithuania
385
356
404
302
284
304
252
8.31
Vilnius
7.90
Luxembourg
3
2
4
9
7
7
5
1.31
Luxembourg
4.24
Hungary
228
209
164
175
137
147
139
1.40
Budapest
1.55
Malta
0
7
4
0
4
6
4
1.14
Valletta
0.00
Netherlands
247
223
197
159
164
176
179
1.05
Amsterdam
3.65
Austria
50
59
54
60
45
46
43
0.54
Vienna
1.07
Poland
663
633
555
490
525
460
493
1.29
Warsaw
1.85
Portugal
149
144
135
155
185
124
130
1.38
Lisbon
0.48
Romania
551
516
453
438
416
493
421
2.06
Bucharest
1.01
Slovenia
21
29
20
12
24
11
13
0.79
Ljubljana
0.49
Slovakia
146
122
106
89
89
94
84
1.65
Bratislava
2.65
Finland
103
144
113
112
128
132
116
2.36
Helsinki
1.76
Sweden
83
109
81
93
114
82
92
1.05
Stockholm
:
UK: England & Wales
904
868
764
758
774
657
615
1.25
London
1.92
UK: Scotland
109
138
101
122
111
97
85
1.89
Edinburgh
1.55
UK: Northern Ireland
33
41
29
24
30
26
22
1.47
Belfast
1.74
EFTA countries
Iceland
0
3
3
0
2
0
1
0.32
Reykjavik
0.50
Liechtenstein
0
1
0
0
0
1
1
1.88
Vaduz
0.00
Norway
51
36
33
33
30
34
29
0.65
Oslo
1.61
Switzerland
73
79
75
60
51
54
51
0.66
Berne
0.81
EU candidate countries
Montenegro
20
14
22
25
10
23
24
3.02
Podgorica
4.73
Croatia
76
89
76
75
66
74
56
1.47
Zagreb
1.10
The former Yugoslav
Republic of Macedonia
70
49
49
45
42
36
:
1.91
Skopje
3.23
Turkey
5 308
4 986
4 973
4 763
3 080
2 751
:
4.16
Ankara
4.03
EU potential candidates
Albania
:
:
:
:
:
139
:
4.38
Tirana
Bosnia & Herzegovina
:
:
:
:
:
68
67
1.76
Sarajevo
Serbia
176
164
157
160
182
145
161
2.21
Belgrade
2.39
Kosovo
under UNSCR 1244/99
:
:
:
:
:
77
56
3.07
Pristina
1.
:
:
70
: Data not available.
| Break in the series.
Rate per 100 000 population calculated using figures for completed homicide only.
Rate for Latvia not calculated as figures include attempted homicide.
Source: Eurostat (online data code:
,
)
Statistics in focus — 6/2012
9
Table 4:
Crimes recorded by the police: Robbery, 2003-2009
Robbery is defined as stealing from a person with force or threat of force, including muggings (bag-
snatching) and theft with violence. Pick-pocketing, extortion and blackmailing are generally excluded. For
exceptions to the standard definition, see the metadata files on the Eurostat website.
Index (base year 2006 = 100)
Country
2003
2004
2005
2006
2007
2008
2009
2007
2008
2009
Belgium
28 020
24 255
24 033
22 873
21 109
22 726
23 424
92
99
102
Bulgaria
4 933
4 131
3 754
2 875
2 996
2 868
3 596
104
100
125
Czech Republic
5 508
6 107
5 550
4 783
4 856
4 641
4 687
102
97
98
Denmark
5 884
5 733
5 199
5 048
5 784
10 747
12 738
115
213
252
Germany
59 782
59 732
54 841
53 696
52 949
49 913
49 317
99
93
92
Estonia
1 885
1 632
1 298
1 005
887
909
726
88
90
72
Ireland
1 719
1 478
1 138
1 250
2 173
2 299
2 367
:
:
:
Greece
2 083
2 339
2 084
2 463
2 823
3 293
4 715
115
134
191
Spain
92 980
88 413
90 104
90 591
89 884
93 186
90 407
99
103
100
France
125 286
119 641
124 600
127 190
112 885
106 633
112 765
89
84
89
Italy
70 625
66 643
65 724
71 762
74 130
64 535
50 732
103
90
71
Cyprus
66
100
73
66
69
62
111
105
94
168
Latvia
2 503
2 467
2 163
2 248
1 468
1 441
1 516
65
64
67
Lithuania
4 919
5 323
5 206
4 343
3 802
3 452
3 363
88
79
77
Luxembourg
374
339
351
263
331
260
365
126
99
139
Hungary
3 289
3 227
2 982
2 709
3 119
3 128
3 144
115
115
116
Malta
195
265
256
222
200
147
202
90
66
91
Netherlands
20 018
17 683
16 247
13 785
13 511
13 034
16 283
98
95
118
Austria
4 434
4 798
4 770
5 095
5 036
4 786
4 577
99
94
90
Poland
44 086
41 287
36 347
29 472
22 766
21 085
20 583
77
72
70
Portugal
19 767
21 051
20 183
20 870
18 427
20 807
20 462
88
100
98
Romania
2 782
3 087
3 326
4 078
2 496
2 464
2 541
61
60
62
Slovenia
349
398
429
525
450
386
481
86
74
92
Slovakia
1 918
2 156
1 919
1 594
1 429
1 371
1 358
90
86
85
Finland
2 045
2 017
1 814
1 700
1 784
1 696
1 640
105
100
96
Sweden
8 575
8 590
9 398
8 584
8 673
8 909
9 570
101
104
111
UK: England & Wales
103 736
91 010
98 198
101 376
84 748
80 134
75 101
84
79
74
UK: Scotland
4 159
3 736
3 553
3 578
3 064
2 963
2 496
86
83
70
UK: Northern Ireland
1 973
1 487
1 744
1 574
1 143
1 283
1 276
73
82
81
EFTA countries
Iceland
39
35
49
50
42
43
60
84
86
120
Liechtenstein
3
2
1
4
5
1
2
125
25
50
Norway
1 437
1 596
1 448
1 388
1 464
1 598
1 776
105
115
128
Switzerland
4 344
4 749
3 977
4 088
4 481
4 220
3 530
110
103
:
EU candidate countries
Montenegro
3 908
4 239
3 752
3 494
3 040
2 542
1 822
87
73
52
Croatia
1 236
1 622
1 560
1 445
1 272
1 259
1 411
88
87
98
The former Yugoslav
Republic of Macedonia
573
783
709
503
521
458
:
104
91
:
Turkey
4 776
10 825
15 083
21 555
12 634
8 853
:
59
41
:
EU potential candidates
Albania
:
:
:
:
:
50
:
:
:
:
Bosnia & Herzegovina
:
:
:
:
:
1 363
1 727
:
:
Serbia
21 126
22 893
23 854
23 785
24 272
24 717
27 285
102
104
115
Kosovo
under UNSCR 1244/99
:
:
:
:
:
452
174
:
:
:
:
: Data not available.
| Break in the series.
Source: Eurostat (online data code:
)
10
6/2012 — Statistics in focus
Table 5:
Crimes recorded by the police: Domestic burglary, 2003-2009
Domestic burglary is defined as gaining access to a dwelling by the use of force to steal goods. For
exceptions to the standard definition, see the metadata files on the Eurostat website.
Index (base year 2006 = 100)
Country
2003
2004
2005
2006
2007
2008
2009
2007
2008
2009
Belgium
64 065
57 544
57 107
63 971
62 906
63 691
69 277
98
100
108
Bulgaria
28 210
25 565
22 379
23 460
22 208
19 980
23 682
95
85
101
Czech Republic
12 164
11 670
10 361
9 603
9 163
9 111
9 616
95
95
100
Denmark
33 879
32 956
29 439
31 204
36 342
43 974
48 670
116
141
156
Germany
123 280
124 155
109 736
106 107
109 128
108 284
113 800
103
102
107
Estonia
6 495
5 752
4 766
3 928
3 096
3 321
3 027
79
85
77
Ireland
16 436
16 148
17 012
15 513
23 566
24 864
26 273
:
:
:
Greece
31 181
26 489
30 207
32 407
37 917
44 150
47 163
117
136
146
Spain
88 128
81 552
81 495
80 981
72 723
82 135
84 701
90
101
105
France
216 797
202 880
181 503
177 840
165 780
166 250
179 408
93
93
101
Italy
173 097
112 112
122 250
143 726
169 367
153 080
152 804
118
107
106
Cyprus
3 159
3 311
2 812
3 084
2 656
2 576
2 443
86
84
79
Latvia
5 327
6 031
4 310
4 624
3 654
3 538
4 133
79
77
89
Lithuania
8 573
9 174
7 065
6 637
5 516
6 076
5 799
83
92
87
Luxembourg
2 206
2 100
1 486
1 838
2 030
1 731
1 843
110
94
100
Hungary
19 366
18 671
17 786
16 856
17 415
19 239
17 625
103
114
105
Malta
682
782
1 113
856
735
674
667
86
79
78
Netherlands
103 577
95 952
93 308
87 291
87 356
89 157
92 256
100
102
106
Austria
13 429
20 276
21 227
18 945
20 040
18 648
21 248
106
98
112
Poland
65 172
66 795
59 325
46 610
37 644
31 481
32 977
81
68
71
Portugal
21 963
22 587
21 840
23 314
22 324
29 655
26 027
96
127
112
Romania
10 063
10 002
9 135
9 165
10 829
10 285
11 574
118
112
126
Slovenia
2 368
2 750
2 286
2 220
2 282
2 031
2 216
103
91
100
Slovakia
2 642
3 023
2 809
2 602
2 437
2 118
2 330
94
81
90
Finland
7 373
7 901
7 281
5 923
6 532
5 978
6 497
110
101
110
Sweden
17 344
17 573
16 654
15 005
16 936
18 176
20 463
113
121
136
UK: England & Wales
402 345
321 507
300 517
292 260
280 694
284 440
268 595
96
97
92
UK: Scotland
24 828
23 613
21 232
20 429
17 465
17 223
16 727
85
84
82
UK: Northern Ireland
8 944
7 302
7 259
6 831
6 712
7 351
7 270
98
108
106
EFTA countries
Iceland
2 889
2 769
2 244
2 365
2 277
2 731
3 524
96
115
149
Liechtenstein
123
121
97
120
102
93
168
85
78
140
Norway
10 475
8 613
8 136
7 268
6 777
8 125
9 035
93
112
124
Switzerland
68 551
70 370
61 194
56 706
57 493
55 688
25 393
101
98
:
EU candidate countries
Montenegro
:
:
:
:
:
:
:
:
:
:
Croatia
4 125
3 734
3 396
2 981
3 094
2 714
2 777
104
91
93
The former Yugoslav
Republic of Macedonia
1 088
1 275
1 146
1 367
1 590
1 346
:
116
98
:
Turkey
31 971
36 639
57 389
89 334
73 475
69 709
:
82
78
:
EU potential candidates
Albania
:
:
:
:
:
30
:
:
:
:
Bosnia & Herzegovina
:
:
:
:
:
:
:
:
:
:
Serbia
6 890
7 611
7 738
6 224
6 184
6 353
6 121
99
102
98
Kosovo
under UNSCR 1244/99
:
:
:
:
:
3 959
3 581
:
:
:
: Data not available.
| Break in the series.
Source: Eurostat (online data code:
)
Statistics in focus — 6/2012
11
Table 6:
Crimes recorded by the police: Theft of a motor vehicle, 2003-2009
Motor vehicles include all land vehicles with an engine that run on the road which are used to carry people
(including cars, motor cycles, buses, lorries, construction and agricultural vehicles, etc.). For exceptions to
the standard definition, see the metadata files on the Eurostat website.
Index (base year 2006 = 100)
Country
2003
2004
2005
2006
2007
2008
2009
2007
2008
2009
Belgium
36 297
29 926
26 809
26 848
24 872
23 264
21 853
93
87
81
Bulgaria
1 488
1 268
785
640
448
430
388
70
67
61
Czech Republic
25 331
24 230
23 040
20 996
20 329
18 893
14 770
97
90
70
Denmark
34 037
31 525
25 887
25 183
25 868
26 804
25 236
103
106
100
Germany
109 846
107 920
96 451
90 224
92 628
89 036
87 693
103
99
97
Estonia
2 099
1 840
1 929
1 239
1 007
1 035
934
81
84
75
Ireland
12 463
13 527
13 271
12 642
13 534
14 307
13 666
:
:
:
Greece
5 865
5 568
5 860
6 799
7 494
7 834
9 097
110
115
134
Spain
138 829
126 902
120 946
117 663
107 786
96 314
78 283
92
82
67
France
328 678
285 680
260 538
243 153
224 658
211 484
207 947
92
87
86
Italy
221 543
270 129
265 975
280 167
277 549
229 961
213 407
99
82
76
Cyprus
1 569
1 475
1 610
1 780
2 025
1 786
2 170
114
100
122
Latvia
3 369
2 960
2 023
2 168
1 729
1 868
1 825
80
86
84
Lithuania
7 022
6 330
4 541
3 460
2 848
2 553
1 967
82
74
57
Luxembourg
453
526
464
523
454
343
365
87
66
70
Hungary
12 240
10 969
10 770
10 058
15 017
16 539
11 212
149
164
111
Malta
887
798
672
584
388
398
401
66
68
69
Netherlands
34 271
30 652
26 841
21 244
21 059
21 342
20 798
99
100
98
Austria
7 720
8 156
11 089
8 959
7 802
9 049
9 289
87
101
104
Poland
54 291
51 150
45 292
30 529
21 284
17 669
17 271
70
58
57
Portugal
29 934
29 237
25 716
24 495
23 957
25 259
22 523
98
103
92
Romania
1 127
1 120
1 082
1 266
1 817
2 355
2 967
144
186
234
Slovenia
682
704
873
852
839
582
588
98
68
69
Slovakia
5 295
6 000
5 591
5 525
4 719
4 135
3 779
85
75
68
Finland
21 922
19 326
16 791
15 276
14 827
13 804
12 188
97
90
80
Sweden
67 199
60 980
56 719
51 639
49 249
44 717
40 359
95
87
78
UK: England & Wales
291 858
242 732
214 182
193 384
170 008
147 235
117 812
88
76
61
UK: Scotland
17 843
15 633
14 041
15 000
12 105
11 551
9 304
81
77
62
UK: Northern Ireland
5 369
4 456
3 721
3 418
3 336
2 954
2 975
98
86
87
EFTA countries
Iceland
:
:
:
:
:
:
:
:
:
:
Liechtenstein
14
16
10
7
7
16
7
100
229
100
Norway
20 130
17 867
15 350
14 619
12 571
11 901
12 014
86
81
82
Switzerland
:
:
:
:
:
:
9 115
:
:
EU candidate countries
Montenegro
78
67
121
98
98
85
121
100
87
123
Croatia
2 338
2 462
2 274
2 033
2 069
1 927
1 828
102
95
90
The former Yugoslav
Republic of Macedonia
560
827
567
365
413
581
:
113
159
:
Turkey
25 443
25 667
33 344
33 091
24 153
17 988
:
73
54
:
EU potential candidates
Albania
:
:
:
:
:
28
:
:
:
:
Bosnia & Herzegovina
:
:
:
:
:
:
:
:
:
:
Serbia
3 056
3 572
3 472
3 533
4 075
3 773
3 618
115
107
102
Kosovo
under UNSCR 1244/99
:
:
:
:
:
464
393
:
:
:
:
: Data not available.
| Break in the series.
Source: Eurostat (online data code:
)
12
6/2012 — Statistics in focus
Table 7:
Crimes recorded by the police: Drug trafficking, 2003-2009
Drug trafficking includes illegal possession, cultivation, production, supplying, transportation, importing,
exporting, financing etc. of drug operations which are not solely in connection with personal use. For
exceptions to the standard definition, see the metadata files on the Eurostat website.
Index (base year 2006 = 100)
Country
2003
2004
2005
2006
2007
2008
2009
2007
2008
2009
Belgium
9 751
10 584
11 419
11 826
12 674
13 061
13 428
107
110
114
Bulgaria
2 006
2 412
2 720
2 824
2 844
2 857
3 662
101
101
130
Czech Republic
3 497
2 803
2 706
2 668
2 639
2 812
3 046
99
105
114
Denmark
2 667
3 158
2 738
2 917
3 258
3 237
2 849
112
111
98
Germany
73 375
75 347
72 002
64 865
64 093
55 905
50 965
99
86
79
Estonia
604
494
686
981
1 449
1 558
1 042
148
159
106
Ireland
2 430
2 273
2 751
3 160
3 824
4 028
4 091
:
:
:
Greece
10 904
8 838
10 183
9 600
9 271
11 861
12 335
97
124
128
Spain
11 742
11 947
11 968
12 711
14 098
14 574
14 345
111
115
113
France
6 094
6 296
6 108
5 792
5 797
6 128
6 007
100
106
104
Italy
37 288
30 053
32 059
32 306
34 439
34 082
34 101
107
105
106
Cyprus
475
514
611
653
876
780
705
134
119
108
Latvia
997
1 148
1 049
997
1 434
2 512
2 307
144
252
231
Lithuania
509
711
999
704
765
793
874
109
113
124
Luxembourg
1 133
1 342
1 326
1 201
1 448
1 343
2 232
121
112
186
Hungary
3 387
6 678
7 626
6 740
4 676
5 464
4 801
69
81
71
Malta
:
78
113
123
149
180
187
121
146
152
Netherlands
15 633
15 662
19 384
19 769
19 465
18 672
18 188
98
94
92
Austria
2 506
2 443
2 337
2 377
2 473
1 980
2 099
104
83
88
Poland
2 577
3 296
3 608
3 220
3 926
3 317
3 975
122
103
123
Portugal
3 739
3 654
3 536
3 610
3 265
3 710
4 260
90
103
118
Romania
1 131
1 775
2 441
3 079
2 796
3 621
3 228
91
118
105
Slovenia
775
997
1 026
1 590
1 429
1 434
2 096
90
90
132
Slovakia
734
711
843
411
488
524
602
119
127
146
Finland
5 974
5 269
5 177
4 837
5 115
5 659
6 335
106
117
131
Sweden
5 129
4 905
4 670
6 449
6 918
7 997
8 192
107
124
127
UK: England & Wales
24 628
24 190
25 276
26 550
28 330
29 894
33 009
107
113
124
UK: Scotland
9 044
9 333
9 613
10 890
9 827
10 315
9 223
90
95
85
UK: Northern Ireland
405
375
349
473
529
607
668
112
128
141
EFTA countries
Iceland
149
165
95
92
104
104
101
113
113
110
Liechtenstein
364
459
435
285
225
210
357
79
74
125
Norway
16 152
16 814
17 118
19 156
19 086
17 547
18 616
100
92
97
Switzerland
7 806
7 803
7 076
6 296
6 297
7 317
18 346
100
116
:
EU candidate countries
Montenegro
299
355
294
438
549
460
398
125
105
91
Croatia
7 992
7 529
8 186
8 346
7 952
7 882
7 063
95
94
85
The former Yugoslav
Republic of Macedonia
397
357
390
315
451
415
:
143
132
:
Turkey
5 036
6 720
7 550
10 508
13 649
15 366
:
130
146
:
EU potential candidates
Albania
:
:
:
:
:
274
:
:
:
:
Bosnia & Herzegovina
:
:
:
:
:
1 519
1 584
:
:
Serbia
2 492
4 116
5 256
5 505
5 414
6 049
5 500
98
110
100
Kosovo
under UNSCR 1244/99
:
:
:
:
:
314
364
:
:
:
:
: Data not available.
| Break in the series.
Source: Eurostat (online data code:
)
Statistics in focus — 6/2012
13
Table 8:
Number of police officers, 2003-2009
All ranks of police officers including criminal police, traffic police, border police, gendarmerie, uniformed
police, city guard, municipal police. Excluding civilian staff, customs officers, tax police, military police,
secret service police, part-time officers, special duty police reserves, cadets, court police. For exceptions
to the standard definition, see the metadata files on the Eurostat website.
Index (base year 2006 = 100)
Country
2003
2004
2005
2006
2007
2008
2009
2007
2008
2009
Belgium
36 318
37 008
38 911
38 963
38 718
38 581
39 861
99
99
102
Bulgaria
:
:
:
:
:
33 800
30 807
:
:
Czech Republic
46 616
47 232
45 498
46 032
44 101
42 117
43 472
96
91
94
Denmark
10 352
10 483
10 728
10 819
10 841
10 743
10 850
100
99
100
Germany
245 415
246 756
248 188
250 284
250 353
247 619
245 752
100
99
98
Estonia
3 553
3 520
3 412
3 238
3 247
3 218
3 183
100
99
98
Ireland
12 017
12 209
12 265
12 954
13 755
14 411
14 547
106
111
112
Greece
52 123
50 171
49 696
48 521
51 152
50 798
:
105
105
:
Spain
194 973
198 072
202 365
209 163
214 935
224 086
231 801
103
107
111
France
233 250
235 792
234 966
241 998
238 478
228 402
243 900
99
94
101
Italy
249 714
250 237
249 313
246 775
247 510
245 152
:
100
99
:
Cyprus
4 773
4 903
4 999
5 125
5 139
5 280
5 353
100
103
104
Latvia
9 796
9 902
9 920
9 568
8 222
8 410
7 114
86
88
74
Lithuania
11 910
11 526
11 216
11 301
11 173
11 018
10 957
99
97
97
Luxembourg
1 304
1 352
1 403
1 447
1 519
1 555
1 603
105
107
111
Hungary
29 518
29 516
28 627
28 636
26 334
33 698
33 487
92
118
117
Malta
1 845
1 775
1 789
1 755
1 933
1 884
1 847
110
107
105
Netherlands
36 907
35 996
35 284
35 324
35 363
35 463
36 498
100
100
103
Austria
26 634
27 111
27 111
26 623
26 623
26 623
26 623
100
100
100
Poland
99 919
100 770
100 654
99 083
98 337
100 648
98 955
99
102
100
Portugal
47 258
47 647
46 929
47 573
47 276
47 518
49 152
99
100
103
Romania
45 690
45 770
46 875
50 265
50 453
50 339
45 779
100
100
91
Slovenia
7 526
7 618
7 881
7 857
7 971
7 779
7 842
101
99
100
Slovakia
13 667
14 079
14 345
14 361
14 134
14 059
14 498
98
98
101
Finland
8 288
8 247
8 237
8 312
8 156
8 191
8 308
98
99
100
Sweden
16 292
16 891
17 073
17 423
17 866
18 321
19 144
103
105
110
UK: England & Wales
133 366
139 200
141 230
141 381
140 514
140 230
142 151
99
99
101
UK: Scotland
15 482
16 001
16 221
16 234
16 221
17 048
17 409
100
105
107
UK: Northern Ireland
8 986
8 936
8 579
8 354
6 140
7 302
7 758
73
87
93
EFTA countries
Iceland
678
671
679
688
683
646
667
99
94
97
Liechtenstein
84
87
92
96
93
83
88
97
86
92
Norway
8 062
8 169
7 485
7 506
7 453
7 505
7 642
99
100
102
Switzerland
15 155
15 473
16 444
16 649
16 199
16 326
17 058
97
98
102
EU candidate countries
Montenegro
:
:
:
:
:
:
5 454
:
:
Croatia
19 622
19 634
19 898
19 790
20 424
19 823
20 204
103
100
102
The former Yugoslav
Republic of Macedonia
8 357
9 231
9 815
9 776
9 599
9 905
:
98
101
:
Turkey
318 189
327 371
330 310
325 738
329 533
341 770
:
101
105
:
EU potential candidates
Albania
:
:
:
:
:
:
:
:
:
:
Bosnia & Herzegovina
:
:
:
:
:
:
:
:
:
:
Serbia
:
:
:
:
:
:
32 562
:
:
Kosovo
under UNSCR 1244/99
:
:
:
:
:
:
:
:
:
:
:
:
:
: Data not available.
| Break in the series.
Source: Eurostat (online data code: (
)
14
6/2012 — Statistics in focus
Table 9:
Prison population, 2003-2009
Total number of adult and juvenile prisoners (including pre-trial detainees) at 1 September (or nearest
available date). Including offenders held in Prison Administration facilities, other facilities, juvenile
offenders institutions, drug addicts institutions and psychiatric or other hospitals. Excluding non-criminal
prisoners held for administrative purposes (for example, people held pending investigation into their
immigration status). For exceptions to the standard definition, see the metadata files on the Eurostat
website.
Rate per
100 000 population
Index (base year 2005 = 100)
average per year,
Country
2003
2004
2005
2006
2007
2008
2009
2007
2008
2009
2007-2009
Belgium
9 308
9 249
9 330
9 573
9 950
9 804
10 105
104
102
106
93
Bulgaria
10 056
10 935
11 399
11 452
10 792
9 922
9 167
94
87
80
130
Czech Republic
17 180
18 303
19 003
18 904
19 110
20 471
19 371
101
108
102
189
Denmark
3 641
3 767
4 041
3 932
3 646
3 530
3 715
93
90
94
66
Germany
79 183
79 329
79 519
77 166
73 319
73 203
72 043
95
95
93
89
Estonia
4 352
4 575
4 410
4 310
3 466
3 656
3 555
80
85
82
265
Ireland
2 986
3 138
3 151
3 191
3 321
3 544
3 275
104
111
103
77
Greece
8 555
8 760
9 871
10 280
10 864
:
:
106
:
:
97
Spain
56 096
59 375
61 054
64 021
67 100
73 558
76 079
105
115
119
160
France
55 407
59 246
59 197
59 522
60 403
64 003
66 178
101
108
111
101
Italy
54 237
56 068
59 523
39 005
48 693
58 127
64 791
125
149
166
96
Cyprus
355
546
536
599
646
646
670
108
108
112
83
Latvia
8 222
7 666
6 998
6 636
6 548
6 873
7 055
99
104
106
301
Lithuania
8 957
7 838
7 951
7 982
7 770
7 736
8 332
97
97
104
236
Luxembourg
455
577
735
738
666
674
679
90
:
:
138
Hungary
16 507
16 543
15 720
14 740
14 743
14 626
15 253
100
99
103
148
Malta
278
298
294
375
382
662
494
102
177
132
125
Netherlands
15 194
17 397
17 867
16 456
15 605
14 752
14 555
95
90
88
91
Austria
7 816
9 000
8 955
8 780
8 887
7 899
8 423
101
90
96
101
Poland
80 692
79 344
82 656
87 669
90 199
84 549
85 598
103
96
98
228
Portugal
13 635
12 956
12 687
12 446
11 587
10 807
11 099
93
87
89
105
Romania
42 815
39 031
36 700
34 038
29 390
26 212
26 616
86
77
78
127
Slovenia
1 099
1 126
1 132
1 127
1 336
1 318
1 360
119
117
121
66
Slovakia
8 829
9 504
9 289
8 657
8 235
8 313
9 033
95
96
104
158
Finland
3 463
3 535
3 883
3 477
3 370
3 457
3 231
97
99
93
63
Sweden
6 726
7 291
7 016
7 151
6 740
6 806
6 976
94
95
98
74
UK: England & Wales
73 657
74 488
76 190
77 982
79 734
83 194
83 454
102
107
107
151
UK: Scotland
6 606
6 776
6 856
7 187
7 377
7 827
7 964
103
109
111
149
UK: Northern Ireland
1 128
1 219
1 325
1 501
1 484
1 490
1 465
99
99
98
83
EFTA countries
Iceland
112
115
119
119
115
140
148
97
118
124
43
Liechtenstein
67
59
62
48
38
78
149
79
163
310
249
Norway
2 944
3 028
3 124
3 250
3 420
3 387
3 403
105
104
105
72
Switzerland
5 214
5 977
6 137
5 888
5 715
5 780
6 084
97
98
103
77
EU candidate countries
Montenegro
744
802
816
852
961
1 255
:
113
147
:
177
Croatia
2 803
3 010
3 485
3 833
4 290
4 734
4 891
112
124
128
105
The former Yugoslav
Republic of Macedonia
1 545
1 791
2 081
2 090
2 050
2 235
:
98
107
:
105
Turkey
63 796
58 016
55 966
70 524
90 732 103 435
:
129
147
:
138
EU potential candidates
Albania
:
:
:
:
:
:
:
:
:
:
Bosnia & Herzegovina
:
:
:
:
:
:
:
:
:
:
Serbia
7 128
7 653
8 078
7 862
8 970
9 701
10 795
114
123
137
133
Kosovo
under UNSCR 1244/99
:
:
:
:
:
:
:
:
:
:
:
:
:
: Data not available.
| Break in the series.
Source: Eurostat (online data code:

Statistics in focus — 6/2012
15
METHODOLOGICAL NOTES
Developing EU Statistics on crime and criminal justice
Eurostat received a mandate under the 2004 Hague
Programme(
): strengthening freedom, security and justice in
the European Union to develop comparable statistics on crime
and criminal justice, and a series of measures towards this
end were undertaken under the 2006-10 Action Plan on
Developing a comprehensive and coherent EU strategy to
measure crime and criminal justice(
).
Following the conclusion of the Action Plan, the system is
being enhanced and extended as part of the implementation of
the 2009 Stockholm Programme(
): An open and secure
Europe serving and protecting citizens.
Data collection
The methodology used in this publication draws upon that
developed by the European Sourcebook of Crime and Criminal
Justice Statistics(
), in particular the definition and
measurement of criminal offences, and upon the Surveys on
Crime Trends conducted by the United Nations Office of Drugs
and Crime(
).
Countries were asked to adhere to a standard definition when
assembling the figures and to provide details of any
divergences.
Figures for the United Kingdom are reported separately (as
UK: England & Wales, UK: Scotland and UK: Northern
Ireland), owing to the existence of three separate jurisdictions.
Comparisons
The data are taken from information recorded or reported by
the police. Comparisons of crime levels based on the absolute
figures would be misleading, since they are affected by many
factors, including:
• different legal and criminal justice systems
• rates at which crimes are reported to the police and
recorded by them
• differences in the point at which crime is measured
(for example, when reported to the police, on
identification of suspects, etc.)
• differences in the rules by which multiple offences
are counted
• differences in the list of offences that are included in
the overall crime figures
(
1
The Hague Programme Official Journa
l C 53 of 3.3.2005, p.11
(
2
Commission communication COM/2006/437
final
(
3
Stockholm Programme Official Journal
C115 of 4.5.2010, p.1
(
4
) European Sourcebook of Crime and Criminal Justice Statistics
http://www.europeansourcebook.org/index.html
(
5
) United Nations Office on Drugs and Crime
http://www.unodc.org/unodc/en/data-and-analysis/index.html
Figures for the prison population may also be affected by
many factors, including:
• number of cases dealt with by the courts
• the percentage receiving a custodial sentence
• the length of the sentences imposed
• the size of the population on remand
• the date of the survey, especially where amnesties
apply
For these reasons, direct comparisons of crime levels in
different countries should be avoided. Rates per head of
population (which might imply that such comparisons could be
made) are therefore not presented in this publication, except in
the case of homicide and the prison population, where the
figures may be more readily comparable. In these cases, rates
per 100 000 head of population averaged over 3 years have
been calculated.
Caution should also be exercised when considering low
numbers for some crimes. For example, for homicide, the rate
may vary considerably from year to year. This is especially
true for small countries or cities where there may be no
homicides recorded in one year and two or more the following
year.
As a general rule, comparisons should be based upon trends
rather than upon levels, on the assumption that the
characteristics of the recording system within a country remain
fairly constant over time. Even here, however, there are many
exceptions as methods change, causing breaks in the series,
indicated using the symbol '|'. The symbol ‘:’ is used for some
countries to indicate that definitional changes make such a
comparison impossible. Fuller information on these changes is
given on the Eurostat website.
Where national series without definitional changes are
available for the years between 2006 and 2009, indices have
been calculated using the 2006 figure as a base, in order to
make it easier to follow the trends:
Crime index I
i
= (C
i
/C
base
) * 100
I
i
= index number for year i
C
i
= number of offences recorded by the police for year i
C
base
= number of offences recorded by the police for the
base year
Eurostat website
The website allows users access to the data and the
metadata. There are tables on total crime from 1950 onwards
and from 1993 for some specific offences, from 1993 for the
number of police officers and from 1987 for the prison
population. As already noted above, comparability of the
figures between countries is difficult to achieve and users are
strongly advised to consult the metadata files when
referring to the figures. The metadata files contain additional
information on the precise definition of the offence used by
each country.

Further information
Eurostat Website:
Data on 'Crime and criminal justice'
http://epp.eurostat.ec.europa.eu/portal/page/portal/crime/data/database
Further information about 'Crime and criminal justice'
http://epp.eurostat.ec.europa.eu/portal/page/portal/crime/introduction
Journalists can contact the media support service:
Bech Building, Office A4/125, L-2920 Luxembourg
Tel.: (352) 4301 33408
Fax: (352) 4301 35349
E-mail:
eurostat-mediasupport@ec.europa.eu
European Statistical Data Support:
With the members of the ‘European statistical system’, Eurostat has set up a network of
support centres in nearly every Member State and in some EFTA countries.
Their role is to provide help and guidance to Internet users of European statistics.
Contact details for this support network can be found on the Eurostat website at:
.
All Eurostat publications can be ordered via the ‘EU Bookshop’:
.
Manuscript completed on: 18.01.2012
Data extracted on: 17.01.2012
ISSN 1977-0316
Catalogue number: KS-SF-12-006-EN-N
© European Union, 2012
Document Outline
Wyszukiwarka
Podobne podstrony:
KS GL 12 001 EN id 252122 Nieznany
chemia lato 12 07 08 id 112433 Nieznany
Active Listening en id 51008 Nieznany (2)
BPMN2 0 Poster EN id 92566 Nieznany (2)
mizan Z2 MECH EN id 778695 Nieznany
Agenda en id 52847 Nieznany (2)
55 en id 41488 Nieznany
AKO Wyklad 12 11 11 id 53978 Nieznany (2)
cat 6AD en id 108772 Nieznany
Informacja 12 02 2008 id 213373 Nieznany
iecp en id 209519 Nieznany
26 en id 31374 Nieznany (2)
3 12 mierzenie plynow id 33409 Nieznany (2)
Eko pr 10 12 12 na strone id 15 Nieznany
Cw 12 Obwody rezonansowe id 122 Nieznany
Makros powerPLmC E30 en id 1627 Nieznany
lab11 RapidPrototyping EN id 25 Nieznany
iteiit21v9n1 en id 220860 Nieznany
więcej podobnych podstron