Władysław DYBCZYŃSKI
Bialystok University of Technology
Application of Light Emitting Diodes for local lighting
Abstract. The paper presents possibilities of illumination of work areas with white Light Emitting Diodes (LED). The work task area is illuminated
with a local lighting fitting and with a general lighting system (producing illumination 300 lx) as well. Geometry of the lighting system has been
discussed: illuminated work area, visual task area and position of the lighting fitting. Computer simulation of lighting systems based on different types
of LEDs and analyses of results of lighting of a reference work area have been carried out. Technical parameters such as average illumination on
the visual task area and its neighbourhood, illumination uniformity and coefficient of utilisation have been determined.
Streszczenie. Przedstawiono możliwości oświetlenia miejsc pracy za pomocą diod elektroluminescencyjnych, emitujących światło białe. Oprócz
oświetlenia miejscowego powierzchnia pracy wzrokowej jest oświetlona światłem ogólnym z natężeniem oświetlenia wynoszącym 300 lx. Omówiono
geometrię związaną z technologią oświetlenia: wymiary powierzchni roboczej, powierzchni pracy wzrokowej i usytuowanie oprawy oświetlenia
miejscowego. Drogą symulacji komputerowej przeprowadzono analizę możliwości oświetlenia powierzchni odniesieniowej za pomocą diod LED
różnego rodzaju. Wyznaczono: średnie natężenie oświetlenia, równomierność natężenia oświetlenia oraz sprawność oświetlenia. (Zastosowanie
diod elektroluminescencyjnych do oświetlenia miejscowego).
Keywords: local lighting, light emitting diodes.
Słowa kluczowe: oświetlenie miejscowe, diody świecące.
Introduction
It is expected, that the development of Light Emitting
Diodes (LEDs), will be followed by new applications. For the
time being, power of LEDs is small and their cost
comparatively high so their use for lighting big areas with
high illumination levels would not be reasonable.
Nevertheless there are some specific areas in which their
application can be justifiable.
In the paper a possibility of illumination of a desk using a
lighting fitting with white LED diodes with rotationally-
symmetrical light distribution has been analysed. Such
diodes are offered by different manufacturers. Technical
data of such diodes greatly differ from those of conventional
light sources. Basic catalogue data for some selected
diodes are shown in Table 1.
Table 1. Technical data of Light Emitting Diodes
No. Pow-
er
[W]
Lum.
flux
[lm]
Lum.
effic-
iency
[lm/W]
Colour
temp.
[K]
Light
distr.
Plot
no.
on
fig.1
1 1 20 20 3
300
Limited 1
2 1,1 21,7 19,7 6
000 Limited 2
3 1,3 17,1 13,2 5
500 Narrow 3
4 1 12 12 6
000
Narrow 4
5 3 66 22 5
600
Cosine 5
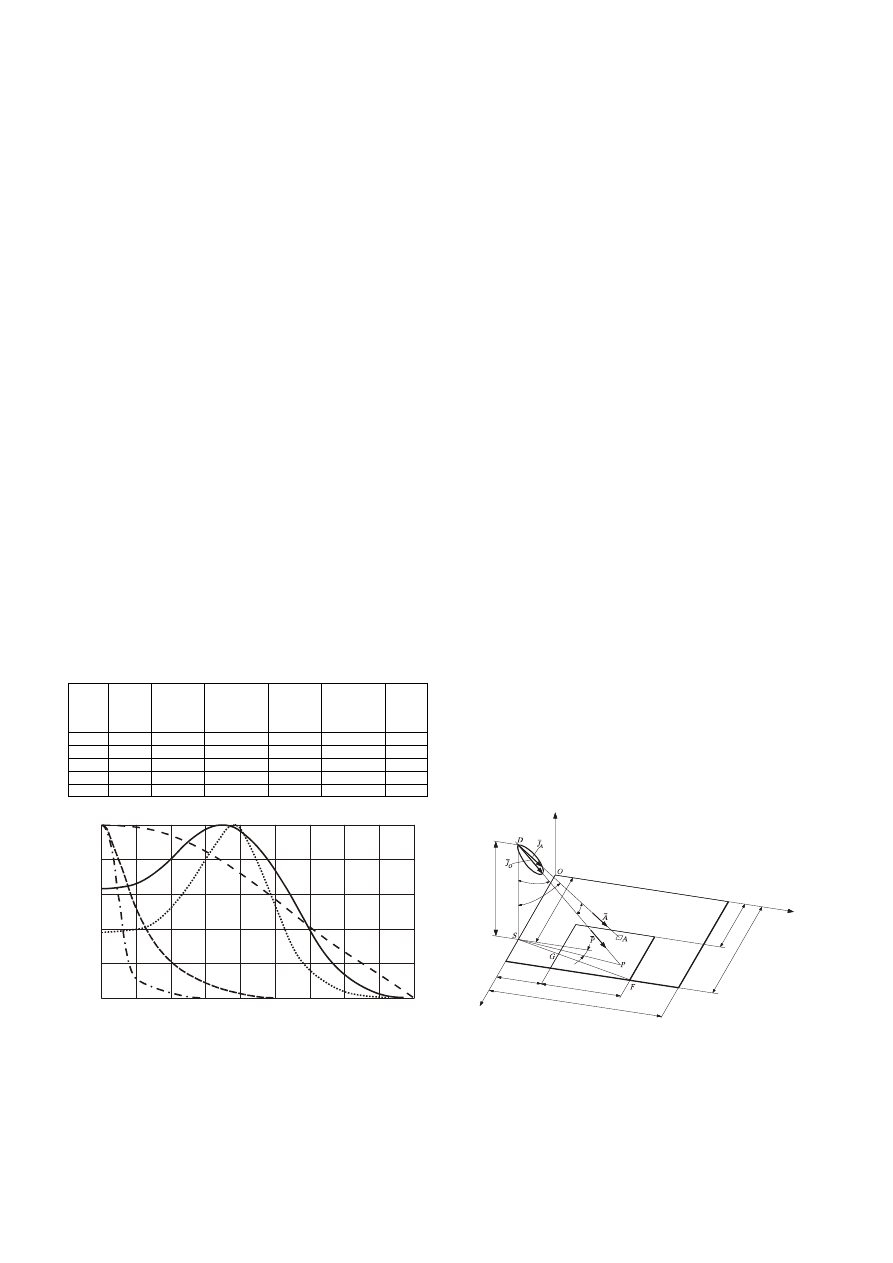
Fig. 1. Light distribution curves of selected LED diodes
On Figure 1 light distribution curves of selected diodes
are shown. Diodes No. 1 and 2 are designed for lighting of
flat surfaces illuminated from the normal direction with
uniform illumination. The size of illuminated area depends
on the distance between the light source and the illuminated
surface and is determined by the angle 2 x 38° (plot l) i 2 x
40° (plot 2). Plots No. 3 and 4 are light distributions of
elements equipped with lenses. These narrow-beam diodes
are designed for directional lighting and are applied in
torches, in bike headlights, in visual signalling devices and
in local lighting fittings.
The most popular are LEDs with cosine (Lambert) light
distribution (plot 5). They have the highest luminous
efficiency and they find many applications. They can be
applied also for local lighting but a useful light output ratio of
a fitting with such diodes (coefficient of utilisation) will be
small. It will also depend on a position of the fitting with
respect to the illuminated area.
Geometry of the Work Place
The work place taken as a base for following
discussions is a top of a desk with dimensions 600 x 900
mm. The work task area situated on the desk top has the
size of an A3 paper (ca. 300 x 420 mm). The work task area
is adjacent to the longer side of the desk and is situated
symmetrically - its transverse axis of symmetry and the
transverse axis of symmetry of the desk are the same (see
Fig. 2). The work place is illuminated by general lighting
fittings with illumination equal to 300 lx. The assumed
uniformity is 100%.
d
e
b
c
f
h
a
y
x
z
α
γ
β
ε
0
10
20
30
40
50
60
70
80
90
1,0
0,8
0,6
0,4
0,2
0
o
o
o
o
o
1
2
3
4
5
o
Fig. 2. Geometry of the desk lighting
The task field is additionally illuminated by a local
lighting fitting. The luminous central point of the lighting
(point D) is situated above the left edge of the desk, on the
height h. The projection of the central point of the fitting on
the desk surface (point S) is situated at a distance f from the
opposite, longer edge of the desk.
PRZEGLĄD ELEKTROTECHNICZNY, ISSN 0033-2097, R. 83 NR 5/2007
11

The symmetry axis of the surface of intensity distribution
of the LED located in the local lighting fitting, intersects the
desk surface at the point P. Usually there are several diodes
in one fitting. All points P should be situated in such a way,
that illumination on the visual task area is equal to 200 lx
multiplied by the depreciation
factor (k = 1,3). As a result of
general and local lighting,
illumination on the area will reach
the value of 560 lx, which will conform the standard [1].
According to the requirement of the standard, uniformity of
the illumination on the visual task area should not be less
than 0,7 and in the direct environment of the area – not less
than 0,5.
If the total flux of the a.m. lighting fitting is directed to the
visual task area, the coefficient of utilisation would be at its
maximum. In reality, this can not be reached. A part of
luminous flux will always be directed outside the area, and
even outside the desk.
The above mentioned requirements, together with the
coefficient of utilisation, form a basis for analyses of
application of LEDs for local lighting.
Direction of the LEds Light Beam
Calculations of illumination obtained by the way of local
lighting are carried out with the point by point method, which
means that dispersed light is not taken into account. The
visual task area and its direct surrounding (the desk top) is
divided into equal elementary fields, each of them being a
square or a similar geometrical figure. In the present
analysis, the longer side (d) of the visual task area is divided
into m
x
= 26 elements, which means that the distance
between calculation points will be Δx = 16,15 mm.
The number of calculation points alongside y axis can be
calculated from the formula
(1)
19
9
,
0
=
⎟
⎠
⎞
⎜
⎝
⎛
+
⋅
−
=
x
y
m
d
e
b
INT
m
thus the distance between calculation points will be Δy =
15,79 mm.
The area of the desk has been divided into 56 parts
alongside axis x, and into 38 parts alongside axis y, which
gives as a result 2128 elementary fields, including 494 fields
on the visual task area.
Point A, which is situated in the centre of each
elementary field, is illuminated with the luminous intensity
vector I
A
, which produces illumination E.
(2)
2
)
(
cos
AD
I
E
A
γ
=
where: I
A
– luminous intensity vector directed at the point A,
AD – distance between the diode lighting centre and the
point A,
γ
– luminous ray incidence angle.
The value of the vector I
A
can be determined from LED
light distribution f(
ε
) and the angle
ε
. The angle can be
calculated from the formula:
(3)
A
P
P
A
P
A
P
A
z
z
y
y
x
x
⋅
⋅
+
⋅
+
⋅
=
ε
cos
where: A
x
, A
y
, A
z
– components of the vector A , determining
the direction of the light intensity vector I
A
, P
x
, P
y
, P
z
–
components of the vector P , determining the direction of
the axis vector I
0
,
P
A ,
– modules of vectors A and P .
The diode light distribution is usually presented in a
table form, so values of I
A
(4)
)
(
ε
f
I
I
o
A
⋅
=
are determined with parabolic interpolation.
When co-ordinates of points A and D are known, the
distance between them can be calculated from the formula:
(5)
2
2
2
)
(
)
(
D
D
A
D
A
z
y
y
x
x
AD
+
−
+
−
=
.
The angle of incidence
γ
applied in formula (2) is
calculated from the trigonometric formula
(6)
h
y
y
x
DS
AS
S
A
A
2
2
)
(
arctan
arctan
−
+
=
=
γ
.
Usually a visual task area must be illuminated with a
few, and sometimes with a few dozens LEDs, so
illumination value at the selected point A is a sum of
individual illumination values produced by each source.
(7)
∑
=
=
n
i
A
E
E
1
where: n – number of LED diodes.
Results of calculations based on earlier presented light
distribution curves are shown in Table 2.
In case of diodes with wide light distribution (No 1, 2 and
5) only one position of point P, close to the centre of the
visual task area, has been assumed. Shifting the position of
the point P has practically no effect on the calculation
results. But in case of narrow beam diodes it was necessary
to distribute points P for particular light sources in such a
way, that the required illumination level (E = 560 lx) and
uniformity of illumination (
δ
= 70%) could be obtained.
It should be noted, that diodes No 1 and 2, if situated
over the visual task area with their axis perpendicular to it,
illuminate the area with high uniformity. However, if they are
situated askew, they illuminate a side part of the desk with
bigger illumination, than that on the visual task area.
Maximum value on the surrounding area equals to 1191 lx
and 1769 lx respectively. Luminous flux falling on the visual
task area equals to 5,1% and 4,3% of the total flux emitted
by the light sources. Therefore such LED diodes cannot be
applied for local lighting.
Cosine (Lambert) light distribution (LED No 5) is also too
wide. A change of position of points P only slightly changes
results of the calculations. Maximum value of illumination on
the area surrounding the visual task area is 821 lx, and the
coefficient of utilisation
η
= 7,4%. It is also too small to
recommend such light sources for local lighting.
Light distribution of diodes No 3 is characterised with
following useful angles:
δ
0,5
= 21° and
δ
0,1
= 56°. Situating
points P in the way shown in Table 2, only five diodes were
necessary to obtain required lighting parameters (E,
δ
). The
obtained coefficient of utilisation was
η
= 38,4%. By
changes of positions of points P, higher average illumination
can be obtained, but with poorer uniformity. Changes of
average illumination (E) and the coefficient of utilisation (
η
)
as a function of lighting uniformity (
δ
) are shown on Figure
3. As it was expected, increased uniformity is followed by a
decrease of illumination and of the coefficient of utilisation.
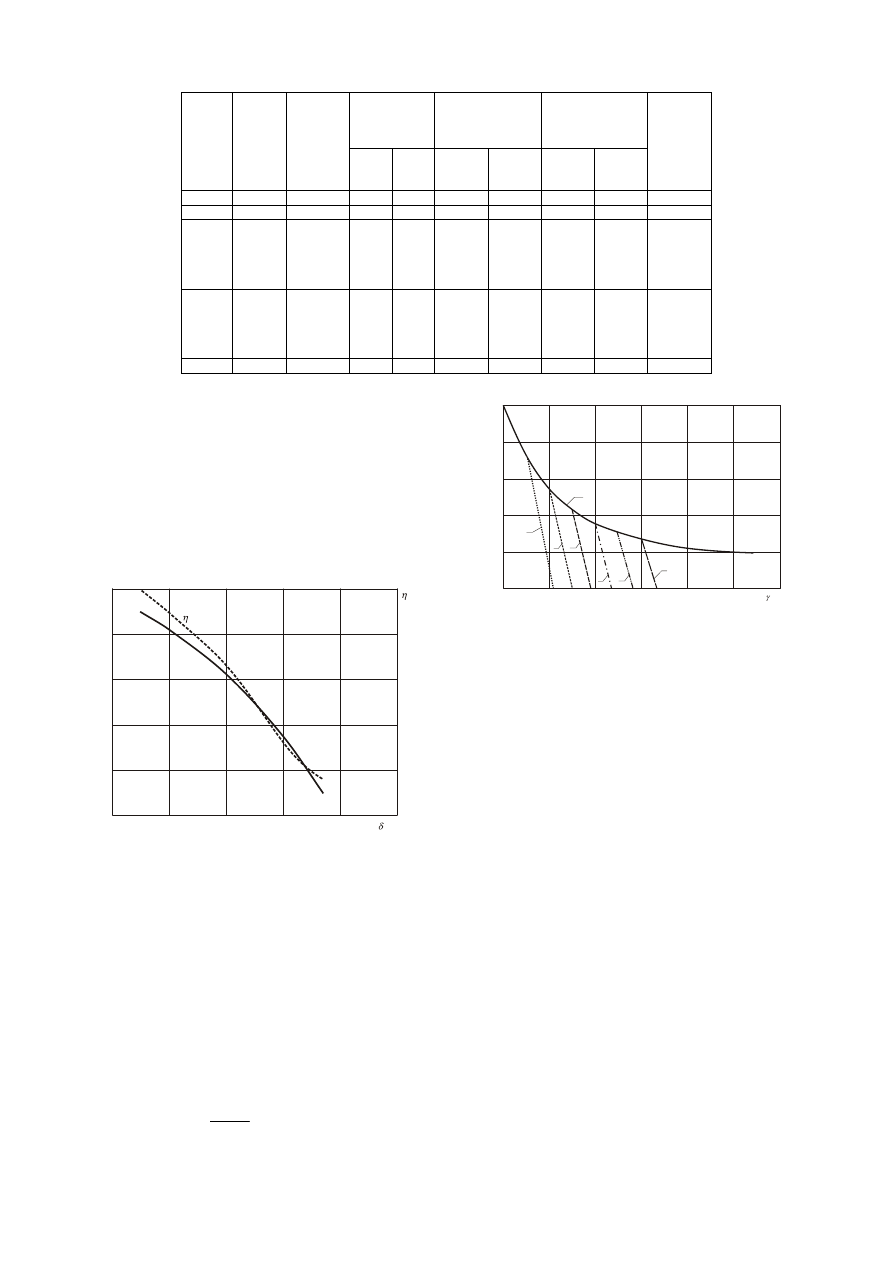
Table 2. Positions of calculation points P and results of lighting calculations
PRZEGLĄD ELEKTROTECHNICZNY, ISSN 0033-2097, R. 83 NR 5/2007
12
Position of
calculation
points P
[mm]
Average
illuminance
[lx]
Illuminance
uniformity
Light
distri-
bution
no.
No. of
diodes
n
Total
luminous
flux
[lm]
x
P
y
P
Visual
task
area
Rem.
part of
desk
Visual
task
area
Rem.
part of
desk
Coeffi-
cient of
utiliza-
tion
η
u
1 32 640
450
450
560,5
629,8
77,8%
60,4%
5,1%
2 35 760
450
460
559,2
739,5
77,2%
51,9%
4,3%
3 5 85,5
480
560
480
560
520
420
420
480
480
450
560,3 358,5 75,8% 83,7% 38,4%
4 5 60
320
570
320
570
530
350
350
340
560
450
591,1 332,9 74,5% 90,1% 61,1%
5 7 462
450
450
572,0
519,3
76,4%
67,5%
7,4%
Diodes No 4 have a still narrower light beam (
δ
0,5
= 11°;
δ
0,1
= 21°). Required lighting parameters can be obtained
using five such diodes. The coefficient of utilisation in this
case is
η
= 61,1%, in spite of lesser luminous efficiency
(compared with other LEDs).
In case of narrow beam diodes, better lighting uniformity
can be obtained by increasing number of diodes. On the
other hand, the coefficient of utilisation can be increased by
diminishing lighting flux radiated outside the useful angle.
Therefore a LED diode with an improved light distribution
should be elaborated.
500
520
540
560
580
lx
600
65%
70%
75%
80%
85%
E
E
30%
35%
40%
Fig. 3. Plots of average illumination (E) and the coefficient of
utilisation (
η
) as a function of lighting uniformity (
δ
)
A new structure of intensity distribution of a LED diode
If we assume, that the axis of the surface of intensity
distribution is directed to a corner of the visual task area
(point F on fig. 2), it would be possible to determine such a
curve of intensity distribution, which leads to constant
illumination on the segment FG.
If the surface of intensity distribution has a rotational
symmetry, illumination in a direction perpendicular to the
segment FG will change according to cosine function. With
the geometry described above, angle of incidence of the
luminous intensity vector at the point F is
γ
= 54°. Therefore
the curve of intensity distribution as a function of the angle
γ
can be determined using the formula:
(8)
γ
3
2
cos
h
E
I
=
0
0,2
0,4
0,6
0,8
1,0
0
10
20
30
40
50
60
J
o
o
o
o
o
o
o
1
2
3
4
5
6
7
Fig. 4. Curves of intensity distribution of LED diodes
The curve of intensity distribution has been presented
on Figure 4 (plot 1). The useful angle of the diode can be
selected in such a way, that the segment from point F to
point G (Fig. 2) is illuminated. In the discussed example it
will be
γ
= 28°. Figure 4 presents a few curves of intensity
distribution with different useful angles. A fall of luminous
intensity outside the useful angle
γ
has been designed in
such a way, that the fall is ca. 0,1 per 1
°. Plot 2 results in
constant illumination on the segment from point F in the
direction to point G within the angle 5
°, plot 3 – within the
angle 10
° and so on up to the plot 7 which gives constant
illumination within the angle 30
°.
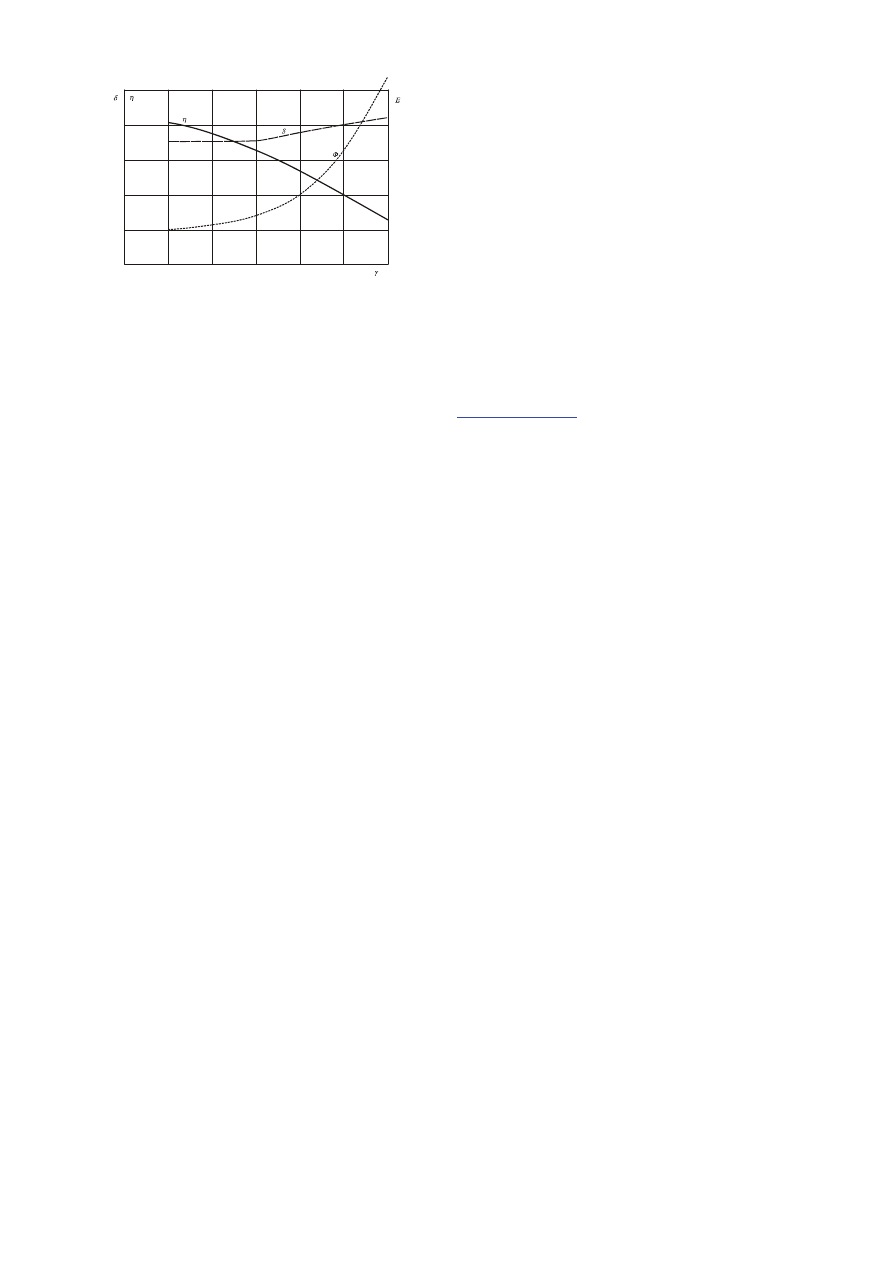
Results of simulation of illumination of the visual task
area with such diodes are presented on Figure 5. The
smaller is the angle (
γ
), the smaller is luminous flux (
Φ
)
necessary to produce required illumination on the area. It is
a result of higher coefficient of utilisation – with smaller light
distribution angles (
γ
), bigger part of the flux falls on the
visual task area. In case of diodes with light distribution
angles smaller than 15°, it is necessary to apply a few
diodes (four) to obtain illumination uniformity equal to 0.7.
The highest coefficient of utilisation is obtained for a fitting
with four narrow beam diodes (light distribution angle
γ
= 5°
and useful angle δ
0,5
= 14°). Luminous flux equal to 40 lm
will be enough to illuminate an A3 sheet with illumination
equal to 560 lx (including 300 lx from general lighting) with
uniformity not less than 0.7. But LEDs light distribution
should conform to the plot 2 (Fig. 4) and LED axes of
symmetry should be aimed at defined points P on the work
area.
PRZEGLĄD ELEKTROTECHNICZNY, ISSN 0033-2097, R. 83 NR 5/2007
13
0
0,2
0,4
0,6
0,8
1,0
0
5
10
15
20
40
20
25
30
60
80
100
120
o
o
o
o
o
o
o
[lx]
Fig. 5. Changes of luminous flux (
Φ
), useful coefficient of utilisation
(η) and uniformity of illumination (δ) in relation to the light
distribution angle (
γ
) of LED diodes
Remarks and conclusions
LED diodes with a Lambert light distribution can be
applied for illumination of visual task areas, but their
coefficient of utilisation is very small – equals to 7,4%, while
20% of the flux falls on the surrounding area (desk top) and
more than 72% - outside the desk.
Application of LED diodes with specific light distribution
may lead to even better coefficient of utilisation. Simulated
calculations for diodes with light distribution presented by
plot No 2 (on Fig. 4) show, that 81,9% of the total flux of the
lighting fitting falls on the visual task area and 12,8% on its
surrounding (totally above 94%).
The above reasoning leads to the conclusion, that it is
advisable to elaborate a specific local lighting fitting for LED
diodes with cosine light distribution, which uses an optic
system. Such a system (dioptic and/or catoptric) should
provide the required light distribution designed according to
requirements of work stands illumination.
The work was conducted at Bialystok University of Technology
within the statutory task S/WE/2/03
REFERENCES
[1] Polish Standard PN-EN 12464: 2004-1. Light and lighting.
Illumination of work places. Part 1. Work places in interiors
___________________
Author: prof. D.Sc. Władysław Dybczyński, Bialystok University of
Technology, ul. Wiejska 45D, 15-351 Białystok, Poland, E-mail:
PRZEGLĄD ELEKTROTECHNICZNY, ISSN 0033-2097, R. 83 NR 5/2007
14
Wyszukiwarka
Podobne podstrony:
Light Emitting Diodes
Applications of polyphase filters for bandpass sigma delta analog to digital conversion
94 1363 1372 On the Application of Hot Work Tool Steels for Mandrel Bars
Applications of polyphase filters for bandpass sigma delta analog to digital conversion
Application of LEDs in road lighting
Smarzewska, Sylwia; Ciesielski, Witold Application of a Graphene Oxide–Carbon Paste Electrode for t
Global Requirements for Medical Applications of Chitin and its Derivatives
Munster Application of an acoustic enhancement system for outdoor venues
Light quality impovement for white electroluminescent diodes
Application of SPME for determination of organic vapours in
Application of binary immobilized Candida rugosa lipase for
Application of Data Mining based Malicious Code Detection Techniques for Detecting new Spyware
Principles of Sigma Delta Conversion for Analog to Digital Converters
2 Application of Distributed Loads
2004 Applications of RT to translation
więcej podobnych podstron