
Application of a Graphene Oxide
–Carbon Paste Electrode
for the Determination of Lead in Rainbow Trout from Central
Europe
Sylwia Smarzewska
&
Witold Ciesielski
Received: 25 April 2014 / Accepted: 22 June 2014 / Published online: 22 July 2014
# The Author(s) 2014. This article is published with open access at Springerlink.com
Abstract In the presented study, the content of lead in rainbow
trout (Oncorhynchus mykiss) samples was examined. Rainbow
trout were purchased in Prague (Czech Republic), Lodz
(Poland) and Bratislava (Slovakia) from local fish shops and
supermarkets belonging to popular chain stores. First, method
for quantitative lead determination was developed with very
good results (R
2
at 0.9997 in the range of 1.0×10
−7
–7.0×
10
−5
mol L
−1
with limit of detection (LOD) and limit of quan-
tification (LOQ) 2.18×10
−8
and 7.24×10
−8
mol L
−1
, respective-
ly). Then, after mineralization, fish samples were analyzed using
square wave anodic stripping voltammetry (SWASV) with a
graphene oxide
–carbon paste electrode (GO–CPE). Lead sig-
nals recorded on GO
–CPE electrode were 15 % higher than
those obtained on bare CPE. The coefficient of variation (CV)
was found to be below 5 %. The selectivity of the proposed
method was evaluated by the addition of selected heavy metals
(zinc, copper, mercury, cobalt, nickel, iron) as possible
interferents. Results were confirmed with reference method.
Keywords Graphene oxide
–carbonpasteelectrode .Rainbow
trout . Lead determination . Square wave anodic stripping
voltammetry
Introduction
Nowadays, countries all over the world face the problem of
environmental pollution (Gallo and Almirall
; Ozden
). Many ecological and environmental changes emerge
as a result of human agricultural and industrial activity (Pohl
et al.
; Szyczewski et al.
). Significant emphasis is
placed on a wide range of chemical pollutants including heavy
metals (Orecchio and Amorello
; Akinci et al.
; Struis
et al.
). Aquatic pollution caused by heavy metals is
particularly important due to their toxicity and accumulation
capacity in organisms (Mendil et al.
; Shah et al.
).
High levels of copper, lead and iron have been found to cause
physiological changes in fish (Tarrio et al.
). On the other
hand, fish are an important part of a balanced human diet as
they contain a lot of proteins, vitamins, minerals and polyun-
saturated fatty acids (Shrestha et al.
; Gogus and Smith
). Thus, the Nutrition Committee of the American Heart
Association recommends eating fish at least twice a week to
prevent cardiovascular diseases (Kris-Etherton et al.
Rainbow trout (Oncorhynchus mykiss, in the family
Salmonidae) are widely used as a farmed fish in many countries
around the world due to its high nutritional value and rapid
growth (Gall and Crandell
; Mashaie
). Nevertheless,
fish can be a source of contaminants, such as highly toxic heavy
metals. Hence, the determination of metals in fish is indeed
indispensable and has drawn much attention in recent years
(Sneddon et al.
; Sneddon and Vincent
; Zmozinski
et al.
; Rofouei et al.
). Analysis of heavy metals in
the various tissues of fish has been widely pursued using
different methods, including electrochemistry (Bagheri et al.
), atomic absorption spectrophotometry (Al-Kahtani
;
Fernandes et al.
), inductively coupled plasma mass spec-
trometry (Kalantzi et al.
; Schenone et al.
) and
differential thermal analysis (Najafi et al.
). Among these
methods, voltammetry is one of the preferred techniques due to
its high sensitivity, simplicity and environmental friendliness.
What is more, the properties of working electrodes used in
voltammetry may be easily improved by simple modifications
of electrode material or surface to achieve better stability,
reproducibility and selectivity. In recent years, there has been
a growing interest in the use of graphene and graphene oxide in
various types of studies (Wang et al.
; Wu et al.
S. Smarzewska (
*)
:
W. Ciesielski
Department of Inorganic and Analytical Chemistry, Faculty of
Chemistry, University of Lodz, Tamka 12, 91-403 Lodz, Poland
e-mail: sylwiasmarzewska@gmail.com
Food Anal. Methods (2015) 8:635
–642
DOI 10.1007/s12161-014-9925-4
) due to their promising properties (Chen et al.
) such
as electron transport capability (Novoselov et al.
; Zhang
et al.
), thermal and electrical conductivity (Balandin et al.
; Bolotin et al.
), mechanical stiffness (Lee et al.
) and unprecedented pliability and impermeability
(Bunch et al.
; Lee et al.
). Graphene has been found
to have a variety of applications, e.g. in sensors (Robinson et al.
), polymer composites (Domingues et al.
), transpar-
ent electrodes (Zhao et al.
; Blake et al.
) and hydro-
gen storage (Dimitrakakis et al.
). Up-to-date graphene
and graphene oxide-modified carbon paste electrodes have
been successfully applied for the determination of lead (Chen
et al.
; Li et al.
; Wonsawat et al.
; Yang et al.
). In this paper, we report the application of a graphene
oxide-modified carbon paste electrode for quantitative lead
determination in rainbow trout muscle tissue under conditions
of square wave anodic stripping voltammetry (SWASV). Both
carbon paste electrodes and square wave voltammetry (SWV)
are very popular in various fields of research. SW techniques
owe their prevalence (Mirceski et al.
,
; Pacheco
et al.
; da Costa Fulgencio et al.
; Smarzewska et al.
; Snevajsova et al.
; Skrzypek et al.
Nosal-Wiercinska and Dalmata
) to rapidity, simplicity
and sensitivity, while carbon paste electrodes are cheap, stable
and easy to modify (Svancara et al.
; Arvand and
Kermanian
; Vazquez et al.
; Khaled et al.
Kalcher
; Mailley et al.
; Fathirad et al.
Material and Methods
Instrumentation
A
μAutolab Type III/General Purpose Electrochemical System
(GPES, version 4.9; Eco Chemie, Netherlands) was used with
an M164 electrode stand (mtm-anko, Cracow, Poland) for all
voltammetric measurements. Experiments were performed in a
typical three-electrode system with a working GO
–CPE or
hanging mercury drop electrode (HMDE), a reference Ag/
AgCl electrode (3 mol L
−1
KCl) and a counter electrode (Pt
wire). Measurements of pH were made using a CP-315M pH
meter (Elmetron, Poland) with a combined glass electrode.
Solutions and Materials
All the chemicals used (graphene oxide, graphite, paraffin oil,
hydrochloric acid, perchloric acid, lead nitrate) were of analytical
reagent grade and were purchased from Sigma-Aldrich. To
prepare a graphene oxide
–carbon paste electrode, 0.45 g of
graphite powder, 0.05 g of graphene oxide and 150
μL of
paraffin oil were mixed and homogenized (15 min) and then
packed into a piston-driven carbon paste electrode holder. Before
each experiment, the surface of the GO
–CPE was refreshed by
squeezing out a small portion of paste and polishing it with wet
filter paper until a smooth surface was obtained.
SWASV Analysis
The general procedure adopted for obtaining adsorptive strip-
ping voltammograms was as follows: the required aliquot of
the analyzed working solution was placed in a cell containing
a supporting electrolyte, deaerated by passing an argon stream
for 600 s, and then stirred at a chosen accumulation potential
throughout the selected accumulation period. Following the
pre-concentration step, the stirrer was stopped, and after 3 s,
scans were carried out over the range of
−1.2 to +1.0 V using
the SW technique. All measurements were made in a standard
10 mL voltammetric cell, at room temperature. In order to
ensure the reliability of the experiments, all samples were also
investigated using an HMDE electrode.
Preparation of Real Samples
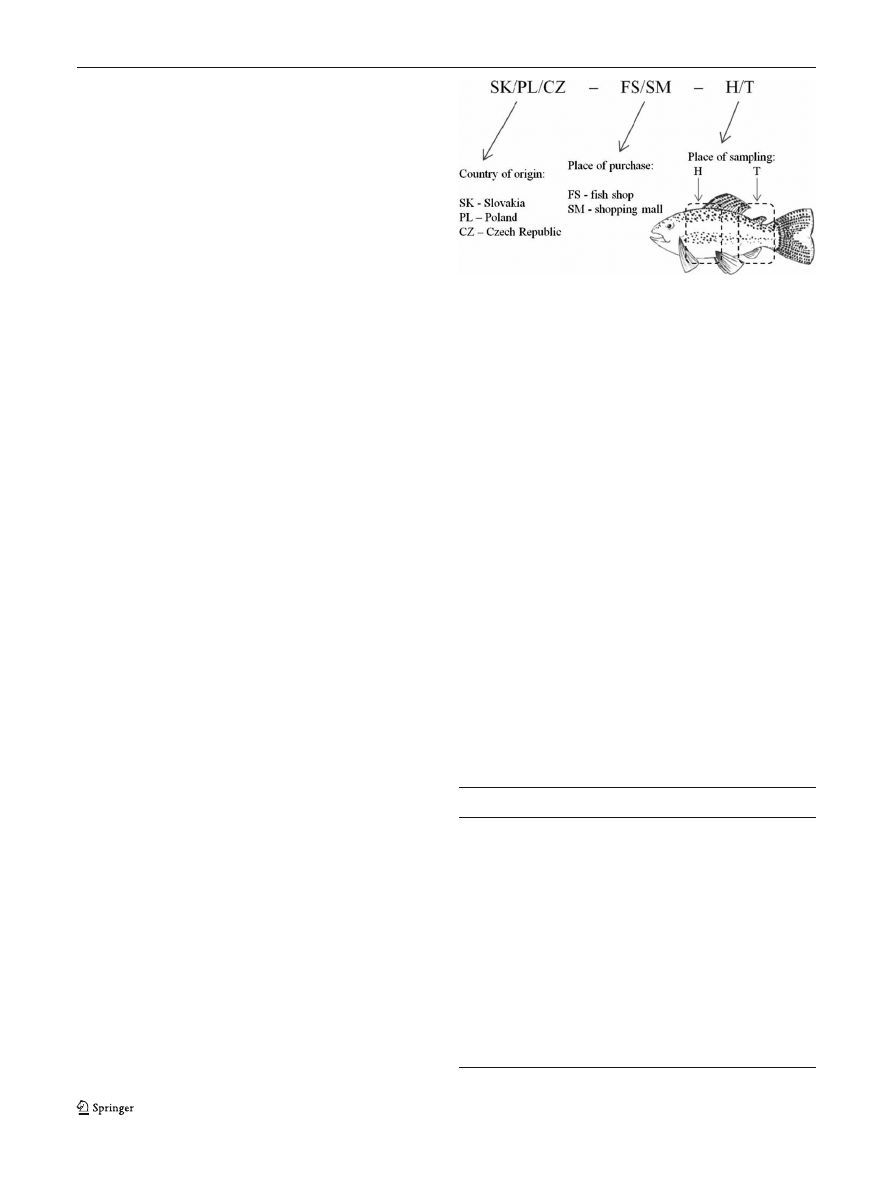
Rainbow trout were purchased in Prague (Czech Republic),
Lodz (Poland) and Bratislava (Slovakia) from local fish shops
Scheme 1 Nomenclature of the samples
Table 1 Quantitative determination of lead in 0.1 M HCl by SWASV.
Basic statistic data of the regression line
GO
–CPE
HMDE
Linear concentration range
(mol L
−1
)
1.0×10
−7
–7.0×10
−5
1.0×10
−7
–5.0×10
−5
Slope of calibration
graph (A) (L mol
−1
)
4.01
3.39
SD of the slope
4.6×10
−2
9.4×10
−3
Intercept (A)
2.72×10
−8
1.04×10
−8
SD of the intercept
2.90×10
−9
6.62×10
−10
Correlation coefficient
0.9997
0.9997
LOD (mol L
−1
)
2.18×10
−8
5.87×10
−9
LOQ (mol L
−1
)
7.24×10
−8
1.96×10
−8
Repeatability of peak
current (CV)
1.8
2.9
Repeatability of peak
potential (CV)
0.65
1.2
636
Food Anal. Methods (2015) 8:635
–642
and large shopping malls belonging to popular chain
stores. Fish samples were marked as shown in
Scheme
. Fish sample solutions were mineralized
with a mixture of HClO
4
/HNO
3
according to the
method described in Sobhanardakani et al. (
). After
mineralization, the samples were filled up to volume (in
10-mL flasks) with 1:1 (v/v) water/0.1 M HCl mixture
(sample solutions). Then, the rainbow trout were ana-
lyzed using the standard addition method. For each fish
sample, some preliminary studies were conducted to
adjust the amount of standard solution.
Linear Regression Equation, Calibration Curve
and Sensitivity
Calibration curves (described with the linear regression equa-
tion y=bx+a) were constructed by plotting lead peak current
(I, A) against lead concentration (C, mol L
−1
) on the basis of
12 (GO
–CPE) or 11 (HMDE) lead standard solutions for the
concentration ranges 1.0 × 10
−7
–7.0×10
−5
and 1.0 × 10
−7
–
5.0×10
−5
mol L
−1
, respectively. To evaluate the sensitivity
of SWASV analysis, the limit of detection (LOD) and the limit
of quantification (LOQ) were determined. LOQ and
LOD were calculated from the calibration curves as k
SD / b (k = 10 for LOQ, k = 3 for LOD, SD = standard
deviation of the intercept, b = slope of the calibration
curve, dos Santos et al.
). For each concentration
from the calibration curve, the coefficient of variation
(CV) was calculated using the formula as follows:
CV = (SD × C
ave
−1
) × 100 %, where C
ave
represents the
average lead concentration calculated from the linear regres-
sion equation and SD is the standard deviation of the calcu-
lated concentrations.
Precision and Accuracy
The precision of the developed method was evaluated
for the GO
–CPE by the coefficient of variation of three
intra- and inter-day replicate measurements of CZ
–FS–T
and SK
–FS–H samples done within 1 day and for three
consecutive days, respectively. The accuracy of the
SWASV method was determined by spike recovery.
Appropriate amounts of lead nitrate standard solution
were added into distilled water. Spiked distilled water
solutions were mineralized and analyzed using the stan-
dard addition method under the experimental conditions
as for fish samples described in
” and
“
” sections. The recovery of
each spiked solution was calculated using the following
formula: Recovery (%) = 100 + [(C
ave
−C
spi
) / (C
spi
)] × 100,
where C
spi
is the actual lead concentration in a spiked
sample and C
ave
is the average lead concentration cal-
culated using the least-squares regression method on the
basis of standard addition method results.
Results and Discussion
Influence of SW Parameters
Research work was started with the selection of supporting
electrolyte. First, various supporting electrolytes were tested
(BR buffers, acetate buffer, ammonia buffer, hydrochloric
acid, nitric acid) in the pH range 0.5
–10. The highest lead
signals were recorded in acidic solutions pH 1.0
–3.0. Al-
though the recorded signals in pH 2.0 were 3
–8 % higher
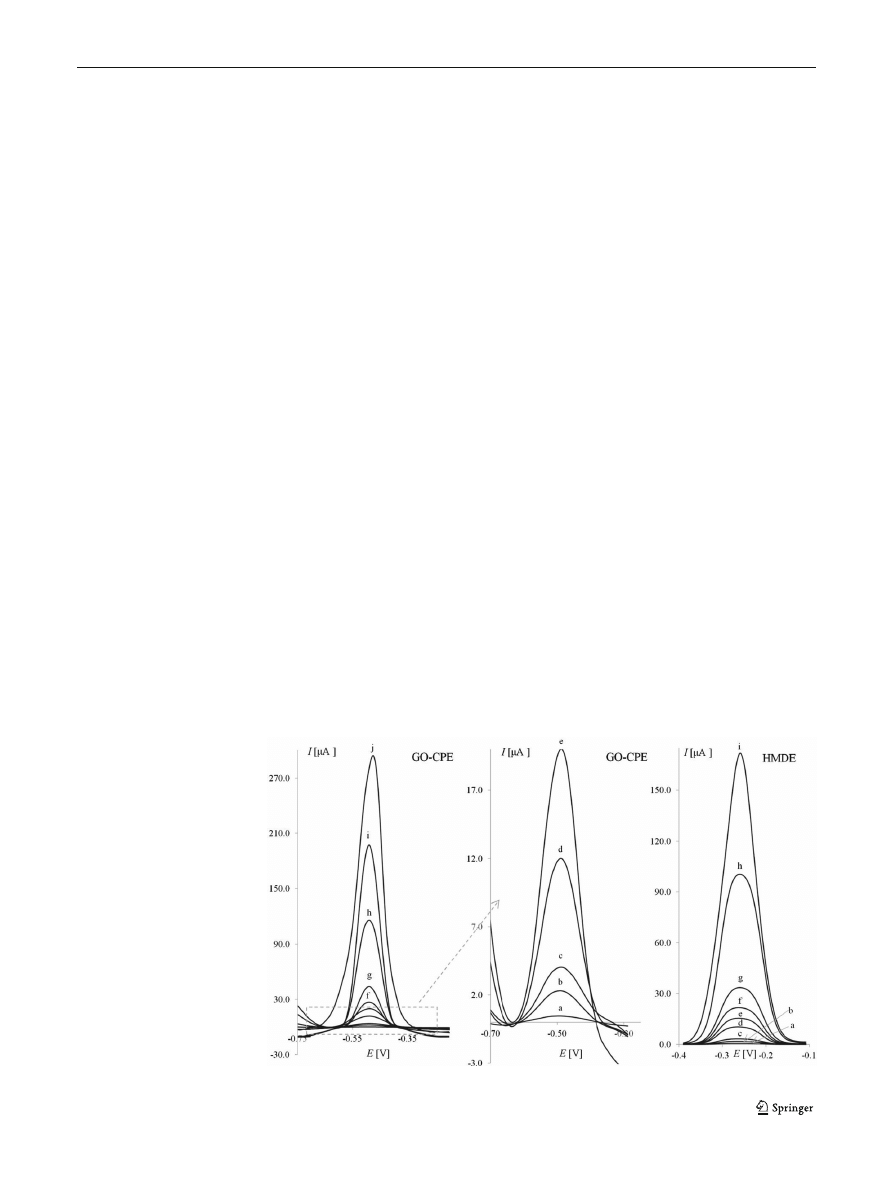
Fig. 1 SWASV voltammograms
of lead in 0.1 M HCl on GO
–CPE
and HMDE, lead concentrations
(in
μmol L
−1
): a 0.10, b 0.50, c
1.0, d 3.0, e 5.0, f 7.0, g 10.0, h
30.0, i 50.00 and j 70.0. The other
experimental conditions were as
follows: amplitude (E
sw
)=50 mV,
step potential (
ΔE)=8 mV,
frequency (f)=8 Hz,
accumulation potential
(E
acc
)=
−0.9 V and accumulation
time (t
acc
)=90 s
Food Anal. Methods (2015) 8:635
–642
637

(but had slightly worse morphology) than those in pH 1.0, in
the preliminary studies, it was found that the pH of the
mineralized samples was around 1.0; therefore, to ensure
reliable and comparable results, pH 1.0 was chosen for all
the experiments. Next, several supporting electrolyte solutions
were examined at pH 1.0 in detail (hydrochloric acid, nitric
acid, sulfuric acid and perchloric acid) with various
techniques (LSV, DPV, SWV). The strongest, well-
shaped signals were obtained in 0.1 M HCl solution
for all the used techniques. Considering sensitivity and
signal shape, SWASV was chosen for analytical pur-
poses. Then, the influence of SWASV parameters on
lead peak current was examined. During adjusting the
above-mentioned parameters, each parameter was
changed while the others were kept constant using 5 ×
10
−6
mol L
−1
lead concentration. These parameters have
correlative influence on the measured peak potential and
current, but in this study, only the general tendencies
were investigated. The studied square wave amplitude,
step potential, frequency, accumulation potential and
accumulation time ranges were 5
–200 mV, 1–25 mV,
8
–200 Hz, −2.0 to −0.6 V and 5–300 s, respectively.
The optimized values were as follows: E
sw
= 50 mV,
ΔE=8 mV, f=8 Hz, E
acc
=
−0.9 V and t
acc
= 90 s.
Validation of the Developed Method
First, it is worth mentioning that lead signals recorded on GO
–
CPE electrode in optimized conditions were 15 % higher than
those obtained on bare CPE. In our opinion, according to
graphene oxide content in paste, modified electrode has better
conductivity (as explained in the
” section). That
was confirmed by resistance measurements; measured resis-
tance for CPE and GO
–CPE was equal to 235 and 147 Ω,
respectively. In order to validate the developed SWASV ana-
lytical method, linearity, precision, accuracy, sensitivity and
stability were evaluated. Linear regression equations, linearity,
LOD and LOQ are presented in Table
. Linearity is given by
the correlation coefficient (R
2
) and shows very good correla-
tion with R
2
at 0.9997 in the range of 1.0 × 10
−7
–7.0×
10
−5
mol L
−1
(GO
–CPE). The LOD and LOQ were 2.18×
10
−8
and 7.24×10
−8
mol L
−1
, respectively. The voltammo-
grams recorded on the GO
–CPE and HMDE during calibra-
tion curve examination are shown in Fig.
.
Repeatability of the procedure was estimated with three
measurements at the same lead concentration. In order to
check the correctness of the method, precision (expressed by
CV) and recovery of the method were also calculated for
different concentrations within the linear range (Table
).
Table 2 Recovery and precision of the lead peak currents at various lead concentrations
Concentration
given (
μmol L
−1
)
GO
–CPE
HMDE
Concentration found
(
μmol L
−1
)
Confidence limit
(×10
−6
)
CV
(%)
Recovery
(%)
Concentration found
(
μmol L
−1
)
Confidence limit
(×10
−6
)
CV
(%)
Recovery
(%)
0.1000
0.1030
0.0028
2.42
102.9
0.1019
0.0096
8.30
101.9
0.3000
0.288
0.016
4.76
96.1
0.2898
0.0097
2.95
96.6
0.500
0.511
0.017
2.98
102.2
0.509
0.036
6.33
101.8
0.700
0.712
0.031
3.87
101.7
0.698
0.047
6.01
99.7
1.000
1.036
0.011
0.96
103.6
0.987
0.077
6.91
98.7
3.00
3.02
0.23
6.63
100.6
2.87
0.089
2.73
95.7
5.00
5.07
0.13
2.32
101.4
4.98
0.29
5.18
99.6
7.00
7.23
0.17
2.08
103.3
7.03
0.30
3.78
100.4
10.00
10.23
0.43
3.73
102.3
9.90
0.47
4.16
99.0
30.0
29.0
2.6
7.94
96.7
29.1
1.6
4.85
97.0
50.0
49.7
1.3
2.37
99.4
50.9
1.2
2.05
101.8
70.00
70.57
0.28
0.35
100.8
–
–
–
–
Table 3 Precision test of the
SWASV analysis on GO
–CPE
Sample
Found (mg/100 g)
Intra-day measurements
(average±SD, n=3)
CV
Inter-day measurements
(average±SD, n=3)
CV
SK
–FS–H
0.03685±0.00077
2.09
0.03663±0.00050
1.37
CZ
–FS–T
0.1145±0.0018
1.56
0.1130±0.0053
4.68
638
Food Anal. Methods (2015) 8:635
–642
Variations (CV) of the amount of lead found in samples
SK
–FS–H and CZ–FS–T were 1.37–4.68 %, indicating that
the lead contained in the mineralized samples was stable for at
least 72 h. Coefficient of variations for intra- and inter-day
measurements is shown in Table
. Overall variations did not
exceed 2.1 % for intra-day runs and 4.7 % for inter-day runs.
Recoveries were also determined for the two spiked dis-
tilled water solutions. Each water sample was contaminated
by the addition of a specified concentration of lead. An aliquot
of each sample was added into the electrochemical cell, and
recovery curves were constructed by the standard addition
method, using the optimized parameters. Three replicate anal-
yses were made for each sample. The least-squares regression
method was used to evaluate the recovery percentage. The
obtained SWV responses are shown in Fig.
. The calculated
recoveries of the analyzed samples varied in the range of
98.7
–109.6 % (Table
), demonstrating that the developed
SWASV method was precise and accurate.
Analysis of Rainbow Trout Samples
Analysis of real samples was preceded by testing of the used
solutions for lead content. Samples of distilled water,
supporting electrolyte and HClO
4
/HNO
3
mixture were miner-
alized and analyzed as described in
” and
“
” sections. Lead was not detected
in any of the samples. As described in the
” section, fish samples were mineralized and then
analyzed using the standard addition method. As can be seen
in Fig.
, where sample voltammograms are shown, in each
experiment, three additions of the standard were made.
Amounts of the standard lead solution varied between samples
from 1×10
−8
to 1×10
−7
mol due to differences in lead content
between fish samples (for example, additions contained 2×
10
−8
and 8×10
−8
mol of lead for CZ
–FS–T and PL–SM–H
samples, respectively). The lead content calculated for rainbow
trout samples is shown in Table
. Obtained results (for both
electrodes) were compared with popular statistical tests (F test,
Student
’s t test). As it was calculated from F test, standard
deviation values differ significantly in terms of precision only
for sample CZ
–SM–H. Student’s t test indicate that only results
for samples SK
–FS–H and SK–FS–T differ in a statistically
significant way in terms of accuracy. Additionally, a linear
relationship between lead content and fish length was observed.
This relationship can be described with the following equation:
m
Pb
(mg/100 g)=0.046 l
fish
(cm)
−0.0597, where m
Pb
is the
found amount of lead (in mg for 100 g of fish) and l
fish
is fish
length. This relationship is probably due to the fact that the
longer a fish lives (the length of fish increases with age), the
longer is the time of lead accumulation.
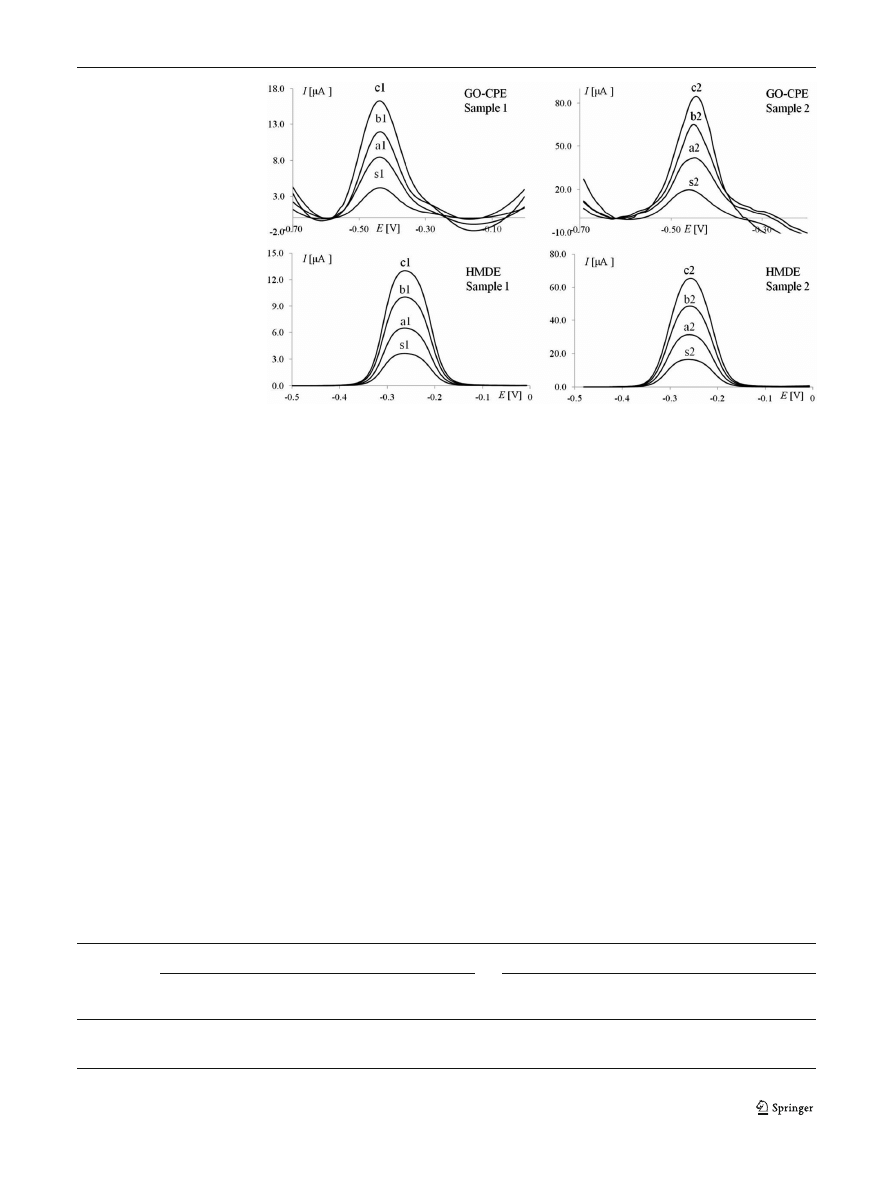
Fig. 2 SWASV voltammograms
of lead determination in spiked
samples using standard addition
method. Sample 1: s1 sample
(1.0
μmol L
−1
) and a1/b1/c1
standard additions
(1.0×10
−8
mol); sample 2
(5.0
μmol L
−1
): s2 sample and
a2/b2/c2 standard additions
(5.0×10
−8
mol) at GO
–CPE and
HMDE in 0.01 M HCl.
Experimental conditions are the
same as those in Fig.
Table 4 Determination of lead in spiked samples
Added
(
μmol L
−1
)
GO
–CPE
HMDE
Found
(
μmol L
−1
)
Confidence limit
(×10
−6
)
Precision
CV
Recovery
(%)
Found
(
μmol L
−1
)
Confidence limit
(×10
−6
)
Precision
CV
Recovery
(%)
1.000
1.026
0.027
2.35
102.9
1.096
0.048
3.84
109.6
5.000
5.02
0.14
2.43
100.4
4.936
0.076
1.36
98.7
Food Anal. Methods (2015) 8:635
–642
639
Selectivity of the Method
The selectivity of the developed method was evaluated
by the addition of possible interferents
–heavy metals
(zinc, mercury, cadmium, copper, nickel and cobalt).
To 5 × 10
−6
mol L
−1
lead, solutions of interferents were
added at concentration ratios of 1:1, 1:2 and 1:10. The
responses were compared to those obtained for the pure
standard lead solution. Only the presence of cadmium
caused significant enhancement of the background cur-
rent (without influencing the lead peak current). The
other studied substances did not interfere with the determina-
tion of lead under the working conditions used (signal
change <3 %).
Conclusions
Graphene oxide-modified carbon paste electrode was used in
combination with the SWASV technique to develop a novel and
alternative electroanalytical method for lead determination in real
samples. The GO-modified electrode exhibits stability, reproduc-
ibility and favourable properties for quantitative lead determina-
tion. Micromolar concentrations of lead were determined by
square wave anodic stripping voltammetry at the surface of the
GO
–CPE with a CV smaller than 5 %, recoveries in the range of
96.1 to 103.6 % and a LOQ of 7.24×10
−8
mol L
−1
. The
important point that should be emphasized is the environmental
friendliness and/or low cost of the GO
–CPE in comparison to
e.g. metal film electrodes (Bi, Hg, Au) frequently used in lead
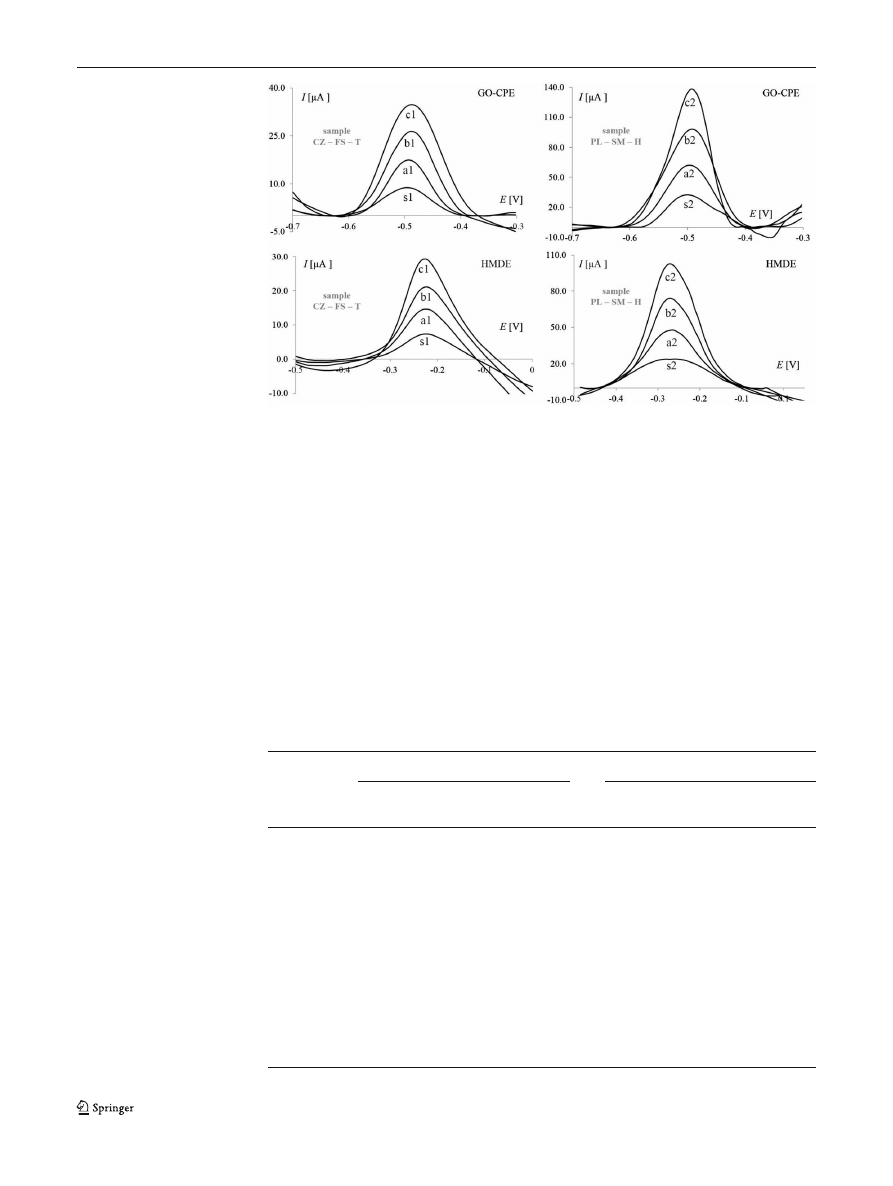
Fig. 3 SWASV voltammograms
of lead determination in rainbow
trout muscles using standard
addition method (sample CZ
–FS–
T: s1 sample and a1/b1/c1
standard additions; sample
PL
–SM–H: s2 sample and
a2/b2/c2 standard additions) on
GO
–CPE and HMDE in 0.01 M
HCl. Experimental conditions are
the same as those in Fig.
Table 5 Contents of lead in
rainbow trout
Sample
GO
–CPE
HMDE
Found
(mg/100 g)
Confidence
limit (×10
−2
)
CV
Found
(mg/100 g)
Confidence
limit (×10
−2
)
CV
CZ
–SM–H
0.426
3.82
4.92
0.428
0.299
0.62
CZ
–SM–T
0.417
3.28
4.95
0.430
1.77
3.65
CZ
–FS–H
0.121
0.621
4.52
0.119
0.327
2.43
CZ
–FS–T
0.114
0.203
1.56
0.110
0.529
4.22
PL
–SM–H
0.628
2.43
3.41
0.612
2.16
3.12
PL
–SM–T
0.608
3.51
4.90
0.601
1.75
2.58
PL
–FS–H
0.167
1.12
4.94
0.183
0.982
4.74
PL
–FS–T
0.153
0.352
2.03
0.145
0.796
4.82
SK
–SM–H
0.066
0.0586
0.78
No data
SK
–SM–T
0.065
0.225
3.05
No data
SK
–FS–H
0.036
0.0873
2.09
0.041
0.216
4.63
SK
–FS–T
0.036
0.994
2.41
0.045
0.170
3.33
640
Food Anal. Methods (2015) 8:635
–642

determination. Furthermore, GO
–CPE offers also a simple and
rapid cleaning procedure, which allows for the use of the elec-
trode for a long time with reproducible responses. The other
benefits of the developed method such as rapidity and simplicity
were proven by the successful application of the method to
rainbow trout analysis following simple preparation of samples.
It is worth noting that the results obtained on the GO
–CPE are
comparable with those obtained on the HMDE. The GO
–CPE
exhibits small variation coefficients, very good recoveries and a
linear range even longer than that obtained for the HMDE. Such
behaviour proves that mercury electrodes and metal film elec-
trodes can be successfully replaced by environmentally friendly
carbon electrodes with graphene oxide modifications, as the
sensitivity exhibited by GO
–CPE electrode is sufficient for real
sample analysis.
Acknowledgments
Financial support of the grant 506/1123 from the
Ministry of Science and Higher Education is gratefully acknowledged.
Conflict of Interest
Sylwia Smarzewska declares that she has no
conflict of interest. Witold Ciesielski declares that he has no conflict of
interest. This article does not contain any studies with human or animal
subjects.
Open Access This article is distributed under the terms of the Creative
Commons Attribution License which permits any use, distribution, and
reproduction in any medium, provided the original author(s) and the
source are credited.
References
Akinci G, Guven DE, Ugurlu SK (2013) Assessing pollution in Izmir Bay
from rivers in western Turkey: heavy metals. Environ Sci Process
Impact 15:2252
–2262
Al-Kahtani MA (2009) Accumulation of heavy metals in tilapia fish
(Oreochromis niloticus) from Al-Khadoud Spring, Al-Hassa,
Saudi Arabia. Am J Appl Sci 6:2024
–2029
Arvand M, Kermanian M (2013) Potentiometric determination of alumi-
num in foods, pharmaceuticals, and alloys by AlMCM-41-modified
carbon paste electrode. FoAnal Methods 6:578
–586
Bagheri H, Afkhami A, Khoshsafar H, Rezaei M, Shirzadmehr A (2013)
Simultaneous electrochemical determination of heavy metals using
a triphenylphosphine/MWCNTs composite carbon ionic liquid elec-
trode. Sens Actuators B 186:451
–460
Balandin AA, Ghosh S, Bao WZ, Calizo I, Teweldebrhan D, Miao F, Lau
CN (2008) Superior thermal conductivity of single-layer graphene.
Nano Lett 8:902
–907. doi:
Blake P, Brimicombe PD, Nair RR, Booth TJ, Jiang D, Schedin F et al (2008)
Graphene-based liquid crystal device. Nano Lett 8:1704
–1708
Bolotin KI et al (2008) Ultrahigh electron mobility in suspended
graphene. Solid State Commun 146:351
–355. doi:
Bunch JS, Verbridge SS, Alden JS, van der Zande AM, Parpia JM,
Craighead HG, McEuen PL (2008) Impermeable atomic membranes
from graphene sheets. Nano Lett 8:2458
–2462. doi:
Chen D, Feng HB, Li JH (2012) Graphene oxide: preparation,
functionalization, and electrochemical applications. Chem Rev
112:6027
–6053. doi:
Chen M, Chao M, Ma X (2013) Poly(crystal violet)/graphene-modified
electrode for the simultaneous determination of trace lead and cad-
mium ions in water samples. J Appl Electrochem 44:337
–344
da Costa Fulgencio AC, Saczk AA, de Oliveira MF, Okumura LL (2014)
New voltammetry-based analytical method for indirect determina-
tion of procymidone in Brazilian apples. Food Anal Methods 7:31
–
38
Dimitrakakis GK, Tylianakis E, Froudakis GE (2008) Pillared graphene:
a new 3-D network nanostructure for enhanced hydrogen storage.
Nano Lett 8:3166
–3170
Domingues SH, Salvatierra RV, Oliveira MM, Zarbin AJG (2011)
Transparent and conductive thin films of graphene/polyaniline
nanocomposites prepared through interfacial polymerization.
Chem Commun 47:2592
–2594
dos Santos LBO, Abate G, Masini JC (2004) Determination of atrazine
using square wave voltammetry with the hanging mercury drop
electrode (HMDE). Talanta 62:667
–674
Fathirad F, Afzali D, Mostafavi A, Shamspur T, Fozooni S (2013)
Fabrication of a new carbon paste electrode modified with multi-
walled carbon nanotube for stripping voltammetric determination of
bismuth(III). Electrochim Acta 103:206
–210. doi:
Fernandes C, Fontainhas-Fernandes A, Cabral D, Salgado MA (2008)
Heavy metals in water, sediment and tissues of Liza saliens from
Esmoriz
–Paramos lagoon. Port Environ Monit Assess 136:267–275
Gall GAE, Crandell PA (1992) The rainbow trout. Aquaculture 100:1
–10
Gallo JM, Almirall JR (2009) Elemental analysis of white cotton fiber
evidence using solution ICP-MS and laser ablation ICP-MS (LA-
ICP-MS). Forensic Sci Int 190:52
–57
Gogus U, Smith C (2010) n-3 omega fatty acids: a review of current
knowledge. Int J Food Sci Technol 45:417
–436
Kalantzi I, Shimmield TM, Pergantis SA, Papageorgiou N, Black KD,
Karakassis I (2013) Heavy metals, trace elements and sediment
geochemistry at four Mediterranean fish farms. Sci Total Environ
444:128
–137
Kalcher K (1990) Chemically modified carbon paste electrodes in
voltammetric analysis. Electroanalysis 2:419
–433
Khaled E, Hassan HNA, Girgis A, Metelka R (2008) Construction of
novel simple phosphate screen-printed and carbon paste ion-
selective electrodes. Talanta 77:737
–743
Kris-Etherton PM, Harris WS, Appel LJ (2002) Fish consumption, fish
oil, omega-3 fatty acids, and cardiovascular disease. Circulation
106:2747
–2757
Lee C, Wei X, Kysar JW, Hone J (2008) Measurement of the elastic
properties and intrinsic strength of monolayer graphene. Science
321:385
–388. doi:
10.1126/science.1157996321/5887/385 [pii]
Li J, Guo S, Zhai Y, Wang E (2009) High-sensitivity determination of
lead and cadmium based on the Nafion-graphene composite film.
Anal Chim Acta 649:196
–201. doi:
Mailley P, Cummings EA, Mailley S, Cosnier S, Eggins BR, McAdams E
(2004) Amperometric detection of phenolic compounds by polypyrrole-
based composite carbon paste electrodes. Bioelectrochemistry 63:291
–
296. doi:
10.1016/j.bioelechem.2003.11.008
Mashaie MA (2001) Manual of trout farming. Nourbakhsh, Tehran, pp
17
–26
Mendil D, Celik F, Tuzen M, Soylak M (2009) Assessment of trace metal
levels in some moss and lichen samples collected from near the
motorway in Turkey. J Hazard Mater 166:1344
–1350
Mirceski V, Guziejewski D, Ciesielski W (2011) Theoretical treatment of
a cathodic stripping mechanism of an insoluble salt coupled with a
chemical reaction in conditions of square wave voltammetry.
Application to 6-mercaptopurine-9-
D
-riboside in the presence of
Ni(II). Electroanalysis 23:1365
–1375
Mirceski V, Guziejewski D, Lisichkov K (2013a) Electrode kinetic mea-
surements with square-wave voltammetry at a constant scan rate.
Electrochim Acta 114:667
–673
Food Anal. Methods (2015) 8:635
–642
641

Mirceski V, Laborda E, Guziejewski D, Compton RG (2013b) New
approach to electrode kinetic measurements in square-wave volt-
ammetry. Amplitude-based quasireversible maximum. Anal Chem
85:5586
–5594
Najafi E, Aboufazeli F, LotfiZadehZhad HR, Sadeghi O, Amani V (2013)
A novel magnetic ion imprinted nano-polymer for selective separa-
tion and determination of low levels of mercury(II) ions in fish
samples. Food Chem 141:4040
–4045
Nosal-Wiercinska A, Dalmata G (2009) Application of the catalytic
properties of N-methylthiourea to the determination of In(III) at
low levels by square wave voltammetry. Monatsh Chem 140:
1421
–1424
Novoselov KS et al (2005) Two-dimensional gas of massless Dirac
fermions in graphene. Nature 438:197
–200. doi:
Orecchio S, Amorello D (2010) Platinum and rhodium associated with
the leaves of Nerium oleander L. Analytical method using voltamm-
etry; assessment of air quality in the Palermo (Italy) area. J Hazard
Mater 174:720
–727
Ozden O (2010) Micro, macro mineral and proximate composition of
Atlantic bonito and horse mackerel: a monthly differentiation. Int J
Food Sci Technol 45:578
–586
Pacheco WF, Doyle A, Duarte DRA, Ferraz CS, Farias PAM, Aucelio RQ
(2010) Square-wave adsorptive stripping voltammetry for trace
determination of dimoxystrobin and azoxystrobin in potatoes and
grapes. Food Anal Methods 3:205
–210
Pohl P, Sergie I, Stecka H (2009) Determination and fractionation of
metals in honey. Crit Rev Anal Chem 39:276
–288
Robinson JT, Perkins FK, Snow ES, Wei ZQ, Sheehan PE (2008)
Reduced graphene oxide molecular sensors. Nano Lett 8:3137
–3140
Rofouei MK, Rezaei A, Masteri-Farahani M, Khani H (2012) Selective
extraction and preconcentration of ultra-trace level of mercury ions
in water and fish samples using Fe
3
O
4
-magnetite-nanoparticles
functionalized by triazene compound prior to its determination by
inductively coupled plasma-optical emission spectrometry. Anal
Methods 4:959
–966
Schenone NF, Avigliano E, Goessler W, Fernandez Cirelli A (2014) Toxic
metals, trace and major elements determined by ICP MS in tissues of
Parapimelodus valenciennis and Prochilodus lineatus from
Chascomus Lake, Argentina. Microchem J 112:127
–131
Shah AQ, Kazi TG, Arain MB, Baig J, Afridi HI, Jamali MK, Jalbani N,
Kandhro GA (2009) Optimization of ultrasonic-assisted acid extrac-
tion of mercury in muscle tissues of fishes using multivariate strat-
egy. J AOAC Int 92:1580
–1586
Shrestha B, Javonillo R, Burns JR, Pirgerc Z, Vertes A (2013) Comparative
local analysis of metabolites, lipids and proteins in intact fish tissues
by LAESI mass spectrometry. Analyst 138:3444
–3449
Skrzypek S, Mirceski V, Smarzewska S, Guziejewski D, Ciesielski W
(2011) Voltammetric study of 2-guanidinobenzimidazole: electrode
mechanism and determination at mercury electrode. Collect
Czechoslov Chem Commun 76:1699
–1715
Smarzewska S, Skrzypek S, Ciesielski W (2012) Voltammetric determi-
nation of proguanil in Malarone and spiked urine with a renewable
silver amalgam film electrode. Electroanalysis 24:1966
–1972
Smarzewska S, Metelka R, Guziejewski D, Skowron M, Skrzypek S,
Brycht M, Ciesielski W (2014) Voltammetric behaviour and quan-
titative determination of pesticide iminoctadine. Anal Methods 6:
1884
–1889. doi:
Sneddon J, Vincent MD (2008) ICP-OES and ICP-MS for the determi-
nation of metals: application to oysters. Anal Lett 41:1291
–1303
Sneddon J, Rode PW, Hamilton MA, Pingeli S, Hagen JP (2007)
Determination of metals in seafood and fish in Southwest
Louisiana. Appl Spectrosc Rev 42:23
–42
Snevajsova P, Tison L, Brozkova I, Vytrasova J, Metelka R, Vytras K
(2010) Carbon paste electrode for voltammetric detection of a
specific DNA sequence from potentially aflatoxigenic Aspergillus
species. Electrochem Commun 12:106
–109. doi:
Sobhanardakani S, Tayebi L, Farmany A, Cheraghi M (2012) Analysis of
trace elements (Cu, Cd, and Zn) in the muscle, gill, and liver tissues
of some fish species using anodic stripping voltammetry. Environ
Monit Assess 184:6607
–6611
Struis RPWJ, Pasquali M, Borgese L, Gianoncelli A, Gelfi M, Colombi P,
Thiaudiere D, Depero LE, Rizzo G, Bontempi E (2013) Inertisation
of heavy metals in municipal solid waste incineration fly ash by
means of colloidal silica
—a synchrotron X-ray diffraction and ab-
sorption study. RSC Adv 3:14339
–14351
Svancara I, Baldrianova L, Vlcek M, Metelka R, Vytras K (2005) A role
of the plating regime in the deposition of bismuth films onto a
carbon paste electrode. Microsc Study Electroanalysis 17:120
–126
Szyczewski P, Siepak J, Niedzielski P, Sobczynski T (2009) Research on
heavy metals in Poland. Pol J Environ Stud 18:755
–768
Tarrio J, Jaffor M, Ashraf M (1991) Levels of selected heavy metals in
commercial fish rom five fresh water lake Pakistan. Toxicol Environ
Chem 33:133
–140
Vazquez D, Tascon M, Deban L (2012) Determination of ascorbic acid in
commercial juices, on a modified carbon paste electrode, by using a
Taguchi experimental design. Food Anal Methods 5:441
–447
Wang Z, Cui H, Xia J, Han Q, Lv N, Gao J, Guo X, Zhang F, Ma J, Su G
(2013) A novel method for bisphenol A analysis in dairy products
using graphene as an adsorbent for solid phase extraction followed
by ion chromatography. Food Anal Methods 6:1537
–1543
Wang L, Zang X, Chang Q, Zhang G, Wang C, Wang Z (2014)
Determination of triazole fungicides in vegetable samples by mag-
netic solid-phase extraction with graphene-coated magnetic nano-
composite as adsorbent followed by gas chromatography-mass
spectrometry detection. Food Anal Methods 7:318
–325
Wonsawat W, Chuanuwatanakul S, Dungchai W, Punrat E, Motomizu S,
Chailapakul O (2012) Graphene-carbon paste electrode for cadmi-
um and lead ion monitoring in a flow-based system. Talanta 100:
282
–289
Wu J, Qian Y, Zhang C, Zheng T, Chen L, Lu Y, Wang H (2013)
Application of graphene-based solid-phase extraction coupled with
ultra high-performance liquid chromatography-tandem mass spec-
trometry for determination of macrolides in fish tissues. Food Anal
Methods 6:1448
–1457
Yang X, Yuan J, Man PZ, Niu XJ, Zheng T (2011) Differential pulse
stripping voltammetry determination of trace lead in water using
Au-graphene sheets modified carbon paste electrode. Metall Anal
31:46
–50
Zhang YB, Tan YW, Stormer HL, Kim P (2005) Experimental observa-
tion of the quantum hall effect and Berry
’s phase in graphene.
Nature 438:201
–204. doi:
Zhao JP, Pei SF, Ren WC, Gao LB, Cheng HM (2010) Efficient prepa-
ration of large-area graphene oxide sheets for transparent conductive
films. ACS Nano 4:5245
–5252
Zmozinski AV, Passos LD, Damin ICF, Espirito Santo MAB, Vale MGR,
Silva MM (2013) Determination of cadmium and lead in fresh fish
samples by direct sampling electrothermal atomic absorption spec-
trometry. Anal Methods 5:6416
–6424
642
Food Anal. Methods (2015) 8:635
–642
Document Outline
- Application of a Graphene Oxide–Carbon Paste Electrode for the Determination of Lead in Rainbow Trout from Central Europe
Wyszukiwarka
Podobne podstrony:
Application of LEDs in road lighting
Vlaenderen A generalisation of classical electrodynamics for the prediction of scalar field effects
Isotope ratios of lead in Japanese women ’s hair of the twentieth century
Applications of polyphase filters for bandpass sigma delta analog to digital conversion
2 Application of Distributed Loads
2004 Applications of RT to translation
application of solid state fermentation to food industry a review
[2006] Application of Magnetic Energy Recovery Switch (MERS) to Improve Output Power of Wind Turbine
94 1363 1372 On the Application of Hot Work Tool Steels for Mandrel Bars
1 Application of Joints and Springs in ANSYS
Applications of Robotics and Artificial Intelligence
Kinesiotherapy is the application of scientifically?sed exercise principles?apted to enhance the str
Application of Solid Phase Microextraction Gas Chromatograp
Application of the Modelica
Applications of magnetic resonance spectroscopy in radiotherapy treatment planning
Applications of polyphase filters for bandpass sigma delta analog to digital conversion
2 Application of Distributed Loads
Some Oceanographic Applications of Recent Determinations of the Solubility of Oxygen in Sea Water
Finance Applications of Game Theory [jnl article] F Allen, S Morris WW
więcej podobnych podstron