
Journal of Power Sources 140 (2005) 392–399
Model for energy conversion in renewable energy system
with hydrogen storage
S. K´elouwani, K. Agbossou
, R. Chahine
Institut de recherche sur l’hydrog`ene, Universit´e du Qu´ebec `a Trois-Rivi`eres, P.O. Box500, Trois-Rivi`eres, Qu´e., Canada G9A 5H7
Received 15 July 2004; accepted 16 August 2004
Available online 6 October 2004
Abstract
A dynamic model for a stand-alone renewable energy system with hydrogen storage (RESHS) is developed. In this system, surplus energy
available from a photovoltaic array and a wind turbine generator is stored in the form of hydrogen, produced via an electrolyzer. When the
energy production from the wind turbine and the photovoltaic array is not enough to meet the load demand, the stored hydrogen can then
be converted by a fuel cell to produce electricity. In this system, batteries are used as energy buffers or for short time storage. To study the
behavior of such a system, a complete model is developed by integrating individual sub-models of the fuel cell, the electrolyzer, the power
conditioning units, the hydrogen storage system, and the batteries (used as an energy buffer). The sub-models are valid for transient and steady
state analysis as a function of voltage, current, and temperature. A comparison between experimental measurements and simulation results is
given. The model is useful for building effective algorithms for the management, control and optimization of stand-alone RESHSs.
© 2004 Elsevier B.V. All rights reserved.
Keywords: ARMA; Battery; Electrolyzer; Fuel cell; Photovoltaic array; Wind turbine
1. Introduction
The use of a stand-alone renewable energy system (i.e. one
using wind and photovoltaic energy) in remote areas requires
an energy storage device to smooth out the intermittent power
input from these sources. Recent system designs
on batteries for short-term energy storage, while hydrogen is
used for long-term energy storage. In these systems, the hy-
drogen (H
2
) has been produced through an electrolyzer pow-
ered by the surplus energy available from the primary sources
(wind turbine and photovoltaic array). When the input power
is insufficient to feed the RESHS load, previously stored hy-
drogen is reconverted through a fuel cell (FC) to produce the
required electricity. The design, management and optimiza-
tion of such a system require a useful model.
∗
Corresponding author. Tel.: +1 819 376 5011x3911;
fax: +1 819 376 5164.
E-mail address: kodjo agbossou@uqtr.ca (K. Agbossou).
We present a model to describe the dynamics of an
RESHS. It integrates sub-models of the electrolyzer, the fuel
cell, the batteries, the power interfaces (buck and boost con-
verters) and the storage system. Interdependency issues (hy-
drogen consumption cannot exceed production) are taken into
account. Special attention is given to the characterization of
the system’s major components in the transient state, and we
use simple and realistic assumptions to describe the behav-
ior for short- and long-term operation of the RESHS. Most
of the sub-models are specified by the component’s polar-
ization curves characteristics (current–voltage–temperature).
The model is validated by comparing its output to that of
the Hydrogen Research Institute’s (HRI) renewable energy
system test bench, which is completely described in
and whose configuration and specifications are given, respec-
tively, in
. A scenario built with realistic
residential power consumption needs and typical power pro-
duction by wind turbine (WT), and photovoltaic (PV) array
is also simulated and analyzed.
0378-7753/$ – see front matter © 2004 Elsevier B.V. All rights reserved.
doi:10.1016/j.jpowsour.2004.08.019
S. K´elouwani et al. / Journal of Power Sources 140 (2005) 392–399
393
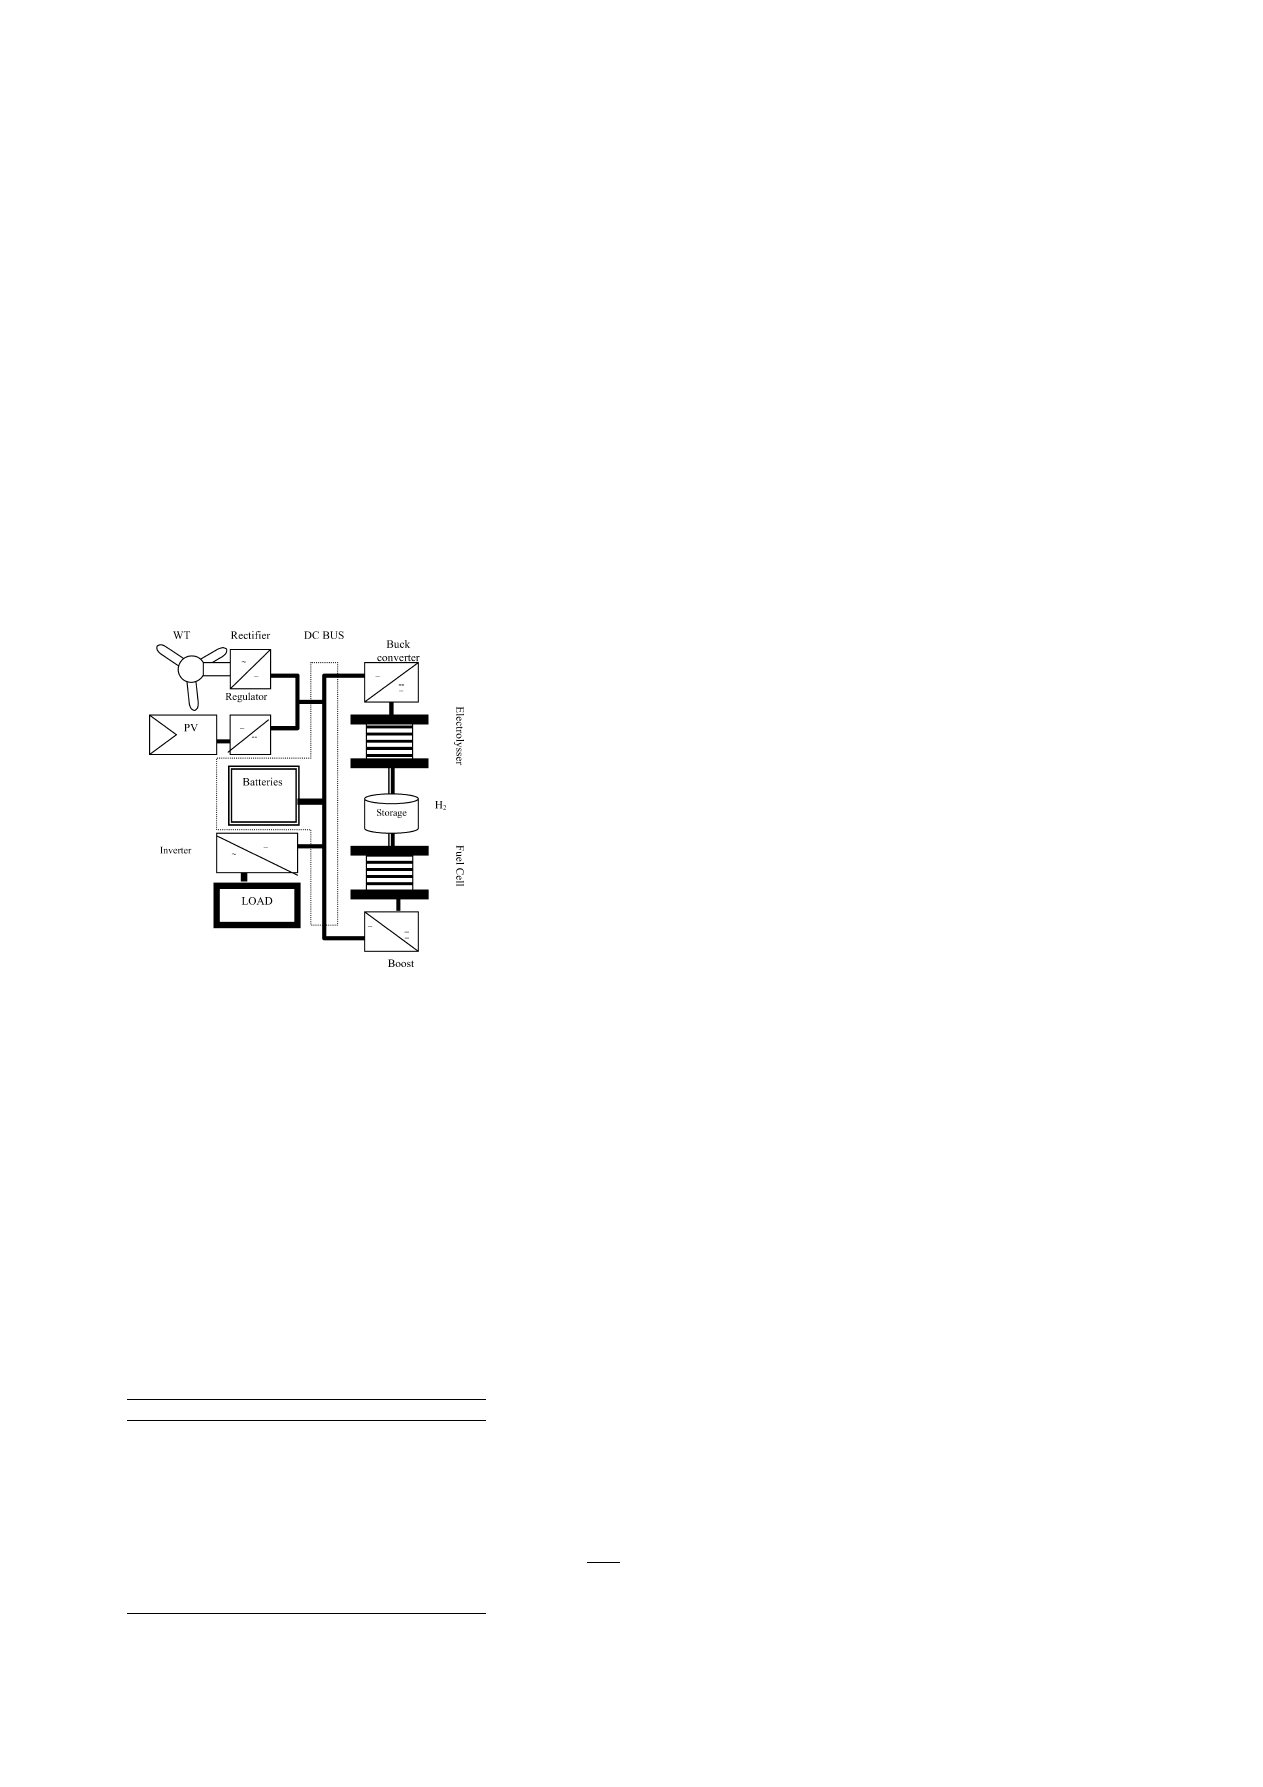
Fig. 1. Block diagram of the renewable energy system test bench of the HRI.
2. Modeling of the components
Generally, a RESHS is designed for a nominal dc bus volt-
age, which, in the case of the HRI test bench, is about 48 V.
However, the real voltage on the dc bus depends on the oper-
ating conditions of the system. When the energy production
exceeds what is needed and the battery (short-term energy
storage device) is being charged, the input power devices
tend to impose their output voltage on the dc bus. Wind gusts
can, for example, increase that bus voltage from 48 V to 56 V
in a fraction of a second. Similarly, when input energy pro-
duction is below what is needed and the load draws on the
battery, it is the battery that will impose its voltage on the
dc bus. This variability of the bus voltage is a major control
problem, as quite clearly this voltage cannot be considered
as a reliable variable to describe the evolution of the state of
the RESHS. Instead, it is the battery energy that will be used
as a system-controlling variable (see Section
Table 1
RE test bench technical specifications
Components
Type
Power (kW)
Voltage (V)
Photovoltaic (PV)
1
48
Wind turbine gener-
ator and regulator
10
48
Electrolyzer
Alkaline
5
26–48
Buck converter
Multiphase PWM
5
26–48
Fuel cell (FC)
PEM
5
24
Boost converter
Multiphase PWM
5
24–48
Inverter
5
110 ac
Load
0–5
110 ac
Capacity (kWh)
Batteries
Lead–acid
10.5–55
48
Storage H
2
125
PWM: pulse width modulation; PEM: proton exchange membrane.
In this paper, most of the models are described as functions
of time, current, voltage, and temperature. For simulation
purposes, the input signals are the wind generator rectifier
output current (I
WT
), the PV array regulator output current
(I
PV
), and the load current (I
L
). Due to the intermittent nature
of the renewable energy sources, sampled signals will be used
to represent all of them. This way, any energy production and
load profile can be modeled at will. In the following sections,
the models of the sub-units are presented in the order in which
they are traversed by the energy flux: battery, buck converter,
electrolyzer, boost converter, fuel cell, and hydrogen storage.
2.1. Battery model
The battery is the main component on the dc bus, and plays
the role of an energy buffer to handle current spikes and for
short-term energy storage. Different models for batteries are
available, in particular those suitable for electrical vehicle
applications
. For stationary applications, such
as the RESHS, the models described in
use many experi-
mental parameters that cannot be estimated easily, such as the
overcharge effect (though in a properly-controlled RESHS,
this effect does not happen, and hence is not included in
the model). The main parameters, which determine the bat-
tery’s performance, are its internal resistance, the polariza-
tion effect, and the long-term self-discharge rate. This self-
discharge rate is difficult to estimate, and is itself subject to
a number of factors, such as the operating temperature, the
number of operation cycles, and the materials and technology
used in its manufacture
The battery voltage U
B
(t), which takes these three param-
eters into account is given by,
U
B
(
t) = (1 + αt)U
B
,0
+ R
i
(
t)I(t) + K
i
Q
R
(
t)
(1)
where
α is the self-discharge rate (s
−1
); U
B,0
is the open
circuit voltage (V) at t = 0; R
i
(t) is the internal resistance (
),
K
i
is the polarization coefficient (
h
−1
), and Q
R
(t) is the
rate of accumulated ampere hours. If I(t) > 0 then the battery
is charging; if I(t) < 0 then the battery is discharging. The
battery energy is then,
W(t) = W
0
+
t
0
P
in
(
t
) d
t
(2)
where P
in
(t
) = U
B
(t)I(t) is the input power to the battery and
W
0
is the battery’s initial energy. As we will see later, the
decision algorithm (as to whether electrolyzer or fuel cell are
to be activated to rebalance the battery energy) will depend
on the battery’s state of charge (SOC), defined by,
SOC(
t) =
W(t)
W
max
(3)
where W
max
is the maximum battery energy without over-
charge.
394
S. K´elouwani et al. / Journal of Power Sources 140 (2005) 392–399
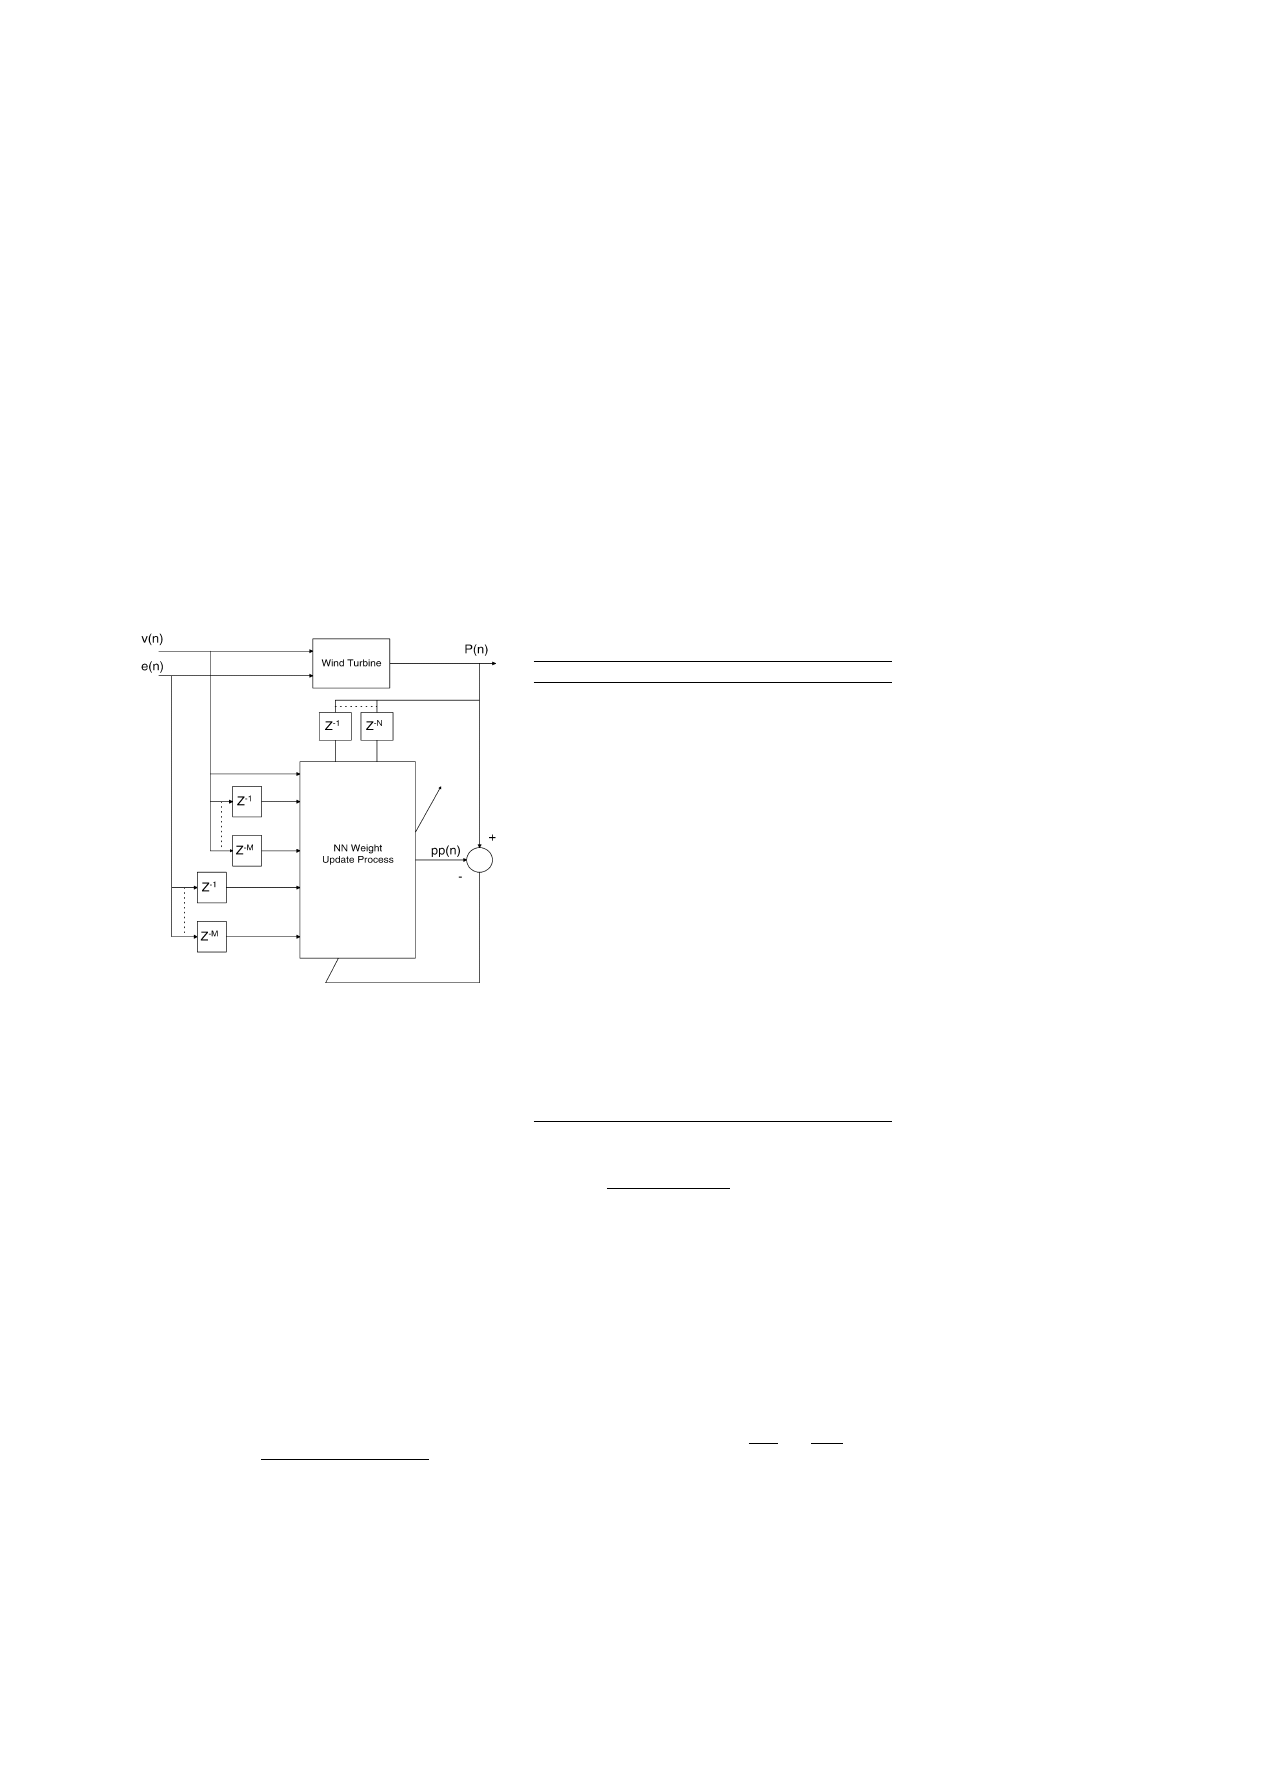
Fig. 2. Diagram of the identification process of the buck converter parame-
ters.
2.2. Buck converter
When there is an excess of electrical energy in the system,
that excess is channeled to the electrolyzer to produce hydro-
gen. To control this hydrogen production, a buck converter
designed at HRI controls the input current to the electrolyzer
cells. This buck converter is a dc voltage reducer designed
to maximize the power transfer from the dc bus to the elec-
trolyzer cells. It uses the multiphase technique to generate
pulse-width modulated (PWM) signals
. Its models are
expressed by Eqs.
, and they give the voltage and
current applied to the electrolyzer cells. Considering the com-
plexity of describing these circuits, an autoregressive moving
average (ARMA) model (
for parameter identifica-
tion is used to minimize the average quadratic error between
the real output of the buck converter and the model’s. During
this process, the time scale is set to 1 s and the buck converter
operating temperature to 25
◦
C.
The following equation (based on the ARMA model) gives
the relation between the buck output voltage and the dc bus
voltage (transfer function),
U
Bu
,Out
(
n) = U
B
(
n)
B
Bu
,0
+ B
Bu
,1
z
−1
D
Bu
(
n)
A
Bu
,0
+ A
Bu
,1
z
−1
(4)
where A
Bu,0
, A
Bu,1
, B
Bu,0
, and B
Bu,1
are parameters which
have to be determined. Their values, for our case, are given
in
. U
B
is the dc bus voltage; D
Bu
is the duty cycle
and U
Bu,Out
is the buck converter output voltage (and applied
to the electrolyzer cells). The buck converter input voltage
(U
Bu,In
) is equal to the dc bus voltage because of its direct
connection to the dc bus. Taking into account the buck power
efficiency (
η
Bu
), the input current (I
Bu,In
) to the buck con-
Table 2
Parameter values
Component
Parameters
Values
Battery
R
i
(
)
0
.076
K
i
∼0
Q
FC
(A h)
880
Q
0
(A h)
880
E
0
(V)
48
Boost converter
A
Bo,0
1
A
Bo,1
−0.2045
B
Bo,0
1
.236
B
Bo,1
−0.4275
Buck converter
A
Bu,0
1
A
Bu,1
−1.485
η
I,el
0
.7
B
Bu,0
0
.057
B
Bu,1
−0.082
Electrolyzer
U
el,0
22
.25
C
1
−0.1765
C
2
5
.5015
η
I,FC
0
.45
I
el,0
0
.1341
R
el
−3.3189
N
Cell,el
24
PEMFC
U
FC
33
.18
E
1
−0.013
E
2
−1.57
I
FC,0
8
.798
R
FC
−2.04
N
Cell,FC
35
verter is
I
Bu
,In
(
n) =
U
Bu
,Out
(
n)I
Bu
,Out
(
n)
η
Bu
U
Bu
,In
(
n)
(5)
where I
Bu,Out
is the input current to the electrolyzer cells,
and is determined in the next section. The coefficients may
vary slightly from one operating point to another, but on the
whole, the model gives a good account of the dynamics of
the system.
2.3. Electrolyzer
As the electrolyzer time response is slow
compared to
the modeling sampling time (1 s), the output voltage is given
by,
U
el
(
t) = U
el
,0
+ C
1
T
el
(
t) + C
2
ln
I
el
(
t)
I
el
,0
+
R
el
T
el
(
t)
I
el
(
t)
(6)
where U
el,0
(V), C
1
(V
◦
C
−1
), C
2
(V
◦
C
−1
), I
el,0
(A) and R
el
(
◦
C
−1
) are parameters to be determined experimentally.
For the HRI test bench, their values are given in
an operating temperature T
el
(t) between 22
◦
C and 52
◦
C. The
first two terms of Eq.
represent the theoretical potential
of an ideal cell. The third term gives the activation potential,
while the last one represents resistance (ohmic) losses. These
parameter values vary from one electrolyzer to another. Con-

S. K´elouwani et al. / Journal of Power Sources 140 (2005) 392–399
395
sidering that the output of the buck converter is connected
directly to the input of the electrolyzer cells, U
Bu,Out
(t) and
I
Bu,Out
(t) are equivalent to U
el
(t) and I
el
(t), respectively. The
hydrogen production rate ˙
V
el
(
t) is given by,
˙
V
el
= N
Cell
,el
η
I
,el
I
el
(
t)
C
H
2
(7)
where
η
I,el
is the electrolyzer utilization factor; N
Cell,el
repre-
sents the number of cells, and
C
H
2
is a conversion coefficient
(of value 2.39 A h l
−1
of hydrogen).
η
I,el
depends on the cell
temperature. For alkaline electrolyzers, some studies
show that
η
I,el
is between 0.6 and 0.75. A more rigorous es-
timate can be obtained by direct measurement of the produc-
tion. The hydrogen produced by the electrolyzer is stored, and
can be used later by the FC. The storage sub-system model
is given in Section
2.4. Boost converter
The nominal output voltage of HRI’s fuel cell is around
24 V, whereas the dc bus is designed for 48 V. Hence a power
interface is necessary between the two. In order to maximize
the power transfer between the FC and the dc bus the boost
converter is designed with the same multiphase switching
technique and pulse-width modulated signals, as was used
for the buck converter. Using the same method as described
in Section
, the relation between the duty cycle D
Bo
and
the input current I
Bo,In
(t) of the boost converter is given by,
I
Bo
,In
(
n) = I
FC
,Max
B
Bo
,0
+ B
Bo
,1
z
−1
D
Bo
(
n)
A
Bo
,0
+ A
Bo
,1
z
−1
(8)
where I
FC,Max
is the maximum output current of the FC; A
Bo,0
,
A
Bo,1
, B
Bo,0
, and B
Bo,1
are parameters to be determined (see
). The output current (I
Bo,Out
) of the boost converter
is obtained from the boost power efficiency (
η
Bo
)
I
Bo
,Out
(
n) = η
Bo
U
FC
(
n)I
Bo
,In
(
n)
U
B
(
n)
(9)
where U
FC
is the FC output voltage, and
η
Bo
is determined
by direct measurement (and found to be >95%).
2.5. Proton exchange membrane fuel cell
According to references
, the proton exchange mem-
brane (PEM) FC reaction time constants during transient pe-
riods (<50 ms) are smaller than the simulation step time (1 s).
Hence, the dynamic behavior of the FC is given by its polar-
ization curve
U
FC
(
t) = U
FC
,0
+ E
1
T
FC
(
t) + E
2
ln
I
FC
(
t)
I
FC
,0
+
R
FC
T
FC
(
t)
I
FC
(
t)
(10)
where U
FC,0
(V), E
1
(V
◦
C
−1
), E
2
(V
◦
C
−1
), I
FC,0
(A), and
R
FC
(
◦
C
−1
) are experimental parameters whose values as
measured on the IRH test bench are given in
for tem-
peratures ranging from 24
◦
C to 72
◦
C. T
FC
(t) is the operating
temperature of the cells, which changes during the cell’s op-
eration. The first two terms of Eq.
represent the open
loop potential, the third term corresponds to the activation
potential, and the last represents resistance (ohmic) losses.
These parameters vary widely from one fuel cell to another.
The FC’s hydrogen consumption rate ˙
V
FC
(
t) is given by,
˙
V
FC
= N
Cell
,FC
η
I
,FC
I
FC
(
t)
C
H
2
(11)
where
η
I,FC
is the utilization factor of the FC, and N
Cell,FC
represents the number of cells. The literature
shows
that
η
I,FC
is between 0.3 and 0.6 for PEM fuel cells. A more
accurate estimate can be obtained by direct measurement.
2.6. Hydrogen storage sub-system
The hydrogen produced by the electrolyzer is stored in a
pressurized tank. Although the actual renewable energy sys-
tem at HRI has a compressor and the hydrogen can be stored
in a tank at up to 150 psi, the equations used will assume
hydrogen storage at normal pressures and temperatures. The
power balance for the storage function is given by
d
W
H
2
(
t)
d
t
= P
el
(
t) − P
FC
(
t)
(12)
where
W
H
2
(
t) is the energy present in the tank in the form of
hydrogen, P
FC
(t) and P
el
(t) are, respectively, the FC power
consumption (related to the H
2
consumption rate) and the
electrolyzer power production (related to the H
2
production
rate). The solution of Eq.
in the Laplace domain is given
by
W
H
2
(
s) =
P
el
(
s) − P
FC
(
s)
s
+ W
H
2
,0
(13)
with
P
el
(
s) =
˙
V
el
(
s)
V
T
H;
P
FC
(
s) =
˙
V
FC
(
s)
V
T
H
where ˙
V
el
and ˙
V
FC
are, respectively, the production and the
consumption rates of H
2
.
W
H
2
,0
is the initial hydrogen en-
ergy stored. Under normal temperature and pressure condi-
tions
, V
T
is equal to 22.4 l mol
−1
.
H is the enthalpy of
hydrogen (“high heating value”) (
H = 286 kJ mol
−1
).
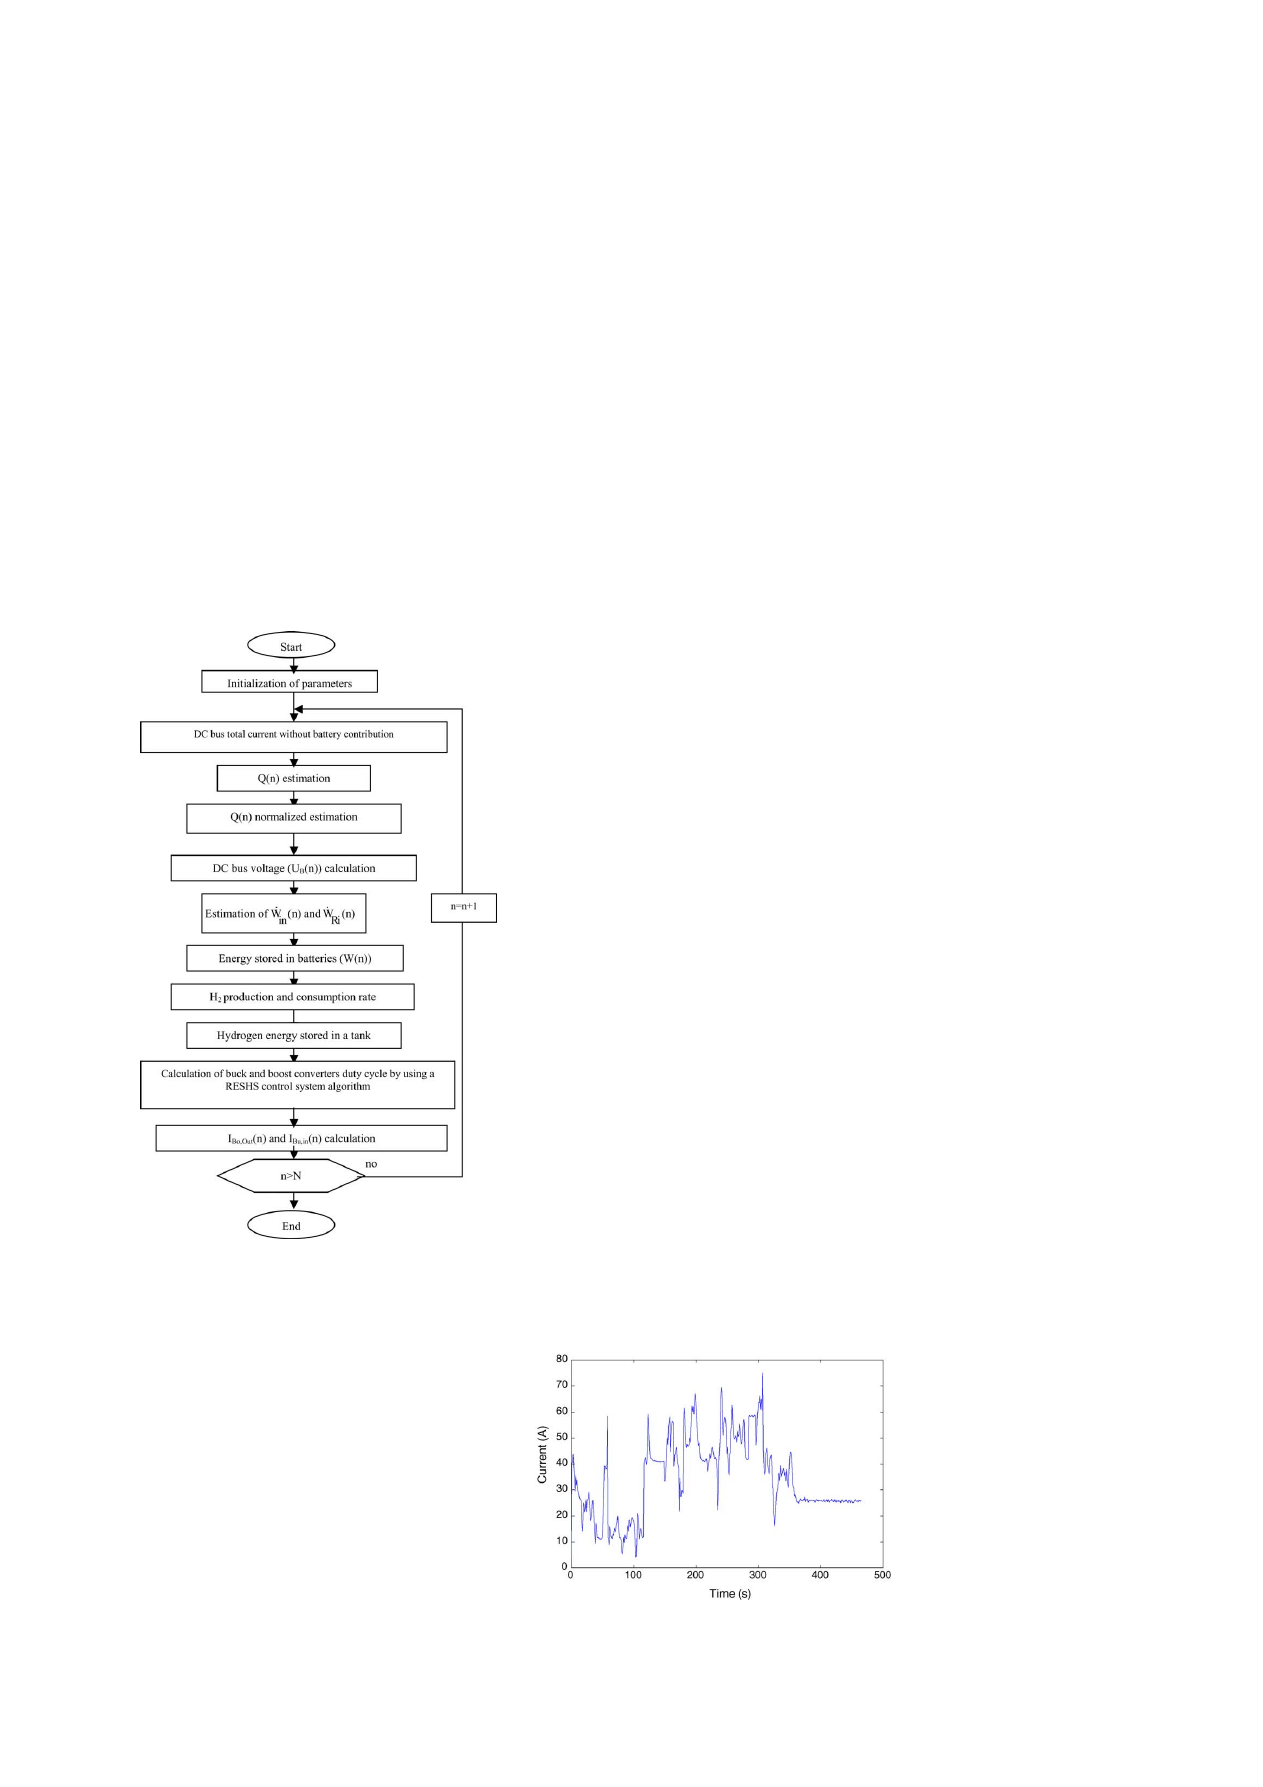
3. RESHS simulation
A model of a RESHS has been developed based on the
above equations for its sub-units. The simulation block dia-
gram is given in
. As mentioned earlier, the simulation
and sampling time step is taken as 1 s, and N is the total num-
ber of steps for one complete operation period. The principal
results of interest are the output currents of the buck converter
396
S. K´elouwani et al. / Journal of Power Sources 140 (2005) 392–399
Fig. 3. RESHS simulation block diagram.
and of the boost converter, and the energy stored in the bat-
tery. The boost converter output current depends of course on
the details of the models of the boost converter and of the FC.
Similarly, the electrolyzer current is closely associated with
the details of the buck converter and of the electrolyzer. In
this diagram, Q(n) represents the accumulated ampere hours
in batteries.
4. Experimental and performance analysis
The models of the sub-units described previously were
used to put the RESHS system through a typical run (the
values of the parameters of the various sub-units are found
in
). In order to reflect the variable nature of the ac-
tual WT and PV array power variations, the simulation inputs
were subjected to relatively large ripples, and the simulation
outputs were monitored closely to determine the stability of
the model. The simulation inputs are the WT generator cur-
rent at the dc bus (I
WT
), the PV array regulator current (I
PV
),
the load current (I
L
), the electrolyzer cell temperature (T
el
)
(which is relatively constant: 25
◦
C) and the FC cell temper-
ature (T
FC
), which varies linearly from 25
◦
C to 35
◦
C with
a slope of 3.3
◦
C s
−1
. The simulation outputs are (as men-
tioned previously) the buck converter output current (same
as the electrolyzer input current) (I
el
), the boost converter
output current (I
Bo,Out
), and the battery energy (W(t)). All
these signals were also measured on the actual HRI operat-
ing test bench to permit comparison of the simulation output
with reality.
The electrolyzer and FC regulators work so as to bring the
battery energy W(t) back towards its reference value, W
ref
,
whenever W(t) gets beyond a pre-determined range bounded
by W
hi
and W
low
bracketing W
ref
. The electrolyzer, which
lowers W(t) by converting the excess battery energy into hy-
drogen (i.e. when the input energy is greater than what is
needed by the load), is powered on when W(t) > W
hi
, and is
stopped when W
ref
is reached. The FC, which raises W(t) by
converting hydrogen back into battery energy (i.e. when the
input energy is smaller than what is needed by the load), is
powered on when W(t) < W
low
, and is stopped again when
W
ref
is reached. The system starts with an initial energy W
0
> W
hi
(W
0
is estimated to 42,240 Wh), usually at W
hi
. In
the first simulation W
ref
= 42,218 Wh, and W
hi
and W
low
are at 42,240 Wh (=W
ref
+ 22 Wh) and 42,196 Wh (=W
ref
− 22 Wh). The control range thus extends to ±22 Wh around
W
ref
.
4.1. Input signals
present typical WT output and load current
(two of the simulation input variables). It can be noticed that
the system operates during 7 min. There was no significant
power available from PV array when running this experience.
4.2. Electrolyzer
The electrolyzer, which is fed from the buck converter, is
set to operate at a nominal input power of 1500 W when it is
Fig. 4. Current I
WT
(t) from the wind turbine through the rectifier module.
S. K´elouwani et al. / Journal of Power Sources 140 (2005) 392–399
397
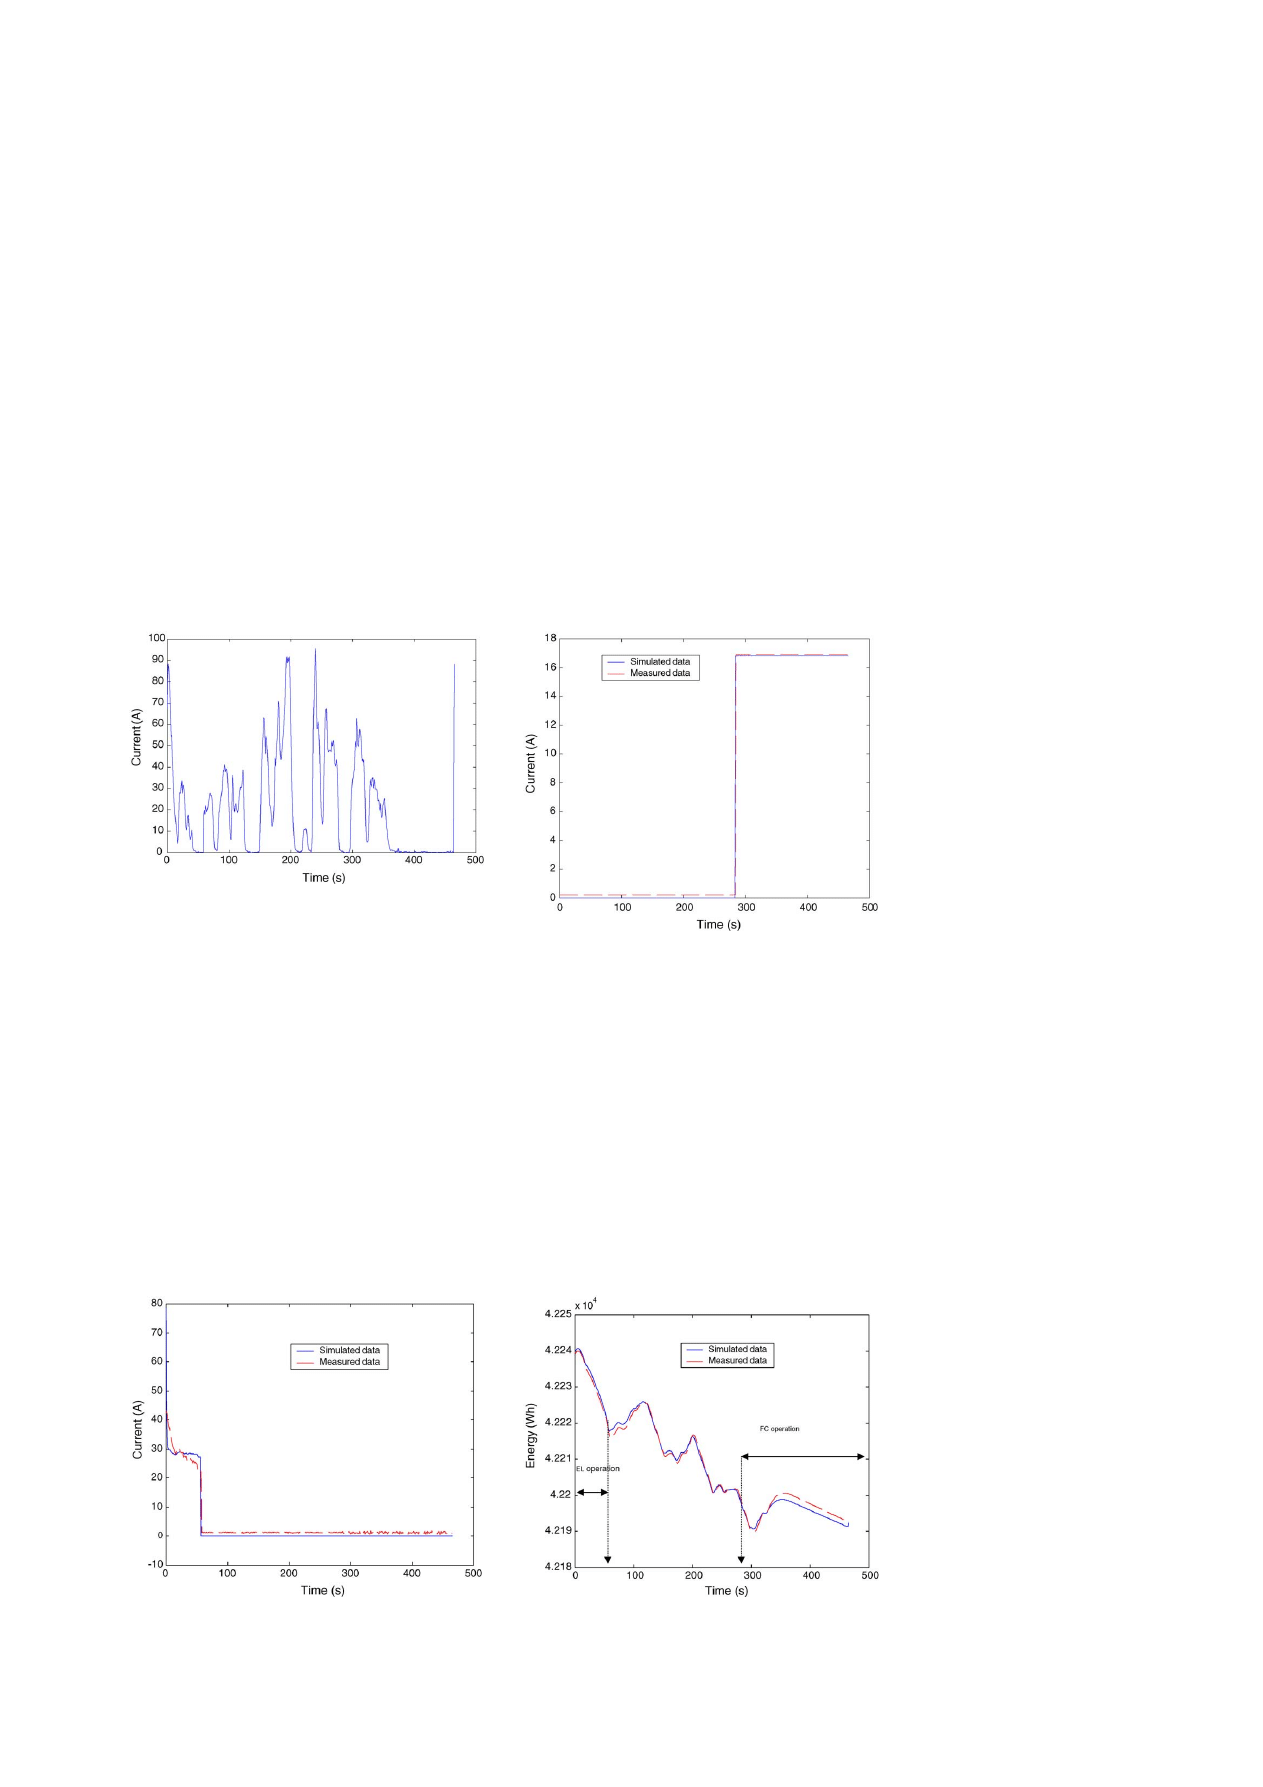
Fig. 5. Profile of the load current.
running. When the simulation starts, the electrolyzer is oper-
ating according to the control strategy described above.
compares the experimental and the simulation results. The
difference between simulation and measurements is around
8.5%. This result shows that the models of the buck converter
and the electrolyzer are relatively realistic. The steady-state
difference between the two (at t > 65 s) is due to the inaccu-
rate estimation of the initial energy of the battery (W
0
) in Eq.
(it turns out that the model of the energy buffer is itself
dependent on the initial energy stored in the battery). In spite
of this, the start–stop sequences of the electrolyzer are the
same for the simulation and the experimental measurements.
4.3. Fuel cell
For the FC and the boost converter, the simulated and
experimental (measured) currents are perfectly matched
(
). The deviation between the two is less than 2%.
It turns out that the boost converter output current is
Fig. 6. Comparison of the electrolyzer current simulated and measured.
Fig. 7. Comparison of the simulated and measured current of the boost
converter output.
not very sensitive to reasonable variations of the dc bus
voltage.
4.4. Buffer energy
The overall quality of the simulation of the operation of
the RESHS is judged by examining the time-evolution of the
buffer energy (W(t)).
gives the measured and simulated
results. From t = 0 s to t = 65 s, W(t) decreases quickly, because
(1) insufficient energy is available from the wind turbine and
the PV array (see
), and (2) the electrolyzer is
running and withdrawing energy from the battery (
When W(t) reaches W
ref
at t = 66 s, the control program
shuts the electrolyzer off. W(t) then starts to rise (from t =
66 s to t = 135 s).
show that there is a surplus
Fig. 8. Battery energy W(t).
398
S. K´elouwani et al. / Journal of Power Sources 140 (2005) 392–399
power on the dc bus during this period, and this surplus is
transferred into the battery. From t = 136 s to t = 200 s, W(t)
decreases again due to the high load current (
) and the
insufficient energy supply from the wind turbine. At t = 295 s,
W(t) reaches the threshold value W
low
at which the control
program turns the FC on (
), to supply the required en-
ergy from the stored hydrogen. Beyond t = 350 s, the WT
current is essentially zero, while the load current remains at
about 25 A and the FC current at only 17 A, and hence W(t)
decreases again due to the net 8 A drawn from the battery.
The difference between the simulated and the measured W(t)
seems to be less than 2%. This is a good indication of the
reliability of the models.
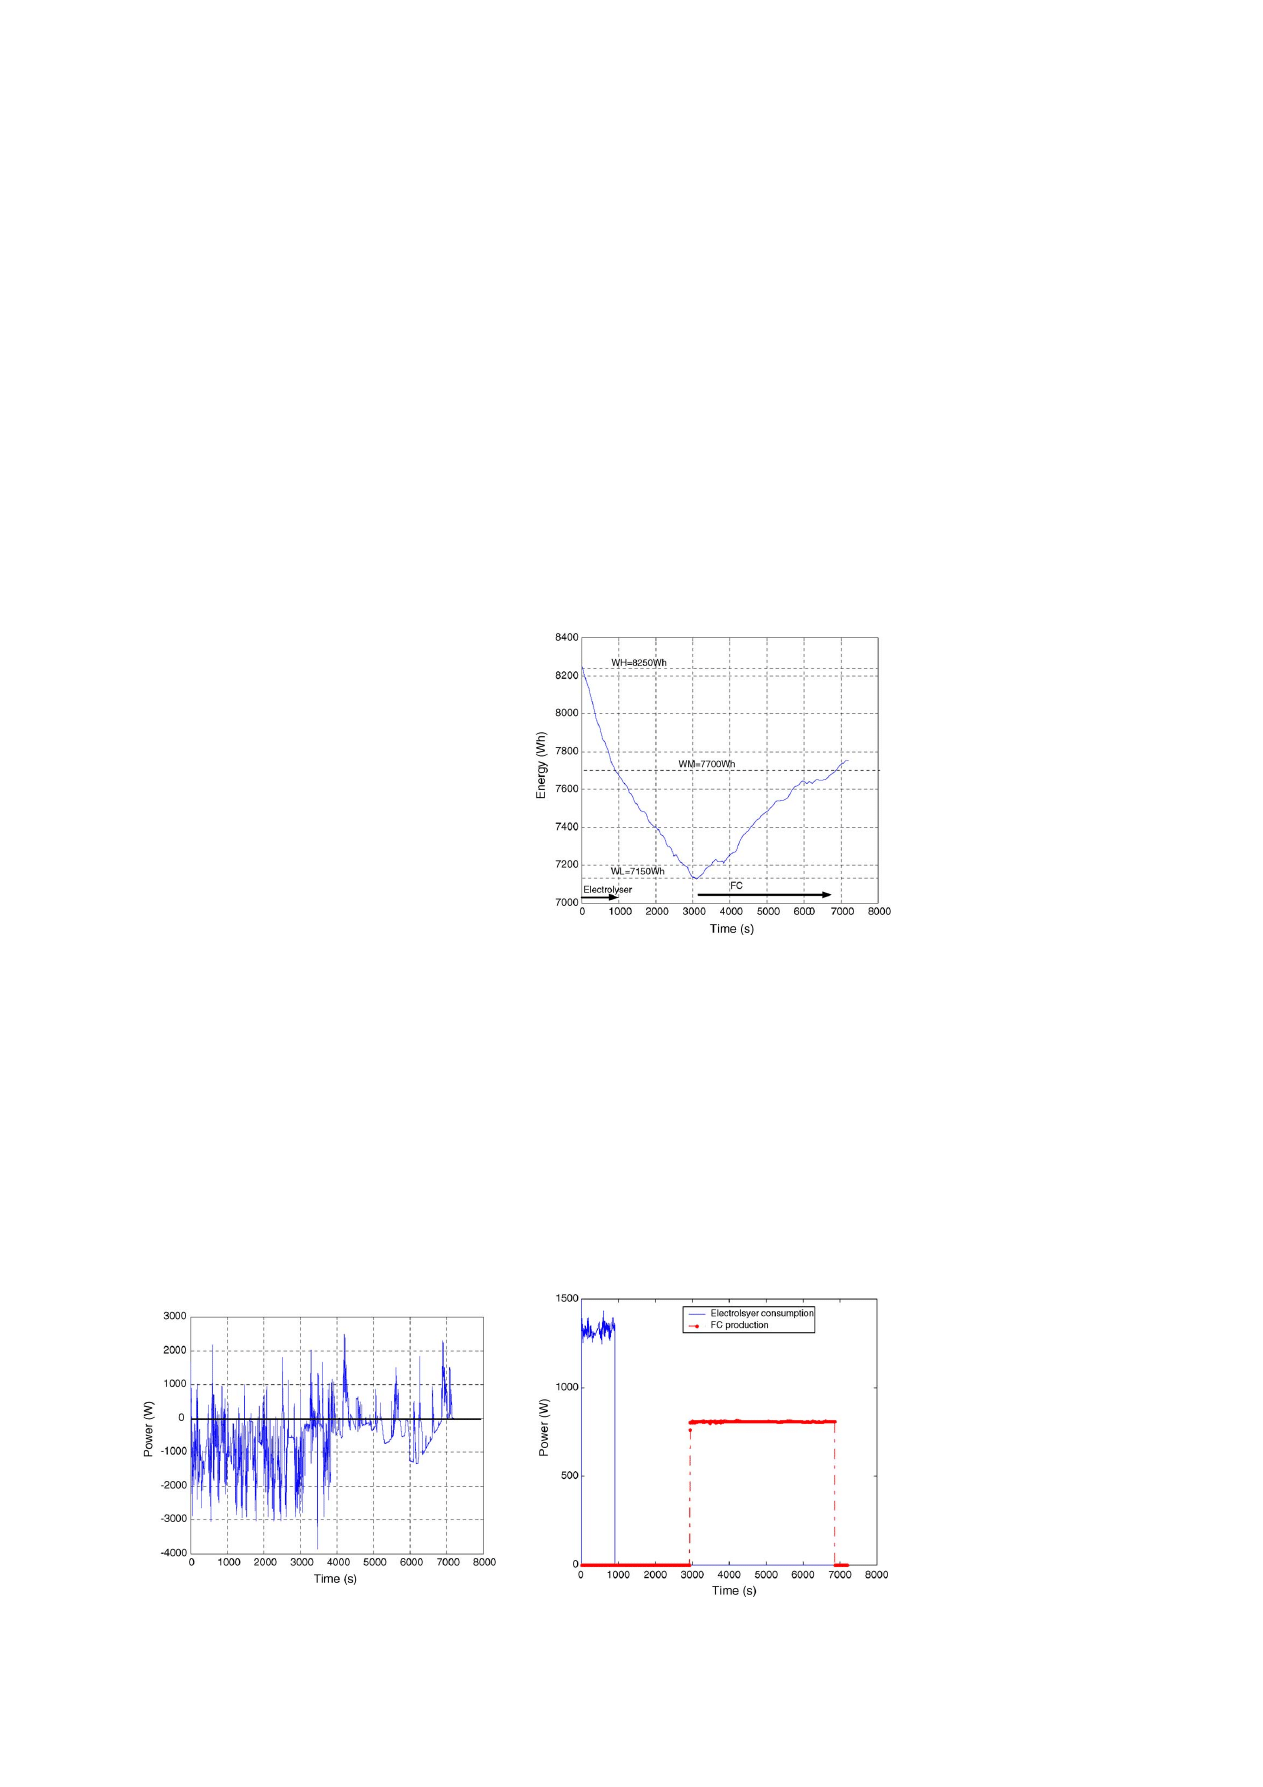
5. Residential energyconsumption scenario
A realistic scenario of the energy consumption of a resi-
dence is now developed. The values used for the power pro-
ductions of the PV array and of the wind turbine are typical
for our region. The net dc bus power, that is the algebraic
sum of powers from the PV array, the wind turbine, and the
load (this one negative) but without the contribution of the
FC and of the electrolyzer is shown in
. It stays, on
the average, negative until t = 3800 s, and slightly positive
afterwards. Positive power values mean that excess power is
available at the dc bus, while negative power values means
that there is a power deficit at the bus. The simulation of this
scenario covers 2 h (7200 s).
The electrolyzer and FC model parameters are again given
in
, while their on/off control criteria are similar to the
previous simulation. The target value W
ref
is 0.70W
0
. The
electrolyzer is started when W(t) > 0.75W
max
and stopped
when W(t) < 0.70W
max
. The FC is started when W(t) <
0.65W
max
and stopped when W(t) > 0.70W
max
. The maxi-
mum capacity of the battery (W
max
) is set at 11 kWh. The
initial battery charge (W
0
) is set at 0.75 W
max
.
Fig. 9. Net power on the dc bus without the contributions of FC and elec-
trolyzer.
Fig. 10. Battery energy W(t): W
hi
= 0.75W
max
, W
ref
= 0.70W
max
, W
low
=
0.65W
max
.
The evolution of W(t) is displayed in
. When the
system starts (t = 0 s), W(t) is at 0.75W
max
, and the electrolyzer
is running (
). The battery energy W(t) decreases (see
) because, again, the net power (
) is negative
(the consumption is more than the energy production) and
because the electrolyzer is also running. At t = 990 s, W(t)
reaches W
ref
= 0.7W
max
(
), and the control algorithm
stops the electrolyzer (
). From t = 991 s to t = 2995 s,
neither the FC nor the electrolyzer are operating (
and W(t) keeps decreasing, since the net power on the dc bus
is negative during this period (
). W(t) keeps decreasing
until, at t = 2995 s, it reaches the value of W
low
= 0.65W
max
,
at which point the control logic turns the FC on, and energy
flows back into the battery from the converted hydrogen. The
FC is operating from then until 6900 s (
), at
Fig. 11. Power of the electrolyzer and the FC.
S. K´elouwani et al. / Journal of Power Sources 140 (2005) 392–399
399
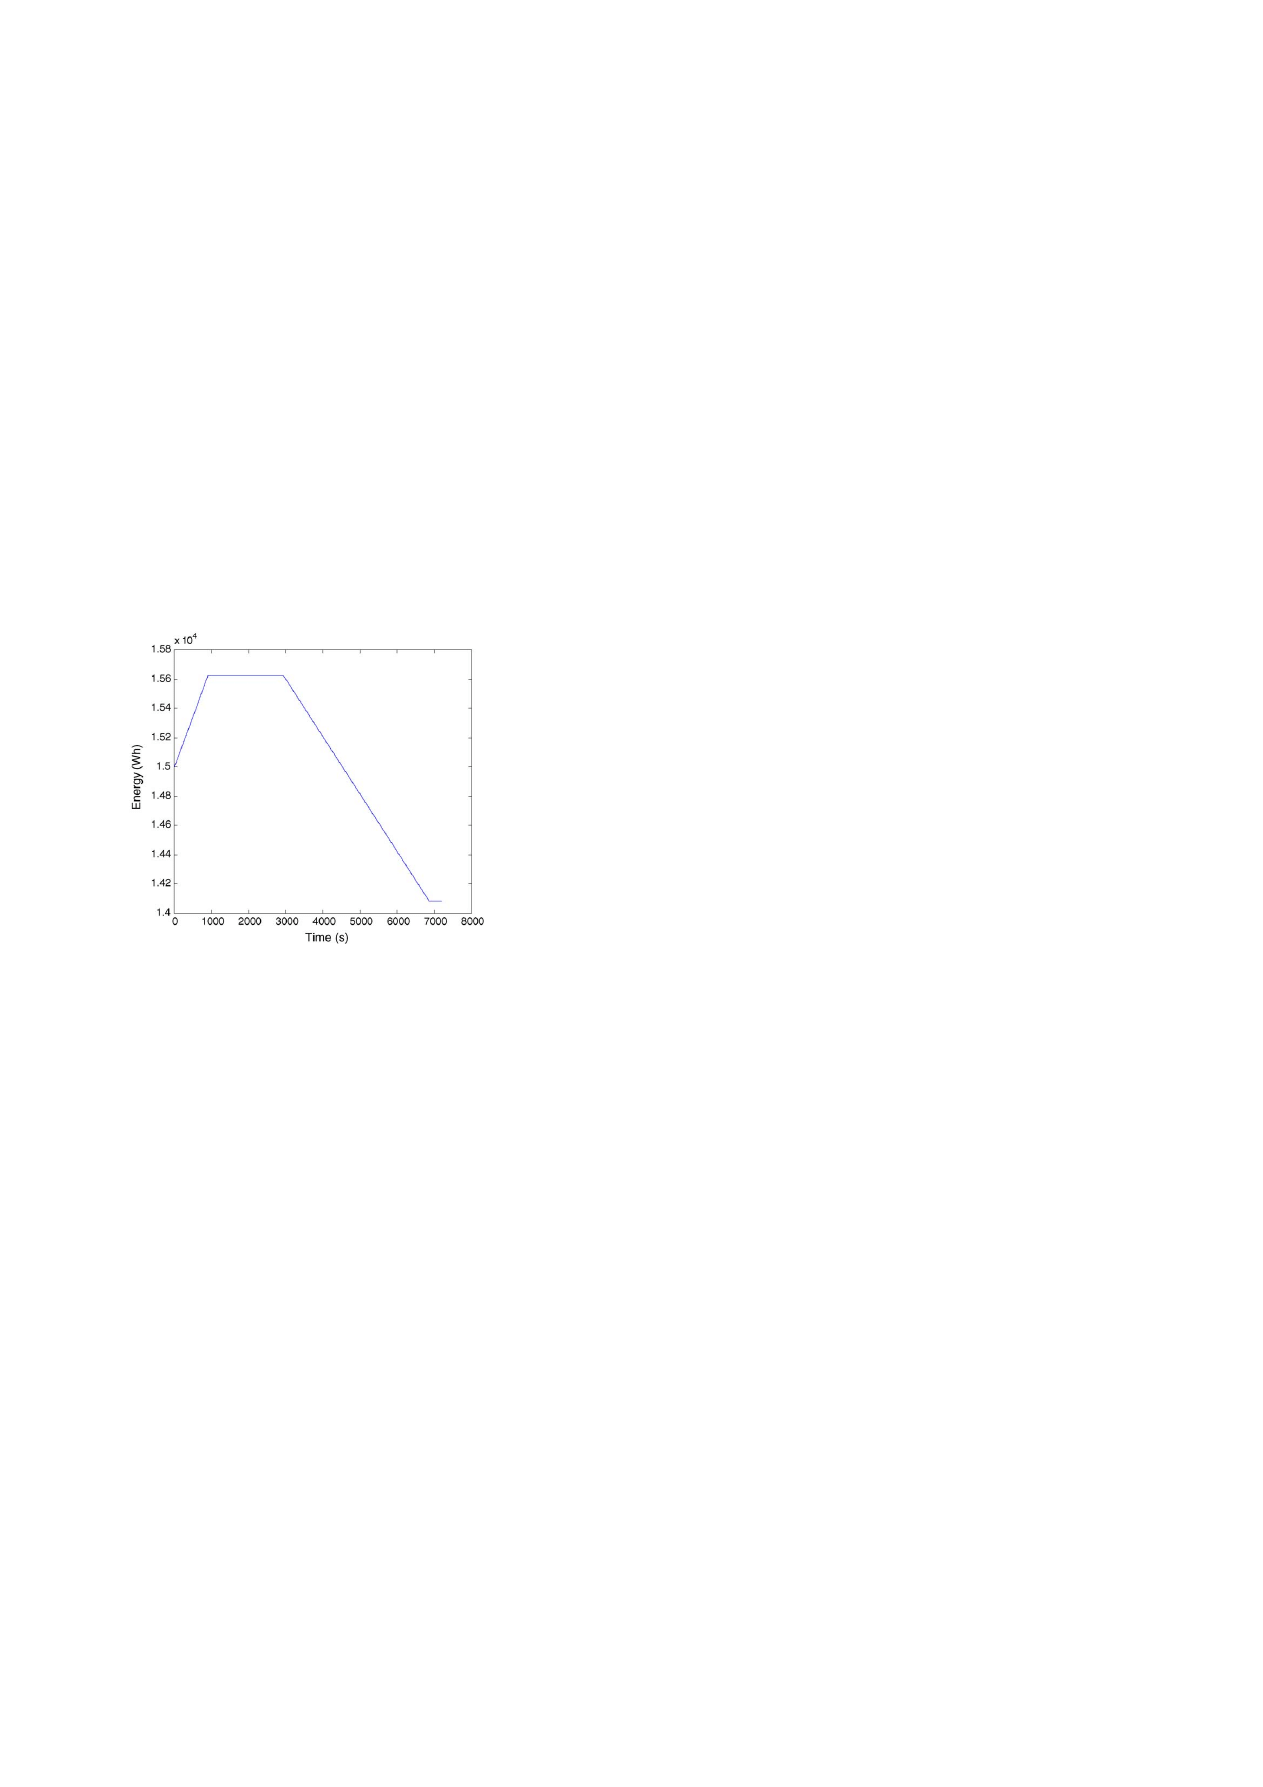
Fig. 12. Energy of the stored hydrogen
W
H
2
(
t).
which point W(t) reaches W
ref
again and the FC is turned
off.
shows the equivalent evolution of the energy of
the stored hydrogen. The initial stored energy (
W
H
2
,0
) is set
to 15 kWh. It is obvious that when the electrolyzer is in oper-
ation producing hydrogen (0 < t < 991 s),
W
H
2
(
t) increases,
and when the FC works consuming hydrogen (t > 2990 s),
W
H
2
(
t) decreases.
These results show that the models described in this paper
can be used to predict the performance of a renewable energy
system with hydrogen storage for any reasonable scenario.
Moreover it is possible to know the conditions necessary to
make the system autonomous by checking the hydrogen suf-
ficiency in the system (
). The stored amount of hydro-
gen energy gives us the time during which the RESHS could
work as a purely stand-alone source in the extreme case of
zero power input from the WT or the PV array.
6. Conclusions
We developed a model to simulate a power generator fed
by renewable energies (wind and light), with batteries and
gaseous hydrogen as energy reservoirs, and electrolyzers and
fuel cells as converters of energy between electrical and hy-
drogen. Special attention has been given to the modeling of
each sub-unit of the system. The electrolyzer and the fuel cell
are modeled by using their steady-state polarization curves.
Due to the important role of power interfaces (boost and buck
converters) in the RESHS, they are modeled for both their
transient and steady state behaviors (ARMA model). A sim-
plified model is used for the battery, with parameters easy to
estimate, and tested with all the other system components.
The validation of all component models is based on a 10-
stage algorithm that develops their dynamic evolution during
the course of the simulation. Comparison with experimen-
tal data confirms that these models give realistic and reliable
results. The simulation gives an average deviation estimated
at less than 5% compared to an actual test-bench generator,
even in the presence of strong fluctuations of the primary en-
ergy input sources. A second application of the model was
to simulate the power scenario for a residential application,
with power sources typical for our region. The results confirm
again that the model can describe the behavior of a RESHS
in a realistic way.
Acknowledgements
This work has been supported in part by the Natural Sci-
ences and Engineering Research Council of Canada, the Min-
ist`ere de la Recherche, de la Science et de la Technologie du
Qu´ebec, and the Canada Foundation for Innovation.
References
[1] K. Agbossou, R. Chahine, J. Hamelin, F. Laurencelle, A. Anouar,
J.-M. St-Arnaud, T.K. Bose, J. Power Sources 96 (2001) 168–172.
[2] S.R. Vosen, J.O. Keller, Int. J. Hydrogen Energy 24 (1999)
1139–1156.
[3] A.G. Dutton, J.A.M. Bleijs, H. Dienhart, M. Falchetta, W. Hug, D.
Prischich, A.J. Ruddell, Int. J. Hydrogen 25 (2000) 705–722.
[4] K. Agbossou, M. Kolhe, J. Hamelin, ´
E. Bernier, T.K. Bose, Int. J.
Renewable Energy 28 (8) (2004) 1305–1318.
[5] L.E. Unnewehr, S.A. Nsar, Electric Vehicle Technology, John Wiley,
1982, pp. 81–91.
[6] K. Agbossou, R. Simard, S. Kelouwani, T.K. Bose, CCECE’2001:
Proceedings of the IEEE Canadian Conference on Electrical and
Computer Engineering, Toronto, Canada, Paper 178, 2001.
[7] J.P. Vanhanen, P.D. Lund, Int. J. Hydrogen Energy 20 (7) (1995)
575–585.
[8] W. Hug, H. Bussmann, A. Brinner, Int. J. Hydrogen Energy 18
(1993) 973–977.
[9] D. Linden, Handbook of Batteries, McGraw-Hill, USA, 1994.
[10] P.S. Kauranen, P.D. Lund, J.P. Vanhanen, Int. Assoc. Hydrogen En-
ergy 19 (1) (1994) 99–106.
[11] L. Barra, D. Coiante, Int. Assoc. Hydrogen Energy 18 (8) (1993)
685–693.
[12] Y. Kim, S. Kim, IEEE Transact Energy Conversion 14 (2) (1999)
239–244.
[13] F. Laurencelle, R. Chahine, J. Hamelin, K. Agbossou, M. Fournier,
T.K. Bose, Fuel Cells 1 (1) (2001) 66–71.
[14] http://www.radtherm.com/support/publications/batterymodelsdoc.html.
[15] P. Mauracher, E. Karden, K. Rembe, Proceedings of the International
Conference on Lead–Acid Batteries LABAT’96, 1996.
[16] C. Alippi, V. Piuri, IEEE Transact. Instrum. Meas. 45 (2) (1996)
670–676.
Document Outline
- Model for energy conversion in renewable energy system with hydrogen storage
Wyszukiwarka
Podobne podstrony:
H Infinity State Feedback Control for a Class of Networked Cascade Control Systems With Uncertain De
Power Converters And Control Renewable Energy Systems
A Cage Induction Generator Using Back To Back Pwm Converter For Variable Speed Grid Connected Wind E
For a truly independent energy system, your choices are solar
Small Wind Energy Systems for the Homeowner
Energy and CO2 analysis of poplar and maize crops for biomass production in Italy Włochy 2016
Small Wind Energy Systems for Battery Charging
Evolution in Brownian space a model for the origin of the bacterial flagellum N J Mtzke
Introduction to Wind Energy Systems;Basics,Technology & Operation Wagner & Mathur (Springer 2009)(90
Synchronous Generator And Frequency Converter In Wind Turbine Applications System Design And Efficie
(Gardening) Landscaping For Energy Efficiency
A Model for Detecting the Existence of Unknown Computer Viruses in Real Time
System Dynamic Model for Computer Virus Prevalance
[Engineering] Electrical Power and Energy Systems 1999 21 Dynamics Of Diesel And Wind Turbine Gene
A dynamic model for solid oxide fuel cell system and analyzing of its performance for direct current
Are There Any Cheap Ways of Getting Energy Phone Line For Energy Articles free download pdf
NIKOLA TESLA S RADIANT ENERGY SYSTEM
więcej podobnych podstron