
SPECIAL ISSUE ON GREEN HYDROGEN AND FUEL CELL SYSTEMS
A dynamic model for solid oxide fuel cell system and
analyzing of its performance for direct current and
alternating current operation conditions
Ayetül Gelen
1,*,†
and Tankut Yalcinoz
2
1
Department of Electrical and Electronics Engineering, Nigde University, Nigde, Turkey
2
Department of Electrical and Electronics Engineering, Meliksah University, Talas, Kayseri, Turkey
SUMMARY
This paper presents a dynamic model of a solid oxide fuel cell (SOFC) and its performance test under direct current (DC) and
alternating current (AC) operation conditions. The proposed fuel cell model involves all voltage losses, thermal dynamics
and methanol reformer. SOFC model is developed on Matlab/Simulink environment. First, DC load following capability
of proposed SOFC dynamic model is examined. Then, the SOFC dynamic model is connected to single-machine in
finite
bus through a transmission line. To connect the proposed SOFC dynamic model to AC bus, a basic power conditioner unit
(PCU) is designed. A PCU, which consists of a DC
–DC boost converter, a DC–AC inverter, their controller, transformer and
filter, is designed. Finally, the proposed SOFC model is also simulated for an AC power system that has sinusoidal
voltage of 400 V, frequency of 50 Hz and resistive load of 200 W. The simulation results show that the proposed SOFC
dynamic model has followed fairly DC load variations. Also, the output voltage of fuel cell system under maximum
DC load conditions is obtained as 280 V. The designed power conditioning unit is suitable for studying AC power
system applications. Copyright © 2012 John Wiley & Sons, Ltd.
KEY WORDS
solid oxide fuel cell; dynamic model; thermal modeling; in
finite bus
Correspondence
*Ayetül Gelen, Department of Electrical and Electronics Engineering, Nigde University, Nigde, 51245, Turkey.
†
E-mail: aygelen@hotmail.com
Received 22 September 2011; Revised 13 March 2012; Accepted 16 March 2012
1. INTRODUCTION
Fuel cells are electrochemical devices that convert the
chemical energy of a reaction directly into electrical energy.
They have high ef
ficiency and very low emission. Fuel cells
have been used basically in transportation, stationary power
generation and portable applications. Solid oxide fuel cell
(SOFC) can be used as power plants and operates at high
temperature. Therefore, SOFC systems have better thermal
integration between the fuel cell system and a reforming
reactor. The total ef
ficiency of SOFC system is increased
with combined heat power system [1
–3].
During the last decades, various SOFC dynamic models
have been developed and investigated by researchers.
Padulles et al. reported [4] a basic SOFC dynamic model,
which considers only ohmic voltage loss. However, in this
model, the fuel cell temperature was kept constant, and a
reformer was not used. Also, Zhu and Tomsovic [5] added
a CO reformer and a power section to same model
mentioned in Ref. [4]. Sedghisigarchi and Feliachi [6] in-
troduced a SOFC model that contains three voltage losses
(ohmic, activation and concentration) and thermal dynam-
ics. However, a fuel reformer was not considered in their
model. Li et al. [7] only added a methanol reformer to
the model proposed in [4]. They suggested two control
schemes as constant utilization control and constant volt-
age control for the SOFC model. Goel et al. [8] presented
a dynamic model, which considers all voltage losses,
thermal dynamics and a fuel reformer. However, their
reformer model is based on a
first-order transfer function
[8]. In another study, electrochemical, material conservation,
diffusion, thermal and double layer charging effect equations
were used to develop a SOFC model [9].
Besides, some researchers have focused on dynamics of
power plant with single-machine in
finite bus (SMIB) for
AC test of SOFCs. The in
finite bus connected to one
generator system is called as SMIB. The voltage and
frequency characteristics of the in
finite bus are constant
in the case of any load variation. In the literature, hybrid
power sources, adaptive control schemes, effect of
firing
angle on active power, power
flow control, microgrid
applications, grid fault conditions and inverter control
INTERNATIONAL JOURNAL OF ENERGY RESEARCH
Int. J. Energy Res. (2012)
Published online in Wiley Online Library (wileyonlinelibrary.com). DOI: 10.1002/er.2922
Copyright © 2012 John Wiley & Sons, Ltd.

strategies related to in
finite bus have been studied by
researchers [1,10
–14]. However, researchers considered
only thermal aspects of fuel cells operation or developed
SOFC models using pure hydrogen as fuel. Moreover,
these models have not included either all voltage losses
or irreversible-type SOFC.
In this paper, the proposed SOFC dynamic model
includes all of properties such as a methanol reformer,
electrochemical properties, voltage losses as ohmic,
activation and concentration. In the previous studies, the
first-order transfer function is used to develop the reformer
model. However, the fuel reformer, which is used in this
paper, is based on second-order transfer function presented
in Ref. [15]. Furthermore, the SOFC model has a modi
fied
thermal module developed in Ref. [8]. SOFC parameters
are obtained from Refs. [4,6,8,16,17]. Therefore, this
SOFC model complements existing models. To connect
the proposed SOFC dynamic model to AC bus, a basic
power conditioner unit (PCU) is designed. PCU consists
of a DC
–DC boost converter and a DC–AC inverter. First,
DC load following ability of the SOFC model is examined.
Then, AC performance test of the SOFC model is investi-
gated by using designed PCU. SMIB is connected to the
system for this test study. Also, an AC power system with
resistive load is simulated. The fuel cell model, PCU and
test systems are implemented in MATLAB/Simulink
environment.
2. DYNAMIC MODEL OF
SOFC SYSTEM
2.1. Fuel reformer unit model
In Ref. [15], the authors presented a reformer and its con-
troller model that generates hydrogen through reforming
methanol. Mathematical form of this model can be written
as follows:
q
H
2
q
methanol
¼
CV
t
1
t
2
s
2
þ t
1
þ t
2
ð
Þs þ 1
(1)
where q
methanol
is methanol
flow rate (kmol s
-1
), CV is con-
version factor and
t
1
,
t
2
are time constants (s).
A proportional integral (PI) controller is used to control
flow rate of methanol in the reformer [15]. Feedback signal
is SOFC stack current, and the request hydrogen
flow rate
can be written as
q
req
H
2
¼
NI
2FU
(2)
where q
req
H
2
is the amount of hydrogen
flow required to meet
the load change (kmol s
-1
), N is the number of cells asso-
ciated in series in the stack, F is the Faraday
’s constant
(C kmol
-1
), I is the stack current (A) and U is utilization
rate. This hydrogen amount can be used to control the
methanol
flow rate [15]:
q
methanol
¼ k
3
þ
k
3
t
3
s
NI
2FU
(3)
where k
3
is the PI gain, and
t
3
is the time constant of
the controller. The oxygen
flow is considered using the hy-
drogen, oxygen
flow ratio r
H_O
. The model of the methanol
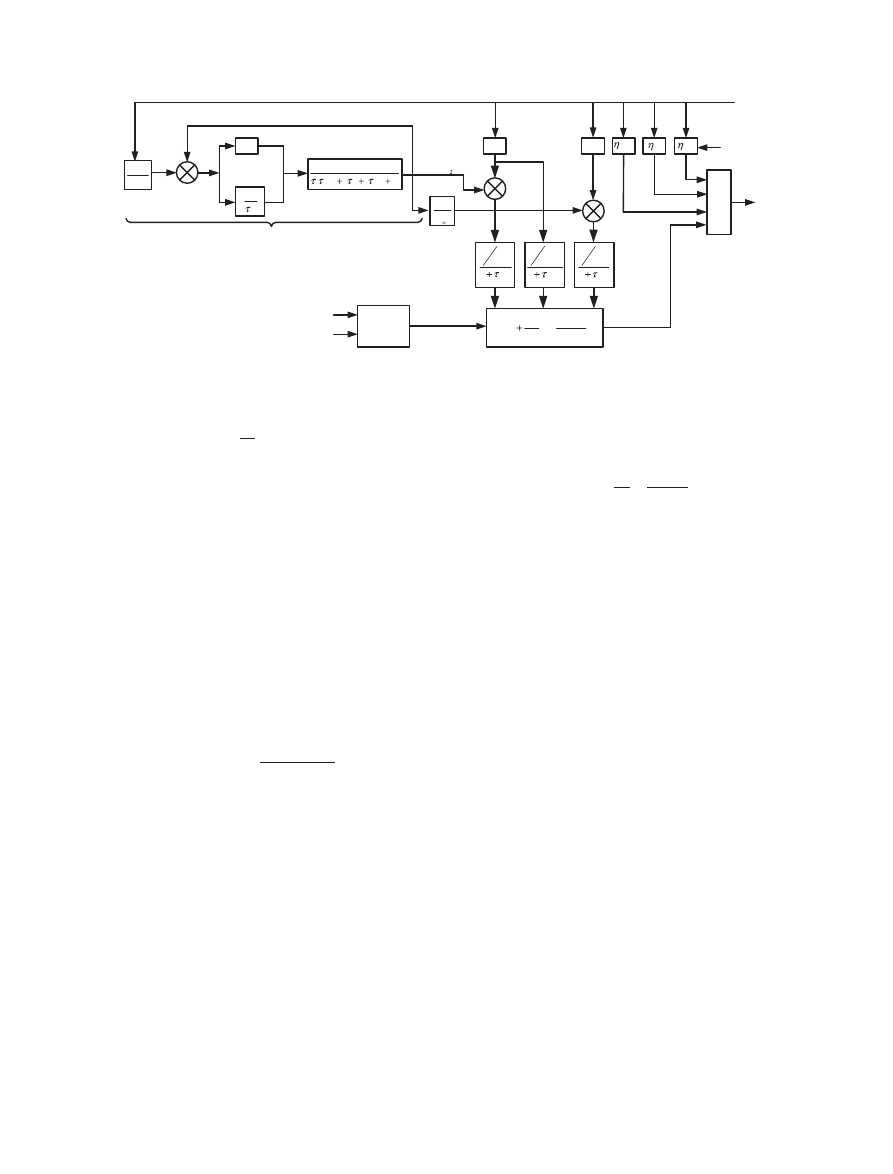
reformer and its controller is shown in Figure 1 [15].
2.2. Solid oxide fuel cell stack model
2.2.1. Electrochemical model
Expressions of molar
flow and partial pressure of
species are given in detail in Ref. [4]. The molar
flow of
any gas through the valve is proportional to its partial pres-
sure inside the channel. Related equations are as follows [4]:
q
H
2
p
H
2
¼ K
H
2
q
H O
2
p
H O
2
¼ K
H O
2
(4)
where q
H
2
, q
H
2
O
are the molar
flows of hydrogen and water,
respectively, through the anode valve (kmol s
-1
); p
H
2
, p
H
2
O
are the partial pressures of hydrogen and water, respectively
(atm); and K
H
2
, K
H
2
O
are the valve molar constants for
hydrogen and water, respectively (kmol s
-1
atm). According
to the basic electrochemical relationships, the molar
flow of
hydrogen that reacts can be calculated as [4]
q
r
H
2
¼
NI
2F
¼ 2K
r
I
(5)
where K
r
is a constant de
fined for modeling purposes
(kmol s
-1
A). Taking the Laplace transform of both sides
and isolating the hydrogen partial pressure yields the
following expression [4]:
P
H
2
¼
1
=K
H
2
1
þ t
H
2
s
q
in
H
2
2K
r
I
(6)
where
t
H
2
¼ V= K
H
2
RT
ð
Þ , expressed in seconds, is the
value of the system pole associated with the hydrogen
flow. Here, V is volume of anode, R is universal gas
constant (J mol
-1
K
-1
) and T is stack temperature (
K).
A similar operation can be made for all the reactants and
products [4].
2.2.2. Energy balance equation
SOFC models, which concentrate on effects of
temperature
dynamics,
were
previously
investigated
[6,8,9,14,18
–20]. However, reformers were not used in
their model, or reformers were modeled as a
first-order
transfer function. The fuel cell power output is closely
related to the temperature of the fuel cell unit [6]. Heat
transfers occur mainly as conduction, convection and
radiation heat transfers [9]. The energy balance equation
for each cell is as follows [6,21]:
Solid oxide fuel cell and its power applications
A. Gelen and T. Yalcinoz
Int. J. Energy Res. (2012) © 2012 John Wiley & Sons, Ltd.
DOI: 10.1002/er
M
P
C
P
dT
dt
¼ q
e
V
e
þ
X
Q
i
(7)
where M
P
is the mass of the cell (kg); C
P
is the heat
capacity of the cell (J kg
-1
K
-1
); T is temperature of
the cell (
K); q
e
is heat generated from the electrochem-
ical reaction per volume unit; V
e
is the volume of the
cell (m
3
); and Q
i
is total heat which is the summation
of conductive, convective, and radiative heat between
cell unit and separators [6,18,19,21]. The coef
ficients of
the speci
fic heats C
P
are encountered in standard refer-
ence tables [18].
C
P
;i
¼ ai þ b
i
T
þ c
i
T
2
(8)
In Ref. [8], researchers presented a modi
fied thermal
dynamic block. The amount of increase in temperature
at the current state can be calculated as follows:
T
o
¼ T þ
T
in
þ ΔT T
t
dt
(9)
where T
o
is the output temperature; T
in
is the initial
temperature at starting/no load;
ΔT is the rise in temper-
ature from T
in
, at a particular loss, that will occur after a
laps of the relaxation time; T is the current temperature
of the fuel cell under load; t is the relaxation time; and
recently, dt is the Simulink time step [8]. According to
Equation (9), the output temperature of the SOFC stack
is determined on the subject of the current temperature
and the relaxation time. In this paper, we used this ther-
mal model by adapting the proposed SOFC model.
2.2.3. Nernst
’s voltage equation
In taking into account ohmic, concentration and activa-
tion losses and in applying Nernst
’s equation and Ohm’s
law, the stack output voltage is represented as follows
[6,19,22,23]:
V
dc
¼ V
o
ohm
act
conc
(10)
V
o
¼ N E þ
RT
2F
ln
p
H
2
p
1
=2
O
2
p
H
2
O
!
(11)
where V
o
is the open-circuit reversible potential (V),
ohm
is the ohmic losses (V),
act
is the activation losses (V),
conc
is the concentration losses (V) and E is the standard
reversible cell potential.
The ohmic loss varies directly with the stack current,
increasing over the complete range of current because
the cell resistance remains basically constant. It is related
to ionic and electronic conduction in the fuel cell. The
activation loss is dominant at low current density and in-
crease as current increases. It is related to electrochemical
reaction. The concentration loss is related to mass transport
loss and occurs at higher current levels [23].
2.2.4. Solid oxide fuel cell system
The complete SOFC system is obtained by cascade con-
necting of a methanol reformer, electrochemical module,
three voltage loss modules and modi
fied thermal module.
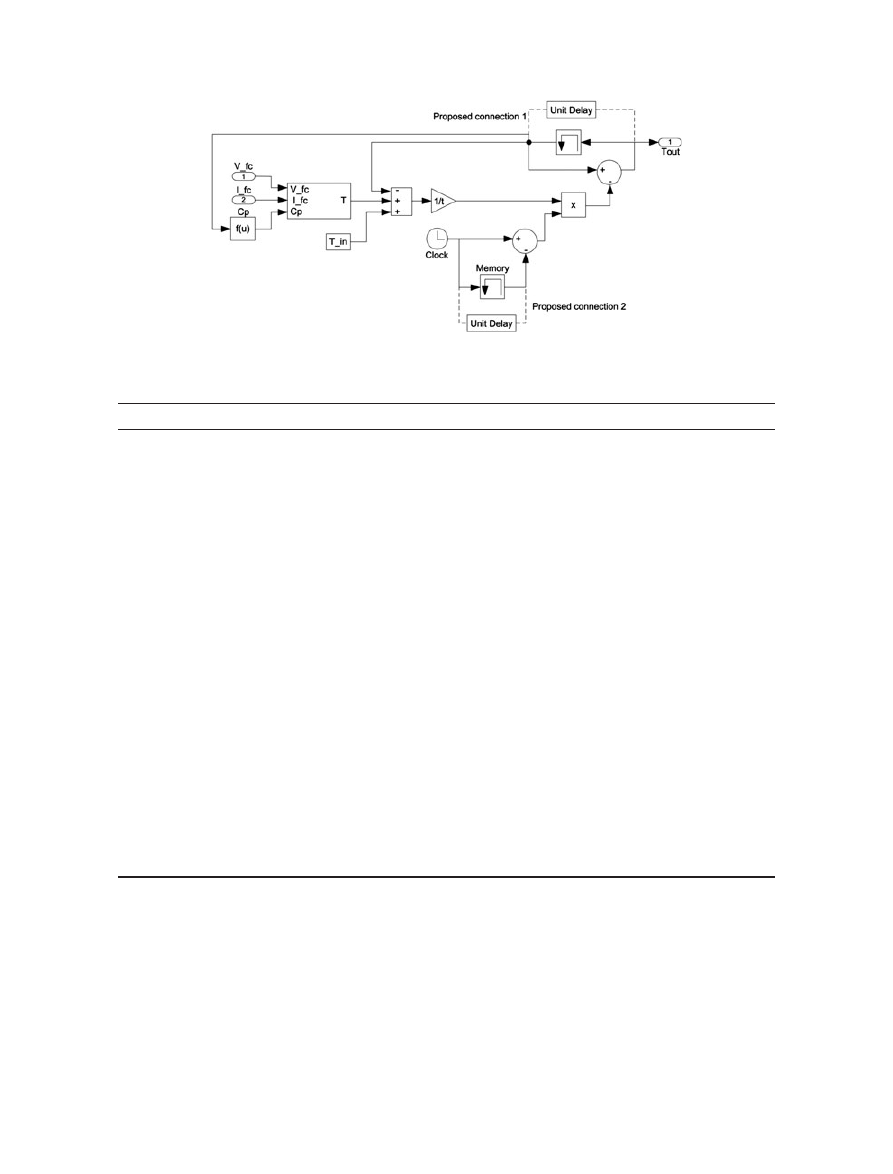
The proposed SOFC dynamic system is shown in Figure 1.
In this paper, thermal part of the SOFC system is modeled
by regarding the thermal model presented in Ref. [8]. The
output temperature of the SOFC stack is computed by the
current temperature. This computation was performed by
using
‘memory block’ in [8]. Especially, in the AC opera-
tion conditions, the simulation time suffers from this block.
In this paper, the
‘unit delay’ block is used to solve this
problem. The proposed thermal module is given in
Figure 2. The simulation results for SOFC model, which
includes both
‘memory block’ and ‘unit delay block’, are
presented in Section 3.3. The SOFC system is implemented
in Matlab/Simulink. The rated power of the SOFC system
is 100 kW. Table I shows the model parameters of the SOFC
system, which are taken from Refs. [4,6,8,16,17].
I
fc
+
-
3
3
k
s
H O
1
r
2
1 2
1
2
CV
s
(
)s
1
3
k
+
-
in
H
q
r
2K
2
in
O
q
2
2
2
0.5
H
O
H O
P P
RT
N [ E
(ln(
)]
2F
P
r
K
act
ohmic
V
fc
2
H
P
2
H O
P
2
O
P
V
o
Nernst voltage
-
-
-
+
+
-
2
2
O
O
1
K
1
s
2
2
H O
H O
1
K
1
s
2
2
H
H
1
K
1
s
conc
Modified
Thermal
Block
V
fc
I
fc
T
out
N
2FU
Methanol reformer
T
out
Figure 1. Proposed dynamic model for solid oxide fuel cell (SOFC) system.
Solid oxide fuel cell and its power applications
A. Gelen and T. Yalcinoz
Int. J. Energy Res. (2012) © 2012 John Wiley & Sons, Ltd.
DOI: 10.1002/er
3. RESULTS AND DISCUSSION
In this section, we present three simulation examples to
verify the feasibility of the proposed SOFC dynamic
model. Simulation of all examples has been performed by
using Matlab/Simulink.
First, DC load following ability of the proposed SOFC
model is examined. Then, AC performance of the SOFC
model is investigated by designed PCU. SMIB is connected
to the SOFC system for this test study. Besides, the SOFC
model is re-simulated for the same AC power system with
resistive load instead of SMIB. These simulation results
are given in Sections 3.1 and 3.3, respectively.
3.1. Simulation of direct current
load-following of solid oxide fuel cell
The proposed SOFC dynamic model is tested with step
changes in the load. These steep changes in power are used
for testing the load-tracking of the proposed system. The
Figure 2. Proposed thermal model modi
fication for SOFC system.
Table I. Parameters of the SOFC system used in the dynamic model.
Variable
Speci
fication
Value
Reference
P
stack
Stack power
100 kW
[4]
T
Cell temperature
Variable
—
F
Faraday
’s constant
96484600 C mol
-1
—
R
Gas constant
8314.47 J/(kmol
K)
—
E
Ideal standard potential
0.935 V
[6]
N
Number of cells in stack
384
[4]
K
r
Constant K
r
= N/4F
9.9498
10
-7
kmol (s A)
-1
—
K
H
2
Valve molar constant for hydrogen
8.43*10
-4
kmol (s atm)
-1
[4]
K
H
2
O
Valve molar constant for water
2.81*10
-4
kmol (s atm)
-1
[4]
K
O
2
Valve molar constant for oxygen
2.52*10
-3
kmol (s atm)
-1
[4]
t
H
2
Response time for hydrogen
flow
26.1 seconds
[4]
t
H
2
O
Response time for water
flow
78.3 seconds
[4]
t
O
2
Response time for oxygen
flow
2.91 seconds
[4]
R
int
Ohmic loss
0.126
Ω
[4]
r
H
O
Ratio of hydrogen to oxygen
1.145
[17]
B
Activation voltage constant
0.04777 A
-1
[16]
C
Activation voltage constant
0.0136 V
[16]
t
1
Reformer time constant
4 seconds
—
t
2
Reformer time constant
4 seconds
—
t
3
Reformer time constant
4 seconds
—
CV
Conversion factor
2
[16]
k
3
PI gain constant
1/(2*CV)
—
I
L
Limiting current
800 A
[17]
h
eff
Thickness
0.05 m
—
l
s
Thermal conductivity
27 W (m
K)
-1
[8]
Ef
ficiency
0.8
[6]
s
Density
7800 kg m
-3
[8]
t
Relaxation time
200 seconds
[8]
Solid oxide fuel cell and its power applications
A. Gelen and T. Yalcinoz
Int. J. Energy Res. (2012) © 2012 John Wiley & Sons, Ltd.
DOI: 10.1002/er
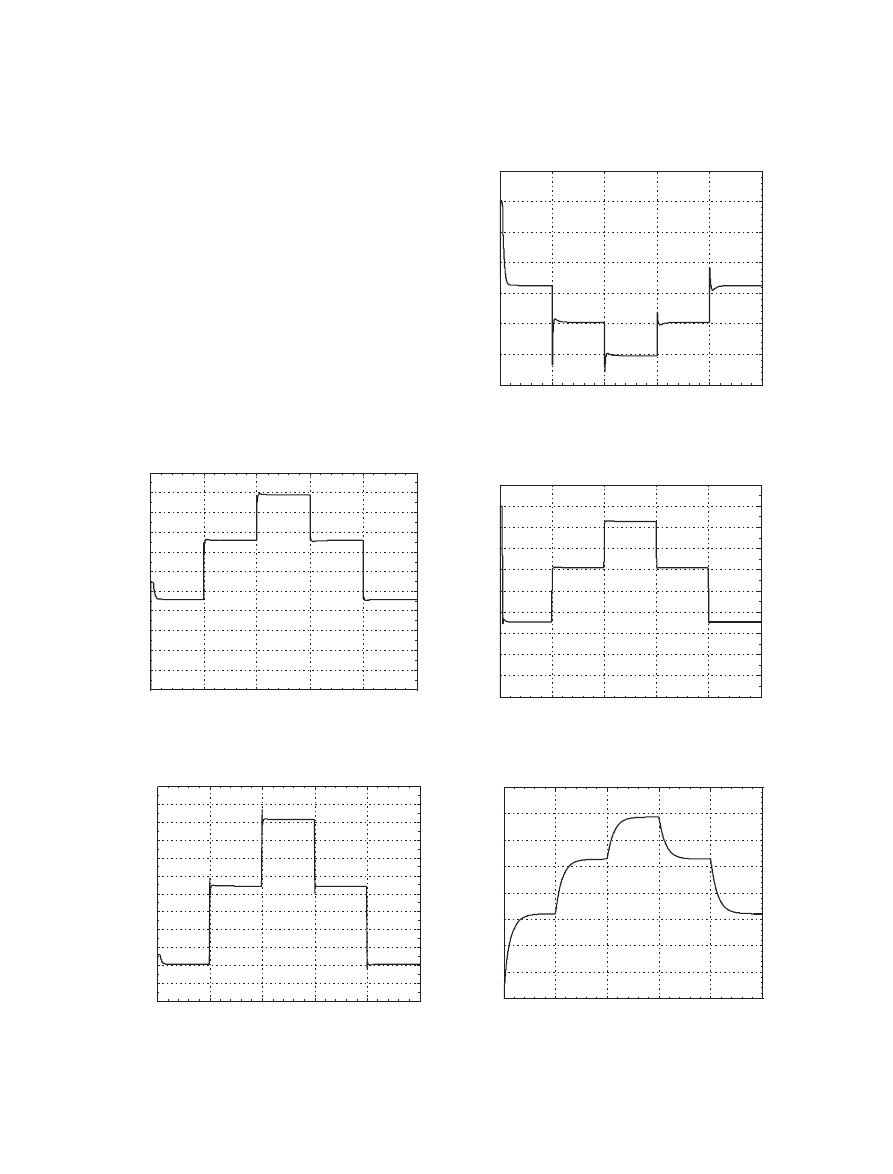
change of the load output power, the load current, the load
voltage, the
flow rate of hydrogen and stack temperature
are shown in Figures 3
–7. Figures show variations of
quantities in a test period of 7500 seconds.
The waveform of SOFC output currents for DC loads
can be seen from Figure 4. The variations at the stack
voltage in the system are given in Figure 5. The stack
voltage is changed by using step changes at levels 302
V-290 V-280 V-290 V-302 V in 1500-second time
interval as shown in Figure 5. The increasing in the load
current causes a decrease in the output voltage of SOFC.
Besides, as seen from Figure 6, the hydrogen
flow rate
follows load power variations. Thus, hydrogen
flow rate
as based on second-order transfer function of the given
reformer model in Ref. [15] provides smooth load
tracking. The corresponding temperature response of
the proposed SOFC dynamic model is given in Figure 7.
The output temperature reaches to the steady-state
value after 800 seconds for the
first load change. It
can be seen that stack temperature varies between 1200
and 1270
K. As seen from Figure 7, the fuel cell
’s
temperature increases/decreases when the load current
increases/decreases. This result shows that the designed
0
1500
3000
4500
6000
7500
0
1
2
3
4
5
6
7
8
9
10
11
x 10
4
Time (s)
Stack Power (W)
Figure 3. Step changes in load power.
0
1500
3000
4500
6000
7500
100
125
150
175
200
225
250
275
300
325
350
375
400
Time (s)
SOFC Stack Current (A)
Figure 4. SOFC direct current (DC) output current.
0
1500
3000
4500
6000
7500
270
280
290
300
310
320
330
340
Time (s)
Stack Voltage (V)
Figure 5. SOFC DC output voltage.
0
1500
3000
4500
6000
7500
0
0.1
0.2
0.3
0.4
0.5
0.6
0.7
0.8
0.9
1
x 10
-3
Time (s)
Molar flows of H
2
(kmol/s)
Figure 6. Hydrogen
flow rate.
0
1500
3000
4500
6000
7500
1200
1210
1220
1230
1240
1250
1260
1270
1280
Time (s)
Temperature (K)
Figure 7. SOFC stack temperature.
Solid oxide fuel cell and its power applications
A. Gelen and T. Yalcinoz
Int. J. Energy Res. (2012) © 2012 John Wiley & Sons, Ltd.
DOI: 10.1002/er
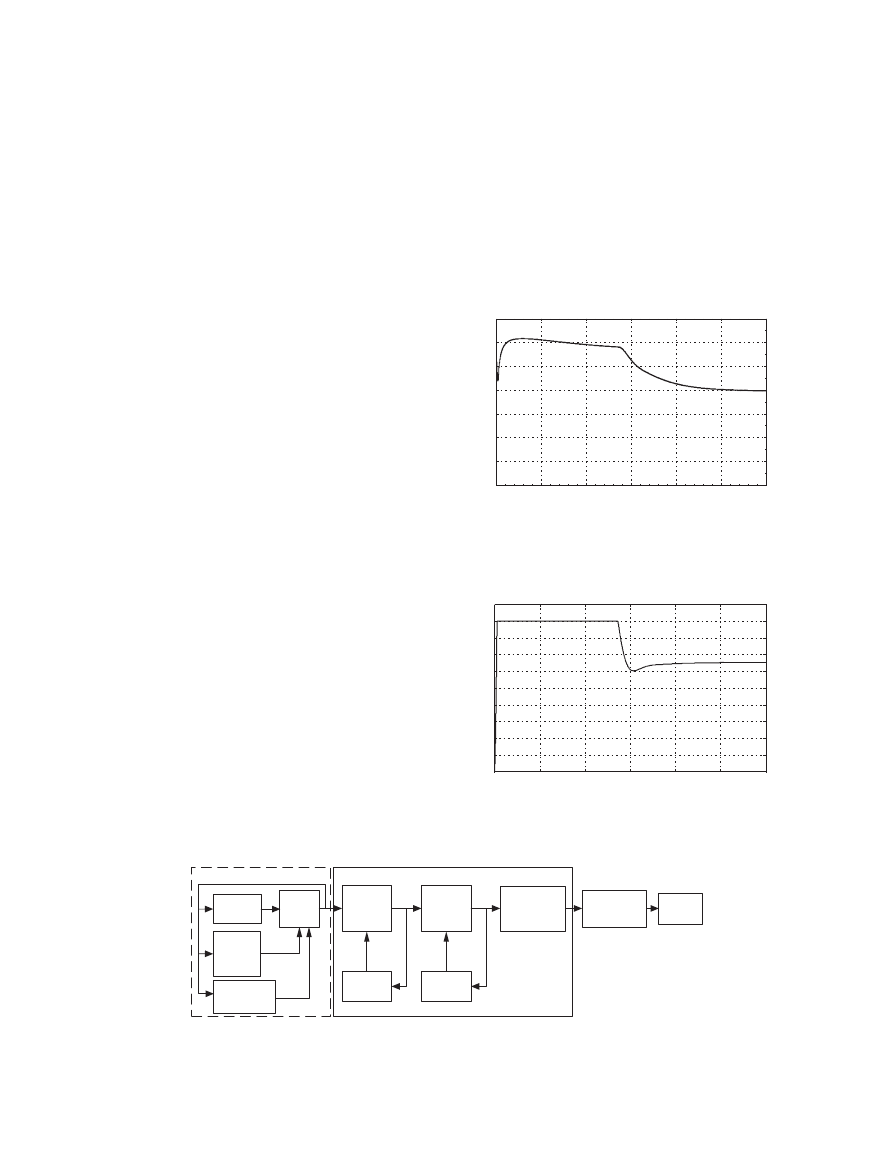
thermal dynamic block given in Ref. [8] has been
adapted successfully to our dynamic model.
3.2. Simulation of alternating current
performance of solid oxide fuel cell
For this simulation study,
first, a basic power conditioner
unit is designed. PCU consists of a DC
–DC boost con-
verter, a DC
–AC inverter and their controller. Then, SMIB
is connected to the SOFC system for testing AC perfor-
mance of the proposed SOFC model. This connection
consists of transformer, LC
filter and 3-km length short
transmission line. Here, note that simulated AC system
has not included a load unit. Figure 8 shows a block
diagram of the SOFC system connected to SMIB.
DC-DC converter and DC
–AC inverter are based on
IGBT. AC voltage at fundamental frequency is obtained
by applying sinusoidal pulse-width-modulation technique
to voltage-source inverter. Two PI-type controllers are
designed separately to control
firing angles of the converter
and inverter in the PCU structure. Gains of PI controllers
of the converter and inverter are K
P
= 0.02, K
I
= 20 and
K
P
= 1, K
I
= 22, respectively. Output of PCU is connected
to a transformer to obtain sinusoidal voltage. Also, it
achieves isolation between PCU and in
finite bus. The LC
filter is used to reduce harmonics, and it is connected be-
tween PCU and the transmission line. Finally, in
finite
bus, which parameters are voltage of 400 V and frequency
of 50 Hz, is connected to end of the line. The voltage and
frequency characteristic of the in
finite bus are constant in
the case of any variation.
The SOFC stack voltage, the
flow rate of hydrogen,
DC
–DC boost converter output voltage and its duty ratio,
modulation index for DC
–AC inverter and, finally, line-
line RMS voltage of the transmission line are illustrated
in Figures 9
–15.
As seen in Figures 9 and 10, the output voltage and
hydrogen
flow rate of the fuel cell system are obtained
approximately 290 V and 0.65 kmol s
-1
, respectively.
These steady-state values are obtained after 250 seconds
elapsed. In case SMIB is connected to the proposed
SOFC and designed PCU, the responses of system can
be acceptable for AC tests because studied power system
has not included any AC load type.
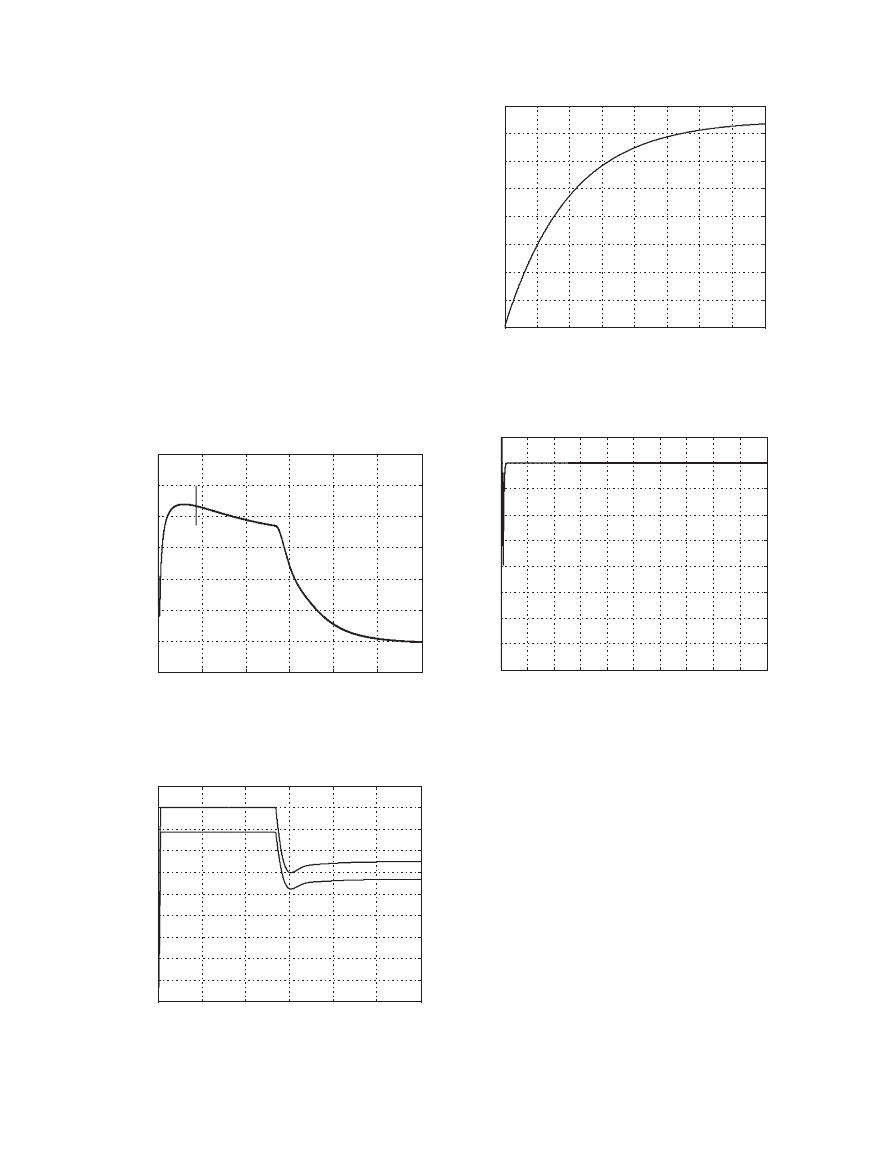
The unregulated output voltage of the SOFC system is
fed to boost converter. A regulated DC voltage is acquired
by adjusting the duty ratio to the required value. The
output voltage ripple of the converter is about 1%. Accord-
ing to Figure 11, the voltage is boosted depending upon the
duty ratio. The response time of the converter is short
compared with the fuel cell output voltage. This means that
the controller is well designed for this converter.
The input and output voltages of the inverter are
averagely 400 V DC and 220 V
RMS
AC, respectively. By
adjusting modulation index of inverter, the AC output
SMIB
SOFC
DC-DC
Converter
DC-AC
Inverter
Transmission
Line
PI
Controller
PI
Controller
Reformer
Modified
Thermal
Block
All Voltage
Losses
Power Conditioner Unit (PCU)
Fuel Cell Current
SOFC System
Transformer
and
LC Filter
Figure 8. SOFC system connected to in
finite bus.
0
50
100
150
200
250
300
250
260
270
280
290
300
310
320
Time (s)
SOFC stack voltage (V)
Figure 9. SOFC stack voltage for system with single-machine
in
finite bus (SMIB).
0
50
100
150
200
250
300
0
0.1
0.2
0.3
0.4
0.5
0.6
0.7
0.8
0.9
1
x 10
-3
Time (s)
The flow rate of hydrogen (kmol/s)
Figure 10. The
flow rate of hydrogen for system with SMIB.
Solid oxide fuel cell and its power applications
A. Gelen and T. Yalcinoz
Int. J. Energy Res. (2012) © 2012 John Wiley & Sons, Ltd.
DOI: 10.1002/er
voltage is kept at the desired output value. As seen in
Figure 13, the modulation index is reached to steady-state
value around 5 seconds. Hereby, the response rate of the
PI controller of the inverter is reasonable for this type of
power system. Here, transformer and LC
filter also should
be considered associated with PCU because the output of
inverter is pulsed square wave form, and it is converted
to a signal, which has sinusoidal and required amplitude
value by the transformer. The LC
filter is used to obtain
more smooth sinusoidal form. As illustrated in Figure 8,
the
filter is located before the short transmission line.
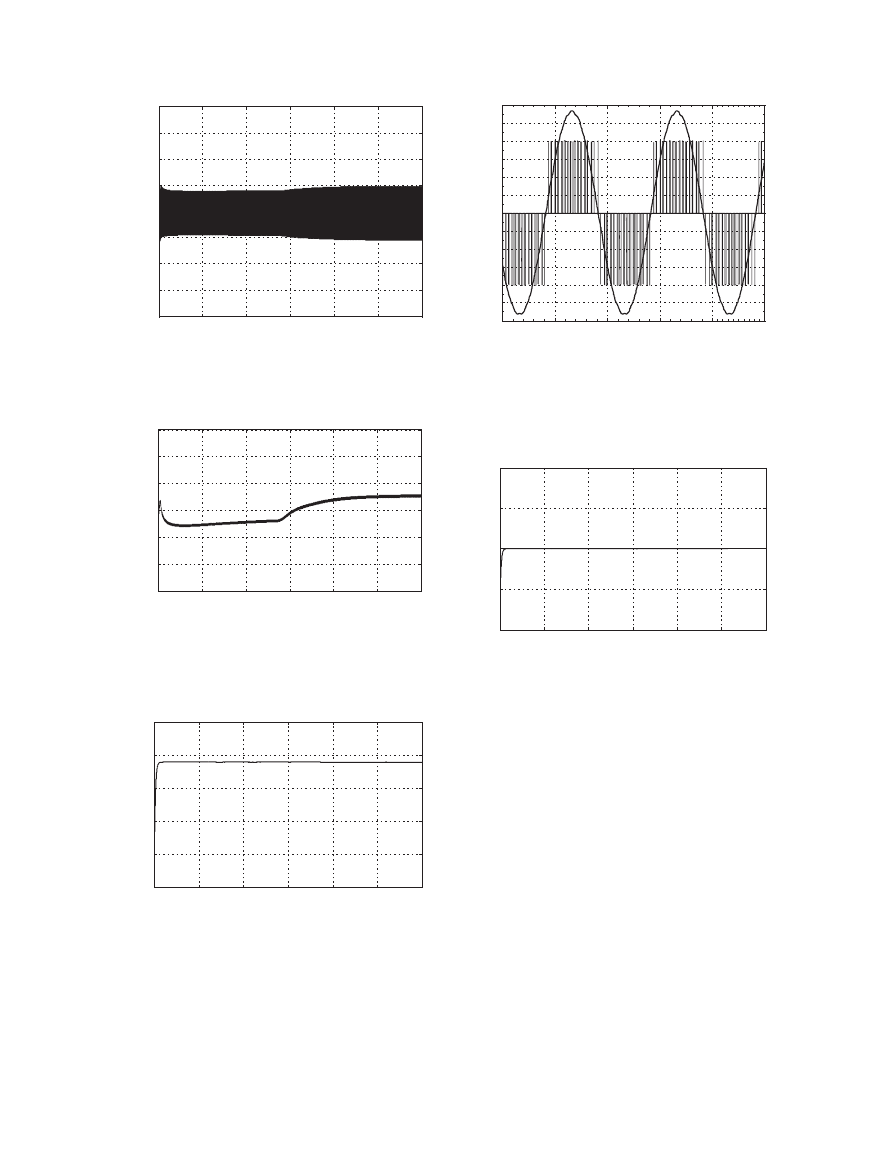
Inverter output voltage and
filter output voltage are
illustrated in Figure 14. The output voltage of the
filter is
reached to the desired value of 400 V
RMS
around 5 seconds
as seen from Figure 15. The results show that, the designed
PCU is suitable for AC power system studies.
3.3. Simulation of solid oxide fuel cell system
with alternating current resistive load
In this section, the proposed SOFC model is also simulated
for an AC power system with resistive load. For this study,
a star connected resistive load of 200 W is used. The
change of the output voltage of SOFC, the
flow rate of
0
50
100
150
200
250
300
380
385
390
395
400
405
410
415
420
Time (s)
Output voltage of DC-DC converter (V)
Figure 11. DC
–DC boost converter output voltage for system
with SMIB.
0
50
100
150
200
250
300
0.1
0.15
0.2
0.25
0.3
0.35
0.4
Time (s)
Duty ratio of DC-DC converter
Figure 12. Duty ratio of DC
–DC boost converter for system
with SMIB.
0
50
100
150
200
250
300
0.1
0.2
0.3
0.4
0.5
0.6
Time (s)
Modulation index for DC-AC inverter
Figure 13. Modulation index for DC
–AC inverter for system
with SMIB.
299.95
299.96
299.97
299.98
299.99
300
-600
-500
-400
-300
-200
-100
0
100
200
300
400
500
600
Time (s)
Inverter and filter output voltage (V)
Figure 14. Inverter and
filter output voltage for system with
SMIB.
0
50
100
150
200
250
300
390
395
400
405
410
Time (s)
Line-Line RMS voltage of transmission line (V
RMS
)
Figure 15. Line-line RMS voltage of transmission line for
system with SMIB.
Solid oxide fuel cell and its power applications
A. Gelen and T. Yalcinoz
Int. J. Energy Res. (2012) © 2012 John Wiley & Sons, Ltd.
DOI: 10.1002/er
hydrogen and oxygen, the stack temperature and the load
voltage are shown in Figures 16
–19. As seen in Figure 16,
the output voltage the fuel cell system with AC resistive
load is obtained about 290 V
DC
after 250 seconds elapsed.
The
flow rate of hydrogen is at maximum level for initial
150 seconds, and its steady-state value is 0.65 kmol s
-1
.
Also, the
flow rate of oxygen is about 0.57 kmol s
-1
after
175 seconds. According to Figure 19, the stack temperature
is obtained as 1237
K after 800 seconds. These amplitude
and time values is expected when compared with literature.
Finally, resistive load voltage is measured as 400 V
AC
. The
output voltage has not included any oscillation. It can be
said that PCU is well designed for this system. Nominal
operation conditions are provided successfully for AC
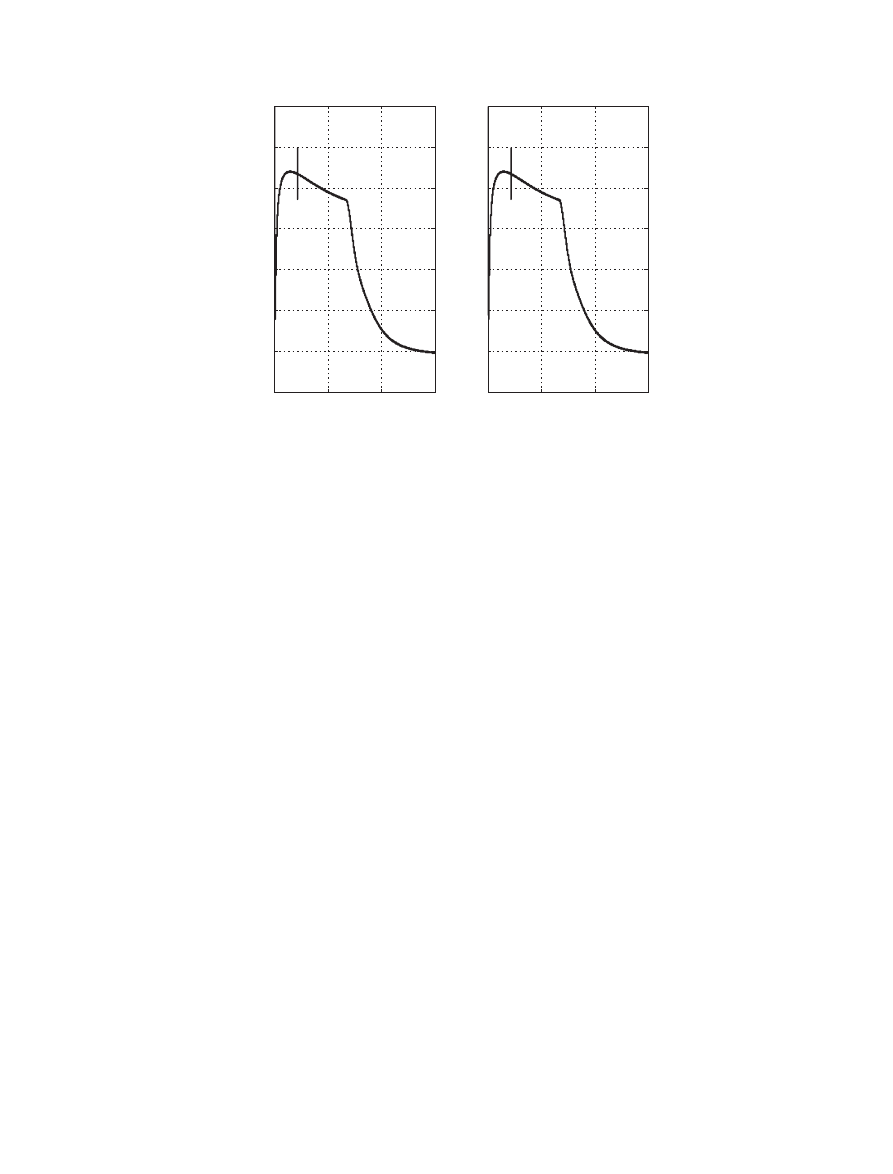
load. First, the simulations are performed by using
‘memory block’ in thermal module as in [8]. Then, the
simulations are performed with
‘unit delay block’. The
simulation results of both cases are given in Figure 20.
As it can be seen from Figure 20, same results are
obtained.
However,
the
simulation
performance
is
improved considerably. Therefore, the proposed modi
fied
thermal model that includes
‘unit delay block’ can be
used instead of the thermal model with
‘memory block’
in Ref. [8].
4. CONCLUSIONS
This paper presents the dynamic SOFC model for both DC
load-following ability and AC performance test via SMIB.
The modeling and simulation have been performed using the
Matlab/Simulink. The proposed SOFC dynamic model con-
sists of all voltage losses as ohmic, activation and concentra-
tion voltage drops, modi
fied thermal dynamics and a
methanol reformer, which is a second-order transfer function.
Initially, the proposed SOFC system has fast dynamic
response for the load variations. DC load tracking
0
50
100
150
200
250
300
285
290
295
300
305
310
315
320
Time (s)
SOFC stack voltage (V)
Figure 16. SOFC stack voltage for system with AC load.
0
50
100
150
200
250
300
0
0.1
0.2
0.3
0.4
0.5
0.6
0.7
0.8
0.9
1
x 10
-3
Time (s)
The flow rate of H
2
and O
2
(kmol/s)
qH2
qO2
Figure 17. The
flow rate of H
2
and O
2
for system with AC load.
0
100
200
300
400
500
600
700
800
1200
1205
1210
1215
1220
1225
1230
1235
1240
Time (s)
Temperature of SOFC stack (K)
Figure 18. Temperature of SOFC stack for system with AC load.
0
2
4
6
8
10
12
14
16
18
20
0
50
100
150
200
250
300
350
400
450
Time (s)
Load voltage (V)
Figure 19. Resistive load voltage for system with AC load.
Solid oxide fuel cell and its power applications
A. Gelen and T. Yalcinoz
Int. J. Energy Res. (2012) © 2012 John Wiley & Sons, Ltd.
DOI: 10.1002/er
capability of the system is good. The proposed dynamic
SOFC model is different from the other proposed models
in literature. However, simulation results produced by the
dynamic SOFC model are similar to those obtained by the
other studies. These results show that the designed thermal
dynamic block has been adapted successfully to the pro-
posed dynamic model. Besides, the simulation time is re-
duced by using the unit delay block in the thermal module.
Finally, the SOFC system is connected to SMIB
through a short transmission line for AC performance test.
For this case study, the power conditioning unit, which
includes a DC
–DC boost converter, a DC–AC inverter,
their controller, a transformer and a
filter, is designed.
According to simulation results, the designed controllers
for both of the converter and inverter are suitable for AC
system operations. The developed SOFC system is also
simulated for an AC power system with resistive load.
The simulation results show that the proposed SOFC
system is successfully operated at AC loads. Future work
will concentrate on AC power system applications such
as load
flow, active and reactive power management.
ACKNOWLEDGEMENT
This work was supported in part by The Scienti
fic and
Technological Research Council of Turkey under the
project number of TUBITAK 109R024.
REFERENCES
1. Hajizadeh A, Golkar MA. Fuzzy neural control of a
hybrid fuel cell/battery distributed power generation
system. IET Renewable Power Generation 2009;
3:402–414. DOI:10.1049/iet–rpg.2008.0027
2. Fuel Cell Handbook (6th edn.). EG & G Services, Inc.,
Sci. Appl. Int. Corp., DOE, Of
fice Fossil Energy, Nat.
Energy Technol. Lab.: Morgantown, WV, 2002.
3. Colpan CO, Dincer I, Hamdullahpur F. A review on
macro-level modeling of planar solid oxide fuel cells.
International Journal of Energy Research 2008;
32(4):
336
–355. DOI:10.1002/er.1363
4. Padulles J, Ault GW, McDonald JR. An integrated
SOFC plant dynamic model for power systems
simulation. Journal of Power Sources 2000:495
–500.
DOI:10.1016/S0378
–7753(99)00430–9
5. Zhu Y, Tomsovic K. Development of models for ana-
lyzing the load-following performance of microtur-
bines and fuel cells. Electric Power System Research
2002;
62:1–11. DOI:10.1016/S0378–7796(02)00033–0
6. Sedghisigarchi K, Feliachi A. Dynamic and transient
analysis of power distribution systems with fuel cells
–
Part I: Fuel cell dynamic model. IEEE Transaction
on
Energy
Conversation
2004;
19(2):423–428.
DOI:10.1109/TEC.2003.822302
7. Li YH, Choi SS, Rajakaruna S. An analysis of the
control and operation of a Solid Oxide Fuel Cell power
plant in an isolated system. IEEE Transaction on Energy
Conversation
2005;
20(2):381–387. DOI:10.1109/
TEC.2005.847998
8. Goel A, Mishra S, Jha AN. Power Flow control of a
Solid Oxide Fuel Cell for grid connected operation.
International Conference on Power Electronics, Drives
and Energy Systems PEDES
’06, 2006; 1–5.
9. Wang C, Nehrir MH. A physically based dynamic model
for Solid Oxide Fuel Cells. IEEE Transaction on En-
ergy Conversion 2007;
22(4):887–897. DOI:10.1109/
TEC.2007.895468
0
100
200
300
285
290
295
300
305
310
315
320
Time (s)
0
100
200
300
285
290
295
300
305
310
315
320
SOFC stack voltage (V)
with Memory block
with Unit Delay block
Figure 20. The comparison of usage of memory and unit delay blocks.
Solid oxide fuel cell and its power applications
A. Gelen and T. Yalcinoz
Int. J. Energy Res. (2012) © 2012 John Wiley & Sons, Ltd.
DOI: 10.1002/er

10. Sedghisigarchi K, Feliachi A. Dynamic and transient
analysis of power distribution system with fuel cells
–
Part II: Control and stability enhancement. IEEE Trans-
actions on Energy Conversion 2004;
19(2):429–433.
DOI:10.1109/TEC.2003.822302
11. Li YH, Rajakaruna S, Choi SS. Control of Solid Oxide
Fuel Cell power plant in a grid connected system.
IEEE Transactions on Energy Conversion 2007;
22
(2):405
–413. DOI:10.1109/TEC.2005.853756
12. Fleming EM, Hiskens IA. Dynamics of a microgrid
supplied
by
Solid
Oxide
Fuel
Cells,
iREP
Symposium
–Bulk Power System Dynamics and
Control. 2007.
13. Steward EM, Tumilty R, Fletcher J, Lutz A, Ault G,
McDonald J. Analysis of a distributed grid-connected
fuel cell during fault conditions. IEEE Transactions
on Power Systems 2010;
25:497–505. DOI:10.1109/
TPWRS.2009.2036776
14. Ren J, Roscoe AJ, Gamble S, Burt G. Modeling a re-
versible Solid Oxide Fuel Cell to be used as a storage
device within AC power networks. 5th IET Interna-
tional Conference on Power Electronics Machines
and Drivers, 2010.
15. El-Sharkh MY et al. A dynamic model for a Stand-
Alone PEM fuel cell power plant for residential
application. Journal of Power Sources 2004:199
–204.
DOI:10.1016/j.jpowsour.2004.06.037
16. Uzunoglu M, Onar OC. Static VAr compensator
based reactive power management for SOFC power
plants. International Journal of Hydrogen Energy
2008:2367
–2378. DOI:10.1016/j.ijhydene.2008.02.050.
17. Wu XJ, Zhu ZJ, Cao GY, Tu HY. Predictive control of
SOFC based on a GA-RBF neural network model.
Journal of Power Sources 2008;
179:232–239.
DOI:10.1016/j.jpowsour.2007.12.036
18. Wu XJ, Zhu ZJ, Cao GY, Tu HY. Dynamic modeling
of SOFC based on a T-S fuzzy model. Simulation
Modeling Practice and Theory 2008;
16:494–504.
DOI:10.1016/j.simpat.2008.02.004
19. Gebregergis A, Pillay P. Implementation of fuel
cell emulation on DSP and dSPACE controllers
in the design of power electronic converters. IEEE
Transaction on Industry Applications 2010;
46(1):
285
–294. DOI:10.1109/TIA.2009.2036676
20. Yang J, Li X, Mou HG, Jian L. Control oriented
thermal management of solid oxide fuel cells on a
modi
fied Takagi-Sugeno fuzzy model. Journal of
Power Sources 2009;
188:475–482. DOI:10.1016/j.
jpowsour.2008.12.012
21. Achenbach E. Response of a solid oxide fuel cell
to load change. Journal of Power Sources 1995;
57(1–2):
105
–109. DOI:10.1016/0378–7753(95)02263–5
22. Akkaya AV. Electrochemical model for performance
analysis of a tubular SOFC. International Journal of
Energy Research 2007;
31(1):79–98. DOI:10.1002/
er.1238
23. Larminie J, Dicks A. Fuel Cell Systems Explained
(2nd edn.). Wiley: New York, 2003.
Solid oxide fuel cell and its power applications
A. Gelen and T. Yalcinoz
Int. J. Energy Res. (2012) © 2012 John Wiley & Sons, Ltd.
DOI: 10.1002/er
Wyszukiwarka
Podobne podstrony:
Tesla Internal Reforming Solid Oxide Fuel Cell Gas Turbine Combined Cycles (Irsofc Gt) Part A
System Dynamic Model for Computer Virus Prevalance
Inverter For Domestic Fuel Cell Applications
Design of a 10 kW Inverter for a Fuel Cell
Model for energy conversion in renewable energy system with hydrogen storage
Single Phase Line Frequency Commutated Voltage Source Inverter Suitable for fuel cell interfacing
Simulation for Fuel Cell Inverter using Simplorer and Simulink
Development Of High Frequency Link Direct Dc To Ac Converters For Link Direct Dc To Ac Converters Fo
58 829 845 A New Model for Fatique Failure due to Carbide Clusters
Pytania i odpowiedzi ? 9 Fuel Oil System
Evolution in Brownian space a model for the origin of the bacterial flagellum N J Mtzke
Gasoline Fuel Injection System K Jetronic
Making Electricity With a Hydrogen Fuel Cell
Gorban A N singularities of transition processes in dynamical systems qualitative theory of critica
więcej podobnych podstron