
Director’s Update Brief
Monday
25 May 2009 1100 EDT
Day 37
The Week of CDC Workforce
Internal Use Only (FIUO)---For Official Use Only (FOUO)
NOT FOR FURTHER DISTRIBUTION
-Sensitive But Unclassified (SBU) 2
Key Events
US Novel Influenza A (H1N1)
•
Novel Influenza A (H1N1) Declarations
– HHS: Downgraded to Phase 1 – Awareness (9 May 2009)
– WHO: Pandemic Phase 5 (29 Apr 1600 EDT)
– USG: Public Health Emergency declared (26 Apr 2009)
•
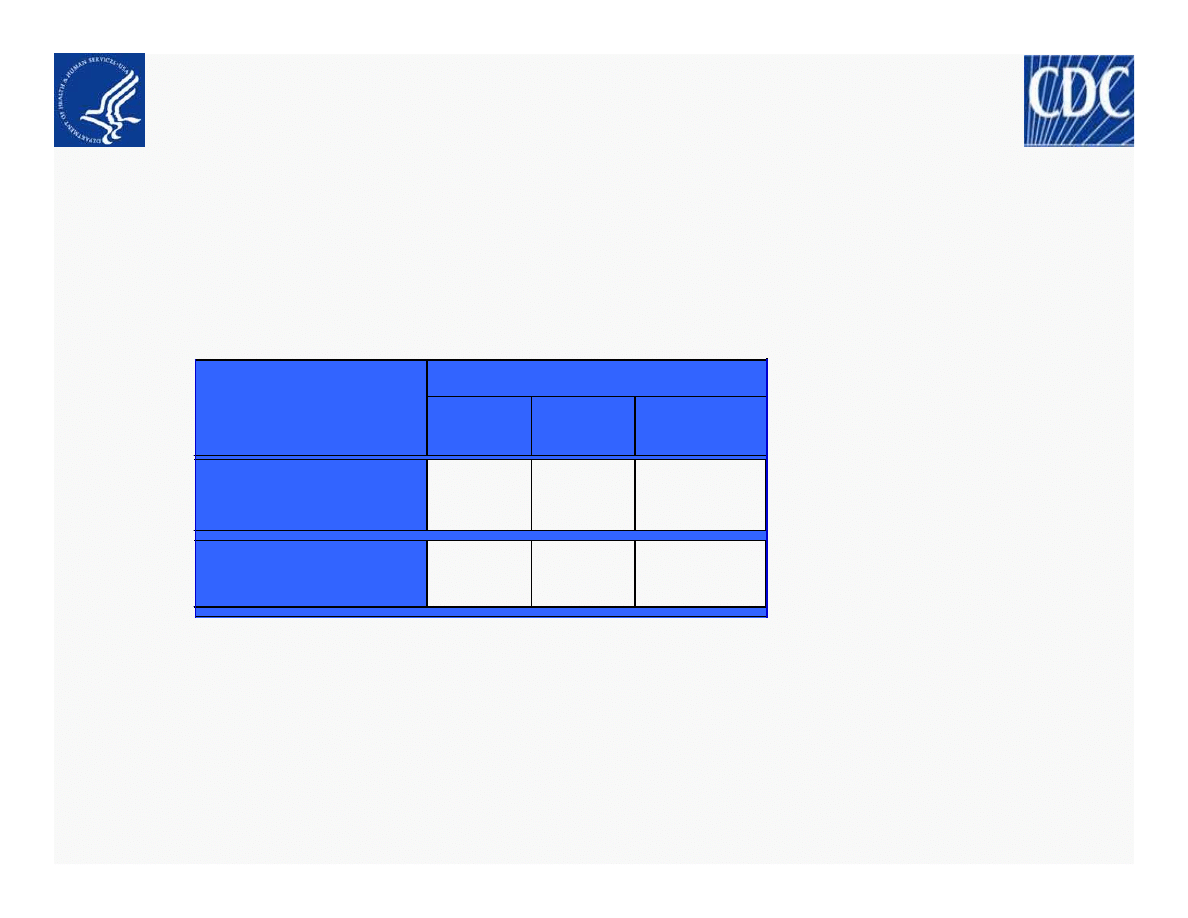
US Cases:
As of 22 May 2009 0840 EDT
•
International Cases: 12,022 in 43 Countries
– New countries with confirmed cases: Russia
•
Deployments: 26 deployed, 8 pending, 202 potential
Cases
Hosp
Deaths
6764
317
10
48
36
6
US TOTAL Cases
INCL DC
US TOTAL States
Affected INCL DC
Total Confimed and Probable
Internal Use Only (FIUO)---For Official Use Only (FOUO)
NOT FOR FURTHER DISTRIBUTION
-Sensitive But Unclassified (SBU) 3
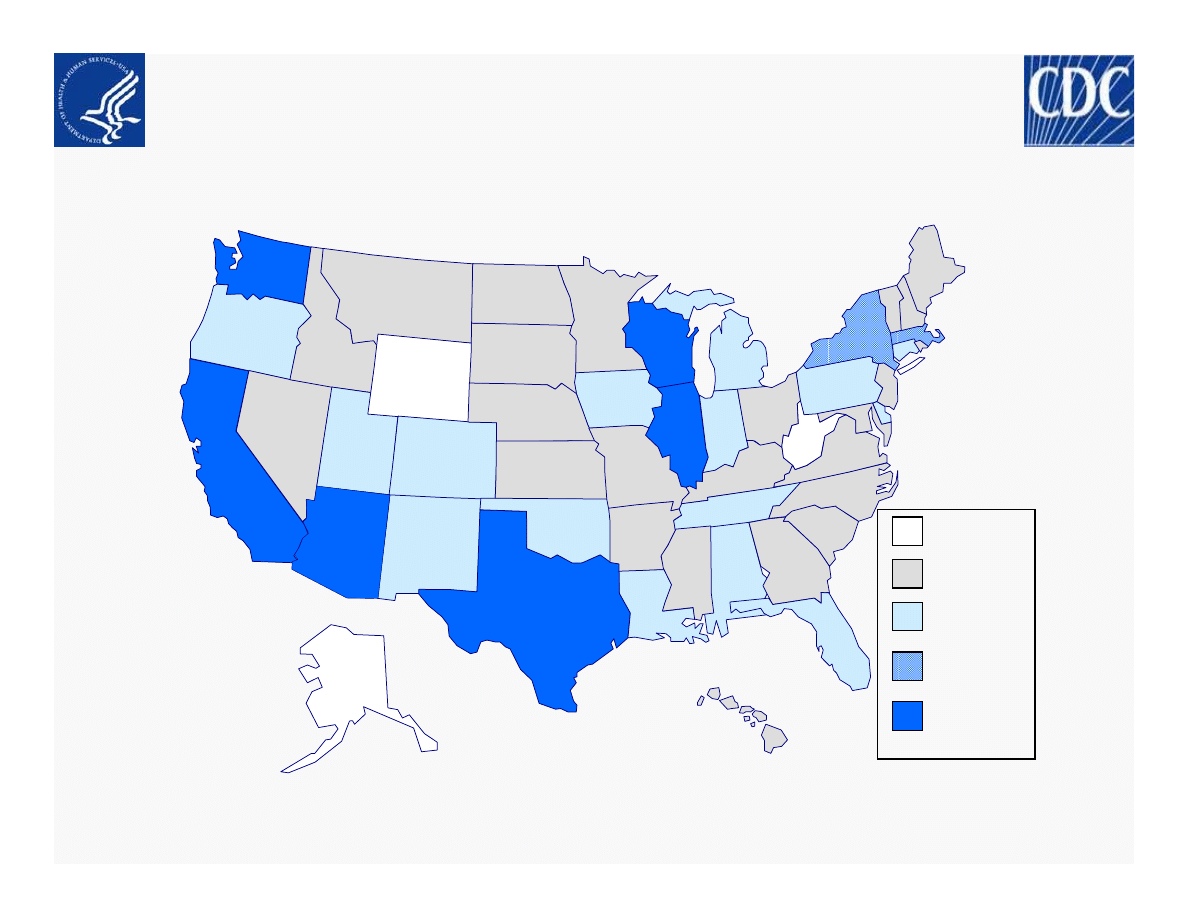
Epidemiology/Surveillance Number of Novel Influenza A (H1N1)
Cases Reported to CDC by State
As of 22 May 2009 0840 EDT (n=6,764)
200-400
51-200
1-50
0
>400
Internal Use Only (FIUO)---For Official Use Only (FOUO)
NOT FOR FURTHER DISTRIBUTION
-Sensitive But Unclassified (SBU) 4
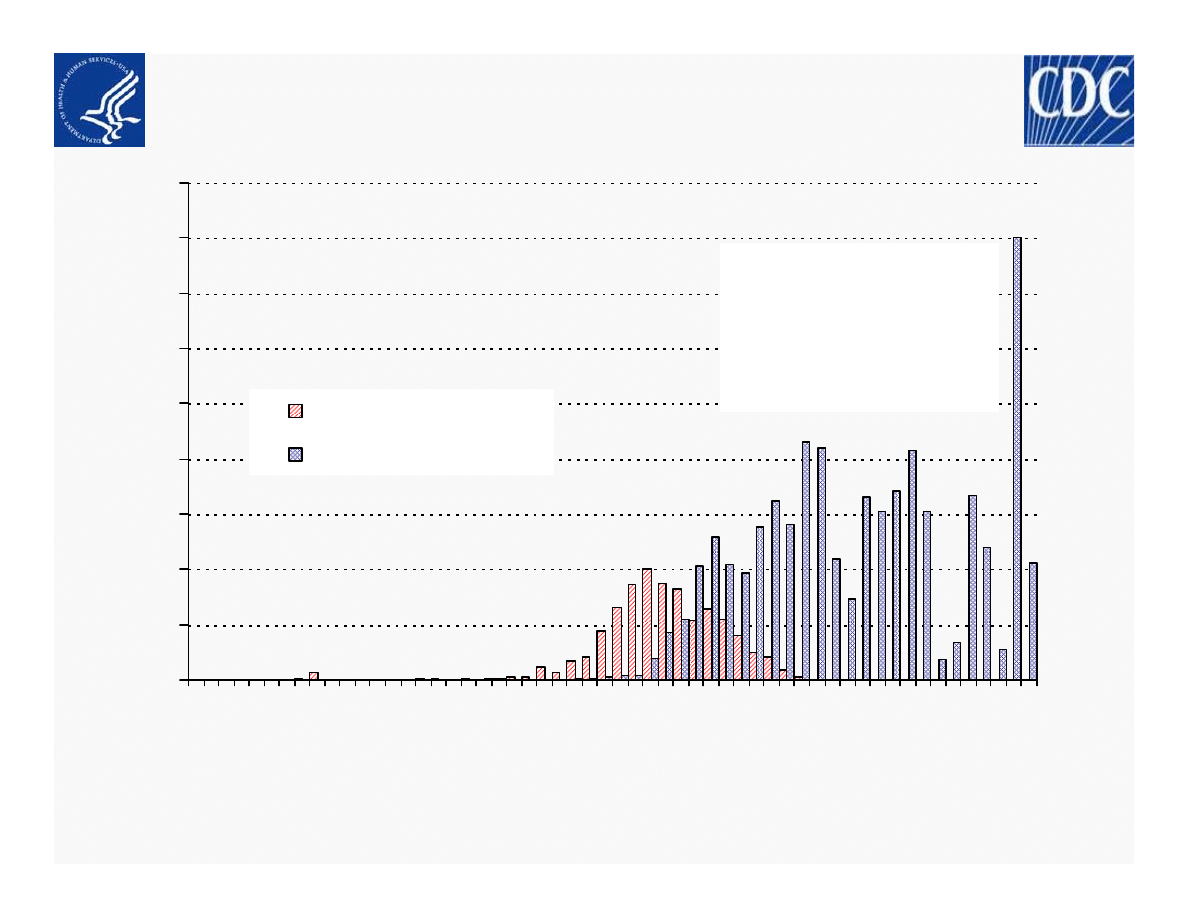
Epidemiology/Surveillance
Novel Influenza A (H1N1) - 25 May 2009 1100 EDT
Confirmed and Probable Cases by Onset* and Report Date
0
100
200
300
400
500
600
700
800
900
28
-Ma
r
30
-M
ar
1-A
pr
3-A
pr
5-A
pr
7-A
pr
9-A
pr
11
-A
pr
13
-A
pr
15
-A
pr
17
-A
pr
19
-A
pr
21
-A
pr
23
-A
pr
25
-A
pr
27
-A
pr
29
-A
pr
1-M
ay
3-M
ay
5-Ma
y
7-M
ay
9-Ma
y
11
-M
ay
13
-M
ay
15
-M
ay
17
-M
ay
19
-M
ay
21
-M
ay
Date
C
a
s
e
s
Onset Date (n=1,632)
Report Date (n=6,672)
*Information on onset date no longer presented after May 12 due to change to aggregate reporting
The large increase on 5/21
reflects a backlog of cases
from TX reported as of 8:00
5/21 and 18 hr reporting
period, vs 6.5 hrs for the
previous column.

Internal Use Only (FIUO)---For Official Use Only (FOUO)
NOT FOR FURTHER DISTRIBUTION
-Sensitive But Unclassified (SBU) 5
Epidemiology/Surveillance
Novel Influenza A (H1N1) - 25 May 2009 1100 EDT
•
WHO/NREVSS Collaborating Laboratories
– Seasonal influenza A (H1), A (H3), and B viruses co-circulated with novel
influenza A (H1N1) viruses
•
Influenza-associated Pediatric Deaths
– No new influenza-associated pediatric deaths reported. 08-09 total = 61
•
ILINet (week ending 16 May)
– % of ILI outpatient visits è the national baseline; overall trend remains
stable
•
122 Cities Mortality Reporting System (graph)
– % pneumonia and influenza deaths remains within expected
– % deaths due to pneumonia and influenza are decreasing
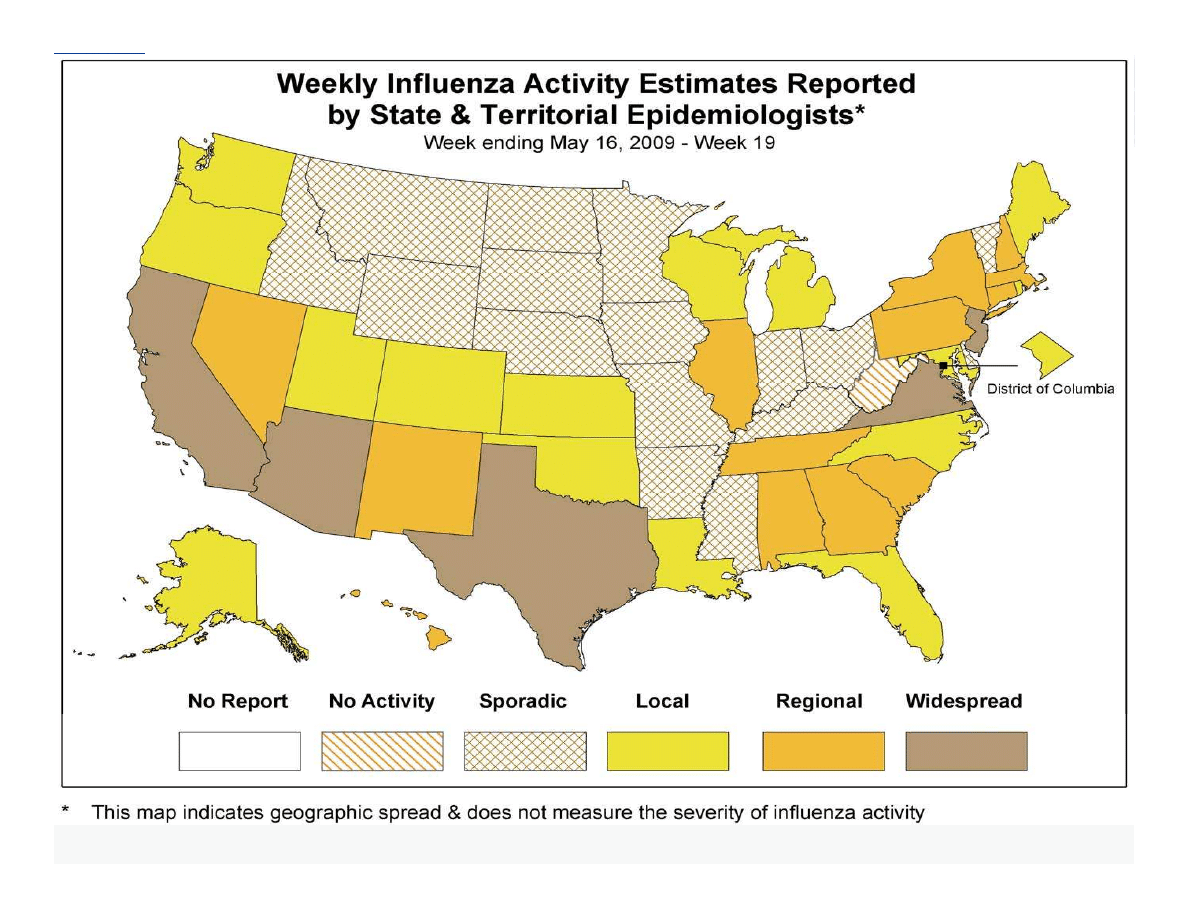
•
Geographic Spread of Influenza as Assessed by State and Territorial
Epidemiologists – state reporting
:
– Widespread: 5 states
Regional: 13 states
– Local: 15 states + DC
Sporadic: 16 states
None: 1 state
Internal Use Only (FIUO)---For Official Use Only (FOUO)
NOT FOR FURTHER DISTRIBUTION
-Sensitive But Unclassified (SBU) 6
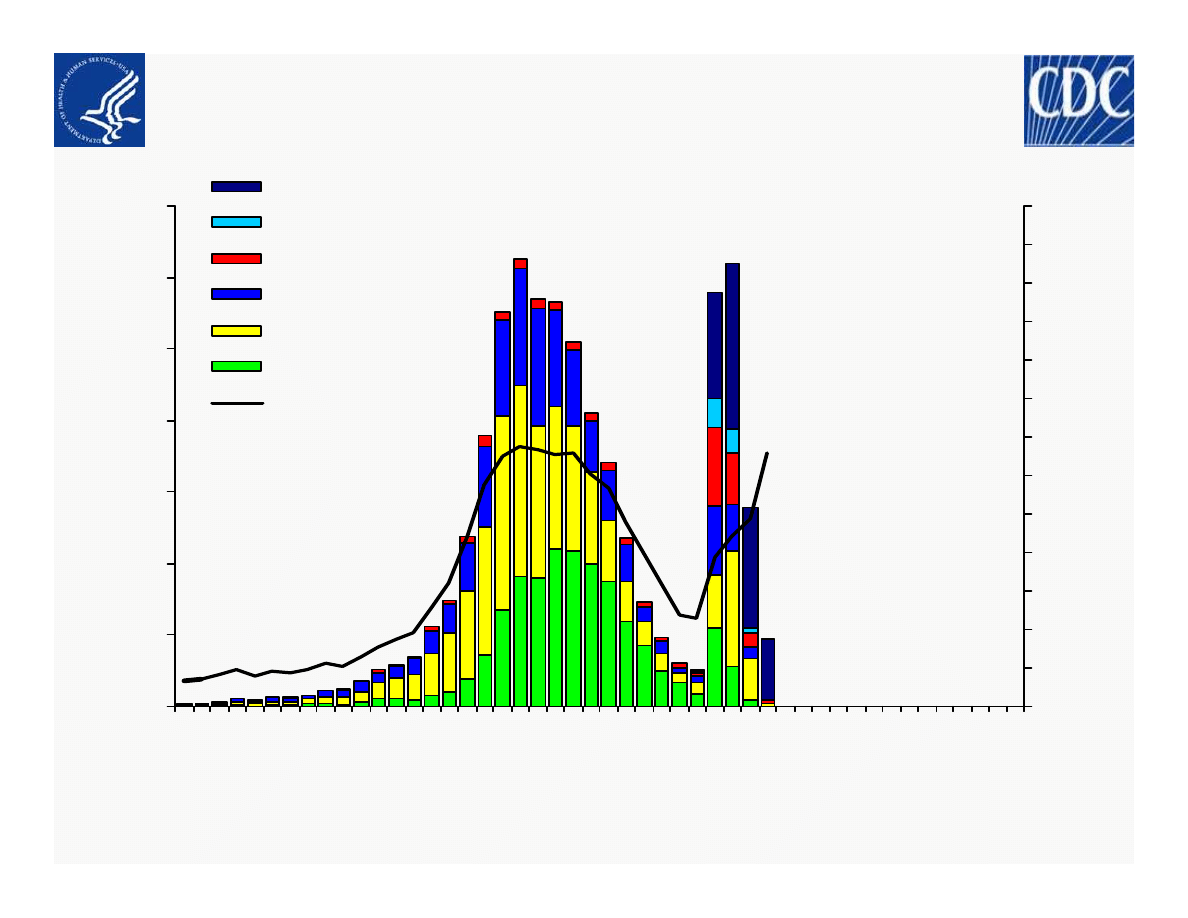
Epidemiology/Surveillance
Novel Influenza A (H1N1) - 25 May 2009 1100 EDT
U.S. WHO/NREVSS Collaborating Laboratories Summary, 2008-09
0
500
1000
1500
2000
2500
3000
3500
1
0
/4
1
0
/1
8
1
1
/1
1
1
/1
5
1
1
/2
9
1
2
/1
3
1
2
/2
7
1
/1
0
1
/2
4
2
/7
2
/2
1
3
/7
3
/2
1
4
/4
4
/1
8
5
/2
5
/1
6
5
/3
0
6
/1
3
6
/2
7
7
/1
1
7
/2
5
8
/8
8
/2
2
Week ending
N
u
m
b
e
r
o
f
Po
si
ti
ve
Sp
e
ci
m
e
n
s
-2
2
6
10
14
18
22
26
30
34
38
42
46
50
Pe
rc
e
n
t
Po
s
it
iv
e
A(H1N1-Sw ine)
A(Could not be subtyped)
A(H3)
A(H1)
A(Unknow n)
B
Percent Positive
* Percentage of all positive
influenza specimens that
are Novel Influenza
A(H1N1) or Influenza A
(unable to subtype) for the
week indicated
22 labs reporting
for current week
Internal Use Only (FIUO)---For Official Use Only (FOUO)
NOT FOR FURTHER DISTRIBUTION
-Sensitive But Unclassified (SBU) 7
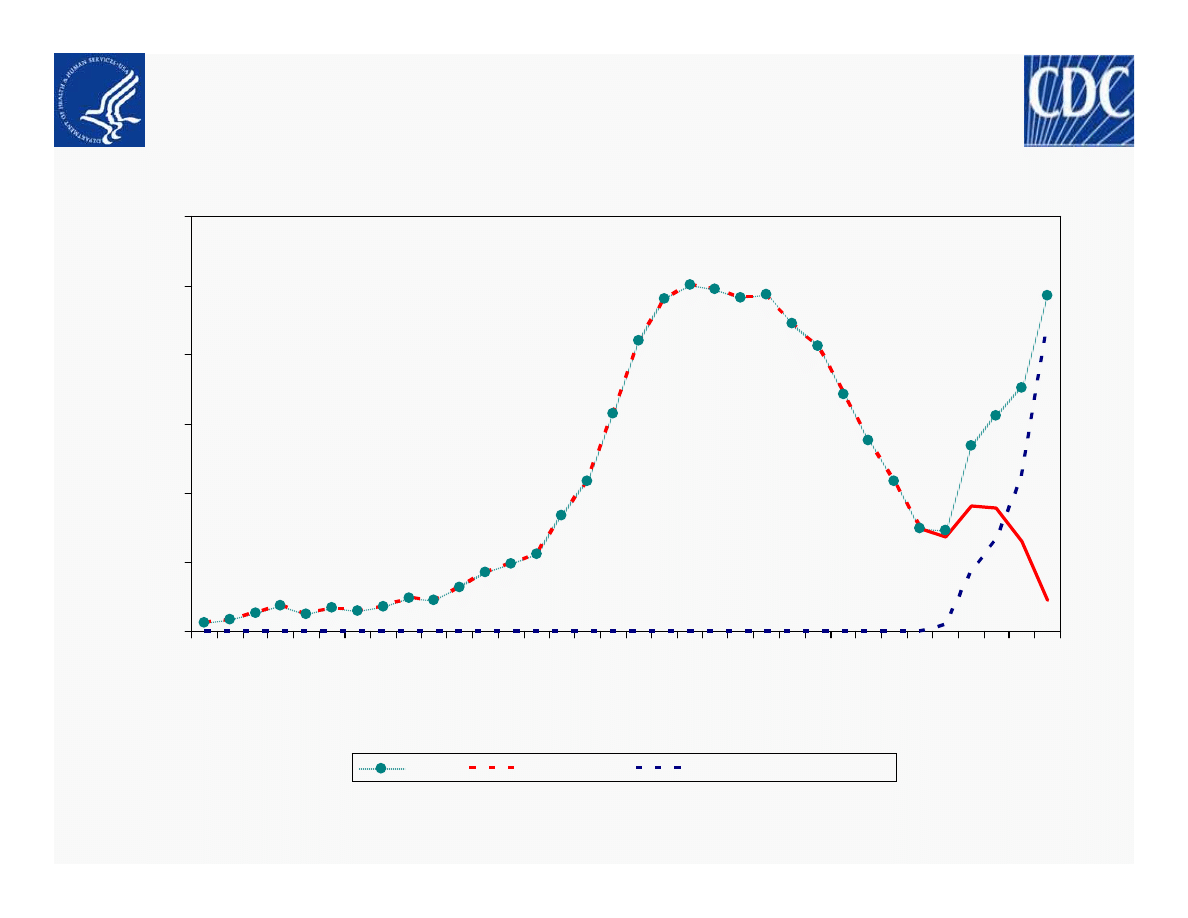
Epidemiology/Surveillance
Novel Influenza A (H1N1) - 25 May 2009 1100 EDT
Percent of Specimens Positive for Influenza Reported by WHO and NREVSS
Labs: Novel Influenza A(H1N1) vs. Seasonal Influenza, by Week
0
5
10
15
20
25
30
10
/4
10
/1
8
11
/1
11
/1
5
11
/2
9
12
/1
3
12
/2
7
1/
10
1/
24
2/
7
2/
21
3/
7
3/
21
4/
4
4/
18
5/
2
5/
16
Week Ending Date
Pe
rc
e
n
t
Po
s
it
iv
e
All Flu
Seasonal Flu
Novel Influenza A(H1N1)
Internal Use Only (FIUO)---For Official Use Only (FOUO)
NOT FOR FURTHER DISTRIBUTION
-Sensitive But Unclassified (SBU) 8
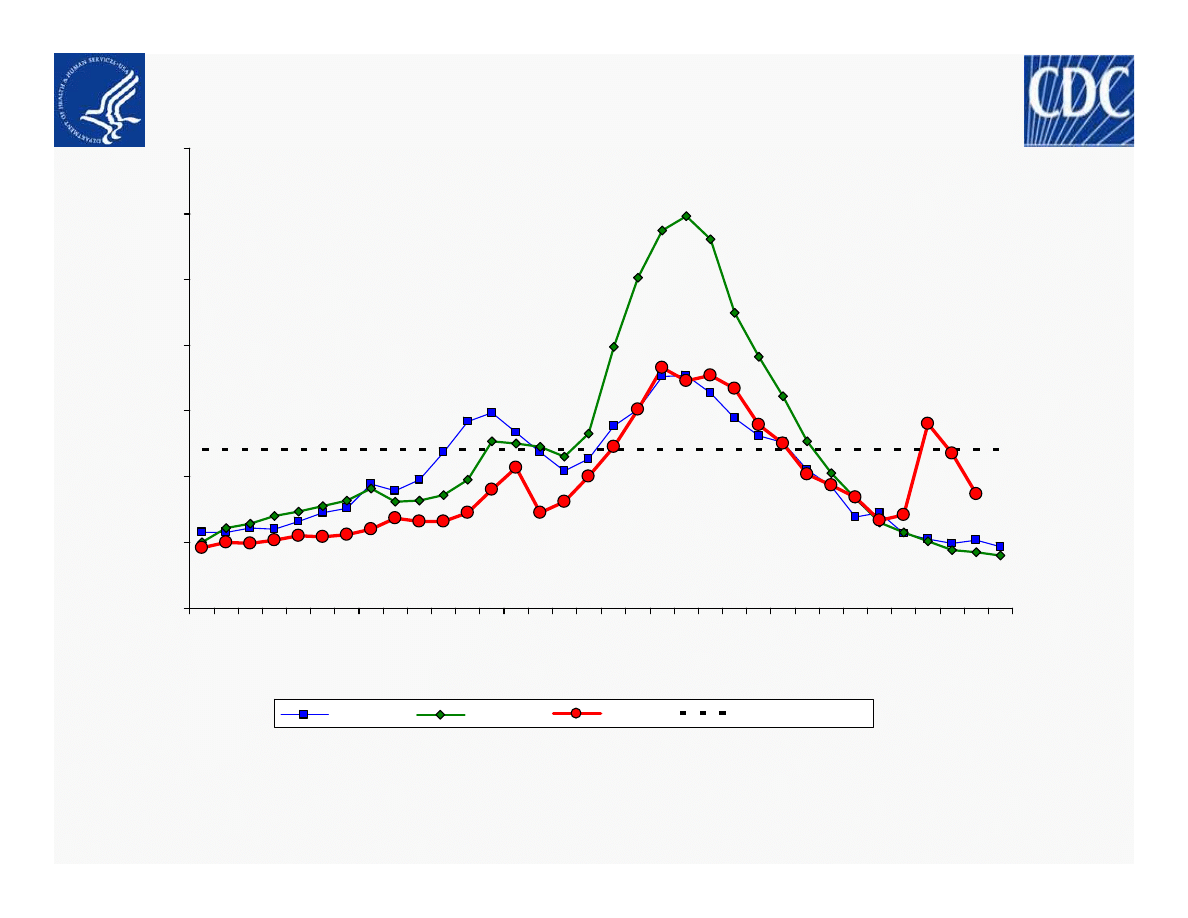
Epidemiology/Surveillance
Novel Influenza A (H1N1) - 25 May 2009 0100 EDT
Percentage of Visits for Influenza-like Illness (ILI) Reported by
the US Outpatient Influenza-like Illness Surveillance Network (ILINet),
National Summary 2008-09 and Previous Two Seasons
NOTE: Week ending dates vary by influenza season
*Preliminary ILI data for week 19, as of May 22, 2009 (n=950 weekly ILI reports received from 49 states)
†
There was no week 53 during the 2006-07 and 2007-08 seasons, therefore the week 53 data point for those seasons is an average of weeks 52 and 1.
0
1
2
3
4
5
6
7
10
/4
10
/1
8
11
/1
11
/1
5
11
/2
9
12
/1
3
12
/2
7
1/
10
1/
24
2/
7
2/
21
3/
7
3/
21
4/
4
4/
18
5/
2
5/
16
Week Ending Dates
%
o
f
V
is
it
s
f
o
r
IL
I
2006-07†
2007-08†
2008-09
National Baseline
Internal Use Only (FIUO)---For Official Use Only (FOUO)
NOT FOR FURTHER DISTRIBUTION
-Sensitive But Unclassified (SBU) 9
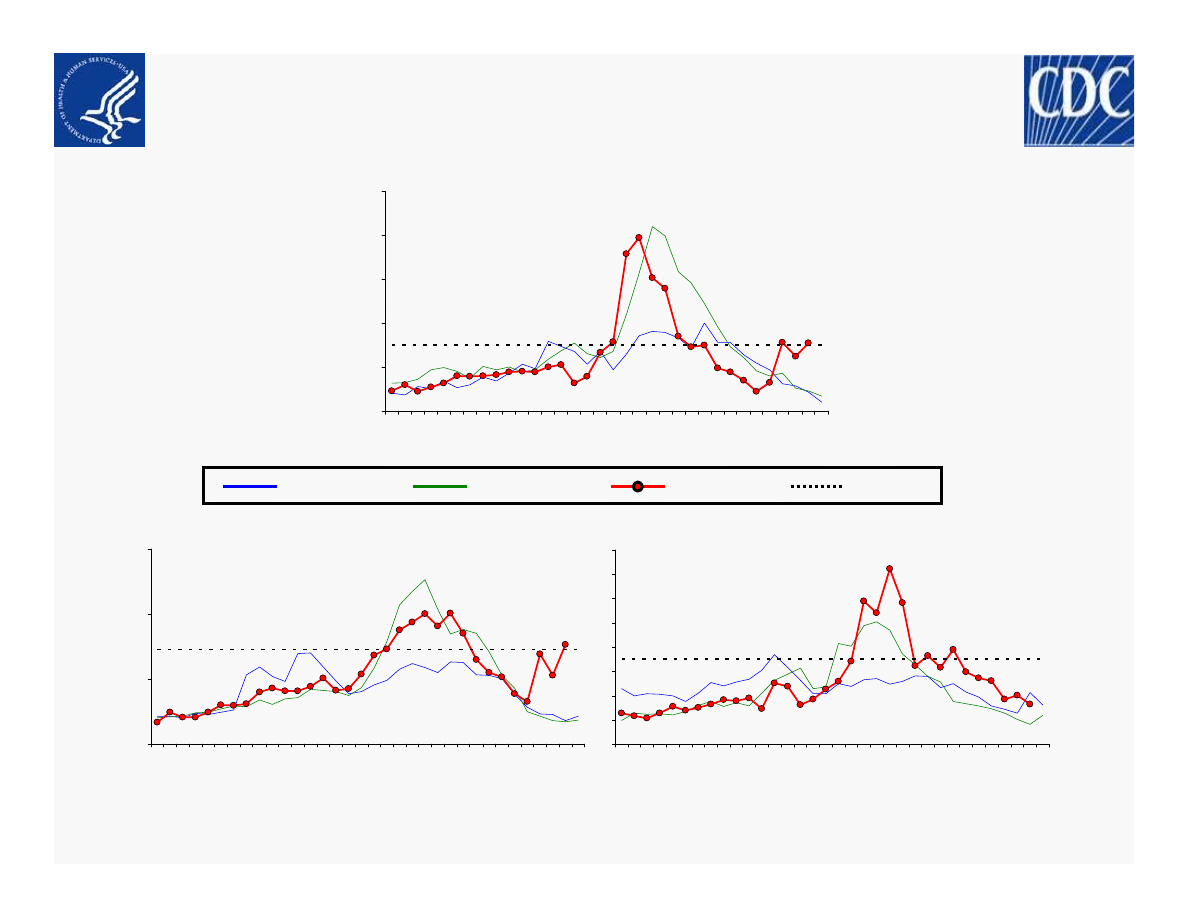
Epidemiology/Surveillance
Novel Influenza A (H1N1) - 25 May 2009 1100 EDT
Current Influenza Surveillance – ILINet Regions I-III
Region II - NJ, NY
0
2
4
6
10
/4
10
/1
8
11
/1
11
/1
5
11
/2
9
12
/1
3
12
/2
7
1/
10
1/
24
2/
7
2/
21
3/
7
3/
21
4/
4
4/
18
5/
2
5/
16
Week Ending Dates
%
o
f
V
is
it
s
f
o
r
IL
I
Region III - DE, DC, MD, PA, VA, WV
0
1
2
3
4
5
6
7
8
10
/4
10
/1
8
11
/1
11
/1
5
11
/2
9
12
/1
3
12
/2
7
1/
10
1/
24
2/
7
2/
21
3/
7
3/
21
4/
4
4/
18
5/
2
5/
16
Week Ending Dates
%
o
f
V
is
it
s
f
o
r
IL
I
Region I - CT, ME, MA, NH, RI, VT
0
1
2
3
4
5
10
/4
10
/1
8
11
/1
11
/1
5
11
/2
9
12
/1
3
12
/2
7
1/
10
1/
24
2/
7
2/
21
3/
7
3/
21
4/
4
4/
18
5/
2
5/
16
Week Ending Dates
%
o
f
V
is
it
s
f
o
r
IL
I
NOTE: Scales differ between regions
NOTE: There was no week 53 during the 2006-07 and 2007-08 seasons, therefore the week 53 data point for those seasons is an average of weeks 52 and 1.
2006-07
2007-08
2008-09
Baseline
Internal Use Only (FIUO)---For Official Use Only (FOUO)
NOT FOR FURTHER DISTRIBUTION
-Sensitive But Unclassified (SBU) 10
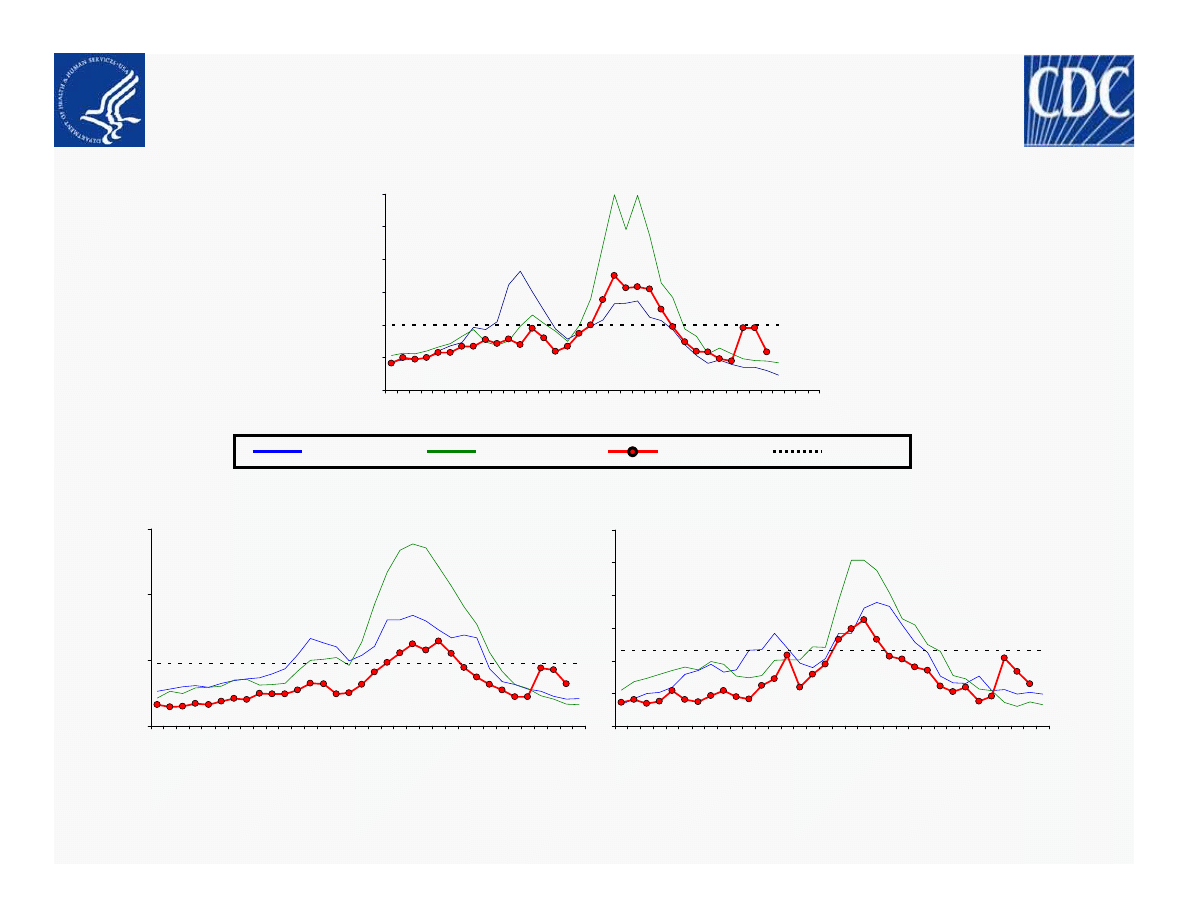
Epidemiology/Surveillance
Novel Influenza A (H1N1) - 25 May 2009 1100 EDT
Current Influenza Surveillance – ILINet Regions IV-VI
Region IV - AL, FL, GA, KY, MS, NC, SC, TN
0
1
2
3
4
5
6
10
/4
10
/1
8
11
/1
11
/1
5
11
/2
9
12
/1
3
12
/2
7
1/
10
1/
24
2/
7
2/
21
3/
7
3/
21
4/
4
4/
18
5/
2
5/
16
Week Ending Dates
%
o
f
V
is
it
s
f
o
r
IL
I
Region V - IL, IN, MI, MN, OH, WI
0
2
4
6
10
/4
10
/1
8
11
/1
11
/1
5
11
/2
9
12
/1
3
12
/2
7
1/
10
1/
24
2/
7
2/
21
3/
7
3/
21
4/
4
4/
18
5/
2
5/
16
Week Ending Dates
%
o
f
V
is
it
s
f
o
r
IL
I
Region VI - AR, LA, NM, OK, TX
0
2
4
6
8
10
12
10
/4
10
/1
8
11
/1
11
/1
5
11
/2
9
12
/1
3
12
/2
7
1/
10
1/
24
2/
7
2/
21
3/
7
3/
21
4/
4
4/
18
5/
2
5/
16
Week Ending Dates
%
o
f
V
is
it
s
f
o
r
IL
I
NOTE: Scales differ between regions
NOTE: There was no week 53 during the 2006-07 and 2007-08 seasons, therefore the week 53 data point for those seasons is an average of weeks 52 and 1.
2006-07
2007-08
2008-09
Baseline
Internal Use Only (FIUO)---For Official Use Only (FOUO)
NOT FOR FURTHER DISTRIBUTION
-Sensitive But Unclassified (SBU) 11
Epidemiology/Surveillance
Novel Influenza A (H1N1) - 25 May 2009 1100 EDT
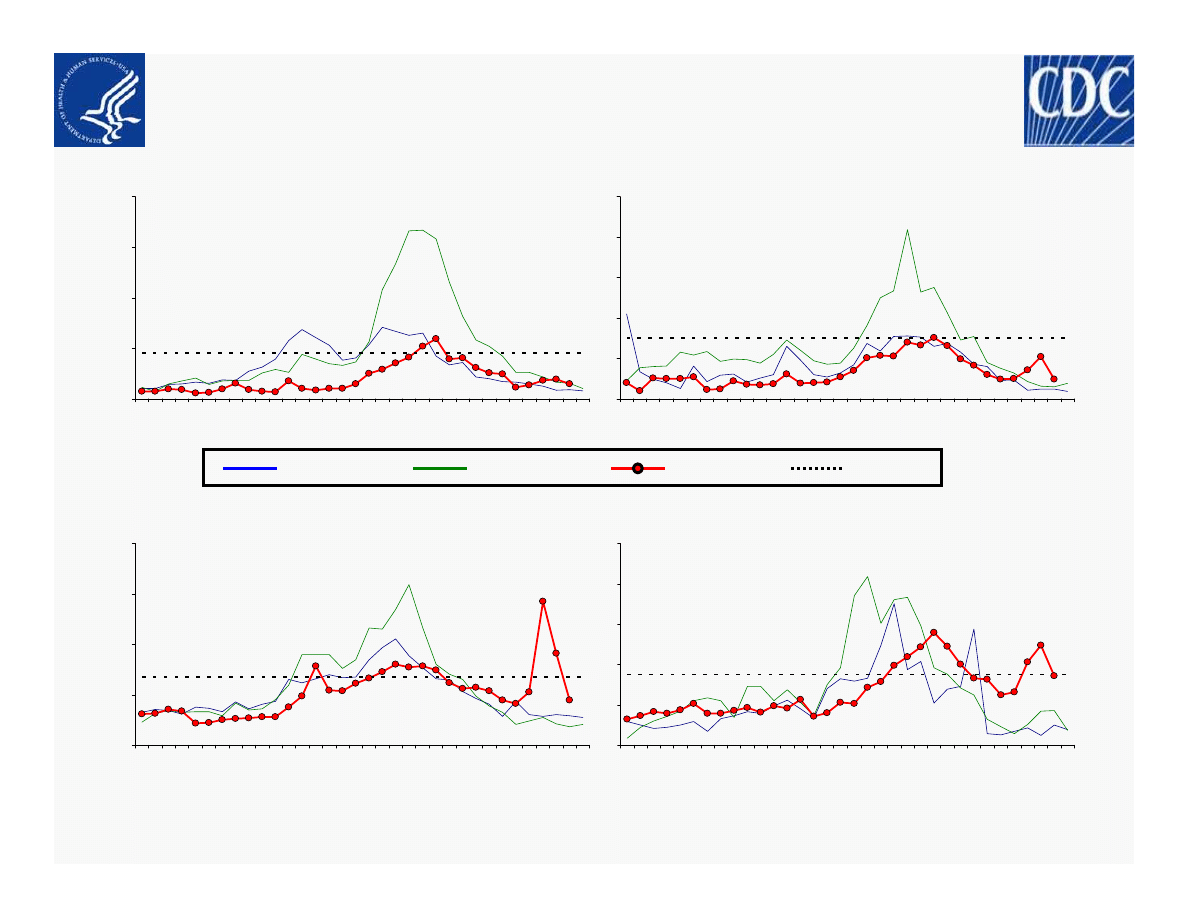
Current Influenza Surveillance – ILINet Regions VII-X
Region X - AK, ID, OR, W A
0
2
4
6
8
10
10
/4
10
/1
8
11
/1
11
/1
5
11
/2
9
12
/1
3
12
/2
7
1/
10
1/
24
2/
7
2/
21
3/
7
3/
21
4/
4
4/
18
5/
2
5/
16
Week Ending Dates
%
o
f
V
is
it
s
f
o
r
IL
I
Region IX - AZ, CA, HI, NV
0
2
4
6
8
10
/4
10
/1
8
11
/1
11
/1
5
11
/2
9
12
/1
3
12
/2
7
1/
10
1/
24
2/
7
2/
21
3/
7
3/
21
4/
4
4/
18
5/
2
5/
16
Week Ending Dates
%
o
f
V
is
it
s
f
o
r
IL
I
Region VIII - CO, MT, ND, SD, UT, W Y
0
1
2
3
4
5
10
/4
10
/1
8
11
/1
11
/1
5
11
/2
9
12
/1
3
12
/2
7
1/
10
1/
24
2/
7
2/
21
3/
7
3/
21
4/
4
4/
18
5/
2
5/
16
Week Ending Dates
%
o
f
V
is
it
s
f
o
r
IL
I
Region VII - IA, KS, MO, NE
0
2
4
6
8
10
/4
10
/1
8
11
/1
11
/1
5
11
/2
9
12
/1
3
12
/2
7
1/
10
1/
24
2/
7
2/
21
3/
7
3/
21
4/
4
4/
18
5/
2
5/
16
Week Ending Dates
%
o
f
V
is
it
s
f
o
r
IL
I
NOTE: Scales differ between regions
NOTE: There was no week 53 during the 2006-07 and 2007-08 seasons, therefore the week 53 data point for those seasons is an average of weeks 52 and 1.
2006-07
2007-08
2008-09
Baseline
Internal Use Only (FIUO)---For Official Use Only (FOUO)
NOT FOR FURTHER DISTRIBUTION
-Sensitive But Unclassified (SBU) 13
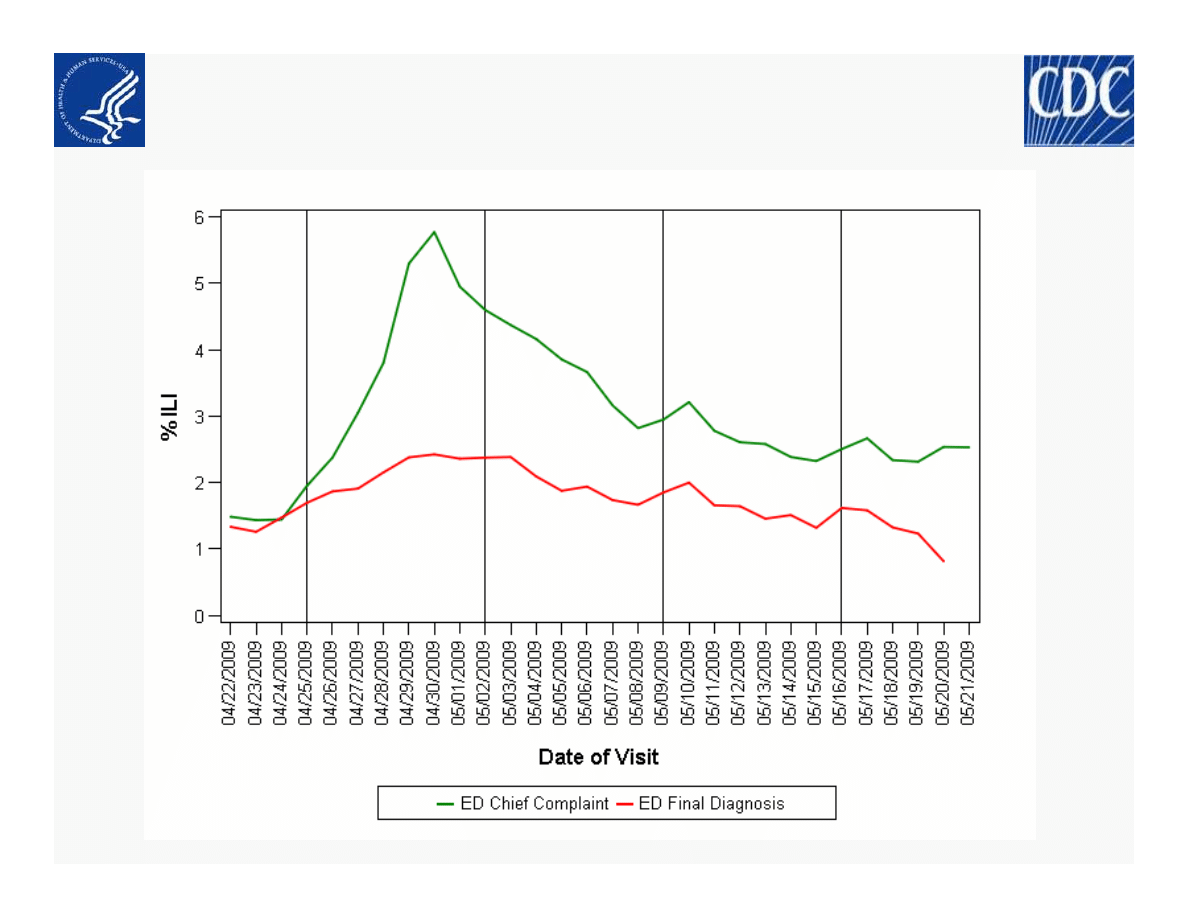
BioSense
Percentage of Emergency Department (ED) Chief Complaint Visits for ILI and ED
Final Diagnosis Visits with ICD-9-CM codes for Influenza or ILI. U.S.
04/22/2009 to 05/21/2009
Internal Use Only (FIUO)---For Official Use Only (FOUO)
NOT FOR FURTHER DISTRIBUTION
-Sensitive But Unclassified (SBU) 14
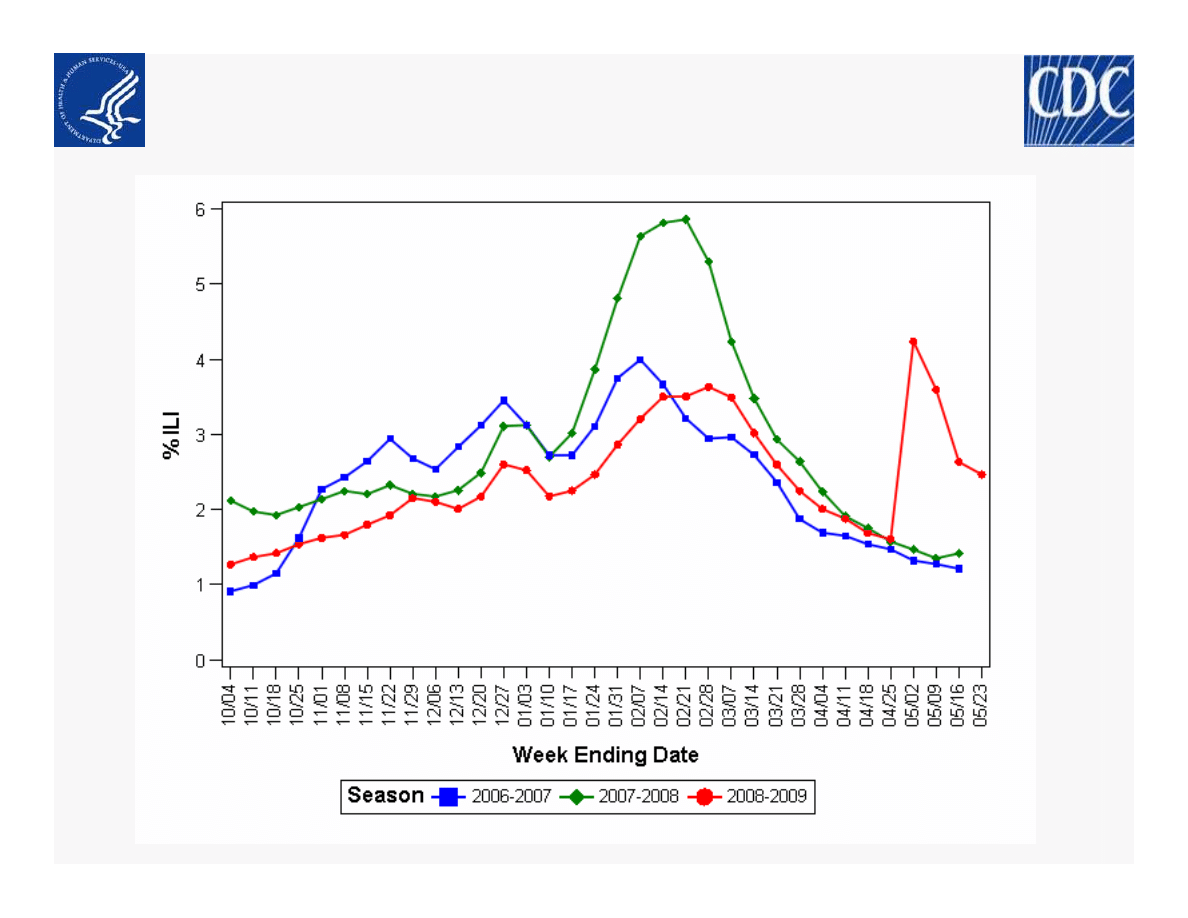
* Note: Week ending 05/23/2009 includes data from 05/17/2009 to 05/21/2009 only
BioSense
Percentage Emergency Department Visits for
Patient-reported ILI, Weekly Trends. U.S.
10/07/2006 to 05/23/2009*
Internal Use Only (FIUO)---For Official Use Only (FOUO)
NOT FOR FURTHER DISTRIBUTION
-Sensitive But Unclassified (SBU) 15
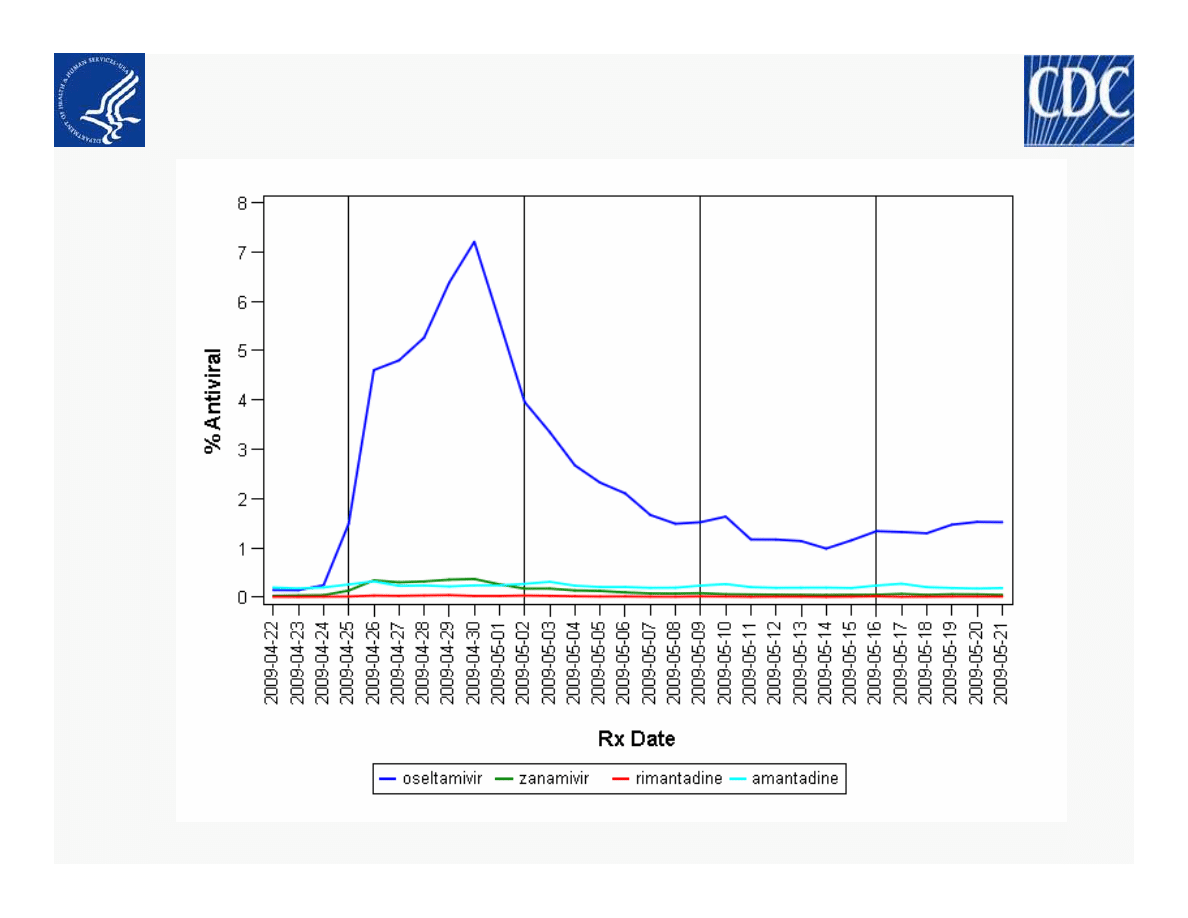
BioSense Pharmacies
Percentage of Anti-infective Prescriptions for Antivirals, U.S.
04/22/2009 to 05/21/2009
:

Internal Use Only (FIUO)---For Official Use Only (FOUO)
NOT FOR FURTHER DISTRIBUTION
-Sensitive But Unclassified (SBU) 16
International
Novel Influenza A (H1N1) - 25 May 2009
•
WHO global case count: 12,022 confirmed cases in 43 countries*
– New countries with confirmed cases: Russia
– Countries with highest confirmed case count after the US and
Mexico:
• Canada: 719 (=)
• Japan: 321 ( 27 in last 72 hours)
• Spain: 126 ( 13 in last 72 hours)
• UK: 117 ( 5 in last 72 hours)
*Note: WHO case counts are current as of 05/24/09, 10:00 pm EDT

Internal Use Only (FIUO)---For Official Use Only (FOUO)
NOT FOR FURTHER DISTRIBUTION
-Sensitive But Unclassified (SBU) 17
Division of Global Migration and Quarantine
Novel Influenza A (H1N1) - 25 May 2009
School Dismissal, United States, 4/29 – 5/22, 2009
•
School Dismissal
– 78 schools closed due to H1N1 in 7 states (as of 12 noon, 22
May 2009):
• Increase from 60 schools on 21 May
• AZ, MA (12), MI, NJ, NY (47), TX, and WI.
– Closures impacted 49,893 (increase from 42,052 on 21 May)
– Closures appear to be in response to high absenteeism
Internal Use Only (FIUO)---For Official Use Only (FOUO)
NOT FOR FURTHER DISTRIBUTION
-Sensitive But Unclassified (SBU) 18
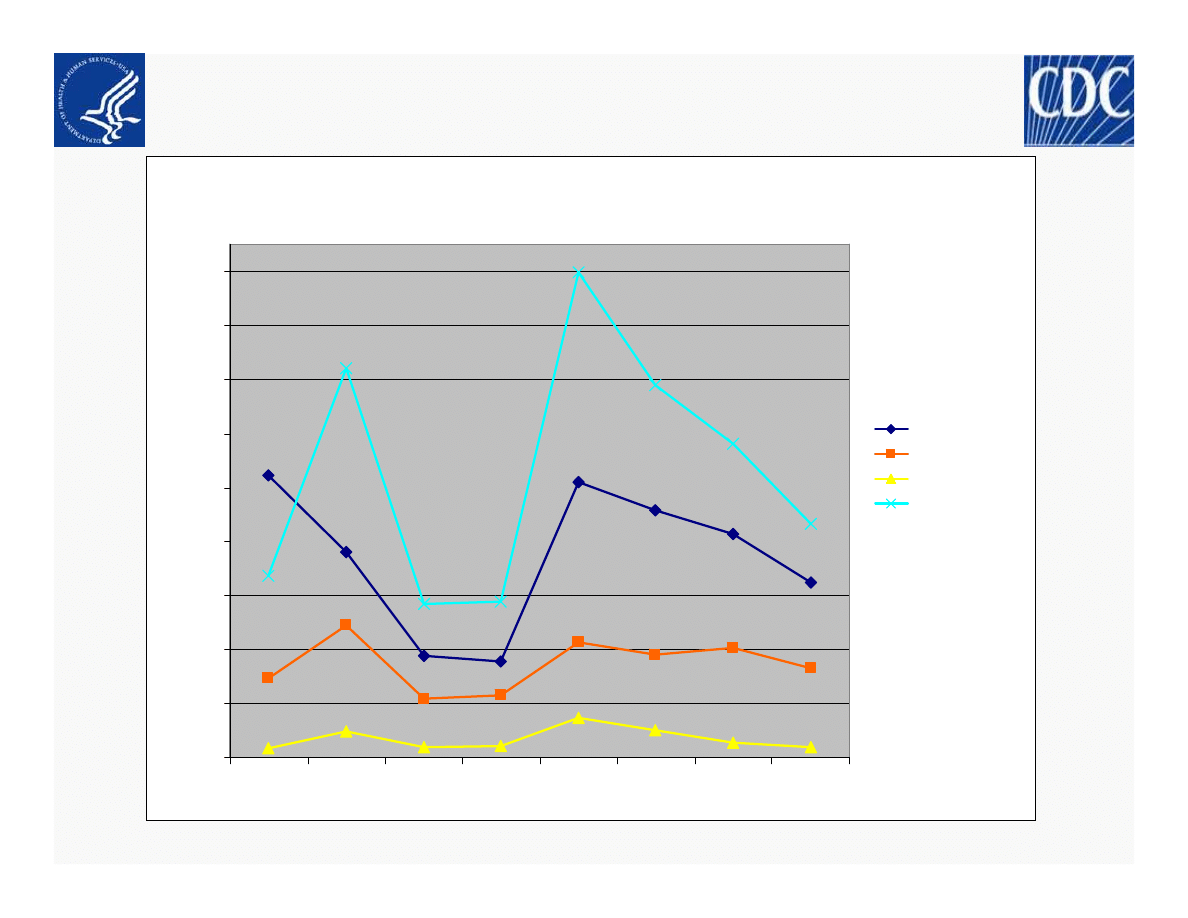
Communications Summary
Novel Influenza A (H1N1) – 25 MAY 2009
H1N1 Communication Channel Activity
0
100
200
300
400
500
600
700
800
900
5/14
5/15
5/16
5/17
5/18
5/19
5/20
5/21
CDCINFO public
Print/Internet
National TV
Local TV
Internal Use Only (FIUO)---For Official Use Only (FOUO)
NOT FOR FURTHER DISTRIBUTION
-Sensitive But Unclassified (SBU) 19
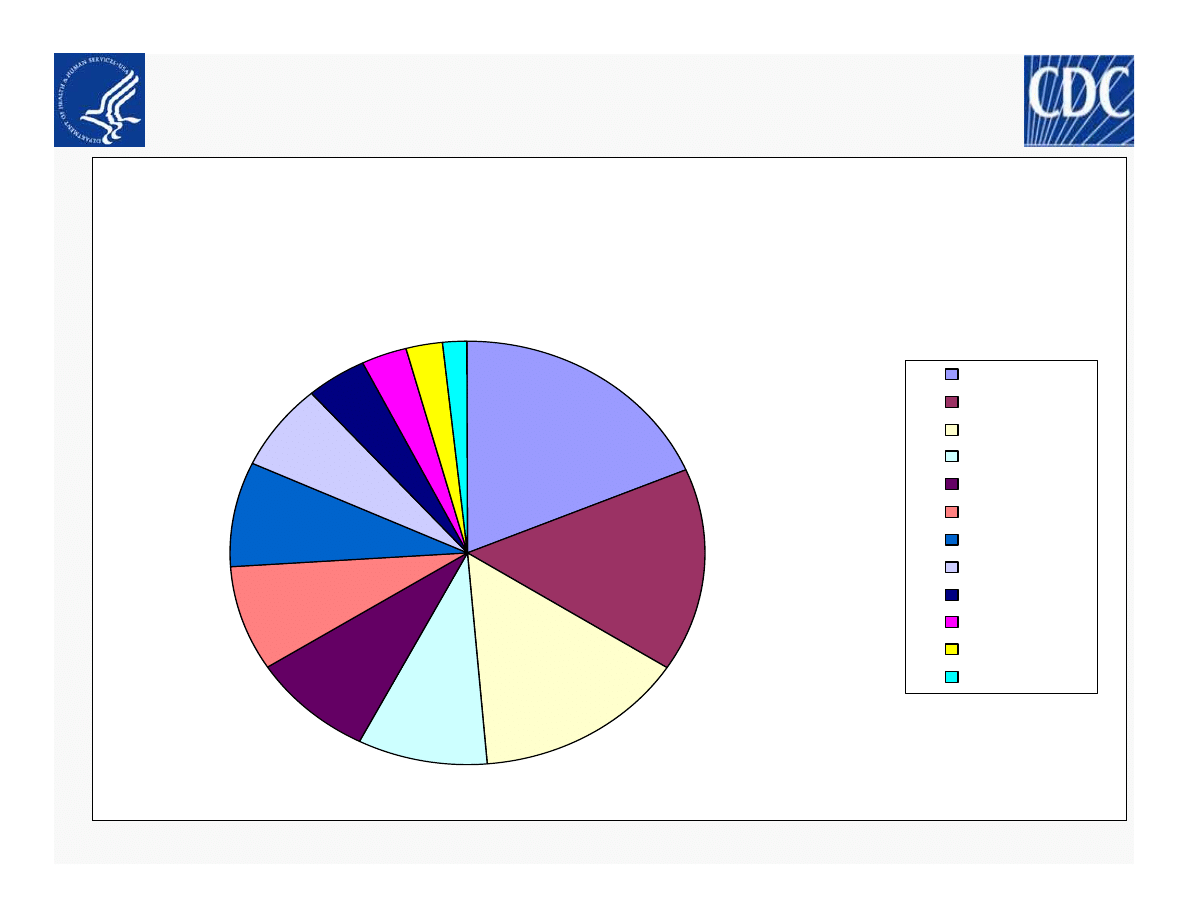
Communications Summary
Novel Influenza A (H1N1) – 25 MAY 2009
CDCINFO General Public Questions by Category
5/11-5/22
18.7%
15.4%
14.5%
8.9%
8.3%
8.2%
8.0%
6.6%
4.1%
3.1%
2.4% 1.8%
symptoms
travel
testing
transmission
mitigation
cases
prevention
treatment
general
severity
reporting
vaccines
Wyszukiwarka
Podobne podstrony:
us cdc swine flu 26 may 2009
us cdc swine flu 12 may 2009
us cdc swine flu 11 may 2009
us cdc swine flu 19 may 2009
us cdc swine flu 18 may 2009
us cdc swine flu 20 may 2009
us cdc swine flu 27 may 2009
us cdc swine flu 5 jun 2009
us cdc swine flu 9 jun 2009
us dia swine flu 2009
minnesota mls swine flu testing 2009
LOGIKA 25, Logika, 25.10.2009
25 11 2009 12 10 02 0173 001
25 11 2009
histologia 25.05.2009, kosmetologia licencjat
25 11 2009 12 14 17 0175 001
egzamin 25 06 2009
25 11 2009 12 09 19 0172 001
więcej podobnych podstron