
1 3
DOI 10.1007/s10337-014-2633-9
Chromatographia
ORIGINAL
Robust UHPLC Separation Method Development for Multi-API
Product Amlodipine and Bisoprolol: The Impact of Column
Selection
Róbert Kormány · Imre Molnár · Jeno˝ Fekete ·
Davy Guillarme · Szabolcs Fekete
Received: 26 September 2013 / Revised: 9 January 2014 / Accepted: 20 January 2014
© Springer-Verlag Berlin Heidelberg 2014
related to amlodipine and bisoprolol within 7 min, ensuring
baseline resolution between all peak-pairs.
Keywords UHPLC · Method development ·
Quality by design (QbD) · DryLab · Amlodipine ·
Bisoprolol
Introduction
When dealing with reversed-phase liquid chromatographic
(RPLC) method development, computer modeling pro-
grams can be employed to improve the analysis throughput
as well as maximize information about method selectivity.
The most successful and widespread modeling program
(DryLab, Molnar-Institute, Berlin, Germany) optimizes
the Design Space mainly by measuring and visualiz-
ing the effects of mobile phase conditions: gradient time
and shape, pH, ionic strength, ternary eluent composi-
tion, additive concentrations, or temperature [
]. For this
purpose, the program suggests a relatively well-defined
number of experiments on a particular stationary phase;
furthermore it can predict the separation inside the Design
Space, based on changes in the mobile phase composition,
mode of elution (either isocratic or gradient), temperature,
pH or column parameters such as column length, internal
diameter, particle size, and flow-rate [
]. The retention
mechanism in RPLC can be explained by the solvophobic
theory that gives a guidance for planning the experiments
for RPLC method development and optimization [
]. The
theory describes the effects on the chromatographic behav-
ior of components, when varying different parameters.
DryLab chromatographic optimization software is mostly
based on this theory [
], and its three-dimensional (3D)
application helps to understand the peak movements and
Abstract This paper describes a new and fast ultra-high
pressure liquid chromatographic separation of amlodipine
and bisoprolol and all their closely related compounds, for
impurity profiling purposes. Computer-assisted method
development was applied and the impact of several state-of-
the-art stationary phase column chemistries (50 × 2.1 mm,
sub-2 μm, and core–shell type materials) on the achiev-
able selectivity and resolution was investigated. The work
was performed according to quality by design principles
using design of experiment with three experimental factors;
namely the gradient time (t
G
), temperature (T), and mobile
phase pH. Thanks to modeling software, it was proved that
the separation of all compounds was feasible on numerous
column chemistries within <10 min, by proper adjustments
of variables. It was also demonstrated that the reliability of
predictions was good, as the predicted retention times and
resolutions were in good agreement with the experimen-
tal ones. The final, optimized method separates 16 peaks
Published in the special paper collection 9th Balaton Symposium
on High-Performance Separations Methods
with guest editor
Attila Felinger.
R. Kormány (*)
Egis Pharmaceuticals Plc, Budapest, Hungary
e-mail: rkormany@gmail.com
I. Molnár
Molnár-Institute for Applied Chromatography, Berlin, Germany
J. Fekete
Budapest University of Technology and Economics,
Budapest, Hungary
D. Guillarme · S. Fekete
University of Geneva, Analytical Pharmaceutical Chemistry,
Geneva, Switzerland

R. Kormány et al.
1 3
the selectivity or resolution changes within the Design
Space [
,
].
Searching for alternative columns, while keeping the
quality of a given separation is always one of the key pur-
poses of method robustness testing, but finding the alterna-
tive column for a given separation (column interchange-
ability) is often complicated. Generally, the method is
developed using one given column and then, an alternative
column can be considered during the validation procedure
under the optimized conditions. Since the alternative col-
umn probably has not the same working point (optimal
conditions in a robust zone) as the primary column, this
“trial and error” like approach often fails at the end of
method development. Column databases could be helpful
for selecting an alternative column but common station-
ary phase tests are not always able to predict certain col-
umn similarity for particular separations. Numerous papers
dealing with stationary phase characterization procedures,
developed by Snyder, Dolan, Tanaka, Euerby, and Peters-
son are available and could be helpful for users, in find-
ing a similar column during the method development and
validation [
]. One of our previous work illustrated that
the baseline separation of amlodipine impurities was fea-
sible on nine different 50 × 2.1 mm columns packed with
sub-2 μm fully porous and core–shell particles [
]. In that
work, the authors compared the selectivity and achievable
analysis time when selecting the condition that ensures the
highest possible resolution. Another recent study showed
that if column was not directly interchangeable, it was still
possible to achieve very similar separations by adjusting
the chromatographic conditions [
]. The study suggested
that the evaluation of column interchangeability should be
a part of early stage method development and not of the
method validation.
In this current study, our aim was to develop a fast and
robust ultra-high pressure liquid chromatographic (UHPLC)
method for the separation of amlodipine and bisoprolol-
related impurities. Amlodipine is a long-acting calcium
channel blocker dihydropyridine and acts by relaxing the
smooth muscle in the arterial wall, decreasing total periph-
eral resistance, thereby reducing blood pressure. Bisoprolol
belongs to the group of beta-blockers and is used primar-
ily in cardiovascular diseases. The combination of these two
active drugs is applied for the treatment of chronic stable
angina pectoris and hypertension. Previous works described
the spectrophotometric and conventional high-performance
liquid chromatographic determination of amlodipine and
bisoprolol from pharmaceutical preparations and plasma
[
–
]. To the best of our knowledge, no UHPLC separa-
tion of all the related impurities was reported up to now.
In this study, a novel and fast UHPLC impurity profiling
method is reported for amlodipine and bisoprolol combined
active pharmaceutical ingredients (API), and the benefits
of computer-assisted method development is discussed.
Moreover, the impact of RP stationary phase selection on
the selectivity is studied and reported in details.
Experimental
Chemicals
Acetonitrile (gradient grade), phosphoric acid, and natrium
dihydrogen phosphate were purchased from Merck (Darm-
stadt, Germany). For the measurements, water was pre-
pared freshly using ELGA Purelab UHQ water (ELGA,
Lane End, UK).
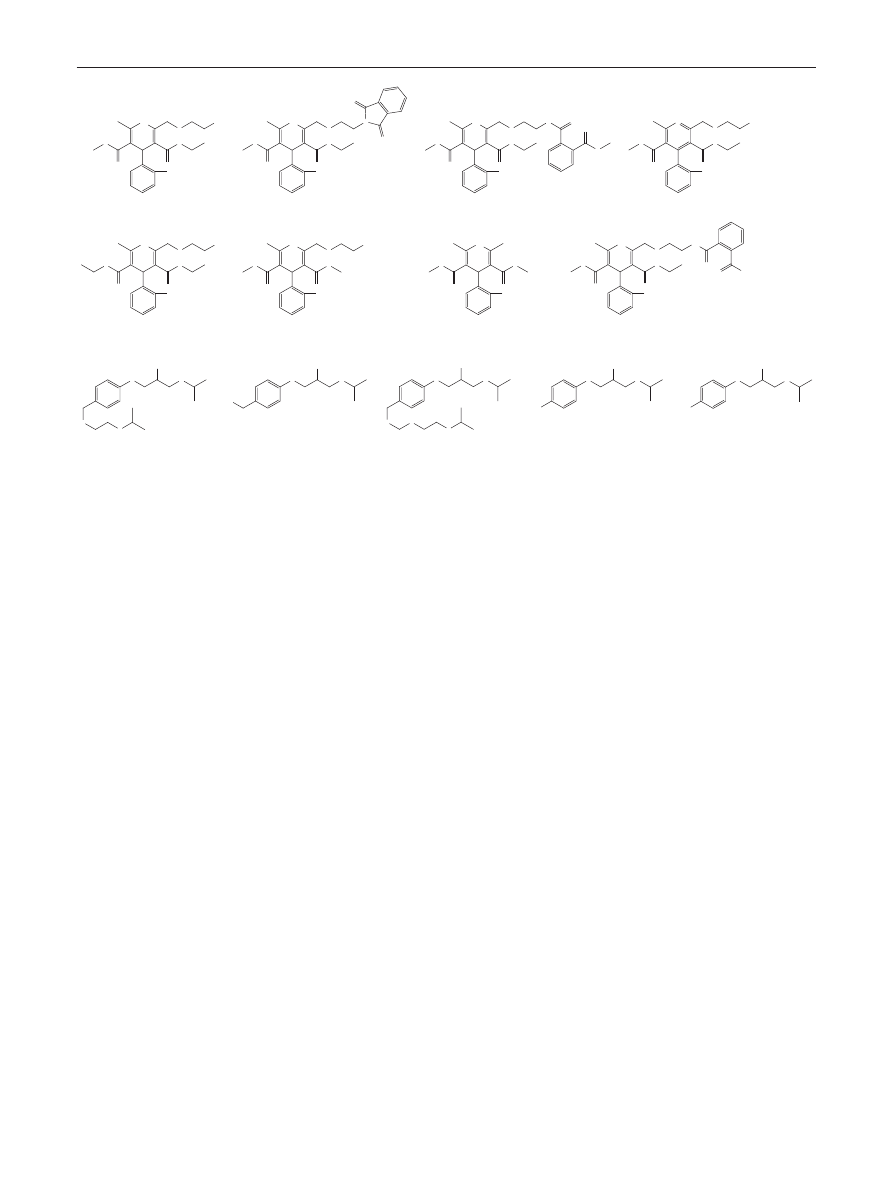
Amlodipine and its Ph.Eur. impurities (A, B, D, E, F, G,
H) and bisoprolol and its Ph.Eur. impurities (A, G, L, R)
were purchased from European Directorate for the Quality
of Medicines and HealthCare (EDQM). The structure of
the compounds is shown in Fig.
Preparation of Solutions
The mobile phase used in this work was a mixture of ace-
tonitrile and 30 mM phosphate buffer (pH 2.0, 2.6, and
3.2).
The buffers were prepared by mixing the appropriate
amount of 30 mM phosphoric acid and 30 mM sodium
dihydrogen phosphate. Buffers were filtered before use on
regenerated cellulose filter membrane, 0.2 μm pore size
(Sartorius, Goettingen, Germany).
Mobile phase “A” was 30 mM phosphate buffer (pH 2.0,
2.6, and 3.2) and mobile phase “B” was acetonitrile.
Sample solvent was a mixture of acetonitrile:water
10:90 (V:V).
Representative real-life sample of amlodipine, biso-
prolol, and their Ph.Eur. impurities contained 1 mg mL
−1
amlodipine besilate and bisoprolol fumarate and their
impurities at 0.1 % level was prepared by spiking all the
impurities to the API solution.
Chromatographic System
UHPLC experiments were performed on a Waters Acquity
UPLC system (Milford, USA) equipped with binary sol-
vent delivery pump, auto sampler, photodiode array detec-
tor, and empower software. This UHPLC system had 5 μL
injection loop and 500 nL flow cell. The dwell volume of
the system was measured as 125 μL. The column compart-
ment of the system is equipped with a CM-A column man-
ager that enables the use of four columns and programma-
ble switching of the mobile phase among the columns.
Robust UHPLC Separation Method Development
1 3
For the initial model runs, the mobile phase flow rate
was set to 0.5 mL min
−1
and gradients were run from 10 to
90 %B. The injection volume was set to 1 μL.
Columns
Acquity columns (50 × 2.1 mm, 1.7 μm BEH C18, BEH
Shield RP 18, BEH C8, BEH Phenyl, CSH C18, CSH Phe-
nyl-Hexyl, CSH Fluoro-Phenyl, 1.8 μm HSS C18, HSS
C18 SB, HSS T3, HSS PFP, HSS CN) were purchased
from Waters (Milford, USA).
The 50 × 2.1 mm, 1.7 μm Aeris peptide XB-C18, and
kinetex columns (XB-C18, C18, C8, Phenyl-Hexyl, PFP)
were purchased from Phenomenex (Torrance, USA).
Hypersil columns (50 × 2.1 mm, 1.9 μm Gold, Gold
C8, Gold CN) were purchased from Thermo Scientific
(Waltham, USA).
The 50 × 2.0 mm, 1.9 μm Triart C18 column was pur-
chased from YMC (Kyoto, Japan).
Zorbax columns (50 × 2.1 mm, 1.8 μm SB-C18,
SB-C8, SB-Phenyl) were purchased from Agilent (Santa
Clara, CA, USA).
Software
Modeling was carried out using DryLab v.4.0 and the quan-
titative robustness evaluation of generated models was per-
formed with the latest DryLab Robustness Module v.1.0.
(Molnár-Institute, Berlin, Germany).
Results and Discussion
Design of Experiments (DoE)
The selected example describes a fast and efficient method
development for the determination of impurities and degra-
dation products of combined active pharmaceutical ingredi-
ents, utilizing the separation power of state-of-the-art col-
umns. A general methodology is to simultaneously model
the effect of temperature and gradient steepness on selec-
tivity with a given RP column. Thanks to the current devel-
opments in chromatographic modeling software products,
it is now possible to model the effect of three variables
simultaneously for a given separation. In our case, gradi-
ent steepness (t
G
), temperature (T), and mobile phase pH
were selected as model variables to create a cube resolu-
tion map, showing the critical resolution of the peaks to be
separated against the three factors. Probably, these selected
variables have the most significant effect on the selectivity
and resolution for such analytes. In most cases, the reten-
tion can be described as a function of gradient steepness,
with the linear solvent strength theory and its temperature
dependence following a van’t Hoff type relationship. Both
relationships can be transformed to linear dependencies.
When separating ionizable compounds, strong pH-related
changes in retention occur for pH values within ±1.5 units
of the pKa value. Outside this range, the compound is con-
sidered as mostly ionized or non-ionized, and its retention
is not significantly altered with pH. In a relatively small
NH
O
NH
2
O
O
O
Cl
O
NH
O
N
O
O
O
Cl
O
O
O
NH
O
H
N
O
O
O
Cl
O
O
N
H
O
N
O
NH
2
O
O
O
Cl
O
NH
O
NH
2
O
O
O
Cl
O
NH
O
NH
2
O
O
O
Cl
O
NH
O
O
O
Cl
O
NH
O
NH
O
O
O
Cl
O
O
O
OH
O
H
N
O
O
OH
O
H
N
OH
HO
O
H
N
O
O
O
OH
O
H
N
OHC
OH
O
H
N
H
3
C
OH
Amlodipine
A-ImpA
A-ImpB
A-ImpD
A-ImpE
A-ImpF
A-ImpG
A-ImpH
Bisoprolol
B-ImpA
B-ImpG
B-ImpL
B-ImpR
Fig. 1 Structure of Amlodipine, Bisoprolol and their impurities

R. Kormány et al.
1 3
pH range—within the ±1.5 units of the pKa value—the
dependence of retention on the mobile phase pH can gener-
ally be described using quadratic polynomials.
Therefore, in the proposed final model, two variables (t
G
and T) were set at two levels (t
G1
= 3 min, t
G2
= 9 min, and
T
1
= 20 °C and T
2
= 50 °C) while the third factor (pH) was
set at three levels (pH
1
= 2.0, pH
2
= 2.6, and pH
3
= 3.2).
This full factorial experimental design required 12 experi-
ments (2 × 2 × 3) on a given column.
Column Screening
In a first instance, several state-of-the-art columns were eval-
uated by performing the 12 experiments and creating the cor-
responding 3D resolution maps. By utilizing the benefits of
the column manager unit and small columns (50 × 2.1 mm),
the column screening procedure requires only 4–5 days for
testing 25 columns, since a lot of work can be automated.
Based on the resolution maps, the peak movements and the
change in selectivity/resolution were assessed and the col-
umns were ranked in terms of achievable resolution.
Table
shows the achievable maximum critical resolu-
tion (R
s,crit
) on all the 25 columns, when operating them at
their own optimal working point.
In this study, we also compared the selectivity of the
columns based on the snyder–dolan hydrophobicity sub-
traction (SDHS) database that is available in the column
match tool of DryLab. This model takes into account the
hydrophobicity (H), hydrogen bond basicity (B), ionic
interactions at two pH (C(2.8) and C(7.0)), hydrogen bond
acidity (A), and steric selectivity (S). The degree of selec-
tivity similarity can be obtained on the basis of H, B, C, A,
and S values. The resulting similarity factors (Fs) were also
reported in Table
, when available. Fs < 3 means excellent
similarity of selectivity between the compared columns;
between 3 < Fs < 5, the selectivity similarity is moderate,
and between 5 < Fs < 10, there is a questionable but still
fair comparability of selectivity. As shown in Table
, this
SDHS-based ranking sometimes resulted in unexpected
results. As an example, the Hypersil Gold C8 column that is
the third most similar (Fs = 6.3) to the reference BEH C18
phase gave completely different working point. This col-
umn has to be operated at T = 42 °C, to reach the highest
possible resolution while the BEH C18 requires low operat-
ing temperature (T = 13.5 °C). Moreover, the critical peak
pair was ImpD and ImpF on the Hypersil Gold C8 while it
was the ImpG–ImpH pair on the BEH C18 Phase. On the
contrary, the Kinetex PFP phase appears as the most differ-
ent stationary phase on the basis of its Fs value (Fs = 81.6).
However, its working point was found to be very close to
the BEH C18 material and possesses the same critical peak
pair. To conclude on the SDHS-based column comparison
approach, it gives some useful idea for selecting a similar
or diverse stationary phase in terms of interaction mecha-
nisms but does not give information about the achievable
resolution and analysis time when separating a specific
complex mixture. The other disadvantage of the SDHS
approach is that the database is not regularly updated and
it does not include data on several popular state-of-the-art
stationary phases.
Our 12 experiments based approach seems to be a
more reliable procedure when comparing the achievable
analysis time, resolution, and working point. By applying
50 × 2.1 mm columns, it takes approximately only 2–3 h
of experimental work for one given column. The advantage
of this column screening approach is that the suitability of
a column—for a given application—can be evaluated at
the very early stage of the method development. In addi-
tion, the column interchangeability can also be estimated
during the method development. Based on our experience,
it appears that most of the columns can provide sufficient
resolution within an acceptable analysis time, by adjusting
properly the chromatographic conditions. In this example,
only one column among the 25 ones tested failed to achieve
R
s
,
crit
To conclude on our column screening approach, a prom-
ising method development strategy consists in performing
initial runs and building up 3D models using different col-
umns at the early phase of method development.
Finding the Optimal Conditions
For the mixture of compounds, the highest resolution could
be performed on the Acquity CSH C18 material. Therefore,
this column was selected for the final method (Table
). It
is also worth mentioning that this column also provided the
highest peak capacity (P = 201 with a 10 min long gradient).
First, the criteria for the minimum required resolution
were set. The impurities have to be separated from (a)
each other, (b) the APIs, and (c) other possible disturbing
compounds such as the fumaric acid and benzenesulfonic
acid. For the baseline separation of the critical peak pairs,
the value of R
s,crit
should be higher than 1.5. But consider-
ing that impurities are present in small concentrations (at
~0.1 %), and have to be separated from the APIs at high
concentration, the R
s,crit
> 1.5 might not be enough. In this
case, it is better to select R
s,crit
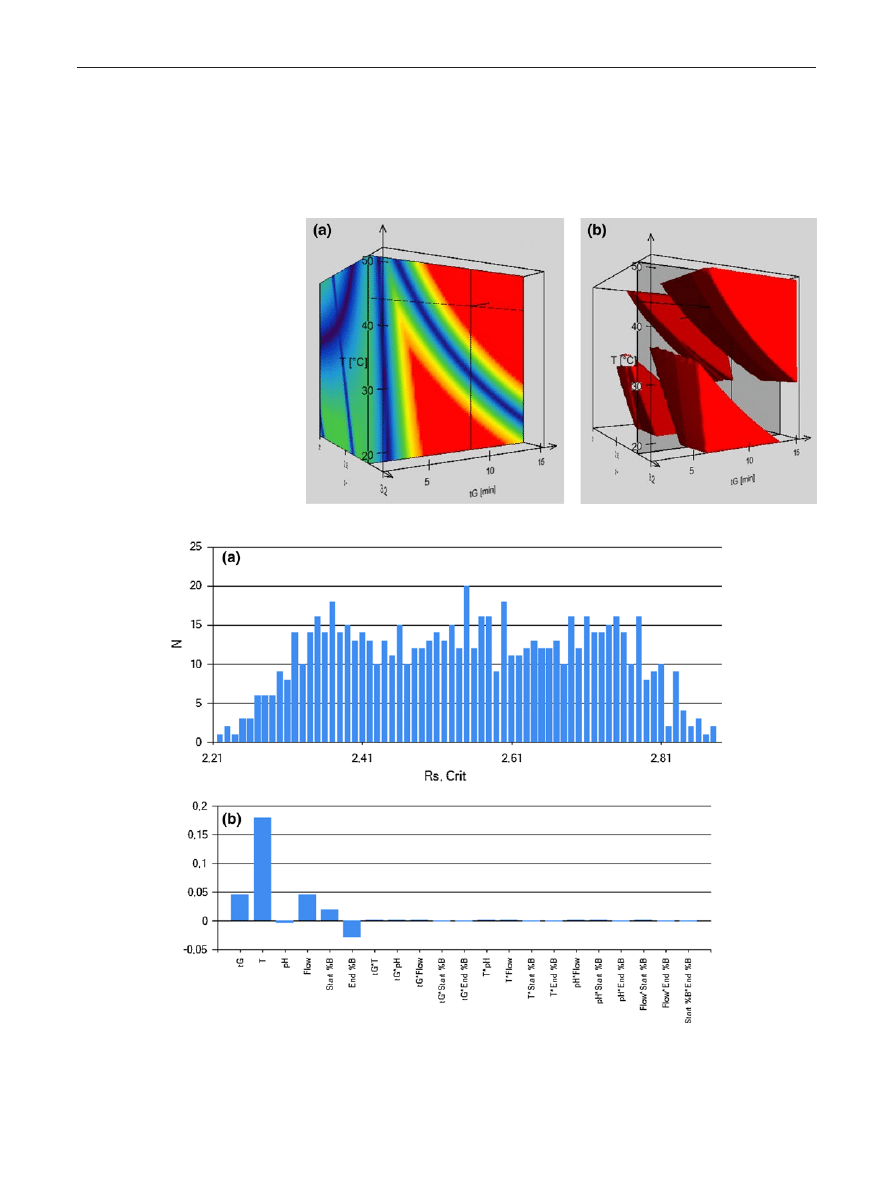
> 2.5 as criteria. Figure
shows the 3D resolution map obtained with the Acquity
CSH C18 material. Red color represents the regions inside
the Design Space where the resolution criteria is fulfilled,
while blue colors indicate co-elutions (R
s
= 0). There are
four robust spaces that meet the criteria (Fig.
b). At low
pH (pH < 2.5), and at low temperature (below 30 °C) or
at high temperature (above 40 °C) the resolution between
fumaric acid and bisoprolol-ImpA was the lowest one,
while at higher mobile phase pH (pH > 2.5) and at low

Robust UHPLC Separation Method Development
1 3
temperature (<30 °C), bisoprolol and bisoprolol-ImpG
were considered as the critical peak pair. Furthermore, a
steeper gradient decreases the resolution between biso-
prolol and its impurity-G. Taking all these observations
into account, the best working point is located into the
robust space at high pH (pH > 2.5) and at high temperature
(T > 40 °C). The final conditions were set as t
G
= 10 min
starting from 10 %B up to 90 %B (slope = 8.0 %B min
−1
),
column temperature T = 45 °C and mobile phase pH 3.0.
Please note that the selected 10 min long gradient is outside
the 3- and 9-min calibrated model, but the accuracy of the
extrapolation is valid in this range [
]. Moreover, the reli-
ability of the model was verified (see later).
Simulated Robustness Testing
The reliability of DryLab’s new simulated robustness test-
ing feature was recently reported [
previous work, the robustness of the optimized method was
also assessed by the built-in robustness module. Beside the
three model variables (t
G
, T, pH), the flow rate, as well as
initial, and final compositions of the mobile phase rep-
resent the investigated factors in the built in model. The
effect of these six factors was evaluated at three levels.
The modeled deviations from the nominal values were
the following: the gradient time was set to 9.9, 10, and
10.1 min; temperature was set to 44, 45, and 46 °C; mobile
phase pH was set to 2.9, 3.0, and 3.1; flow rate was set
to 0.495, 0.500, and 0.505 mL min
−1
; initial mobile phase
composition was set to 9.5, 10, and 10.5 %B and its final
composition was set to 89.5, 90, and 90.5 %B. Then, the
729 experiments (3
6
) were simulated in <1 min, thanks to
the software. A criterion of R
s,crit
> 1.5 was considered.
Figure
a shows the results of the experiments expressed
in frequency as a function of critical Rs. As shown, the
most frequent resolution value was R
s,crit
= 2.55 (20 condi-
tions provided this Rs value), while the lowest predicted
resolution was R
s,crit
= 2.21. Therefore, the method can
Table 1 List of columns used in the study, the conditions where the highest critical resolution can be reached, the critical peak-pairs, selectivity
similarity (Fs), and the average of retention time relative errors
Difference (min): Predicted Retention Time − Experimental Retention Time
% error: [(Predicted Retention Time − Experimental Retention Time)/Experimental Retention Time] × 100
Columns
pH
T
(°C)
t
G
(min)
R
s,crit
Critical peak pair
Fs
Average of retention
time relative errors (%)
Acquity BEH C18
2.1
13.5
8.1
2.54
ImpG–ImpH
0.0
0.23
Acquity BEH Shield RP 18
2.0
38.3
9.8
2.16
ImpB–ImpG
–
−0.79
Acquity BEH C8
2.5
33.0
9.8
2.27
ImpD–ImpF
8.0
−0.85
Acquity BEH Phenyl
2.0
29.3
9.8
2.32
ImpG–ImpB
27.7
0.41
Acquity CSH C18
3.0
13.5
9.8
3.13
ImpD–ImpF
–
0.88
Acquity CSH Phenyl-Hexyl
2.1
13.5
2.9
1.92
ImpD–ImpF
–
0.60
Acquity CSH Fluoro-Phenyl
3.0
13.5
2.7
1.22
ImpD–ImpF
–
−0.55
Triart C18
3.0
13.5
7.4
2.49
ImpD–ImpF
–
0.57
Acquity HSS C18
2.1
24.0
9.8
2.50
ImpG–ImpH
–
−1.95
Acquity HSS C18 SB
2.0
30.0
9.8
2.04
ImpD–ImpF
–
−0.37
Acquity HSS T3
2.0
31.5
9.8
2.16
ImpG–ImpH
–
−0.94
Acquity HSS PFP
2.0
19.5
9.8
1.58
ImpD–ImpF
–
−0.27
Acquity HSS CN
3.0
13.5
7.9
1.95
ImpD–ImpF
–
−0.15
Hypersil gold
3.0
41.3
9.8
2.72
ImpD–ImpF
20.5
−0.10
Hypersil gold C8
2.7
42.0
9.8
2.55
ImpD–ImpF
6.3
−0.24
Hypersil gold CN
2.9
27.8
9.0
1.67
ImpG–ImpB
–
0.56
Zorbax SB-C18
2.2
29.3
9.8
2.13
ImpG–ImpH
53.6
−0.36
Zorbax SB-C8
2.8
13.5
6.1
2.03
ImpD–ImpF
52.6
1.09
Zorbax SB-Phenyl
2.0
13.5
8.9
1.52
ImpD–ImpF
–
−2.42
Aeris peptide XB-C18
3.0
15.0
9.8
2.50
ImpG–ImpH
–
0.35
Kinetex XB-C18
2.2
13.5
9.8
2.24
ImpD–ImpF
–
0.81
Kinetex C18
2.5
20.3
9.8
2.38
ImpD–ImpF
4.0
−0.54
Kinetex C8
2.4
13.5
9.8
2.52
ImpD–ImpF
–
0.14
Kinetex Phenyl-Hexyl
2.2
33.8
9.8
2.22
ImpD–ImpF
–
−0.28
Kinetex PFP
2.4
16.5
9.8
2.44
ImpG–ImpH
81.6
1.67
R. Kormány et al.
1 3
be considered as robust, since the failure rate was 0 % in
the studied Design Space. Another feature of the mod-
eling software employed in this study is the calculation
of individual and interaction parameter effects. Figure
b
describes the importance of each parameter, related to the
selected deviation from the nominal value, for the critical
resolution. This figure indicates that the column tempera-
ture has the most important influence on the critical reso-
lution while the mobile phase pH plays the less important
role.
Fig. 2 Three-dimensional
resolution map based on
t
G
-T-pH model, showing the
influence of t
G
, T, and pH on the
critical resolution. Red indicates
baseline separation while blue
indicates co-elution (R
s,crit
= 0)
(a), and showing only the robust
zones (b)
Fig. 3 Results of simulated robustness testing. Frequency of critical resolution (a) and the relative effects of the chromatographic parameters on
separation (b)
Robust UHPLC Separation Method Development
1 3
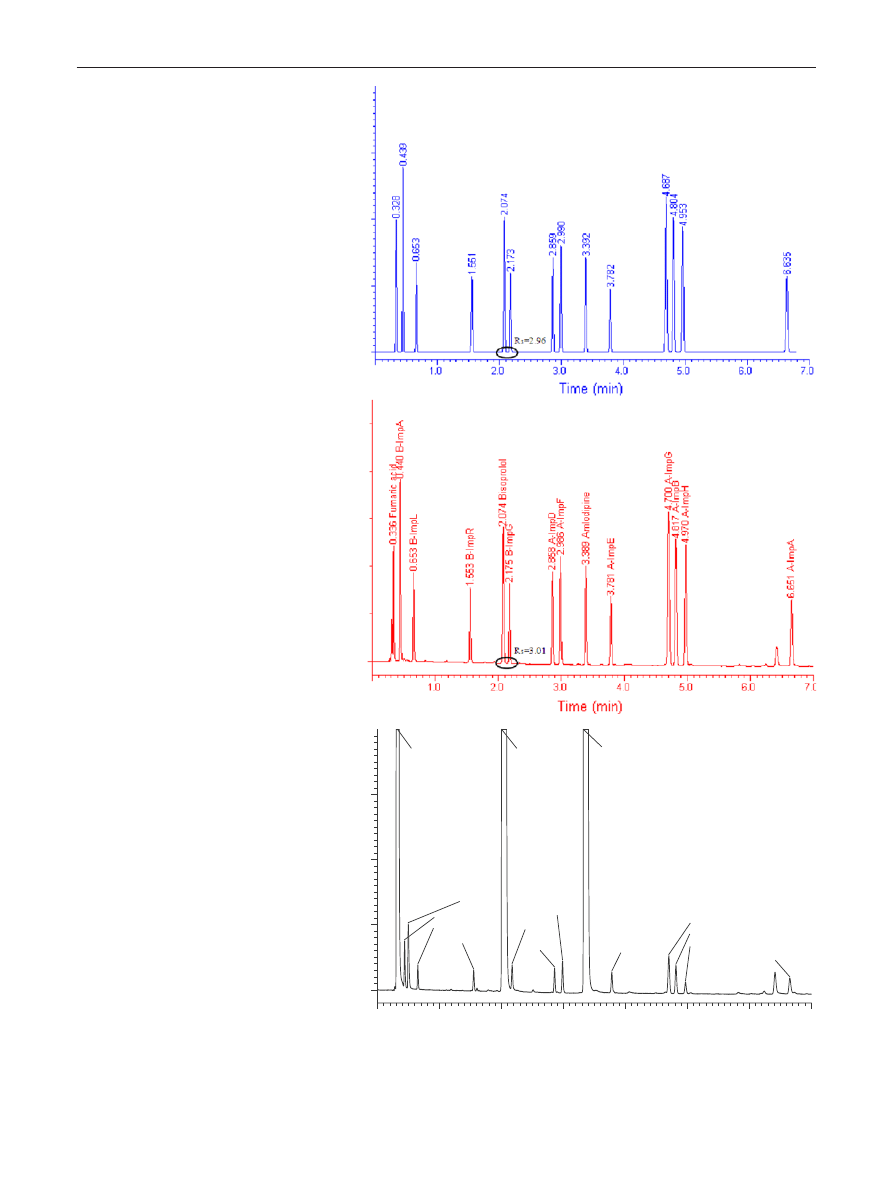
Fig. 4 Predicted (a) and experi-
mental (b) chromatograms of
the model reference solution
and of a real sample spiked with
0.1 % impurities (c). Column:
Waters CSH C18 50 × 2.1 mm
(1.7 μm), mobile phase “A”:
30 mM phosphate buffer pH
3.0, mobile phase “B”: acetoni-
trile, gradient time = 10 min,
starting from 10 % B up to
90 % B, flow rate 0.5 mL min
−1
and column temperature
T
= 45 °C
1.0
2.0
3.0
4.0
5.0
6.0
7.0
Fumaric acid
B-ImpA
Benzenesulfonic acid
B-ImpL
B-ImpR
Bisoprolol
B-ImpG
A-ImpD
A-ImpF
Amlodipine
A-ImpE
A-ImpG
A-ImpB
A-ImpH
A-ImpA
Time (min)
(a)
(b)
(c)

R. Kormány et al.
1 3
Reliability of the Modeled Results
As a final step, the accuracy of the predicted results was
evaluated. Experimental verifications of predicted chro-
matograms were performed. First, the optimal method was
verified. Figure
shows the predicted and experimentally
observed chromatograms when operating the column at
the optimal working point. The predicted retention times
were in good agreement with the experimental ones, since
the average retention time relative errors were <1.0 % (see
Table
), which can be considered as an excellent predic-
tion for such a fast gradient. The accuracy of critical resolu-
tion prediction was also assessed. As illustrated in Table
the predicted critical resolution was also in good agreement
with the experimental one (2.55 versus 2.52). Table
provides the average relative error of retention time predic-
tions for all the tested 25 columns, when operating them at
their own optimal working point.
To estimate the reliability of the modeled robustness test-
ing, 3 of the 729 experiments were selected and experimen-
tally performed. In the first case, the conditions that pro-
vided the lowest critical resolution were set (t
G
= 9.9 min,
T
= 44 °C, pH 3.1, flow rate = 0.495 mL min
−1
,
start %B = 9.5, and end %B = 90.5). Next, the case
where all parameters were set at their lowest lev-
els was evaluated (t
G
= 9.9 min, T = 44 °C, pH 2.9,
flow rate = 0.495 mL min
−1
, start %B = 9.5, and
end %B = 89.5). Finally, the third case corresponds to
all parameters set at their highest levels (t
G
= 10.1 min,
T
= 46 °C, pH 3.1, flow rate = 0.505 mL min
−1
,
start %B = 10.5, and end %B = 90.5). In any of these three
cases, the predicted retention times and R
s,crit
values were
in good agreement with the experimental ones, the errors in
retention times were <0.05 min, and errors in R
s,crit
values
were <0.03 (see Table
).
Conclusion
The goal of this contribution was to develop a fast UHPLC
separation of amlodipine and bisoprolol (multi-API prod-
uct) and all their closely related compounds (impurity pro-
filing purpose). For this purpose, computer-assisted method
development was employed and a significant amount
of experimental work was performed. On the total, 25
UHPLC columns of 50 × 2.1 mm, sub-2 μm were tested
and three experimental factors were studied for each sta-
tionary phase, including the gradient time (t
G
), temperature
(T), and mobile phase pH.
Thanks to modeling software, it was possible to find a
suitable separation (R
s,crit
> 1.5) for 24 among the 25 tested
columns, by proper adjustments of gradient, tempera-
ture and pH, while maintaining analysis time lower than
10 min. The final method for the baseline separation of 16
Table 2 Experimental verification of retention time and resolution predictions
The “original method” corresponds to the optimal method; the “worst case” corresponds to the conditions where the lowest resolution can be
achieved, while “Low” and “High parameters” correspond to conditions where all the variables were set at their lower and higher levels
Original method
“Worst method”
Low parameters
High parameters
Predicted t
R
(min)
Experimental
t
R
(min)
Predicted t
R
(min)
Experimental
t
R
(min)
Predicted t
R
(min)
Experimental
t
R
(min)
Predicted t
R
(min)
Experimental
t
R
(min)
Fumaric acid
0.33
0.34
0.33
0.34
0.36
0.35
0.30
0.30
B-ImpA
0.44
0.44
0.48
0.48
0.47
0.46
0.41
0.43
B-ImpL
0.65
0.65
0.72
0.71
0.70
0.68
0.60
0.63
B-ImpR
1.55
1.55
1.63
1.63
1.59
1.60
1.51
1.52
Bisoprolol
2.07
2.07
2.15
2.14
2.11
2.11
2.02
2.04
B-ImpG
2.17
2.18
2.25
2.24
2.21
2.21
2.12
2.14
A-ImpD
2.86
2.86
2.93
2.92
2.89
2.89
2.81
2.82
A-ImpF
2.99
2.99
3.05
3.04
3.03
3.02
2.93
2.94
Amlodipine
3.39
3.39
3.45
3.44
3.42
3.42
3.33
3.35
A-ImpE
3.78
3.78
3.84
3.82
3.81
3.81
3.72
3.75
A-ImpG
4.69
4.70
4.72
4.72
4.74
4.76
4.61
4.64
A-ImpB
4.80
4.82
4.83
4.82
4.85
4.86
4.73
4.77
A-ImpH
4.95
4.97
4.97
4.96
5.01
5.03
4.86
4.91
A-ImpA
6.63
6.65
6.65
6.63
6.67
6.69
6.56
6.61
R
subscript
A-ImpG−
A-ImpB
2.55
2.52
2.22
2.19
2.29
2.29
2.81
2.84

Robust UHPLC Separation Method Development
1 3
peaks that can be encountered in the amlodipine/bisoprolol
formulation was achieved in <7 min.
The reliability of the predictions achieved with the 3D
model feature included in Drylab was excellent, as the
average difference between predicted and observed retne-
tion times was less than 2 %. Moreover, by utilizing both
the 3D model and the simulated robustness testing, a huge
amount of experimental work can be saved and, therefore,
the time spent for method development and robustness test-
ing can be drastically shortened. The procedure described
in the present paper can obviously be employed for other
type of pharmaceutical formulations.
References
1. Fekete S, Fekete J, Molnár I, Ganzler K (2009) Rapid high per-
formance liquid chromatography method development with
high prediction accuracy, using 5 cm long narrow bore columns
packed with sub-2 μm particles and Design Space computer
modeling. J Chromatogr A 1216:7816–7823
2. Krisko RM, McLaughlin K, Koenigbauer MJ, Lunte CE (2006)
Application of a column selection system and Drylab software
for high-performance liquid chromatography method develop-
ment. J Chromatogr A 1122:186–193
3. Horváth C, Melander W, Molnár I (1976) Solvophobic interac-
tions in liquid chromatography with nonpolar stationary phases. J
Chromatogr 125:129–156
4. Molnár I (2002) Computerized design of separation strategies by
reversed-phase liquid chromatography: development of Drylab
software. J Chromatogr A 965:175–194
5. Euerby M, Schad G, Rieger HJ, Molnár I (2010) 3-Dimensional
retention modelling of gradient time, ternary solvent-strength,
and temperature of the reversed-phase gradient liquid chroma-
tography of a complex mixture of 22 basic and neutral analytes
using Drylab
®
2010. Chromatogr Today 3:13–18
6. Kormány R, Rieger HJ, Molnár I (2013) Application of quality
by design principles of pharmaceutical sample using UHPLC
method development with modeling technologies. LCGC
31(S4a):2–8
7. Kimata K, Iwaguchi K, Onishi S, Jinno K, Eksteen R, Hosoya K,
Araki M, Tanaka N (1989) Chromatographic characterization of
silica C18 packing materials. Correlation between a preparation
method and retention behavior of stationary phase. J Chromatogr
Sci 27:721–728
8. Wilson NS, Nelson MD, Dolan JW, Snyder LR, Wolcott RG, Carr
PW (2002) Column selectivity in reversed-phase liquid chroma-
tography I. A general quantitative relationship. J Chromatogr A
961:171–193
9. Euerby MR, James M, Petersson P (2012) Practical implications
of the tanaka stationary phase characterization methodology
using ultra high performance liquid chromatographic conditions.
J Chromatogr A 1228:165–174
10. Euerby MR, James M, Axelsson BO, Rosén O, Petersson P
(2012) Validation of the extended tanaka column characteriza-
tion protocol by multivariate analysis of chromatographic reten-
tion of low-molecular-weight analytes on reversed phase columns
using methanol and acetonitrile as organic modifiers. J Sep Sci
35:2592–2598
11. Kormány R, Molnár I, Rieger HJ (2013) Exploring better column
selectivity choices in ultra-high performance liquid chromatog-
raphy using quality by design principles. J Pharm Biomed Anal
80:79–88
12. Kormány R, Fekete J, Guillarme D, Fekete S (2014) Reliability
of simulated robustness testing in fast liquid chromatography,
using state-of-the-art column technology, instrumentation and
modelling software. J Pharm Biomed Anal 89:67–75
13. Vora DN, Kadav AA (2008) Development and validation of a
simultaneous HPLC method for estimation of bisoprolol fuma-
rate and amlodipine besylate from tablets. Indian J Pharm Sci
70(4):542–546
14. Kakde RB, Kotak VH, Barsagade AG, Chaudhary NK, Kale DL
(2008) Spectrophotometric method for simultaneous estimation
of amlodipine besylate and bisoprolol fumarate in pharmaceutical
preparations. J Pharm Tech 1(4):513–515
15. Chang H, Li J, Li J, Guan X, Sun F, Qian Z, Bi K, Fan G (2012)
Simultaneous determination of amlodipine and bisoprolol in rat
plasma by a liquid chromatography/tandem mass spectrometry
method and its application in pharmacokinetic study. J Pharm
Biomed Anal 71:104–110
Document Outline
Wyszukiwarka
Podobne podstrony:
Method Development in High Performance Liquid Chromatography
fitopatologia, Microarrays are one of the new emerging methods in plant virology currently being dev
Advanced Methods for Development of Wind turbine models for control designe
(Ebook Firearms) Ammunition Reloading Incremental Load Development, Ladder Method
Kamiński, Tomasz The Chinese Factor in Developingthe Grand Strategy of the European Union (2014)
China pushes for developing world s rights as BRICS summit 2014 opens Reuters
1 Development of the Lithium Ion Battery and Recent T 2014 Lithium Ion Bat
Badania separacji na frakcje stałą i ciekłą gnojowicy i pulpy pofermentacyjnej Polska 2014
Postmodernity and Postmodernism ppt May 2014(3)
Wyklad 04 2014 2015
Norma ISO 9001 2008 ZUT sem 3 2014
9 ćwiczenie 2014
Prawo wyborcze I 2014
2014 ABC DYDAKTYKIid 28414 ppt
prezentacja 1 Stat 2014
21 02 2014 Wykład 1 Sala
MB 7 2014
więcej podobnych podstron