
The impact of illegal insider trading in dealer and specialist markets:
Evidence from a natural experiment
✩
a
School of Business Administration, U iversity of Miami, P.O. Box 248126, Coral Gables, FL 33124
b
Kogod School of Business, Amer
400 Massachusetts Avenue N.W., Washington, DC 20016
December 2002
Raymond P.H. Fishe
a
, Michel A. Robe
b,*
n
ican University, 4
Abstract
We examine insider trading in specialist and dealer markets, using the trades o
had advance copies of a stock analysis column in Business Week magazine. We
in
f stockbrokers who
find that increases
price and volume occur after informed trades. During informed trading, market makers decrease
depth. Depth falls more on the NYSE and Amex than on the Nasdaq. Bid-ask spreads show
but not on the Nasdaq. We find none of these pre-release
changes in a nontraded control sample of stocks mentioned in the column. Our results show that
tra ing ha
n important tool to manage
asymmetric information risk; and specialist markets are better at detecting information-based
trades.
n:
G12, G14, K22, D82
increases on the NYSE and Amex,
insider
ty; depth is a
d
s a negative impact on market liquidi
JEL-Classificatio
Keywords:
Insider trading, Asymmetric information, Depth, Liquidity,
Specialist and dealer markets, Business Week
_______________________
✩
We thank officials at the Securities and Exchange Commission and the U.S. Attorney’s Offi
assistance with the study. In addition to an anonymous referee who provided very useful and detailed
authors thank Jim Angel, Henk Berkman, Graeme Camp, Jeff Harris, Kris Jacobs, Tim McCorm
Albert Minguet, David Reeb, Chuck Schnitzlein, and seminar participants at the NASD, the Uni
ce in New York for
comments, the
ick, Ron Melicher,
versity of Auckland,
McGill University, the 2001 Meetings of the European Finance Association (Barcelona) and Financial Management
merican Law and Economics Association (Harvard), the 2002
Conference, and the 2002 Summer Meeting of the Econometric Society
(UCLA), for helpful comments. We are indebted to Tim McCormick for providing aggregate depth data for Nasdaq-
listed stocks. Michel Robe gratefully acknowledges the research support received as a Kogod Endowed Fellow.
Xinxin Wang provided excellent research assistance. This work began while Pat Fishe was a Visiting Academic
Scholar at the Securities and Exchange Commission. As a matter of policy, the Securities and Exchange
Commission disclaims responsibility for any private publication or statement by any of its employees. The views
expressed herein are those of the authors and do not necessarily reflect the views of the Commission or the authors’
colleagues on the staff of the Commission. We are responsible for all errors and omissions.
* Corresponding author. Tel: 202-885-1880; fax: 202-885-1946
E-mail address: mrobe@american.edu (M.A. Robe)
Association (Toronto), the 2002 Meeting of the A
Yale-Nasdaq-JFM Market Microstructure

1. Introduction
the operation of
e few studies of
hat traders used
material, nonpublic information. Most studies rely on the position of a trader (e.g., company
ng that involved
hese firms from
e day before its
public release. Although not based directly on company news, trades based on prior knowledge
a third of the 116
stoc
ding in financial
Nasdaq, the data
ecialist markets.
For all stocks traded by the stockbrokers and for most other IWS stocks, we have data on
transactions and quotes for three days around the insider trading day. Court records from the civil
aggregating the
market behavior
We find strong evidence that illegal insider trading has a negative impact on market
liquidity. Our analysis shows that market makers adjust both depth and spreads to manage the
1
s
increase only in specialist markets. All these informed trades involve purchases, and we find that
only ask depth changes significantly. Relative to the average quoted depth on the previous day,
ask depth is 38% lower for NYSE and Amex stocks during insider intervals. After controlling for
Many market participants believe that insider trading poses a threat to
financial markets. However, this proposition is difficult to test because there ar
insider trading in which researchers can actually say they know for sure t
official or board member) to infer access to, and use of, such information.
In this study, we examine data from a recent court case on insider tradi
116 publicly traded companies. Five stockbrokers acquired information on t
Business Week’s “Inside Wall Street” (IWS) column, which they received th
of the IWS column yielded abnormal returns. Because the brokers traded only
ks, this episode offers a natural experiment on the impact of informed tra
markets. Also, because the stocks involved were listed on the NYSE, Amex and
yield the first comparison of the effects of illegal insider trading in dealer and sp
and criminal cases identify the brokers’ trades within the transaction stream. By
trade and quote data in 15-minute intervals, we obtain a detailed picture of
during and immediately following periods of insider trading activity.
risk presented by informed traders. Depth falls in both specialist and dealer markets, but spread
1
Throughout the paper, we use the term “market makers” to refer to all liquidity providers, including specialists,
dealers and limit-order traders.

lower Nasdaq depth, ask depth for Nasdaq stocks falls by only 3% during i
These depth results are stronger when we exclude nine traded stocks featured
Week news stories before the insider trading period. The spread increases i
spreads more than quoted spreads, with market makers in specialist markets provid
nsider intervals.
2
in non-Business
nvolve effective
ing less price
improvement during insider trading intervals. Overall, specialist markets reduce depth and price
prices. Because
ere pressed to act on Thursday
afte
aller, less liquid
companies, which might have made their actions more detectable to others.
r trades. Though
increases in the
hursday volume
e brokers’ trades
only account for a small part of the increase. Court records show that the IWS information was
in the additional
nge Commission
volume increase
se trading by either
“falsely informed” or mimicking and momentum traders. As defined by Cornell and Sirri (1992),
falsely informed traders are those who “fail to recognize the extent of the inside information
ior information.”
Such traders may greatly increase volume until the extent of their misinformation is revealed.
Overall, the buy-side activity is higher both during and after insider trading intervals, and
prices rise markedly across these intervals. However, consistent with the mimicking or
improvement more than dealer markets in response to insider trading.
We also examine how private information becomes impounded in stock
the IWS information was short-lived, these stockbrokers w
rnoon. Faced with this constraint, we find that they tended to single out sm
We find that Thursday trading volume is not unusual until the first inside
buying pressures do develop once insiders start trading, we see significant
number of trades and volume only after the brokers finish trading. The T
increase is large (almost two-thirds of the previous day’s total volume), but th
shared beyond the defendants, but trades by the brokers’ associates do not expla
volume. The trades of all the individuals identified by the Securities and Excha
(SEC) with access to the IWS information make up no more than 9.2% of the
for insider-traded stocks. We suggest that the increased buying reflects noi
reflected in the market price, and thus incorrectly believe that they have super
2
For Nasdaq stocks, we aggregate ask (bid) depth quotes across all market makers quoting the best ask (bid) price.
By doing so, we ensure that our depth figures are comparable for Nasdaq- and exchange-listed stocks.
- 2 -

momentum view, prices do not increase enough that all of the information in the IWS column is
refl
ed on Friday.
which nonpublic
ks form an ideal
control group to determine whether the observed liquidity and price effects are really a
ther information
ocks. Depth and spreads do not
cha
rsday afternoon.
To isolate the effects of these insiders’ trades, we develop an additional control sample
that signed order
nses we observe
med order flow.
nths before these
brokers began trading. We match stocks to order imbalances observed on the day of informed
mple, we use these regression
esti
uring informed
ed securities. In
general, order imbalances are not responsible for our adverse liquidity results.
The data also allow us to examine the informed traders’ exit strategies. The returns from
ptly resold for
informed trades to yield abnormal returns. We find that these brokers were slow to adjust their
exit strategies and close their positions the next day. They learned this rule eventually, as their
holding period consistently decreased during the sample period.
The paper proceeds as follows. Section 2 discusses related theoretical and empirical
studies. Section 3 describes the data and offers graphical evidence on the impact of insider
ected in the Thursday closing price, because abnormal returns are also observ
Unlike other studies of insider trading, we have data on stocks for
information was available to the five brokers but they took no action. These stoc
consequence of insider trades. After removing stocks for which there are o
events, we find no effects like those observed for the traded st
nge; volume is normal; and there is no significant price appreciation, on Thu
Thus, it appears as if no information has leaked to the market for these stocks.
based on order flow imbalances. Chordia, Roll, and Subrahmanyam (2002) find
imbalances affect bid-ask spreads and returns. Thus, it is possible that the respo
are due partly to market makers’ reacting to order imbalances rather than to infor
Our control sample uses the same set of Business Week stocks, but in the six mo
trading. After re-estimating the models with the control sa
mates to net out the effects of order imbalances from the data in the informed trading period.
Regressions using these adjusted data show depth and spread adjustments d
trading periods, though spreads increase significantly only for exchange-list
trading on IWS information are short-lived. Therefore, stocks must be prom
- 3 -

trading. Section 4 analyzes abnormal returns to insider trading on IWS stocks. Section 5
develops the statistical analysis of trades, spreads and depth. Section 6 concludes.
2.
Most theoretical models of market making focus on the bid-ask spread as the tool used to
ley and O’Hara,
0) examine how
during informed
adverse selection
increases. Dupont, who also considers quantities and prices, provides predictions closest to our
results. He models the trade-off between unprofitable trades with informed traders and profitable
insiders, but also
rmed trades are
precise, which causes larger-size
orders. Dupont demonstrates that these larger orders cause quoted depth to react proportionally
more than bid-ask spreads to informed trading. Therefore, in empirical research, depth changes
f the information
announcements,
affect both spreads and depth. In contrast, relatively little is known about how spreads or depth
react to unexpected events, such as those created by informed traders. The sole evidence to date
and from case studies by Cornell and Sirri (1992) and Chakravarty and McConnell (1997, 1999)
of two NYSE stocks targeted by corporate insiders in the 1980s.
Related
literature
react to informed trading (e.g., Glosten and Milgrom, 1985; Glosten, 1989; Eas
1992; Madhavan, 2000). Recent models by Kavajecz (1998) and Dupont (200
specialist market makers can optimally change both quoted depth and spreads
trading periods. Kavajecz forecasts that depth will fall and spreads widen when
trades with liquidity traders. A higher spread or lower depth reduces losses to
reduces liquidity trading because uninformed traders are price sensitive. Info
distinguished in his model when the information signal is more
are more likely to be observable than spread changes during informed trading.
The ability to detect spread and depth changes depends on the nature o
event. Empirical research establishes that expected events, such as earnings
3
comes from Meulbroek’s (1992) analysis of SEC files on insider trading between 1980 and 1989,
3
Liquidity falls just before and immediately following announcements regarding earnings (e.g., Lee, Mucklow, and
Ready, 1993; Kavajecz, 1999), dividends (Koski and Michaely, 2000), and takeovers (Foster and Vishwanathan,
1994; Jennings, 1994). See Kim and Verrecchia (1994) and Krinsky and Lee (1996) for discussions of earlier
empirical studies analyzing spread behavior around such expected information events.
- 4 -

Meulbroek (1992) focuses on price discovery in 183 cases of insider tr
that the average cumulative abnormal return per episode is large (6.85%) and a
of the abnormal return on the day the information becomes public. She also find
insider’s trading represents only 11.3% of the stock’s trading volume. How
ading. She finds
mounts to 47.6%
s that the median
ever, Meulbroek
makes the case that the trades of insiders (as opposed to falsely informed or momentum traders)
acc
er trade-specific
security prices.
) analyze illegal
by a director of
Anheuser-Busch and his accomplices during that company’s 1982 acquisition of Campbell-
alent to 29% of
vidence, Cornell
. Their most striking
pro
they argue that
liquidity improved while insiders were active, with liquidity measured as the cost of trading an
is study.
ase of 1,731,200
ays for about 5%
y one-half of the
incremental volume, and that price increases took place both during and following Boesky’s
trades. As do Cornell and Sirri (1992), they find that spreads were generally unaffected by these
ught shares, with
quoted depth changes greater on the bid side than the ask side. However, they question whether
“[those] results can or should be generalized to a larger population or to a different time period.”
A key contribution of our paper is to show that, although many of these results can be
reproduced in a cross-section of insider trading episodes, some important extant results are not
general in nature. In particular, we show that informed trading based on material, nonpublic
ount for most of the extra volume on insider days. She hypothesizes that insid
characteristics and not trading volume per se impound the inside information into
Cornell and Sirri (1992) and Chakravarty and McConnell (1997, 1999
trading during two takeover attempts. Cornell and Sirri analyze trades made
Taggart. In all, 38 insiders bought 265,600 shares over 23 days, which is equiv
the target’s trading volume. Unlike Meulbroek (1992), but consistent with our e
and Sirri find a large increase in non-insider, falsely informed trading
position is that bid-ask spreads are unchanged by insider trading. Further,
additional share, which is different from the quoted depth measure analyzed in th
Chakravarty and McConnell (1997, 1999) analyze Ivan Boesky’s purch
Carnation shares before Nestlé’s 1984 acquisition. They analyze trades on 24 d
of Carnation’s outstanding shares. They find that Boesky’s trades made up onl
trades. They also report that depth was unchanged or improved when Boesky bo
- 5 -

information leads to spread increases and reduced price improvement in specia
also show that such trading has a negative impact on depth, and that the magn
list markets. We
itude of this impact
dep
carried out.
rwin, and Harris
(2002); Garfinkel and Nimalendran (2002); and Heidle and Huang (2002). Those papers analyze
4
that trading halts
rwin, and Harris
than double after
rgue that Nasdaq
dealers, with a limited knowledge of the order flow, may be at a disadvantage to informed investors.
Thi
endran, who find
,
appear better at
e results.
l columns,
which include the Wall Street Journal’s “Heard on the Street” (e.g., Lloyd-Davis and Canes,
er and Loeffler,
almon, Sun, and
day Call television programs
(Busse and Green, 2002). These studies all find significant, but temporary, abnormal returns
when good news is reported. For the IWS column, average abnormal returns ranged from 1.2%
e find abnormal
d.
ends on the type of financial market (specialist or dealer) where the trades are
Our paper is also related to Corwin and Lipson (2000); Christie, Co
information effects on dealer and specialist markets. Corwin and Lipson find
on the NYSE are sufficient to resolve price uncertainty. In contrast, Christie, Co
find that halts do not resolve price uncertainty for Nasdaq stocks: spreads more
Nasdaq halts, and only decrease 20 to 30 minutes after trading resumes. They a
s finding is consistent with both Heidle and Huang and Garfinkel and Nimal
that specialists, located on the exchange floor and managing the entire order flow
detecting informed trades. Our findings, based on actual insider trades, support thes
Our paper is also part of the literature on the stock market impact of financia
1979; Liu, Smith, and Syed, 1990; Beneish, 1991) and “Dartboard” (e.g., Barb
1993; Greene and Smart, 1999; Liang, 1999); Business Week‘s IWS (e.g., P
Tang, 1994; Sant and Zaman, 1996); and CNBC’s Morning and Mid
to 1.9%, with the initial effect negated after 26 trading days. Using recent data, w
returns more than twice that size, both before and during the insider trading perio
4
Other studies document differences in trading between dealer and specialist markets. Most examine differences in
trading costs. Examples include Huang and Stoll (1996); Barclay (1997); Bessembinder (1997, 1999); Bessembinder
and Kaufman (1997a,b); Clyde, Schultz and Zaman (1997); LaPlante and Muscarella (1997); Barclay et al. (1999);
Stoll (2000); Weston (2000); Chung, VanNess, and VanNess (2001); and references cited in those papers.
- 6 -

3.
C charged five
a foreman of the
e IWS column.
5
The broker obtained this information in the early afternoon on Thursdays, before the public
e over news wire (at 5:15 PM) and electronic distribution on
Am
ho were able to
ebruary 5, 1996
issue. The scheme apparently ended only because officials at Business Week noticed unusual
7
of their families
d in the IWS column,
acc
t records provide
ate, volume, and
cost of each trade. The time of each trade and profits are available only for the stockbrokers.
hen brokers had
acc
leaving 40 traded
traded only by a
broker’s customer and are missing time stamps, and one that had only stock options traded. Our
control sample.
average holding-
ers bought every
Legal case and data
The events we analyze became public in January 1999, when the SE
stockbrokers with insider trading. The SEC alleged that one of the brokers paid
local Business Week distributor, Hudson News Co., to fax advance copies of th
release of portions of the magazin
erica Online (at 7:00 PM). The broker forwarded it to four other brokers w
enter trades before the markets had closed.
The Business Week scheme started in June 1995 and ended with the F
6
trading in some of the recommended stocks. In all, the defendants, members
and some of their clients bought $7.73 million worth of securities mentione
ounting for about 5% of total Thursday trading in the affected stocks. Cour
information on the trades of the five brokers and their associates, including the d
The IWS column mentioned 116 firms during the eight-month period w
ess to the column. Of the 116 firms, the stockbrokers did not trade in 76,
firms. We remove ten companies to form the traded sample: nine that were
focus is on the remaining 30 stocks, with stocks without insider trades acting as a
On the amounts they invested in the 30 stocks, the defendants earned an
period return of 3.48%. The profits vary across traders because not all the brok
5
See, e.g., “Group of Brokers is Facing Charges of Insider Trading,” The New York Times, January 28, 1999, p. C-
21. This case is similar to an earlier, well-publicized case of insider trading involving the same IWS column. In
1988, several security breaches occurred at Business Week. A number of people obtained advance copies of the
magazine, and information was also leaked from within the company. Eleven individuals were convicted or settled
charges of insider trading, including three stockbrokers and Business Week’s radio broadcaster, who went to prison.
6
See United States v. Joseph Falcone, 99 Cr. 332 (TCP) and SEC v. Smath et al., 99 CV 523 (TCP).
7
See “Is someone sneaking a peek at Business Week? Early trading of a few Inside Wall Street stocks raises a red
flag,” by Chris Welles, Business Week, February 5, 1996.
- 7 -

stock and because the number of shares purchased varies across both brokers an
extreme, the initiating broker earned over $92,000 on 29 of the 30 stocks, for
return of 3.81%. At the other extreme, one broker actually lost $657 on transacti
of the 30 stocks. The mean (median) holding was 6,720 (5,000) shares for
was 21,000 shares in one stock. The brokers often established
d stocks. At one
a holding-period
ons involving 13
all five brokers
combined. The smallest orders were for 1,000 shares and the largest purchase by a single broker
these positions from smaller lots.
As a result, the trade size varies across stocks. The average (median) trade size is 1,654 (1,000)
000) shares for exchange-listed stocks.
3.1. Characteristics of the traded companies
traded firms with
equity; level and
1995, and 1996
raded companies.
The table also includes stock listi
the column’s sentiment (“Buy”, “Neutral” or “Sell”).
We
re mentioned in
e IWS column.
Table 1
Table 1 shows that the IWS column offers a favorable sentiment on almost all of these
stocks. There is no other news on most of them. Thus, IWS provides unexpected positive
founding effects
that other news might cause, we distinguish between companies with and without other news.
The Compustat data show that traded companies are smaller than those not traded. In
addition, 45% of the traded firms are listed on the NYSE or Amex, compared to 55% on Nasdaq.
We find nearly the reverse listing proportions for the control sample of nontraded firms. The
traded firms are also less profitable. There is little difference in the growth rate of sales.
shares for Nasdaq stocks and 2,064 (1,
Table 1 summarizes the characteristics of the sample firms. It compares
nontraded firms mentioned in IWS. Data on the rates of return on assets and
growth rate of sales; assets; and growth rate of net income are from the 1994,
Compustat tapes. No Compustat data were found for nine traded and 16 nont
ng and
use the Dow Jones News Retrieval service to determine whether firms a
other news articles on the Wednesday or Thursday before the public release of th
publicity for most of these companies. In the empirical analysis, to avoid the con
- 8 -

However, the average sales of traded firms are less than one-half, and their ave
about one-fourth, of that observed for nontraded firms. The stock
rage asset size is
brokers likely anticipated that
mention in the IWS column would have the largest impact on smaller companies.
3.2. Transaction and quote data
curities Industry
e day before the
public can trade
rice, bid and ask
prices, and quoted depth. The depth data for Nasdaq stocks are for all market makers quoting the
8
We use the Lee
and
a into 15-minute
d asynchronous
ro or one trade.
We manually find brokers’ trades in the transactions stream. For many traded stocks, the
s. Because some
niquely identify
es that match the
brokers’ trades around the time stamp and analyze the data in 15-minute intervals. It is rare for
any
ct the statistical
analyses across all sequences of insider trading intervals. Our conclusions are robust to these
choices. Therefore, we report results only for regressions on the most likely candidate sequence.
Table 2
Table 2 presents descriptive statistics of the SIAC data. The transaction information is
reported in three panels. Panel A provides information for all 30 stocks traded by stockbrokers;
For all 116 stocks, we collect transaction and quote data from the Se
Automation Corporation (SIAC). These data cover three days: Wednesday (th
leak of IWS), Thursday (the leak day), and Friday (the first day that the general
on the IWS news). The transaction and quote data include time, volume, trade p
best bid or ask price, which makes them comparable to exchange-listed depth.
Ready (1991) algorithm to determine trade direction. We summarize the dat
intervals, which smoothes the data and reduces the effect of larger trades an
trading on the results. We also exclude all 15-minute intervals containing only ze
information from court records unambiguously identifies the stockbrokers’ trade
of the brokers’ orders are broken into smaller trades, the court records may not u
some trades. To address this problem, we examine all possible trade sequenc
trade sequence to cross between two 15-minute intervals. Still, we condu
8
Tim McCormick at the Nasdaq provided the depth and quote data for all market makers.
- 9 -

Panel B, the information for 21 of these 30 stocks that had no other news on either Wednesday or
Thu
n-IWS news.
raded stock price
e from $0.12 to
$0.16. Across all three days, there are on average about 12 trades per 15-minute interval for
number of trades
trade size shows
e findings of Sant
and
act we find is in
more, not larger, trades, which is evidence that smaller investors are reacting to the IWS news.
traded stocks. In
sday, and 10,000
oes not hold for
the
ee days, with no
indication that they may be different on Thursday. Thus, these univariate results are ambiguous
pth and spreads.
ervals vary widely across days
in P
n Thursday, and
the fact that the
information in the IWS column is impounded into the opening price or the first few trades on
Fridays. Thus, the intraday returns show no impact of the IWS column’s release.
“Buyside” index
based on the Lee and Ready (1991) signed trades. Using the Lee-Ready algorithm, we give a
trade the value +1 if it is buyer initiated, and –1 if it is seller initiated. To develop a Buyside
index value for each 15-minute interval, we sum these values for all trades in that interval. This
measure is like Chordia, Roll, and Subrahmanyam’s (2002) measure of signed order imbalances,
except that the absolute value function is omitted to distinguish between buy and sell imbalances.
rsday; and Panel C, the information on 44 nontraded stocks without other, no
Panels A and B show similar statistics for most variables. The average t
is about $18 or $20 with a quoted spread of about $0.25. Effective spreads rang
traded stocks, with an average trade size of 1,550 to 1,771 shares. The average
increases from Wednesday (8.3 or 6.7) to Friday (17.1 or 15.1), but the average
a downward trend. This result is consistent with a publicity effect and with th
Zaman (1996) on the volume impact of the IWS column. The Friday imp
Panels A and B also show the changes in average depth and spreads for
Panel A, average ask depth is 8,600 shares on Wednesday, 8,000 shares on Thur
shares on Friday. The bid depth shows a similar pattern. However, this pattern d
no-news sample in Panel B. Effective spreads tend to decrease over the thr
as to whether market makers are reacting to informed trading by adjusting ask de
Average returns for traded stocks over these 15-minute int
anels A and B. Returns are positive on Wednesday, increase significantly o
are nearly zero on Friday. The Friday results stand out. They can be explained by
To measure the degree of buying pressure in the market, we develop a
- 10 -

As Table 2 shows, buying pressure increases from an average index value of 1.22 on Wednesday
to 7
milar pattern.
lts are similar to
. The number of
trades increases on Friday, with the Buyside index showing increasing buyer interest. Interval
arlier results: on
ded stocks. The
o 1,355 shares on Friday.
Compared to the trade size changes in Panels A and B, this size decrease suggests that there is
more interest in these nontraded stocks than in the sample traded by the stockbrokers.
ts to stockbroker
nd stock price changes in 15-
minute intervals, from the open on Wednesday to the close on Friday. For the 21 traded and 44
volume changes
.
cted stocks. Figure 1
sho
to 2:00 PM on
Thursdays), the median trading volume for stocks is more than double the average 15-minute
volume on the previous day. This is likely due to falsely informed, mimicking, or momentum,
WS stocks.
Consistent with the volume increase, Figure 2 shows a rise in the price of traded stocks
but no significant price change for nontraded stocks. Much of the price increase on Thursday
occurs after the stockbrokers finish trading. Consistent with the evidence in Cornell and Sirri
(1992), insiders appear to only start the price discovery process. The median increase relative to
the average price on Wednesday exceeds 6%. The overnight price impact between Thursday and
.2 on Friday for all traded stocks in Panel A. The results in Panel B show a si
Panel C in Table 2 shows the results for 44 nontraded stocks. Some resu
those for the traded stocks. Quoted spreads remain steady across all three days
volume, trade count and Buyside interest show the biggest differences from the e
Thursday, they increase sharply for traded stocks but fall for the 44 nontra
average trade size also decreases, from 1,998 shares on Wednesday t
3.3.
Price and volume impact
Figures 1 and 2 provide additional information on how the market reac
trading and to the IWS column. These figures depict the volume a
nontraded stocks with no non-IWS news, the figures plot the median price and
relative to Wednesday median volumes (Figure 1) and opening prices (Figure 2)
Stockbroker trades lead to increases in volume and price for the affe
ws that, in many intervals after the onset of insider trading (i.e., after 1:00 PM
traders. In contrast, there is no discernible increase in volume for the nontraded I
- 11 -

Friday is stronger for traded stocks (median jump of more than 4%) than for n
(median jump of about 2%). Figure 2 also shows that, after the open on F
ontraded stocks
riday, there is little
price movement for traded stocks, but there is a further 2% upward drift for nontraded stocks.
4. Abnormal
returns
enerated sizable
r for Research in Security
Prices (CRSP) on the high, low and closing prices of all stocks mentioned in the IWS column.
he
interval surrounding a stock’s mention in the column.
amine abnormal
May 1995. A total of
117
s, 11 because the
data are incomplete in the CRSP data and 15 because the company is mentioned in another news
story on Wednesday or Thursday. There remain 81 companies in our final “Before” sample.
1995 to February 5,
1996, when the brokers traded. A total of 116 companies are mentioned during this period. Of
ies to form our final sample: news articles rule out 38 companies,
and we exclude the remaining nine companies because daily CRSP data are incomplete for the
estimation period. These eliminations leave a total of 69 companies in our “During” sample.
4.2.
Event study with closing prices
Business Week magazine is released to newsstands early Friday morning. Some of the
information is available on news wires and America Online the night before, but only after the
close of trading in the U.S. Thus, if the IWS information is valuable, its impact on stock prices is
Figure 2 suggests that private knowledge of the IWS column may have g
returns. To investigate this possibility, we obtain data from the Cente
T se data cover a four-month
4.1.
The before and during periods
The brokers first gained access to the IWS column in June 1995. To ex
returns before this period, we search IWS columns from November 1994 to
companies are mentioned in those issues. We exclude 26 of these companie
We apply the same procedures to companies mentioned from June
these, we eliminate 47 compan
- 12 -

expected during trading on Friday. To measure this impact, we use the Campbell, Lo, and
Ma
samples.
We adjust these
ositive profits if
returns are negative. We also adjust returns for market effects by estimating a market model. In
e the Wednesday
odel regressions
e equal- and value-
wei
the index choice,
so we report equal-weighted results here. We use this procedure for each stock in the sample.
nd Friday of the
ical significance.
r power when the
average abnormal return is constan
securities. Because the potential cause of these returns
is th
e likelihood that
of these tests.
no evidence of
statistically significant abnormal returns for Wednesday or Thursday. However for Friday the
average abnormal return is 4.75%, which is different from zero at the 99% level of confidence.
ferent from 50%
(the expected level if the IWS column has no effect). The raw Friday returns are also positive for
75% of the companies mentioned in the column. In other words, in the six months preceding the
brokers’ Business Week scheme, the IWS column had an impact on the prices of featured stocks.
In Panel B, which shows the During sample results, there is a statistically significant
abnormal return of 3.87% for Friday. In contrast with the Before sample, there is also a
cKinlay (1997) event study methodology for both the Before and During data
We compute stock returns from closing prices on Thursday and Friday.
returns based on IWS sentiment, i.e.,
a “Sell” sentiment in the column offers p
this model, we use 90 days of close-to-close returns, beginning ten days befor
of the announcement week. We use this ten-day gap to separate the market-m
and the events we are analyzing. We estimate the market model using both th
ghted market indexes computed by the CRSP. The results change little with
We compute average abnormal returns for the Wednesday, Thursday, a
week that IWS mentions the company, and we use two tests to determine statist
The J test described in Campbell, Lo, and MacKinlay (1997) gives bette
2
t across
e same source, this is a reasonable assumption. The second test evaluates th
more than 50% of the abnormal returns are positive. Table 3 presents the results
Table 3
Panel A in Table 3 shows the results for the Before sample. There is
Also, 70.3% of the abnormal Friday returns are positive, which is statistically dif
- 13 -

significant average abnormal return for Thursday of 1.51%, less than one
abnormal return. This result could be due to the Business Week information’s
market. In the During sample, 78.3% of the abnormal returns on Friday are p
also statistically significant, and 78% of the raw returns on Friday are positiv
-half the Friday
leaking into the
ositive, which is
e. Overall, these
results show that the stockbrokers could have a reasonable expectation of profiting from advance
lumn, particularly if their holding period was a single day.
olumn are short-
lived, so we expect the stockbrokers to have closed their positions quickly rather than risk losing
from exchange
horizon over the
heir stocks for about a
week. This period drops by two days in the next two months, and by the end of the eight months
to only one and one-half days. Figure 3 suggests that, by then, insiders may have become less
g period.
5.
Analysis of stockbroker trades
In this section, we analyze the impact of the five stockbrokers’ trades and focus on how
financial markets and market makers react to insider trades. We ask if such trading is detected
and if market liquidity is improved or harmed in the process.
5.1.
Buying interest and interval returns
We first examine how order flow and returns are affected during and following periods of
insider trading. Table 4 provides a regression analysis for all 30 companies traded by the
access to the IWS co
4.3. Holding
period
As Sant and Zaman (1996) show, the returns from trading on the IWS c
their gains. Offsetting this incentive is that rapid turnover can arouse suspicion
authorities or the SEC.
Figure 3 shows that these stockbrokers slowly reduced their trading
eight months that they traded. In the first two months, the insiders held t
concerned with detection and so sought greater profits by shortening their holdin
- 14 -

stockbrokers (Panel A) and the 21-company subset that did not have other news announcements
on Wednesday or Thursday (Panel
Table 4
Table 4 uses two regression models to explain the Buyside index and interval returns. We
correct all regressions for heteroskedasticity using White’s (1980) method. Dummy variables
ects are captured
es are listed on the Amex. We combine them with the NYSE
com
ures the effect of
Nasdaq- versus exchange-listed stocks.
The first specification (Models 1 and 3 in Panel A; Models 5 and 7 in Panel B) includes
an “
kers are trading.
mpanies.
The second specification (Models 2 and 4 in Panel A; Models 6 and 8 in Panel B) omits
the “Insider Trading Period” dummy, but adds a dummy variable covering this period plus the
ble captures the
formed trading.
ers, or mimicking or
momentum traders who notice the presence of informed traders. Because the “Insider Trading
Period” and “Insider Period and Remaining Day” variables are highly correlated, we do not
include them in the same regressions. Lastly, an interaction term is included to capture the
effects of the Nasdaq dealer market on the “Insider Period and Remaining Day” variable.
Do stock orders respond to the IWS column? Table 4 shows that there is significant buy-
side interest on both Thursday and Friday relative to Wednesday. Model 1 suggests that buying
interest on Friday is more than three times the interest on Thursday (6.4 compared to 1.8). Model
B).
capture Thursday and Friday effects relative to Wednesday, and Wednesday eff
by the constant. Two compani
panies to form the set of exchange-listed stocks. The “Nasdaq” dummy capt
Insider Trading Period” dummy variable to measure the effects when the bro
Typically, their trades are completed within two 15-minute intervals. We also include an
interaction term to capture the differential effects of insider trading on Nasdaq co
remaining periods in the day. This “Insider Period and Remaining Day” varia
effects of other market participants who are learning of, or reacting to, the in
These participants may be relatives or customers of the stockbrok
- 15 -

5 shows a somewhat smaller Thursday-to-Friday increase for the 21 traded stocks without other
new
ng activity.
” dummy is not
ot causing order
imbalances, which is consistent with the fact that informed trading only makes up about 5% of
Models 2 and 6
t has by then become
awa
nt change. Thus,
ed trading.
Table 4 also shows that Nasdaq stocks exhibit significantly higher buying interest than do
exc
nificant, trading
finding may be
ler companies.
es, or the release
of the IWS information? Figure 2 shows that the price of the 21 traded stocks with no news starts
3, 4, 7, and 8 in
both the “Insider
cant. That is, the
ers start trading.
However, the “Insider Trading Period” dummy is statistically significant only at the 10% level
(Model 3) or at the 5% level (Model 7). This weak significance suggests that, perhaps more than
cause the market
price impacts. This observation refines Meulbroek (1992) and Cornell and Sirri (1992), who find
that abnormal returns are confined to the day or the period in which insiders illegally trade.
Figure 2 also shows that the prices of the traded stocks take a discrete jump between the
Thursday close and the Friday open. Thereafter, we see that Friday interval returns are volatile
and that some are even negative. The Friday dummy is negative in all of the return regressions,
s (5.4 compared to 2.7). Overall, the IWS column stimulates significant tradi
Are the trades of the stockbrokers detected? The “Insider Trading Period
significant in Models 1 and 5. That is, the brokers’ trading volume itself is n
Thursday volume. However, the “Insider Period and Remaining Day” variable in
shows that the Buyside index increases after informed trades, i.e., the marke
re of higher buying interest. The earlier part of Thursday shows no significa
the market does appear to detect unusual buying activity, at least after the inform
hange-listed securities. Although the effect during insider trading is not sig
volume increases for Nasdaq stocks after informed trades. The reason for this
that the IWS column has a greater effect on Nasdaq stocks, which are often smal
Do interval returns react to the stockbrokers’ trades, the follow-up trad
to increase after 1 PM on Thursday (the earliest time for insider trades). Models
Table 4 confirm that, although the Thursday dummy variable is not significant,
Trading Period” and “Insider Period and Remaining Day” dummies are signifi
regressions confirm that interval returns are positive on Thursday once the brok
the insiders, it may be mimicking traders not privy to the IWS information who
- 16 -

which verifies that the entire gain from the IWS information is impounded at the open on Friday
and
turns than do the
ummies and the
time-period dummies are not significant. Thus, the regressions tell us that there is nothing unique
Nasdaq- compared to exchange-listed stocks in the afternoon on Thursday.
ine
the number of trades and trade size. If these brokers’ trades are unusual, then market makers and
are comparable
across 15-minute
ysis. That is, we subtract
Wednesday’s average and then di
the same average to standardize these data. The daily
dum
om zero. Table 5
le 4.
es. These results
show significant increases in trading on Friday, with the number of trades on Friday significantly
greater than Wednesday’s trading. Trading also increases sharply on Thursday during the
“Insider Trading Period” or the “Insider Period and Remaining Day” intervals. This pattern is
notable because these stockbrokers do not trade a large fraction of the volume on Thursday. In
contrast to Meulbroek’s (1992) findings on trading effects, we find that even a relatively low
volume of trading can initiate large price effects, such as those in Figure 2. The number of trades
is also higher for Nasdaq- compared to exchange-listed stocks.
also implies that the overall price trend after the Friday open is downward.
Finally, the Nasdaq dummy shows that the Nasdaq stocks offer higher re
exchange-listed stocks. However, the interaction terms between the Nasdaq d
about the returns to
5.2. Volume
effects
To explore further how the five stockbrokers’ trades affect the price process, we exam
other investors may detect their trading more easily. To ensure that our results
across stocks, we standardize the dependent variables relative to their averages
intervals on Wednesday, and then omit Wednesday from the anal
vide by
mies are now different from Wednesday if they are significantly different fr
presents these regressions using the set of explanatory variables examined in Tab
Table 5
In Table 5, Models 1, 2, 5, and 6 explain the relative number of trad
- 17 -

In Table 5, Models 3, 4, 7, and 8 explain the results for relative trade s
stocks. These models show a negative, but generally insignificant, coefficient o
ize across traded
n Thursday and
Frid
ese regressions.
ers trade more
frequently on Thursday and that public investors follow the same pattern after the news becomes
known on Friday. The more frequent trading by stockbrokers in short time intervals may have
se informed trades.
A key question in this analysis is how market makers respond to insiders; that is, to what
ies, Cornell and
gnificant effect on spreads. By
using a cross-section of companies, we can investigate whether their findings generalize beyond
two NYSE-listed stocks. Table 6 shows the results for quoted and effective spreads; quoted
min
to their average
Wednesday) to
control for volume effects on spreads and depth. Panel A shows the results for all 30 traded
stocks, and Panel B shows the results for the subsample of 21 companies without other news.
show the spread
results. The coefficients on the Thursday and Friday dummy variables show that quoted spreads
are generally lower on both days, but effective spreads are 8% to 12% higher on Friday. These
results depend on whether the company is Nasdaq- or exchange-listed. Nasdaq companies have
higher quoted spreads, except during insider periods when the net effect is a 3% to 7% decrease.
Effective spreads generally show no difference for Nasdaq stocks except in Model 3 where they
ay. The relative trade size increases significantly only for Nasdaq stocks in th
Overall, our results indicate that the five brokers and their follow
helped market makers identify the
5.3.
Insider trades and market making
extent do bid-ask spreads and depth adjust to informed trading? In two case stud
Sirri (1992) and Chakravarty and McConnell (1997) find no si
us effective spreads; and ask and bid depths, using 15-minute interval data.
Table 6
As in Table 5, we standardize the dependent variables in Table 6 relative
values on Wednesday. Also, we add the relative volume of trading (versus
Models 1 through 4 (Panel A) and 10 through 13 (Panel B) in Table 6
- 18 -

decrease during insider trading. Although consistent with Cornell & Sirri (199
reduced spreads are not what w
2), unchanged or
e anticipate of market makers who detect informed traders, so we
exa
and 7 (Panel A)
and 15 and 16 (Panel B) show that insider trades significantly lower ask depth. Because insiders
odel 7 show that
exc
t in the 21-stock
affect bid depth.
et structure. For
Nasdaq-listed companies, the 30-stock estimates show a much smaller depth decrease during
) and the 21-stock estimates
sho
le in the context
et makes it more
.
Overall, market makers reduce risk by offering a smaller quantity of shares at the posted
ic
lts of Lee, Mucklow, and Ready (1993); Kavajecz
(19
ot expected, with
cks.
5.4.
Effects of order imbalances on market making
Chordia, Roll, and Subrahmanyam (2002) find that signed order imbalances affect bid-
might confound
our results. For example, the increase in order imbalances indicated by the Buyside index might
have caused quoted depth to decrease. Thus, market makers could be reacting to order
imbalances, not to informed order flow.
To control for this effect, we collect a sample of order imbalances matched to the actual
daily average imbalance on Thursday for the 30 traded stocks. This matched sample comprises
mine spreads more carefully below.
Table 6 also shows how insider trading affects market depth. Models 6
are buying shares, ask depth is the side affected. The 30-stock results in M
hange-listed depth rebounds late on Thursday, but this effect is less significan
results of Model 16. Models 8, 9, 17, and 18 confirm that their purchases do not
The strength of the depth results on the ask side depends on the mark
insider intervals (-1.4% compared to –35.7% for exchange-listed
w a reduced effect (-24% compared to –75.3%). This result is understandab
of a dealer versus specialist market, because the diffuse nature of a dealer mark
difficult for a given dealer to determine the information content of the order flow
pr e. This finding extends the depth resu
99); and Koski and Michaely (2000), to cases in which informed trading is n
the added distinction that Nasdaq stocks respond less than do exchange-listed sto
ask spreads. They report that order imbalances cause spreads to change, which
- 19 -

the same stocks traded by these brokers, but before they gained access to Busin
the SIAC data, we compute daily order imbalances from December 1994 to Ma
stock, we select the matching day to minimize the difference between the
imbalances on the actual and matched days. The resulting average absolute perc
9
ess Week. Using
y 1995. For each
percentage order
entage difference
is 6.8% (the median is 3.4%). To complete the control sample, we add one trading day on each
th the matching
ven though there
are statistically
insignificant). We use parameter estimates from the order-imbalance sample, and data from the
l in Table 6. By
al, we net out the
effe
essions for each
ing the observed
effects, we do not expect to find significant insider-period variables in the adjusted regressions.
and also for the
ce improvement.
nsider Trading Period”
var
emaining Day”)
show similar results. Adjusted Models 6 and 15 confirm our previous results on depth. After we
remove the order imbalance effect, we continue to find a statistically significant decrease in ask
reduced.
The important difference in these adjusted results is for the spread effects. In Adjusted
Models 1, 3, 10, and 12, we find that both quoted and effective spreads increase during insider
trading periods. This new result is confined to exchange-listed stocks, because the Nasdaq
side of the matched day, which provides a 3-day sequence for each stock.
We then re-estimate the regression models for depth and spreads wi
sample. We include insider period variables just as if there is insider trading, e
should be none in this sample (consistent with this intuition, insider variables
actual insider trading sample, to predict the dependent variable in each mode
subtracting these predictions from the actual values in each 15-minute interv
ct of order imbalances on these variables. We then re-estimate the regr
model, using these adjusted dependent variables. If order imbalances are caus
Table 6 shows the adjusted regression results for spreads and depth,
difference between quoted and effective spreads, which tests for changes in pri
We report these results for the first specification, which includes the “I
iable alone. Estimates for the second specification (“Insider Trading and R
depth during periods of insider trading, although its magnitude is now markedly
9
Two stocks did not have close matches, which caused some skewness. Excluding these two stocks did little to
change the analysis, so they remain in the control sample for completeness.
- 20 -

interaction term more than offsets the effect in each regression. This finding is consistent with
info
daq dealers.
less willing to
provide price improvement. Indeed, adjusted Models 5 and 14 show that price improvement
to exchange-listed stocks.
Overall, the adjusted spread results indicate that the findings of Cornell and Sirri (1992) and
ha
on spreads may only generalize to Nasdaq stocks.
5.5.
A comparison with nontraded stocks
. In that sample,
kers have access to
the
raded companies
o construct two
hypothetical dummy variables to capture the time that the insiders were likely to have traded.
The results of estimating regressions on the nontraded sample confirm that there were no
stocks. In each case, whether it be spreads or depth, the
hyp
nothing unusual
et.
5.6.
Unbundling Liquidity Providers
The data available for this study do not show who is trading with whom. Therefore, we
cannot separate liquidity providers into market makers and limit-order traders to determine
which group is adjusting to informed trades. It is possible that the informed trades exhaust the
inside limit orders and that market makers are left quoting their own commitment, which may be
unchanged. In this event, spreads may change by only a small amount if market makers have not
rmed traders being more easily recognized by NYSE specialists than by Nas
The adjusted effective spreads react more than adjusted quoted spreads, and the increase
is also more significant. These observations suggest that market makers are
decreases during insider trading. This last result is largely confined
C kravarty and McConnell (1997)
The nontraded-stock sample provides a robustness check of our results
we do not expect to observe any changes in market making when these bro
IWS column. To test for any effects, we estimate regressions for the 44 nont
that had no other news announcement on Wednesday or Thursday. We als
market-making effects on these
othetical insider trading period dummies are not significant. Thus, there is
about these nontraded stocks during the time that the stockbrokers are in the mark
- 21 -

detected informed trading, but depth will certainly decrease. Although we cannot completely rule
out
kely.
sdaq stocks and
on Nasdaq and
16,395 shares on the exchanges. With depth for exchange-listed stocks about 5.8 times the depth
reaction in depth
wever, Models 6
on Nasdaq. The
brokers is 1,000
shares for both Nasdaq- and exchange-listed stocks. The median depth is 2,732 shares on Nasdaq
on the exchanges. Thus, it appears that specialists on the exchanges are
play
Using a unique episode of repeated insider trading across a group of Nasdaq- and
ends on market
ted depth and increase spreads during
per
but less than in
ngs indicate that
specialist markets are better able to detect informed trading, and that quoted depth is an
important tool used by liquidity providers to adjust to informed traders.
immediately following periods when insiders are buying
shares, trades are much more numerous than at other times. These results show that trades during
those periods are overwhelmingly buyer-initiated. In contrast to earlier studies, we find that
insiders’ trades do not account for the major fraction of the trading volume increase. Our
evidence suggests that the volume increase likely reflects an increase in noise trading by falsely
informed or mimicking and momentum traders.
this possibility, a comparison of dealer and specialist markets makes it less li
Together, the five stockbrokers’ average trade size is 1,654 shares in Na
2,064 shares in exchange-listed stocks. The average ask depth is 2,809 shares
for Nasdaq stocks and generally similar trade sizes, we would expect a greater
on Nasdaq if the stockbrokers’ trades are only exhausting inside limit orders. Ho
and 15 in Table 6 show that depth on the exchanges reacts more than does depth
median results provide the same conclusions. The median trade size by stock
and 10,915 shares
ing an active role in managing quoted depth during these insider periods.
6. Conclusion
exchange-listed stocks, we show that the reaction to informed trading dep
structure. For specialist markets, market makers reduce quo
iods of informed trading. For dealer markets, quoted depth also decreases
specialist markets, and there is no observable increase in spreads. Our findi
We also show that, during and
- 22 -

References
Barber, B.M., Loeffler, D., 1993. The ‘Dartboard’ column: second-hand information and price pressure.
q: an examination
0.
market reform on
depths of Nasdaq stocks. Journal of Finance 54 (1), 1-34.
mination of analysts' recommendations. Journal of
Business 64 (3), 393-416.
n and equity trading costs. Journal of Financial
Bessembinder, H., 1999. Trade execution costs on Nasdaq and the NYSE: a post-reform comparison.
Bessembinder, H., Kaufman, H.M., 1997. A cross-exchange comparison of execution costs and
3-319.
YSE and Nasdaq-
titative Analysis 32 (3), 287-310.
surrounding Ivan Boesky's illegal trading in Carnation's stock. Financial Management 26 (2), 18-34.
ove stock prices? Journal of
brahmanyam, A., 2002. Order imbalance, liquidity, and market returns. Journal
of Financial Economics 65 (1), 111-130.
mechanisms
rice, trading activity and execution costs. Journal of Finance 57 (3), 1443-1478.
B.F., Van Ness, R.A., 2001. Can the treatment of limit orders reconcile the
differences in trading costs between NYSE and Nasdaq issues? Journal of Financial and Quantitative
Clyde, P., Schultz, P., Zaman, M., 1997. Trading costs and exchange delisting: the case of firms that
voluntarily move from the American Stock Exchange to Nasdaq. Journal of Finance 52 (5), 2103-
2112.
Cornell, B., Sirri, E.R., 1992. The reaction of investors and stock prices to insider trading. Journal of
Finance 47 (3), 1031-1059.
Corwin, A.S., Lipson, M.L., 2000. Order flow and liquidity around NYSE trading halts. Journal of
Finance 55 (4), 1771-1801.
Journal of Financial and Quantitative Analysis 28 (2), 273-284.
Barclay, M.J., 1997. Bid-ask spreads and the avoidance of odd-eighth quotes on Nasda
of exchange listings. Journal of Financial Economics 45 (1), 35-6
Barclay, M.J., Christie, W.G., Harris, J.H., Kandel, E., Schultz, P.H., 1999. Effects of
the trading costs and
Beneish, D.M., 1991. Stock prices and the disse
Bessembinder, H., 1997. The degree of price resolutio
Economics 45 (1), 9-34.
Journal of Financial and Quantitative Analysis 34 (3), 387-407.
information flow for NYSE-listed stocks. Journal of Financial Economics 46 (3), 29
Bessembinder, H., Kaufman, H.M., 1997. A comparison of trade execution costs for N
listed stocks. Journal of Financial and Quan
Chakravarty, S., McConnell, J.J., 1997. An analysis of prices, bid/ask spreads, and bid and ask depths
Chakravarty, S., McConnell, J.J., 1999. Does insider trading really m
Financial and Quantitative Analysis 34 (2), 191-209.
Chordia, T., Roll, R., Su
Christie, W.G., Corwin, A.S., Harris, J.H., 2002. Nasdaq trading halts: the impact of market
on p
Chung, K.H., Van Ness,
Analysis 36 (2), 267-286.
- 23 -

Dupont, D., 2000. Market making, prices, and quantity limits. Review of Financial Studies 13 (4), 1129-
Easley, D., O’Hara, M., 1992. Time and the process of security price adjustment. Journal of Finance 57
In: Hirschey, M.,
ess, Greenwich, CT, 37-57.
nalysis of insider
in the Journal of Financial and Quantitative Analysis.
e monopolist specialist. Journal of
Business 62 (2), 211-235.
and transaction prices in a specialist market with
Greene, J., Smart, S., 1999. Liquidity provision and noise trading: evidence from the ‘Investment
end mutual funds.
ets: an analysis of
tive Analysis 37 (3), 391-424.
ion markets: a paired comparison of execution costs on
Nasdaq and the NYSE. Journal of Financial Economics 41 (3), 313-357.
1994. Intraday changes in target firms’ share price and bid-ask quotes around takeover
Kavajecz, K.A., 1998. A specialist’s quoted depth as a strategic choice variable. Working paper, The
of Finance 54 (2),
gs announcements. Journal of
Accounting and Economics 17, (1-2), 41-67.
trades. Review of
Financial Studies 13 (3), 659-696.
Krinsky, I., Lee, J., 1996. Earnings announcements and the components of the bid-ask spread. Journal of
Finance 51 (4), 1523-1535.
Kyle, A.S., 1985. Continuous auctions and insider trading. Econometrica 53 (6), 1315-1335.
LaPlante, M., Muscarella, C.J., 1997. Do institutions receive comparable execution in the NYSE and
Nasdaq markets? A transaction study of block trades. Journal of Financial Economics 45 (1), 97-134.
1151.
(2), 577-605.
Foster, F.D., Vishwanathan, S., 1995. Trading costs for target firms around takeovers.
Marr, M.W. (Eds.), Advances in Financial Economics, JAI Pr
Garfinkel, J.A., Nimalendran, M., 2002. Market structure and trader anonymity: an a
trading. Forthcoming
Glosten, L.R., 1989. Insider trading, liquidity and the role of th
Glosten, L.R., Milgrom, R.P., 1985. Bid, ask
heterogeneously informed traders. Journal of Financial Economics 14, 71-100.
Dartboard’ column. Journal of Finance 54 (5), 1885-1899.
Greene, J.T., Hodges, C.W., 2002. The dilution impact of daily fund flows on open-
Journal of Financial Economics 65 (1), 131-158.
Heidle, H.G., Huang, R.D., 2002. Information-based trading in dealer and auction mark
exchange listings. Journal of Financial and Quantita
Huang, R.D, Stoll, R.H., 1996. Dealer versus auct
Jennings, R.,
announcements. Journal of Financial Research 17 (2), 255-270.
Wharton School of the University of Pennsylvania, May.
Kavajecz, K.A., 1999. A specialist’s quoted depth and the limit order book. Journal
747-771.
Kim, O., Verrecchia, E.R., 1994. Market liquidity and volume around earnin
Koski, J. Lynch, Michaely, R., 2000. Prices, liquidity, and the information content of
- 24 -

Lee, C.M.C., Ready, M.J., 1991. Inferring trade direction from intraday data. Journal of Finance, 45, 733-
Lee, C.M.C., Mucklow, B., Ready, M.J., 1993. Spreads, depths, and the impact of earnings information:
iness 72 (1), 119-
ournal’s securities
urnal of Financial and Quantitative Analysis 25 (3), 399-410.
Lloyd-Davies, P., Canes, M., 1979. Stock prices and the publication of second-hand information. Journal
Madhavan, A., 2000. Market microstructure: a survey. Journal of Financial Markets 3, 205-258.
Meulbroek, L.K., 1992. An empirical analysis of illegal insider trading. Journal of Finance 47 (5), 1661-
Palmon, O., Sun, H.-L., Tang, A.P., 1994. The Impact of Publication of Analysts’ Recommendations on
n the street: the effect of takeover rumors in stock
prices, Journal of Business, 63 (3), 291-308.
Business Week ‘Inside Wall Street’ column: a self-
Stoll, H.R., 2000. Friction. Journal of Finance 55 (4), 1479-1514.
Weston, J.P., 2000. Competition on the Nasdaq and the impact of recent market reforms. Journal of
Finance, 55 (6), 2565-2598.
White, H., 1980. A heteroscedasticity-consistent covariance matrix estimator and a direct test for
heteroscedasticity. Econometrica 48, 817-838.
746.
an intraday analysis. Review of Financial Studies 6 (2), 345-374.
Liang, B., 1999. Price pressure: evidence from the ‘Dartboard’ Column. Journal of Bus
134.
Liu, P., Smith, S.D., Syed, A.A., 1990. Stock price reactions to the Wall Street J
recommendations. Jo
of Business 51 (1), 43-56.
1699.
Returns and Trading Volume, Financial Review, 29 (3), 395-417.
Pound, J.A., Zechauser, R.J., 1990. Clearly heard o
Sant, R., Zaman, M.A., 1996. Market reaction to
fulfilling prophecy. Journal of Banking and Finance 20 (4), 617-643.
- 25 -

Business Week Sentiment
Buy
Sell
Buy
Sell
Count
30
0
72
4
Percent
100.0%
0.0%
94.7%
5.3%
Mentioned in Another News Source?
Yes
No
Yes
No
Count
9
21
22
54
Percent
30.0%
70.0%
28.9%
71.1%
Exchange Listed
NYSE / AMEX
Nasdaq
NYSE / AMEX
Nasdaq
Count
12 / 2
16
38 / 6
32
Percent
45.2%
54.8%
57.9%
42.1%
Rate of Return on Assets
1994
1995
1994
1995
Average (Median)
-3.5% (1.6%) -0.8% (1.8%)
3.1% (3.6%)
-1.2% (3.8%)
Standard Deviation
18.4%
10.1%
12.5%
44.0%
Rate of Return on Equity
Average (Median)
-1.1% (4.7%)
4.6% (3.6%)
13.8% (11.2%) -22.4% (11.5%)
Standard Deviation
24.8%
17.6%
55.2%
221.2%
Sales (millions of dollars)
Average (Median)
1529.9 (218.3) 1713.4 (364.3)
3022.2 (261)
3383.2 (297.3)
Standard Deviation
3604.1
4066.6
8925.1
10184.0
Total Assets (millions of dollars)
Average (Median)
2294.6 (374.2) 2401.8 (357.7)
8825.8 (413.9)
8978.4 (406.5)
Standard Deviation
6055.6
6220.0
29279.4
32960.4
Growth Rate of Sales (1994-1995)
Average (Median)
Standard Deviation
Two-Day Return (Thursday & Friday)
Average (Median)
Standard Deviation
Table 1
8.17% (7.82%)
Traded
Nontraded
The table presents summary data for 30 companies traded by insiders and 76 nontraded companies mentioned
in Business Week's "Inside Wall Street" column. We searched the Dow Jones News Retrieval Service for
mention of these stocks in another news source on the insider trading day or the day before. We obtained
financial data from Compustat, which provided data on 20 traded and 60 nontraded companies. The two-day
return data are for Thursday and Friday combined.
33.2% (17.5%)
32.7% (21.3%)
58.9%
3.66% (3.08%)
12.1%
Characteristics of traded and nontraded companies mentioned by Business Week
49.1%
17.9%

Variable
Mean
Median
Mean
Median
Mean
Median
Mean
Median
Stock Price
19.75
14.50
19.26
13.42
19.55
14.00
20.62
15.22
Quoted Spread
0.25
0.20
0.25
0.19
0.25
0.19
0.26
0.21
Effective Spread
0.13
0.10
0.15
0.11
0.13
0.10
0.12
0.09
Bid Depth (100s)
65
35
66
34
63
40
66
34
Ask Depth (100s)
89
38
86
41
80
35
100
39
Trade Count
12.6
7.0
8.3
5.0
10.5
7.0
17.1
9.0
Trade Size
1664
1589
1735
1591
1704
1679
1550
1519
Interval Volume
20147
9500
14153
7200
18345
9000
25616
11854
Interval Returns (%)
0.1021
0.0233
0.0831
0.0000
0.2139
0.0998
0.0063
-0.0312
Buyside Index
3.80
2.25
1.22
1.11
3.09
2.54
7.20
4.15
Stock Price
17.93
13.13
17.39
12.62
17.83
13.13
18.57
13.35
Quoted Spread
0.28
0.22
0.28
0.23
0.27
0.21
0.28
0.23
Effective Spread
0.15
0.11
0.16
0.13
0.15
0.11
0.13
0.10
Bid Depth (100s)
46
27
42
27
40
26
54
29
Ask Depth (100s)
60
32
51
31
54
28
76
3
Trade Count
11.6
6.0
6.7
4.0
10.8
6.0
15.1
8.0
Trade Size
1712
1618
1751
1393
1771
1728
1615
1577
Interval Volume
19979
9696
11005
6000
19445
9900
25610
11904
Interval Returns (%)
0.1469
0.0496
0.1044
0.0000
0.3494
0.2598
-0.0132
-0.0377
Buyside Index
3.90
2.75
1.45
1.13
3.74
3.33
6.50
4.61
Stock Price
22.63
16.93
22.36
16.65
22.45
16.71
23.08
17.28
Quoted Spread
0.26
0.20
0.26
0.19
0.25
0.20
0.27
0.21
Effective Spread
0.14
0.09
0.14
0.10
0.15
0.10
0.13
0.09
Bid Depth (100s)
68
10
60
11
71
10
71
10
Ask Depth (100s)
73
14
74
15
64
13
81
1
Trade Count
17.1
8.0
13.2
7.0
12.9
7.0
23.2
11.0
Trade Size
1584
1305
1998
1437
1399
1165
1355
1364
Interval Volume
29150
9605
27529
8602
22126
8498
35490
12200
Interval Returns (%)
0.0576
0.0020
0.0328
0.0000
0.0673
-0.0043
0.0727
0.0676
Buyside Index
4.14
1.60
2.30
1.15
2.06
1.15
8.07
3.10
Panel C: 44 Nontraded stocks without any other news
Panel B: 21 Traded stocks without any other news
This table presents the average and median values for variables and samples in this study. We compute these
data for all trading days and separately for Wednesday, Thursday, and Friday. The transaction data are
summarized into 15-minute intervals with the average shown computed across these intervals. Panel A
summarizes information for all 30 stocks traded by the five brokers with access to advance copies of Business
Week magazine. Panel B is for a subset of 21 traded stocks that had no other news announced on Wednesday or
Thursday. Panel C shows information for 44 nontraded companies mentioned in Business Week that did not have
any other news on Wednesday or Thursday. Missing transaction data for an additional four nontraded, no-news
companies ruled out their inclusion in Panel C.
Descriptive statistics of the transaction data
Table 2
Panel A: 30 Stocks traded by insiders
All Days
Wednesday
Thursday
Friday
6
5

Wednesday
Thursday
Friday
Average Abnormal Return
0.64%
0.27%
4.75%
Asymptotic Normal
J
2 Test
1.62
0.68
12.05**
Percent Positive Abnormal Returns
53.09%
56.79%
70.31%
Asymptotic Normal Z-test
0.56
1.22
3.67**
Average Abnormal Return
0.77%
1.51%
3.87%
Asymptotic Normal
J
2 Test
1.99
3.90**
10.01**
Percent Positive Abnormal Returns
46.38%
47.83%
78.26%
Asymptotic Normal Z-test
-0.61
-0.36
4.69**
Panel B: "During" period sample of 69 companies
Table 3
Average abnormal returns on Wednesday, Thursday, and Friday for companies
mentioned in Business Week's "Inside Wall Street" column
We compute average abnormal returns using a market model for stocks mentioned in Business Week.
Our first period is between November 7, 1994 to May 29, 1995, which is before the "Inside Wall
Street" column became available ahead of publication. Our second period is June 5, 1995 to January
29, 1996, which is during the period of insider trading. The column is publicly released after the close
on Thursday. We exclude stocks with other news announcements on Wednesday or Thursday from
these samples. Our results use the equal-weighted CRSP index to measure overall market returns.
Results that are statistically significant at the 99% level of confidence are shown with an "**".
Panel A: "Before" period sample of 81 companies

Variables
Model 1
Model 2
Model 3
Model 4
Model 5
Model 6
Model 7
Model 8
Constant
-0.077
0.005
0.001
0.001
0.695
0.985
0.000
0.001
(0.846)
(0.989)
(0.312)
(0.160)
(0.118)
(0.036)
(0.544)
(0.341)
Thursday
1.845
0.061
0.000
-0.001
2.657
0.371
0.001
-0.001
(0.000)
(0.893)
(0.749)
(0.144)
(0.000)
(0.493)
(0.276)
(0.676)
Friday
6.425
6.441
-0.001
-0.001
5.372
5.383
-0.002
-0.002
(0.000)
(0.000)
(0.088)
(0.095)
(0.000)
(0.000)
(0.086)
(0.088)
Insider Trading Period
2.832
0.007
4.647
0.017
(0.256)
(0.071)
(0.386)
(0.040)
Insider Period and Remaining Day
3.489
0.003
2.362
0.003
(0.000)
(0.003)
(0.014)
(0.063)
Nasdaq Dummy
4.435
4.256
0.000
0.001
2.506
2.057
0.002
0.002
(0.000)
(0.000)
(0.014)
(0.050)
(0.000)
(0.001)
(0.026)
(0.085)
Nasdaq*Insider Period
-0.564
-0.002
-1.639
-0.012
(0.852)
(0.736)
(0.772)
(0.213)
Nasdaq*Insider & Remaining Day
1.887
0.003
4.416
0.003
(0.197)
(0.225)
(0.006)
(0.287)
Adjusted R-Squared
0.083
0.093
0.008
0.014
0.056
0.076
0.014
0.016
F-test of Regression (p-value)
(0.000)
(0.000)
(0.005)
(0.000)
(0.000)
(0.000)
(0.001)
(0.001)
Observations
1572
1572
1572
1572
1036
1036
1036
1036
Table 4
Buying sentiment and interval returns on Wednesday, Thursday, and Friday
Interval Returns
Buyside Index
Interval Returns
Buyside Index
Panel A: 30 Stocks traded by insiders
Panel B: 21 Traded stocks without any other news
In Panel A, we compute regressions for IWS stocks traded by brokers for all companies combined. In Panel B, we exclude nine companies that had
other news announcements on Wednesday or Thursday. We analyze transactions data in 15-minute intervals on Wednesday, Thursday, and
Friday. Trades are signed with the Lee-Ready algorithm (+1 for buyer initiated and -1 for seller initiated). The "Buyside I ndex" measures buying
sentiment as the sum of the signed trades in the interval, which is also a measure of order imbalances. We compute "Interval Returns" from the last
trade in the previous interval to the last trade in the present interval. The independent variables are: "Thursday" and "Friday" are dummy variables
for these days; "Insider Trading Period" is a dummy variable for intervals of insider trading; "Insider Period and Remaining Day" equals one on
Thursday for all intervals after the first insider trade; and "Nasdaq" is a dummy variable for Nasdaq stocks, which is zero for exchange-listed stocks.
The two interaction terms measure the effect of insider trading on Nasdaq stocks. Regressions are corrected for heteroskedasticity using White's
(1980) method. The p-values are shown in parentheses below the coefficients.

Variables
Model 1
Model 2
Model 3
Model 4
Model 5
Model 6
Model 7
Model 8
Thursday
0.172
-0.329
0.029
-0.038
0.842
0.265
-0.030
-0.109
(0.234)
(0.059)
(0.589)
(0.601)
(0.000)
(0.272)
(0.631)
(0.280)
Friday
2.138
2.134
-0.008
0.037
2.136
2.236
-0.103
-0.049
(0.000)
(0.000)
(0.878)
(0.516)
(0.000)
(0.000)
(0.079)
(0.411)
Insider Trading Period
2.206
0.513
4.681
0.144
(0.051)
(0.055)
(0.034)
(0.595)
Insider Period and Remaining Day
1.308
0.099
1.021
0.027
(0.000)
(0.322)
(0.008)
(0.817)
Nasdaq Dummy
1.631
1.637
0.170
0.088
0.624
0.475
0.355
0.274
(0.000)
(0.000)
(0.010)
(0.212)
(0.008)
(0.091)
(0.000)
(0.001)
Nasdaq*Insider Period
-1.691
-0.303
-3.865
-0.049
(0.176)
(0.359)
(0.089)
(0.886)
Nasdaq*Insider & Remaining Day
-0.037
0.417
0.907
0.432
(0.943)
(0.014)
(0.126)
(0.017)
Adjusted R-Squared
0.079
0.086
0.006
0.002
0.042
0.051
0.020
0.034
F-test of Regression (p-value)
(0.000)
(0.000)
(0.029)
(0.000)
(0.000)
(0.000)
(0.001)
(0.000)
Observations
1134
1134
1134
1134
762
762
762
762
Table 5
Effects of insider trades on number of trades and trade size
Trade Size
Number of Trades
Trade Size
Number of Trades
Panel A: 30 Stocks traded by insiders
Panel B: 21 Traded stocks without any other news
We compute regressions for IWS stocks traded by insiders using transactions data analyzed in 15-minute intervals on Wednesday, Thursday (the
insider trading day), and Friday. Panel A shows the results with all 30 stocks. Panel B shows results excluding nine stocks that had other news
announcements on either Wednesday or Thursday. All dependent variables are standardized relative to the average over 15-minute intervals on
Wednesday, the day before any inside information was obtained. The "Number of Trades" is the total number of transactions during the interval and
"Trade Size" is the average volume of shares traded during the interval. The independent variables are: "Thursday" and "Friday" are dummy
variables for these days, "Insider Trading Period" is a dummy variable for intervals of insider trading; "Insider Period and Remaining Day" equals one
on Thursday for all intervals after the first insider trade; and "Nasdaq" is a dummy variable for Nasdaq stocks, which is zero for exchange-listed
stocks. All regressions are corrected for heteroskedasticity using White's (1980) correction method. The p-values are shown in parentheses below
each estimated coefficient.

Quoted -
Effective
Adjusted
Adjusted
Adjusted
Adjusted
Adjusted
Variables
Model 1 Model 2 Model 1
Model 3 Model 4 Model 3
Model 5
Model 6 Model 7 Model 6
Model 8 Model 9 Model 8
Thursday
-0.062
-0.058
-0.109
0.001
0.003
0.052
-0.161
0.135
-0.074
-0.453
0.303
0.195
-0.026
(0.000)
(0.009)
(0.000)
(0.943)
(0.921)
(0.009)
(0.000)
(0.019)
(0.119)
(0.000)
(0.000)
(0.002)
(0.691)
Friday
-0.033
-0.025
-0.045
0.084
0.086
0.128
-0.173
0.407
0.378
-0.469
0.285
0.285
-0.074
(0.013)
(0.058)
(0.001)
(0.000)
(0.000)
(0.000)
(0.000)
(0.000)
(0.000)
(0.000)
(0.000)
(0.000)
(0.104)
Insider Trading Period
0.025
0.092
0.091
0.216
-0.124
-0.357
-0.191
0.061
-0.787
(0.592)
(0.050)
(0.179)
(0.002)
(0.074)
(0.017)
(0.000)
(0.759)
(0.110)
Insider Period and Remaining Day
-0.024
0.003
0.456
0.230
(0.429)
(0.931)
(0.001)
(0.124)
Nasdaq Dummy
0.095
0.018
0.129
-0.008
-0.012
-0.070
0.199
-0.116
-0.063
0.572
-0.221
-0.221
0.168
(0.000)
(0.001)
(0.000)
(0.746)
(0.655)
(0.005)
(0.000)
(0.037)
(0.027)
(0.000)
(0.000)
(0.000)
(0.002)
Nasdaq*Insider Period
-0.167
-0.179
-0.253
-0.327
0.148
0.459
0.035
-0.016
0.812
(0.046)
(0.033)
(0.018)
(0.002)
(0.143)
(0.017)
(0.674)
(0.949)
(0.001)
Nasdaq*Insider & Remaining Day
0.049
-0.017
-0.135
0.046
(0.307)
(0.775)
(0.373)
(0.774)
Relative Volume
0.008
0.007
0.012
-0.003
-0.003
-0.006
0.017
0.007
-0.003
-0.089
0.064
0.057
0.064
(0.286)
(0.350)
(0.134)
(0.810)
(0.839)
(0.686)
(0.167)
(0.766)
(0.896)
(0.000)
(0.004)
(0.009)
(0.004)
Adjusted R-Squared
0.018
0.017
0.041
0.008
0.006
0.016
0.072
0.022
0.041
0.419
0.016
0.026
0.023
F-test of Regression (p-value)
(0.000)
(0.000)
(0.000)
(0.009)
(0.033)
(0.000)
(0.000)
(0.000)
(0.000)
(0.000)
(0.000)
(0.000)
(0.000)
Panel A: 30 stocks traded by insiders
Quoted Spread
Table 6
Effects of insider trades on market makers, spreads, and depth
Effective Spread
Ask Depth
Bid Depth
We compute regressions for IWS stocks traded by insiders using transactions data analyzed in 15 minute intervals. Panel A shows results for all 30 stocks (1,134 observations) while
Panel B shows results excluding 9 stocks (762 observations) with other news on either Wednesday or Thursday. "Quoted Spread" is the average bid-ask spread during the interval.
"Effective Spread" equals two times the absolute value of the difference between price and the midpoint of the bid-ask spread, averaged over the interval. "Depth" is reported at the best
bid and offer averaged over the interval. For Nasdaq stocks, depth is aggregated across all market makers quoting at the best bid or ask. All dependent variables are standardized relative
to the average over 15-minute intervals on Wednesday. "Relative Volume" equals the volume in the trading interval relative to the average volume across all 15-minute intervals on
Wednesday. Adjusted models correct for order imbalances by netting predicted effects from each dependent variable. White's (1980) method is used to correct for heteroskedasticity. p-
values are shown in parentheses below each estimated coefficient.

Quoted -
Effective
Adjusted
Adjusted
Adjusted
Adjusted
Adjusted
Model 10 Model 11 Model 10
Model 12 Model 13 Model 12
Model 14
Model 15 Model 16 Model 15
Model 17 Model 18 Model 17
Thursday
-0.128
-0.175
-0.227
-0.009
-0.028
-0.034
-0.194
0.414
0.168
-0.793
0.395
0.170
-0.159
(0.000)
(0.000)
(0.000)
(0.758)
(0.491)
(0.237)
(0.000)
(0.000)
(0.048)
(0.000)
(0.000)
(0.026)
(0.120)
Friday
-0.035
-0.035
-0.055
0.124
0.121
0.116
-0.171
0.510
0.451
-0.763
0.348
0.313
-0.228
(0.072)
(0.074)
(0.004)
(0.000)
(0.000)
(0.000)
(0.000)
(0.000)
(0.000)
(0.000)
(0.000)
(0.000)
(0.002)
Insider Trading Period
0.073
0.140
0.069
0.376
-0.236
-0.753
-0.076
-0.179
-1.180
(0.285)
(0.039)
(0.537)
(0.001)
(0.046)
(0.000)
(0.026)
(0.534)
(0.195)
Insider Period and Remaining Day
0.075
0.038
-0.267
0.377
(0.092)
(0.501)
(0.088)
(0.083)
Nasdaq Dummy
0.163
0.164
0.221
0.017
0.021
-0.002
0.221
-0.358
-0.268
0.889
-0.299
-0.245
0.310
(0.000)
(0.000)
(0.000)
(0.598)
(0.561)
(0.995)
(0.000)
(0.000)
(0.000)
(0.000)
(0.000)
(0.001)
(0.000)
Nasdaq*Insider Period
-0.196
-0.256
-0.208
-0.471
0.216
0.871
-0.006
0.266
1.261
(0.050)
(0.011)
(0.147)
(0.001)
(0.084)
(0.000)
(0.949)
(0.415)
(0.000)
Nasdaq*Insider & Remaining Day
0.012
-0.031
-0.121
-0.024
(0.840)
(0.676)
(0.564)
(0.917)
Relative Volume
-0.012
-0.015
-0.011
-0.015
-0.015
-0.008
-0.003
0.042
0.035
-0.038
0.061
0.051
0.064
(0.252)
(0.180)
(0.306)
(0.460)
(0.464)
(0.712)
(0.834)
(0.161)
(0.245)
(0.000)
(0.021)
(0.045)
(0.015)
Adjusted R-Squared
0.047
0.050
0.107
0.018
0.017
0.024
0.071
0.032
0.041
0.543
0.019
0.035
0.046
F-test of Regression
(0.000)
(0.000)
(0.000)
(0.002)
(0.003)
(0.000)
(0.000)
(0.000)
(0.000)
(0.000)
(0.001)
(0.000)
(0.000)
Quoted Spread
Effective Spread
Ask Depth
Bid Depth
Panel B: 21 Traded stocks without any other news
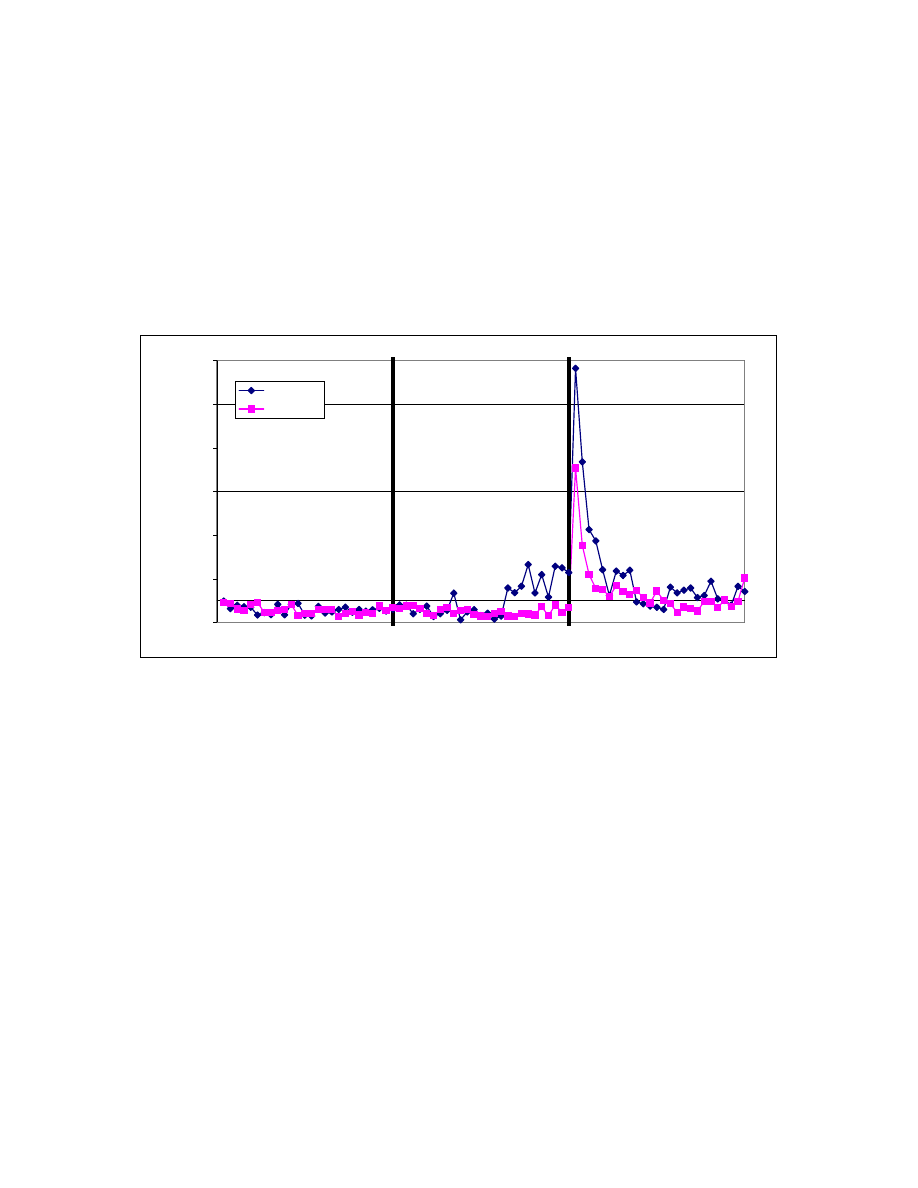
dnesday preceding
agazine is publicly
me on Wednesday.
e 44 that no insider
e only stocks not mentioned in another
news source on the insider trading day (Th) or the day before (W). The two vertical lines represent the
end of the first (W) and second (Th) trading days. The arrow indicates the 15-minute interval ending at
1:00 PM on Thursday, the earliest starting time for insider trades in the sample.
Figure 1
Three-day median volume changes
This figure shows the median percentage trading volume from the open on the We
the release of the relevant IWS column until the close on the Friday when the m
released. We measure these data in 15-minute intervals relative to the average volu
This plot shows the 21 stocks that at least one of the brokers traded (traded), and th
traded according to the SEC complaint (non-traded). We includ
-100%
100%
300%
500%
700%
900%
1100%
Median Change v. Avg. Wednesday
traded
non-traded
Friday
Thursday
Wednesday
↑
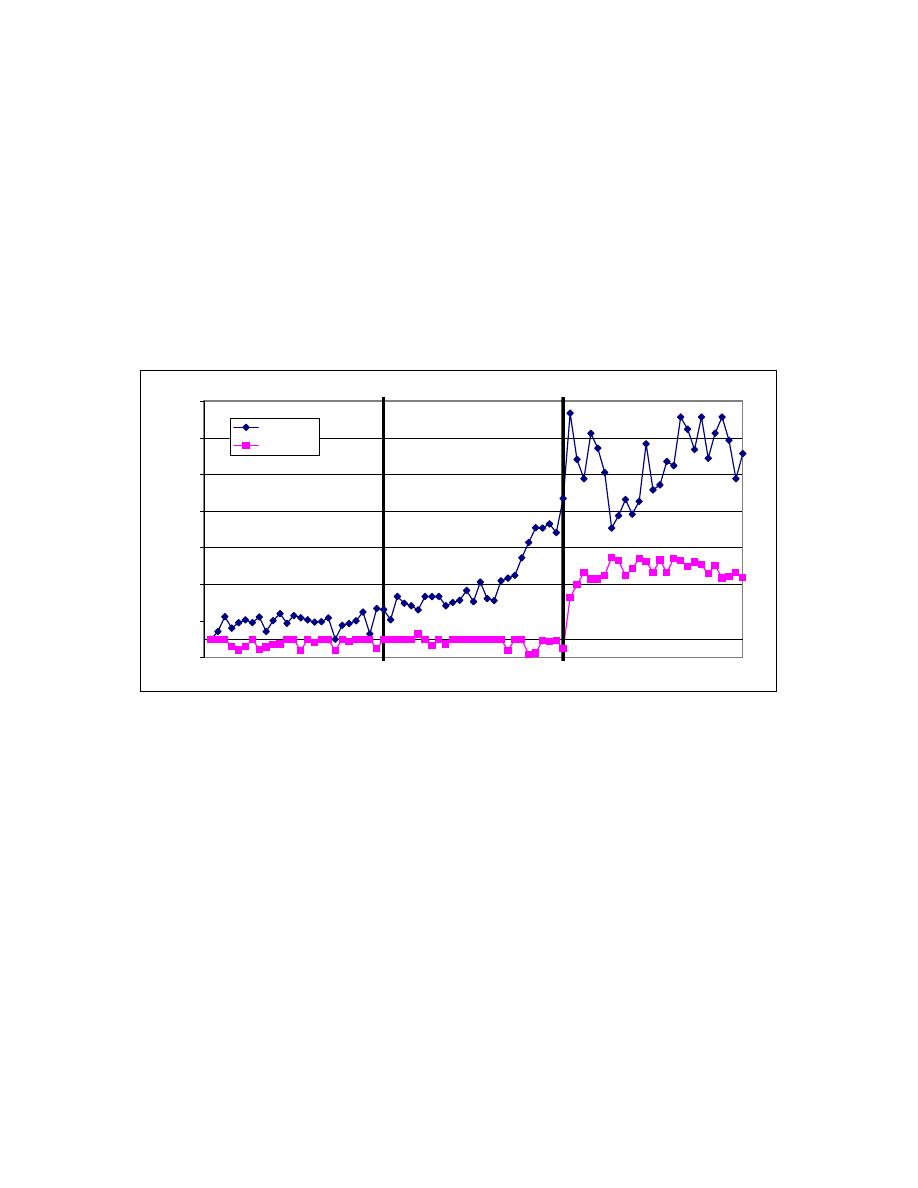
sday preceding the
s publicly released.
dnesday. This plot
no insider traded
ks not mentioned in another news
source on the insider trading day (Th) or the day before (W). The two vertical lines represent the end of
the first (W) and second (Th) trading days. The arrow indicates the 15-minute interval ending at 1:00
PM on Thursday, the earliest starting time for insider trades in the sample.
Figure 2
Three-day median price changes
This figure shows the median percentage price change from the open on the Wedne
release of the relevant IWS column until the close on the Friday when the magazine i
We measure these data in 15-minute intervals relative to the average price on We
shows the 21 stocks that at least one of the brokers traded (traded), and the 44 that
according to the SEC complaint (non-traded). We include only stoc
-1%
1%
3%
5%
7%
9%
11%
13%
Median Change v. Avg. Wednesday
traded
non-traded
Wednesday
Thursday
Friday
↑
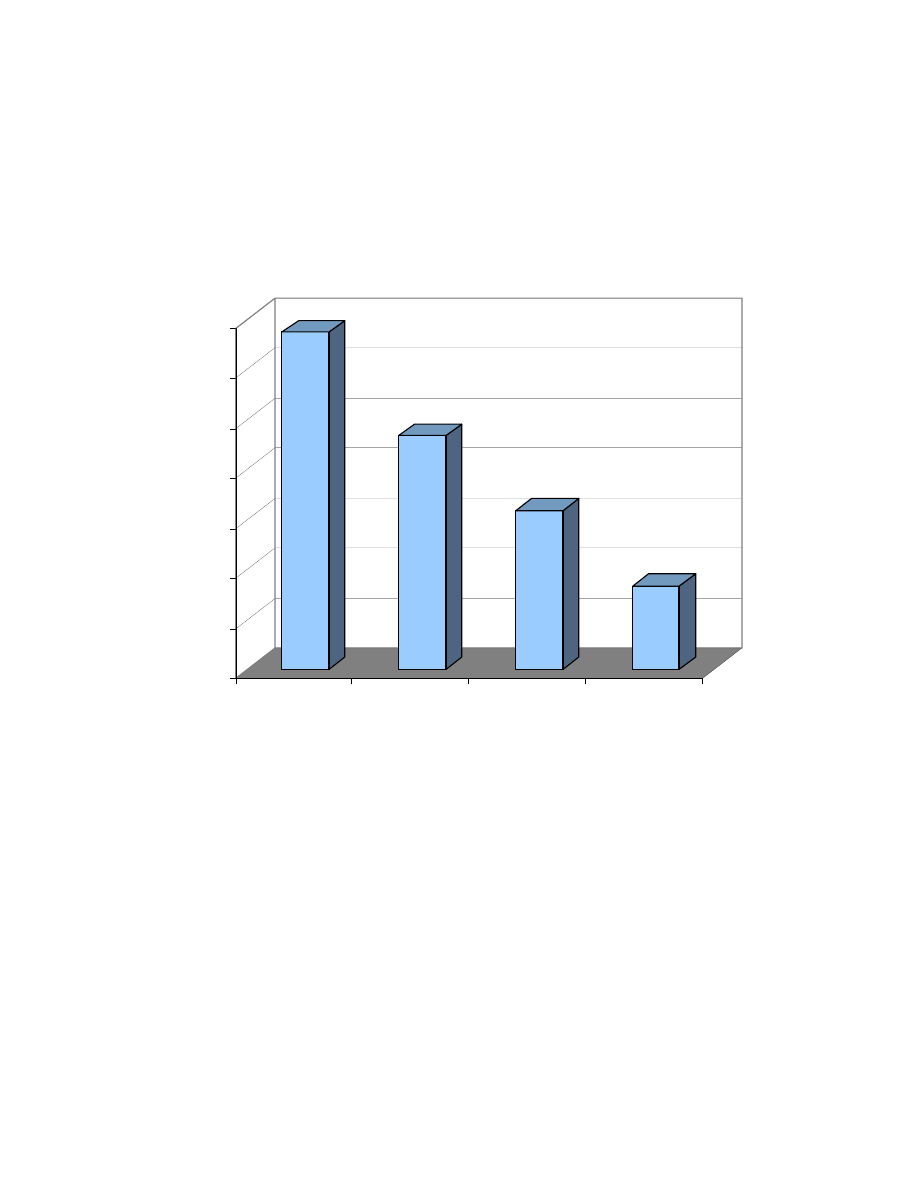
We compute the average holding period for stocks traded by stockbrokers who had advance
copies of the "Inside Wall Street" column in Business Week magazine. The holding period
decreases significantly over the period of trading, reflecting learning on the part of the brokers
about the temporary nature of the Business Week "bounce."
6.73
4.67
3.17
1.67
0.00
1.00
2.00
3.00
4.00
5.00
6.00
7.00
D
ays
June/July
Aug/Sept
Oct/Nov
Dec/Jan
Figure 3
Average holding period for "Inside Wall Street" stocks traded by brokers
Document Outline
- The impact of illegal insider trading in dealer and specialist markets:
- Raymond P.H. Fishea, Michel A. Robeb,*
- 1.Introduction
- 2.Related literature
- 3.Legal case and data
- 4.Abnormal returns
- 5.Analysis of stockbroker trades
- References
Wyszukiwarka
Podobne podstrony:
Barbara Stallings, Wilson Peres Growth, Employment, and Equity; The Impact of the Economic Reforms
social networks and planned organizational change the impact of strong network ties on effective cha
Eleswarapu And Venkataraman The Impact Of Legal And Political Institutions On Equity Trading Costs A
Eleswarapu, Thompson And Venkataraman The Impact Of Regulation Fair Disclosure Trading Costs And Inf
Begault Direct comparison of the impact of head tracking, reverberation, and individualized head re
Towards Optimization Safe Systems Analyzing the Impact of Undefined Behavior Xi Wang, Nickolai Zeld
Lee, Mucklow And Ready Spreads, Depths, And The Impact Of Earnings Information An Intraday Analysis
Gallup Balkan Monitor The Impact Of Migration
THE IMPACT OF SOCIAL NETWORK SITES ON INTERCULTURAL COMMUNICATION
Gallup Balkan Monitor The Impact Of Migration
the impact of the Crusades
The impact of Microsoft Windows infection vectors on IP network traffic patterns
Kałuska, Angelika The role of non verbal communication in second language learner and native speake
Marina Post The impact of Jose Ortega y Gassets on European integration
The Impact of Mary Stewart s Execution on Anglo Scottish Relations
Latour The Impact of Science Studies on Political Philosophy
L R Kominz The Impact of Tourism on Japanese Kyogen (Asian Ethnology Vol 47 2, 1988)
The role of child sexual abuse in the etiology of suicide and non suicidal self injury
więcej podobnych podstron