
Experimental study of drying kinetics by forced convection
of aromatic plants
A. Belghit
a,
*, M. Kouhila
b
, B.C. Boutaleb
a
a
Laboratoire de MeÂcanique des Fluides et EnergeÂtique, Faculte des Sciences Semlalia, Avenue Moulay Abdallah, B.P.
2390, Marrakech, Morocco
b
Laboratoire d'Energie Solaire, Ecole Normale SupeÂrieure, B.P. 2400, Marrakech, Morocco
Received 31 March 1999; accepted 20 September 1999
Abstract
This paper has the objectives to determine the isotherms of sorption and the drying kinetics of
verbena, which is the most consumed aromatic plant in Morocco. The experiments undertaken consist
of examining the eects of drying air velocity, temperature of drying air and air moisture content on the
drying kinetics of verbena in a laboratory drying tunnel working by forced convection. The results
veri®ed, with good reproducibility, that temperature is the main factor in controlling the rate of drying.
The expression of the drying rate is determined empirically from the characteristic curve of drying. 7 2000
Elsevier Science Ltd. All rights reserved.
Keywords: Drying; Isotherms of sorption; Verbena; Drying rate
1. Introduction
Optimization of the drying operation must answer two essential imperatives which are
the restricted consumption of the necessary energy and the safeguard of the biologic
quality of the dried products. These considerations have led to many works at dierent
levels of the drying process: the drier, the product and the economical cost [1]. In the
same orientation, we study in this paper the isotherms of sorption and the drying kinetics
Energy Conversion & Management 41 (2000) 1303±1321
0196-8904/00/$ - see front matter 7 2000 Elsevier Science Ltd. All rights reserved.
PII: S0196-8904(99)00162-4
www.elsevier.com/locate/enconman
* Corresponding author. Tel.: +212-443-4649; fax: +212-443-6769.
E-mail address: belghit@ucam.ac.ma (A. Belghit).

of verbena so as to contribute to the understanding of the drying mechanism of aromatic
herbs and to the design of dryers adapted to this kind of product and working partially
or completely with solar energy.
Arti®cial thermal drying is adopted in this study. This kind of drying is often used in
the alimentary domain in order to avoid deterioration of the fresh products and in the
industrial domain in order to create new products (such as powder of milk, for example).
In other cases, drying is used to reduce the product weight and the cost of transport.
When we dry products, especially in the agricultural domain, we are often confronted with
the following diculties: the ®rst diculty comes from the fact that every product has its own
drying kinetics. Besides, the evaporative power of hot and humid air increases the process of
biological deterioration. The second diculty is technical. It is due to the experimental set up.
So, a bad control of the drying process involves some undesirable modi®cations. In addition,
some modi®cations of shape and structure appear during the drying of most alimentary
products.
The product studied in this work is verbena. This choice is justi®ed by its abundance and its
importance for the agriculturists of the region of Marrakesh (Ourika and central Haouz in
Nomenclature
a
B.E.T. constant
A
w
activity of water in product
db
dry basis
dm
dry matter
HR
air moisture content, %
M
w
mass of wet matter, kg
M
d
mass of dry matter, kg
k, n
Henderson constants
n'
number of adsorbed monolayers
t
time, s
T1
dry bulb temperature, 8C
T
h
wet bulb temperature, 8C
T'
temperature of thermostated bath, 8C
T
temperature of drying air, 8C
V
drying air velocity, ms
ÿ1
X M
w
ÿ M
d
=M
d
water content (db), kg water/(kg dm)
X
in
initial water content (db), kg water /(kg dm)
X
®n
®nal water content (db), kg water/(kg dm)
X
eq
equilibrium water content (db), kg water/(kg dm)
X
dimensionless water content
X
M
water content adsorbed on monolayer, kg water /(kg dm)
_X
i
ÿdX=dt
i
initial drying rate, kg water/(kg dm/mn)
_X ÿdX=dt
drying rate, kg water/(kg dm/mn)
A. Belghit et al. / Energy Conversion & Management 41 (2000) 1303±1321
1304

south Morocco) because of the produced quantity (about 520 tons per year) and the exported
quantity (88 tons to France). The undertaken experiments aim at the drying of verbena so as
to assure good conservation and quality of the product by respecting the international norms.
Determination of the isotherms of sorption is an indispensable stage in the study of drying
of every product. It gives precious information about the hygroscopic equilibrium of the
product and allows us to know the domain of stability of the products after drying. It is the
objective of the ®rst part of this work. The second part deals with the drying kinetics of
verbena in a laboratory-drying tunnel. The experimental results permit us to determine the
characteristic curve of drying (C C D), which is necessary for calculation of the drying rate of
the product [2].
2. Isotherms of sorption
An isotherm of sorption is usually described by a curve, which illustrates the evolution of
the product water content X
eq
as a function of the moisture content HR of the air surrounding
the product. This can be expressed by the equation X
eq
f HR: These curves are determined
by following the evolution of water adsorption in a product, which is, exposed to an air
atmosphere whose moisture content HR is imposed. The hygroscope equilibrium could be
achieved by a dynamic or static method.
Although the isotherms of sorption and desorption have similar rates, the methods
permitting their obtainment are completely dierent. Indeed, for a product, which is previously
dry and put in humid air, the system encourages ®xation by the product of a part of the water
contained in the air. The equilibrium is, therefore, due to the sorption, and the relation
between the air moisture content and the equilibrium water content of the product constitutes
an isotherm of sorption of this product. In the case where the humid product is maintained at
constant temperature and placed in a vacuum medium, we follow the variation of pressure,
which increases, from a weak value to an equilibrium value due to evaporation of the water
contained in the product. So, the relation between the product water content and the
corresponding equilibrium vapor pressure constitutes the isotherm of desorption. The two
curves present a hysteresis in most cases [3].
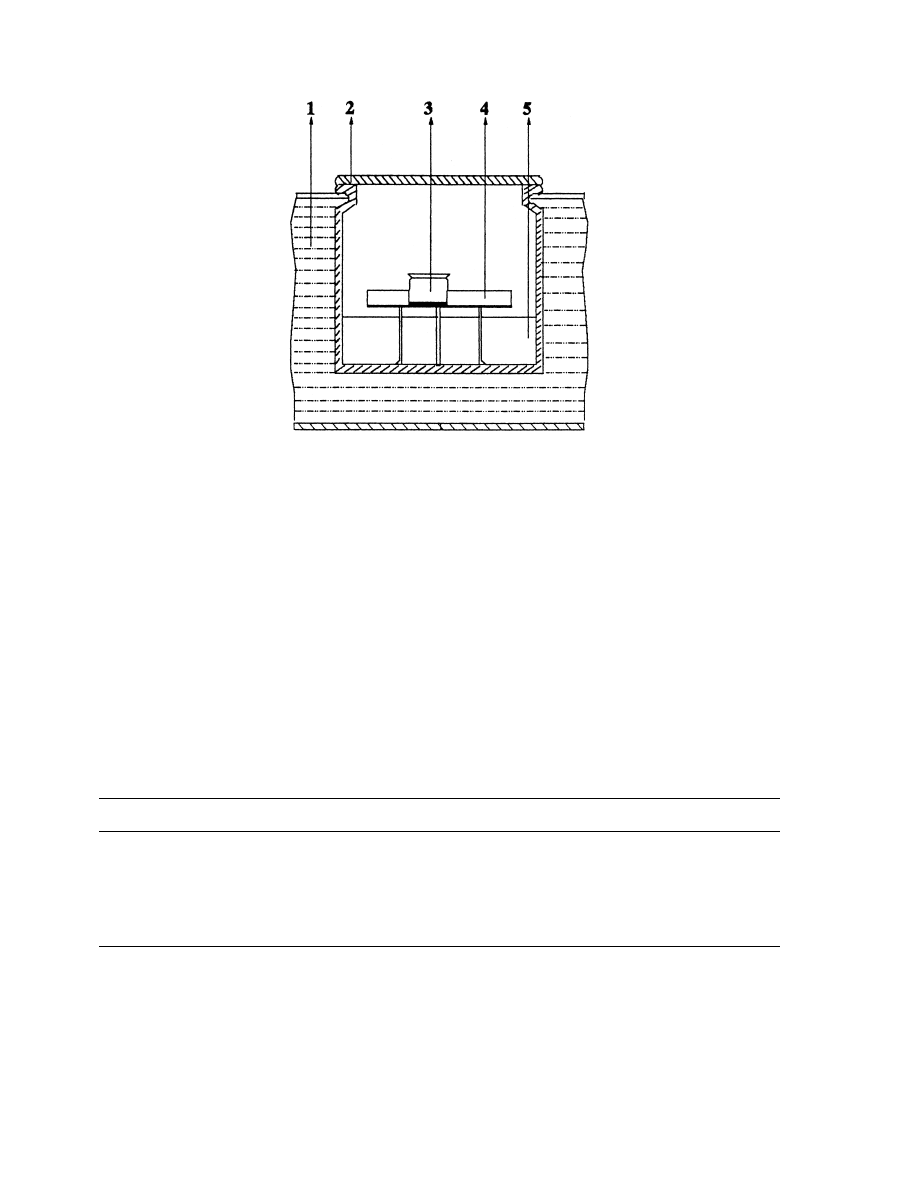
2.1. Material and experimental procedure
In the present work, we use saturated salt solutions in a static method. Although this
method requires a long time for the hygroscopic equilibrium to be attained, it has the
advantage of presenting a more restricted domain of the water content variation [4]. The
experimental apparatus is presented in Fig. 1. It consists of six bottles of one liter each with an
insulated closing. Every bottle is ®lled to quarter depth with a saturated salt. A ¯ask
containing 0.1 g of verbena is put on a tripod, which is introduced in the bottle. Each bottle
contains a dierent salt solution (KOH, MgCl
2
, K
2
CO
3
, NaNO
3
, KCl, BaCl
2
) so as to have an
air moisture content which varies from 3% to 90%. Table 1 gathers dierent salt solutions and
there activities of water at T 408C.
The bottles are immersed in a thermostated water bath adjusted at a ®xed temperature
A. Belghit et al. / Energy Conversion & Management 41 (2000) 1303±1321
1305
during 24 h so as to adapt the salt solutions with a stationary temperature. Before putting the
six samples of product in the bottles, they are submitted to dehydration in an oven regulated at
a temperature of 508C until reaching maximum dehydration. Water is added to the
thermostated bath every week so as to substitute for the evaporated quantity.
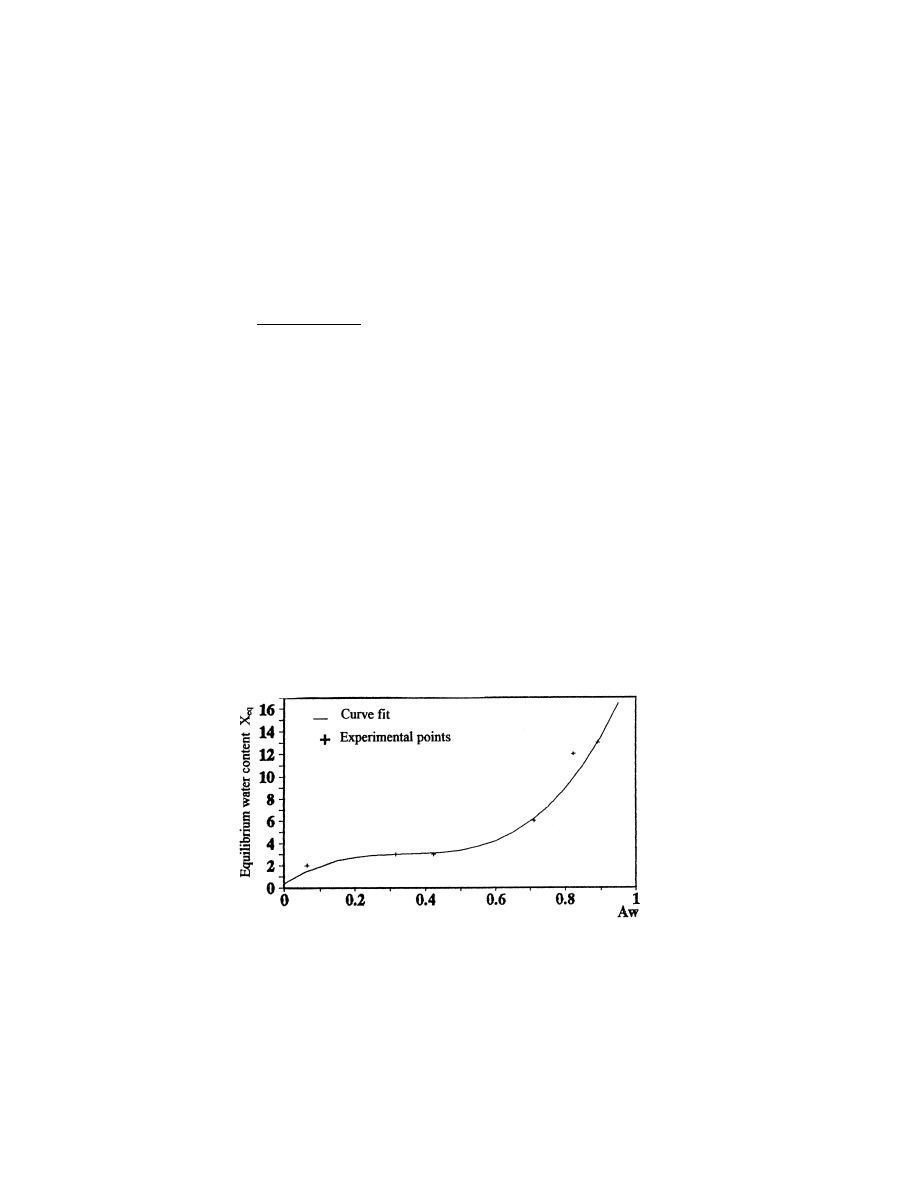
The six samples are weighed every ®ve days in order to determine their water content X
eq
.
Every sample is then placed in the ¯ask and put again into the bottle.
As soon as the six masses become stationary, the experiment is stopped, and the samples are
weighed and placed in a drying oven whose temperature is ®xed at 1058C. This operation lasts
six or seven hours, until the six masses do not vary anymore with time. The objective of this
last operation is to determine the dry masses of the six samples. The dierence of mass before
and after drying in the oven allows us to have the water content of the product at hygroscopic
equilibrium X
eq
M
w
ÿ M
d
=M
d
: The results of this experiment are presented in Fig. 2.
Fig. 1. Experimental apparatus for the sorption isotherms measurement: (1) thermostated bath, (2) bottle containing
salt solution, (3) ¯ask containing product, (4) tripod and (5) salt solution.
Table 1
Standard values of air moisture content given for dierent salts
Salt
Activity of water A
w
(%) at 408C
KOH
6.26
MgCl
2
31.59
K
2
CO
3
42.30
NaNO
3
71.00
KCl
82.32
BaCl
2
89.10
A. Belghit et al. / Energy Conversion & Management 41 (2000) 1303±1321
1306
2.2. Modeling of isotherms of sorption
To model the curves of sorption, several correlations exist in the scienti®c literature. Among
these models, we chose Henderson's and the B.E.T. ones.
2.2.1. Henderson's model
To take into account the in¯uence of temperature on hygroscopic equilibrium and make
interpolations, we use Henderson's model [5] because it has the advantage of describing the
whole isotherm of sorption for dierent temperatures. The equation expressing this model is
given below:
X
eq
ÿ
T
0
, HR
ÿln 1 ÿ HR
k 1:8T
0
492
1=n
1
This equation allows us to calculate the isotherms of sorption for every value of temperature.
The constants k and n in Eq. (1) depend on the temperature and characterize the product. In
order to determine k and n, we write Eq. (1) under the form:
nln
ÿ
X
eq
ln k ln ÿ ln 1 ÿ HR ÿ ln 1:8T
0
492
2
Eq. (2) has the shape of a straight line equation: Y nX b, with k exp b: By plotting Y as
a function of X, we obtain a regression straight line which allows us to determine the
coecients k and n for T 408C. The tracing of this function, illustrates clearly the existence
of two straight lines with dierent slopes. This shows that the modelization should be made at
dierent intervals of activity of water:
. For 0RA
w
R0:35, we have the values of k and n as follows:
k 52 10
ÿ6
& n 2:014
. For 0:35RA
w
R1, we have the values of k and n as follows:
Fig. 2. Isotherm of sorption of verbena obtained at 408C.
A. Belghit et al. / Energy Conversion & Management 41 (2000) 1303±1321
1307
k 345 10
ÿ6
& n 0:97
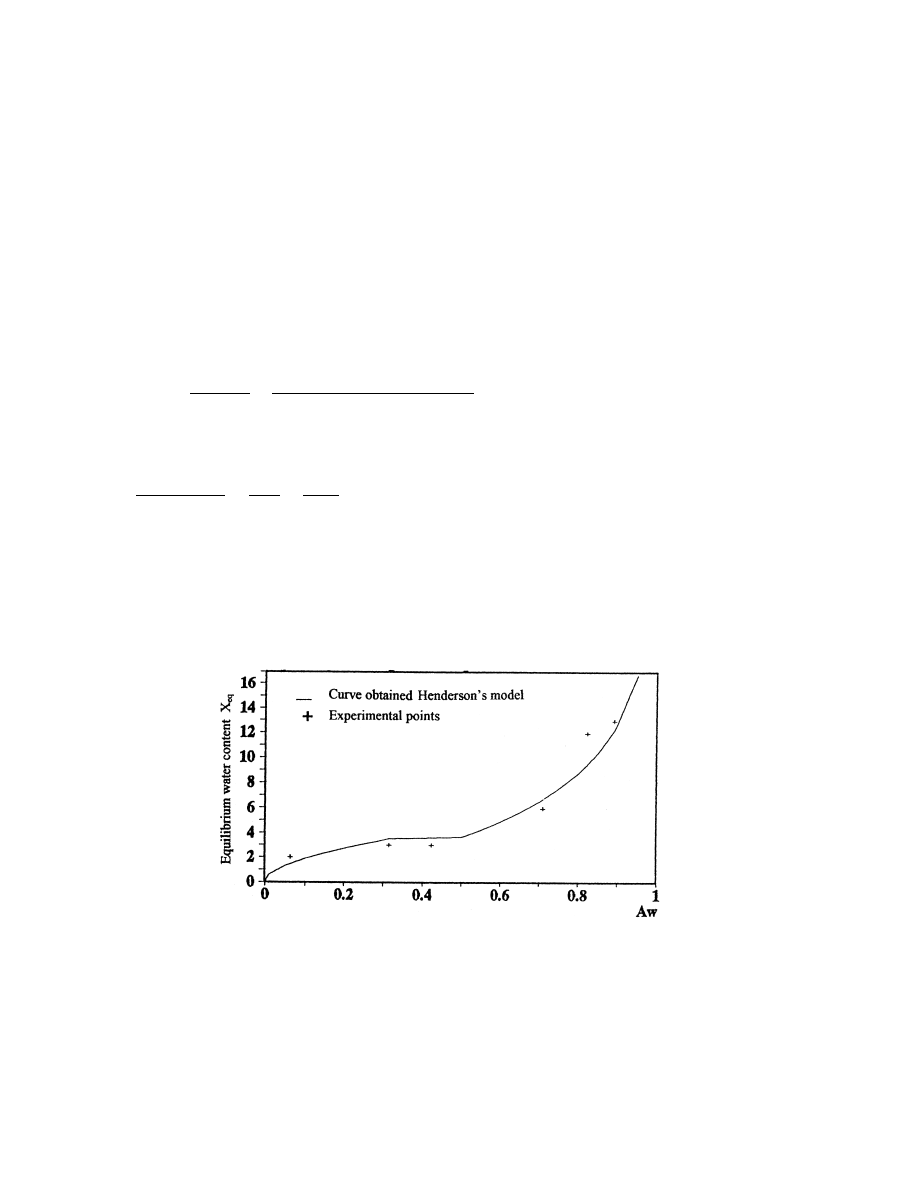
From these coecients, we calculated the curve of sorption at T 408C. The representation of
these results is shown in Fig. 3, on which we notice that the calculated curve by Henderson's
model and the experimental points have practically the same rate.
In order to study the in¯uence of temperature, we calculated the curves of sorption at other
temperatures. Fig. 4 shows that the equilibrium water content decreases somewhat when the
temperature increases.
2.2.2. B.E.T model
In order to understand how the sorption occurs in our product, we use the model suggested
by Brunauer, Emmet and Teller (noted B.E.T.) [6]. This model allows us to examining the
phenomenon of ®xation and liberation of water molecules. The general equation expressing
this model is given by:
X
eq
HR X
M
a
1 ÿ HR
1 ÿ n
0
1HR
n
0
n
0
HR
n
0
1
1 a ÿ 1HR aHR
n
0
1
3
If we take into account only the adsorbed monolayers n
0
1 and if we neglect the square
terms of air moisture, Eq. (3) becomes:
HR
1 ÿ HRX
eq
1
aX
M
a ÿ 1
aX
M
HR
4
By plotting the quantity HR= 1 ÿ HRX
eq
as a function of HR, we obtain a straight line for
which the slope a ÿ 1= aX
M
and intercept is 1= aX
M
: This allows us to calculate the
constants X
M
and a:
a 45:76 and X
M
2:292 kg water= kg dm
Fig. 3. Curve of sorption calculated with Henderson's model at T 408C.
A. Belghit et al. / Energy Conversion & Management 41 (2000) 1303±1321
1308
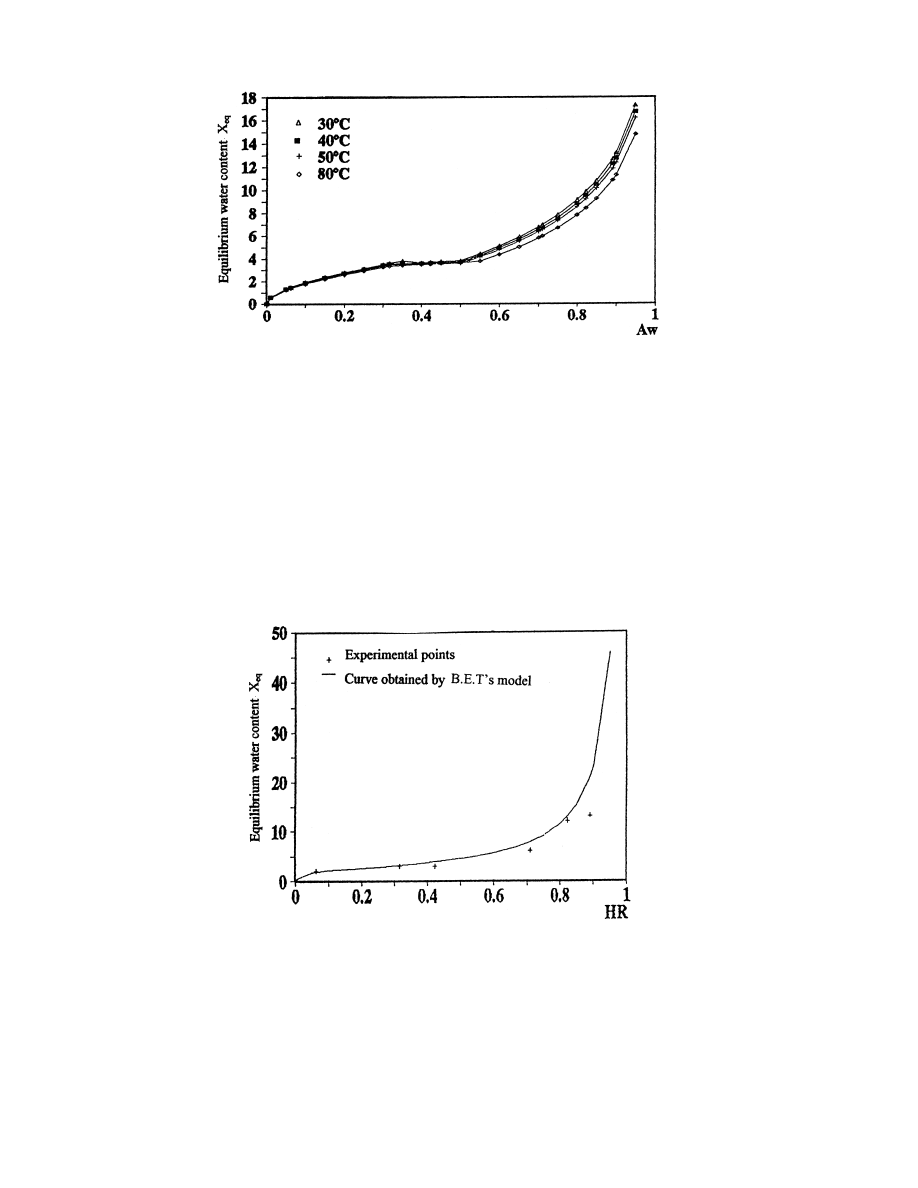
In Fig. 5, we plot the curve of sorption of verbena calculated by the B.E.T. model.
Unfortunately, this model is adapted only at low air moisture content 0RHRR50%). This
corresponds to ®xation of the monolayer of water molecules.
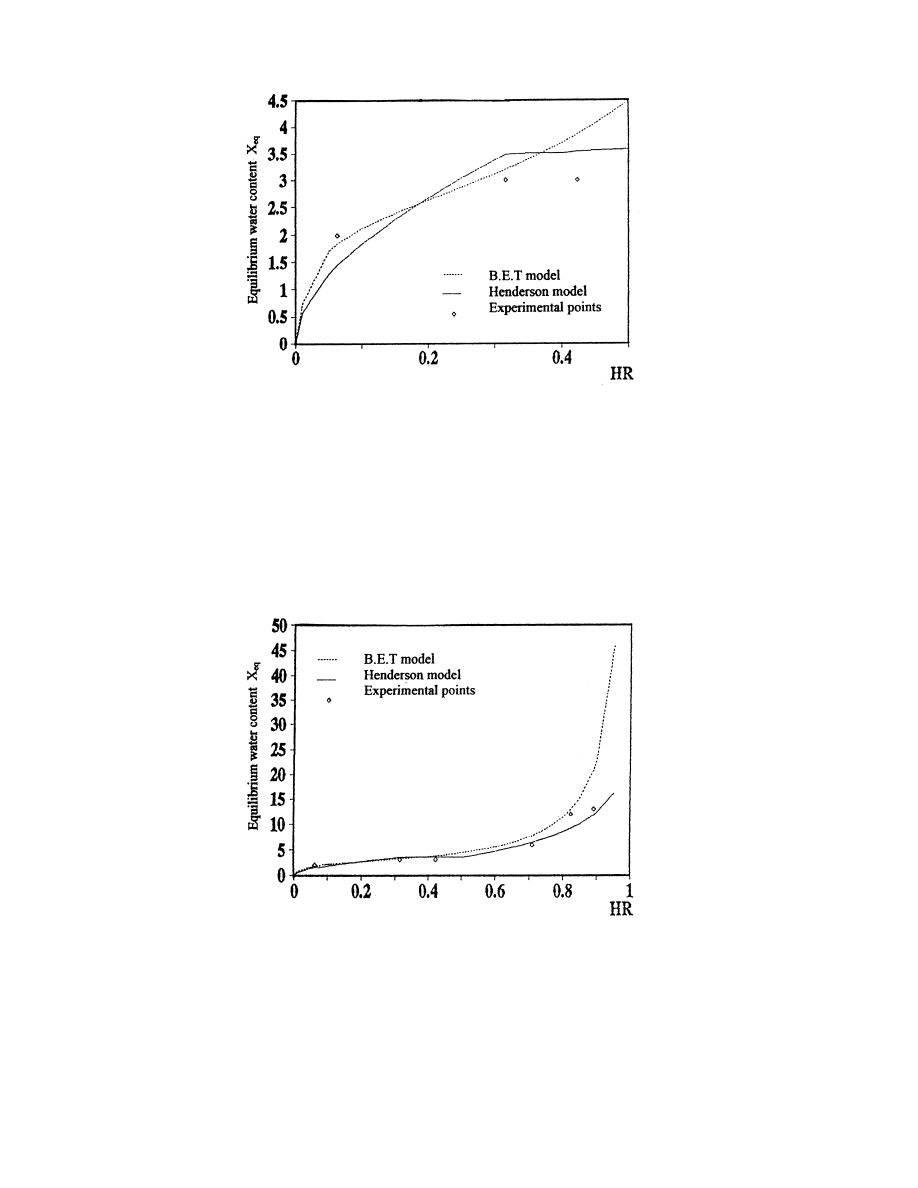
To compare the performances of the two models, we plot in Figs. 6 and 7 the experimental
points and the curves obtained by Henderson's and the B.E.T. model for activities of water
varying between 0 and 100%. We can conclude that the B.E.T. model describes better the
isotherm of sorption of verbena than Henderson's. However, this model is valid only in the
interval 0RHRR50%: For high air moisture contents, the results obtained by this model are
quite far from the experimental points.
Fig. 4. Isotherm of sorption calculated with Henderson's model for dierent temperatures.
Fig. 5. Isotherm of sorption calculated with the B.E.T. model for T 408C.
A. Belghit et al. / Energy Conversion & Management 41 (2000) 1303±1321
1309
3. Kinetics of drying of verbena
3.1. Introduction
In the previous section, we studied the hygroscopic equilibrium of verbena. This allowed us
to have an idea on the equilibrium water content relative to a given air moisture content. The
results of this study allowed us also to have the curves of sorption. This kind of curve is
Fig. 6. Comparison between the isotherms of sorption of verbena calculated with the B.E.T. and Henderson's
models for 0RHRR50%:
Fig. 7. Isotherms of sorption of verbena calculated with the B.E.T. and Henderson's models for 0RHRR100%:
A. Belghit et al. / Energy Conversion & Management 41 (2000) 1303±1321
1310
necessary for determination of the drying kinetics of the product and the conditions permitting
its storage
In the drying literature, dierent models and theories are used in order to study drying
kinetics and apprehend the physical laws governing heat and mass transfer during the drying
process [3,7]. However, since the transfer mechanisms are complex and the biological products
are abundant, a unique model could not represent all the situations.
3.2. Material and method
3.2.1. Description of experimental apparatus
The dierent experiments undertaken consist of studying the drying kinetics of verbena in a
drying tunnel working by forced convection in a controlled atmosphere.
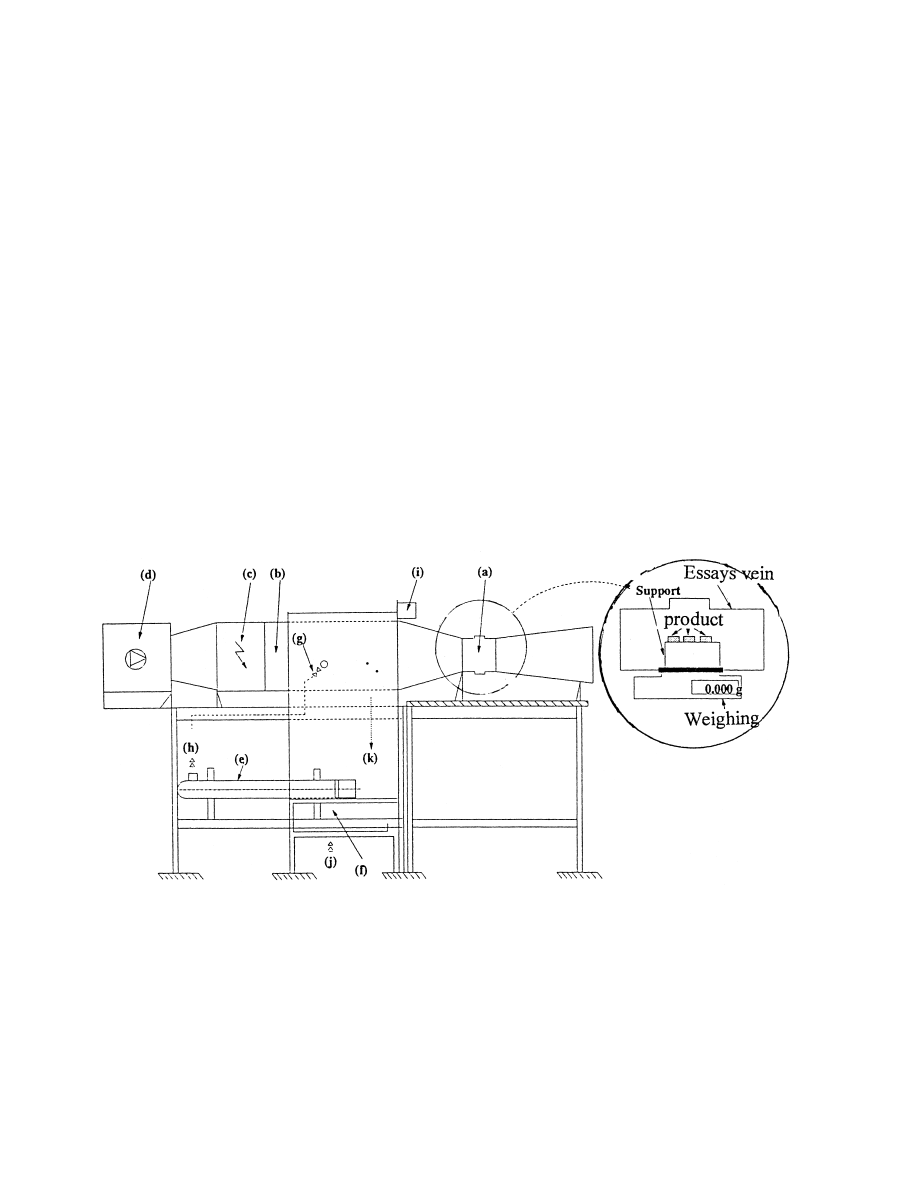
The experimental apparatus (Fig. 8) is a laboratory-drying tunnel which allows us to have an
air¯ow with controlled characteristics. The whole apparatus includes:
. A treatment air unit (d) with a variable fan velocity allowing us to have an average air
velocity in the essays vein (a) varying between 4 and 12 m s
ÿ1
. In order to have low air
velocities, which are necessary for drying processes, we have adopted the inlet air system.
The air¯ow is, therefore, made uniform with a nest of screens placed upstream of the last
system.
. A heating battery (c) of 24 kW installed power, regulated by a temperature probe.
. A water humidi®er (b) supplied by water at variable temperature by the intermediary of a
vaporizer (e) regulated by a humidity probe. It is characterized by:
Fig. 8. Schematic representation of the laboratory drying tunnel: (a) essays vein, (b) humidi®er, (c) heating system,
(d) fan, (e) heating system, (f) electrovan, (g) control van, (h) hot water, (i) humidity and temperature probes, (j)
cold water, (k) throwing out.
A. Belghit et al. / Energy Conversion & Management 41 (2000) 1303±1321
1311

*
an installed power: 12 kW;
*
a water ¯ow rate: 1.4 10
ÿ4
m
3
s
ÿ1
;
*
a maximum air moisture content: 80%.
. An essays vein (a) of square shape of dimension (25 cm 25 cm) supplied upstream by a
convergence for a good velocity distribution and down stream by a weak angle (78) of
divergence so as to avoid the removement in the essays vein. This vein contains a site for
®xing the samples of product and entrances to place thermocouples and a Pitot tube for the
air velocity measurement.
. A command cupboard controlling:
*
a heating battery regulator;
*
an air moisture regulator;
*
a control of the ventilation velocity;
*
a control of the electrovane of the humidi®er circuit.
3.2.2. Parameters measured
The parameters measured during every experiment are:
. Temperature
Temperature measurement is made by Chromel/Alumel thermocouples of diameter d 1
mm and measurement accuracy of about 0.5 K. The temperature is measured in various
places of the essays vein:
*
at the surface of the product;
*
in the drying air;
*
in the inlet and outlet of the essays vein.
The verbena leaf on which the temperature measurement is done remains isolated in the
same drainage of hot air ¯ow (within the essays vein) with the others in order to avoid all
in¯uence on the weight product measurement.
. Air moisture content
It is done by a thermohygrometer with an accuracy of 0.1%, recalibrated by some
ambiences with reduced air moisture. This allows us measuring directly the average air
moisture content.
. Drying air velocity
It is done by means of a digital velocimeter linked to a Pitot tube placed in the essays vein
near the surface of the product. The measurement accuracy is about 0.1 ms
ÿ1
.
. Loss mass of product
It is done by a display digital weighing apparatus with an accuracy of 0.001 g. This
weighing apparatus allows us to follow continuously the loss mass of product during the
drying process.
3.3. Experimental set-up
Since the verbena leaves are considerably light and their dimensions are very small, the
A. Belghit et al. / Energy Conversion & Management 41 (2000) 1303±1321
1312

experiment could not be undertaken on isolated leaves. So, we were led to dry our aromatic herb
in a thick layer. A digital weighing apparatus allows us to follow the product mass loss during the
drying process. Placed right beneath the essays vein, the weighing apparatus must play the role of
a stand for the drying product. Nevertheless, for the same reasons evoked above, a weak air¯ow
rate might throw the product outside the vein. In order to rectify this problem, we used a grilled
cage as a support for the product. This grilled cage is placed upon the weighing apparatus.
The measurement method consists of ®xing values of drying air velocity and temperature of
drying for every test. The system is left in order to stabilize during an hour until attaining the
equilibrium temperature. Then, the product is introduced in the essays vein. From this
moment, we began to follow the variation of weight of the product as a function of time. The
time separating two successive measurements is about a few seconds in the beginning of the
drying process. As and when the mass product decreases during drying, we increase the time
interval until becoming an hour in the drying end.
This way of proceeding, called continuous drying, involves considerable ¯uctuations of mass
due to the eect of the air thrust. Some researchers adopted, as a solution, taking measurements
after the ventilation was stopped [8]. The drying is then not continuous, and the perturbations
brought by these stops involve other errors in measurement.
The drying curves are based on the variation of the product water content as a function of time.
Knowing the wet mass, the dry mass is obtained by putting the product, at the end of every
experiment, in an oven regulated at 1058C until dewatering completely the product. Thus, we
obtain an experimental curve representing the variation of product water content as a function of
time.
3.4. Results and discussion
We study in this section the variation of product water content as a function of time and the
in¯uence of drying air velocity and drying air temperature on the rate of drying in order to
determine the characteristic curve of drying. Our experimental tests are undertaken in the
experimental conditions given in Table 2.
According to Figs. 9±11, representing the drying curves, we note that the drying air conditions
have an important in¯uence on the rate of these curves. Thus, we can conclude two main results:
. There is an absence of phase 0, where the temperature of the product is increased without
Table 2
Conditions of drying air for dierent experiment essays
Test number Drying air velocity V
(m s
ÿ1
)
Dry-bulb temperature T
1
(8C)
Wet-bulb temperature T
h
(8C)
Air moisture content HR
(%)
1
2.1
30
18.5
26
2
2.6
30
20.2
40
3
3.1
30
19.4
38
4
2.6
40
23.5
28
5
2.6
50
25.4
15
A. Belghit et al. / Energy Conversion & Management 41 (2000) 1303±1321
1313
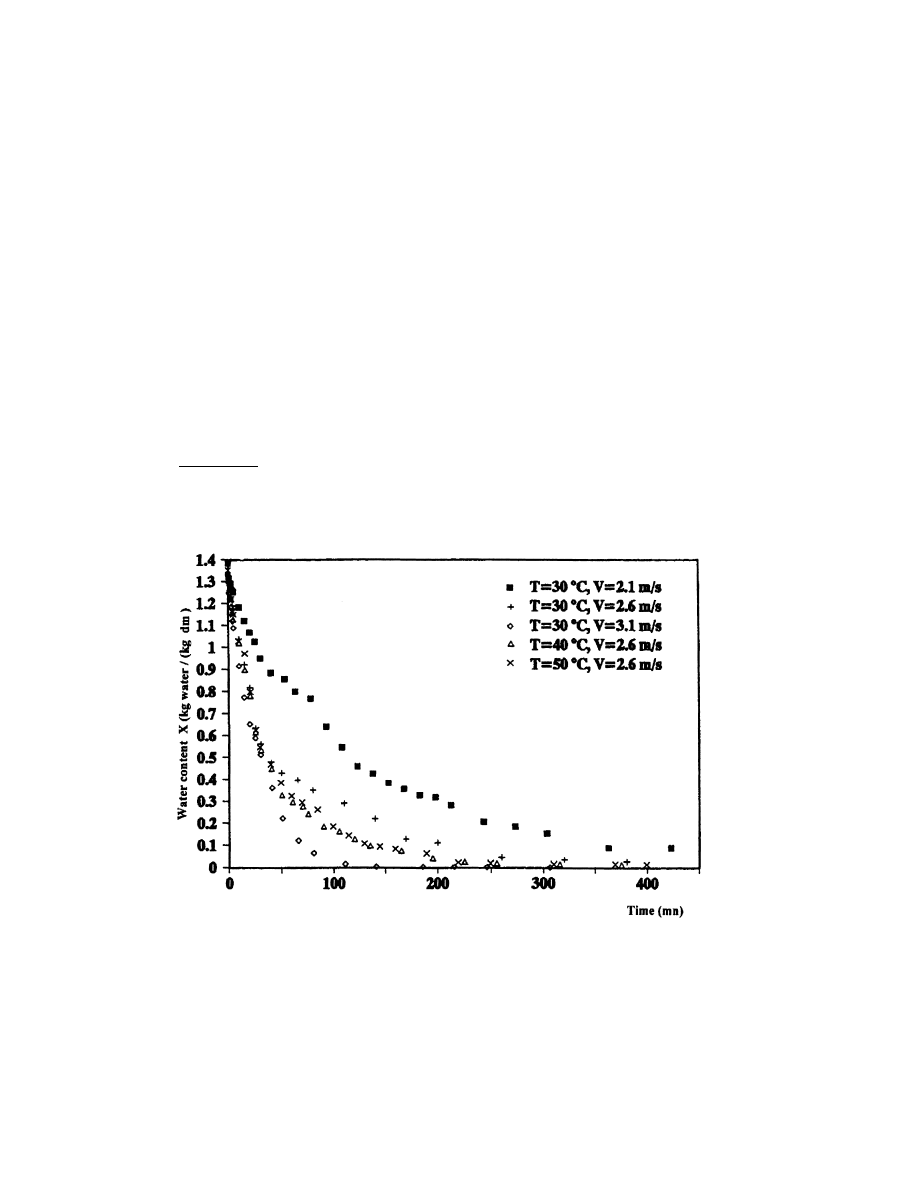
any substantial loss of water and phase 1, the constant rate period. There is only the
presence of the falling rate period (phase 2). This result is compatible with the drying
literature. Bimbenet et al. [9] noted that the phase 0 disappears when the product is compact
or in leaves and that the constant rate period (phase 1) is not observed in several biological
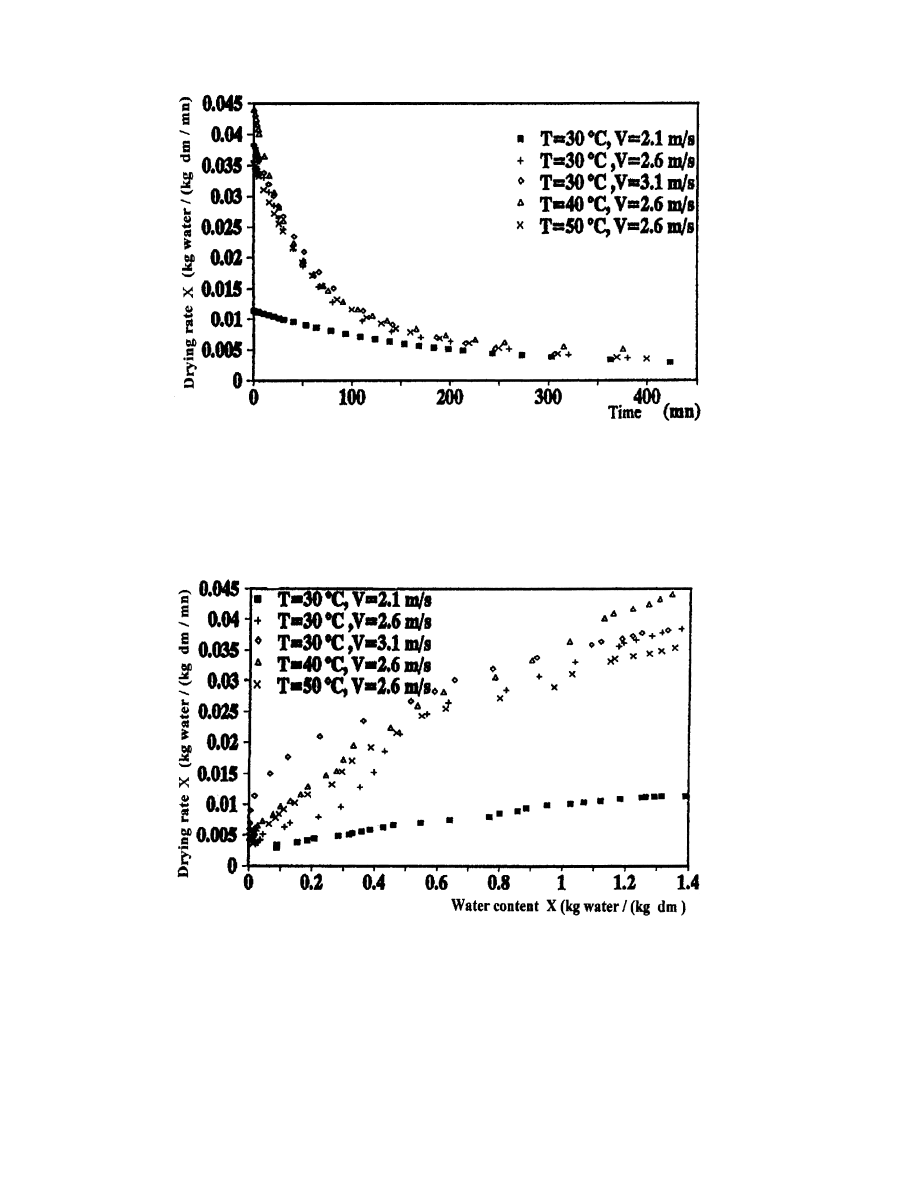
products. This appears clearly in Figs. 10 and 11 which represent a falling rate period since
the beginning of the drying process.
. There is a perfect agreement between the experimental results and theoretical predictions [3].
The variation of air conditions seems to have no eect on the drying kinetics at the end of the
drying process, at which we note that the drying curves have a tendency to coincide. At the
falling rate period (phase 2 is the unique period observed in the drying of verbena), the external
air conditions have an in¯uence which decreases until disappearing at the end of drying.
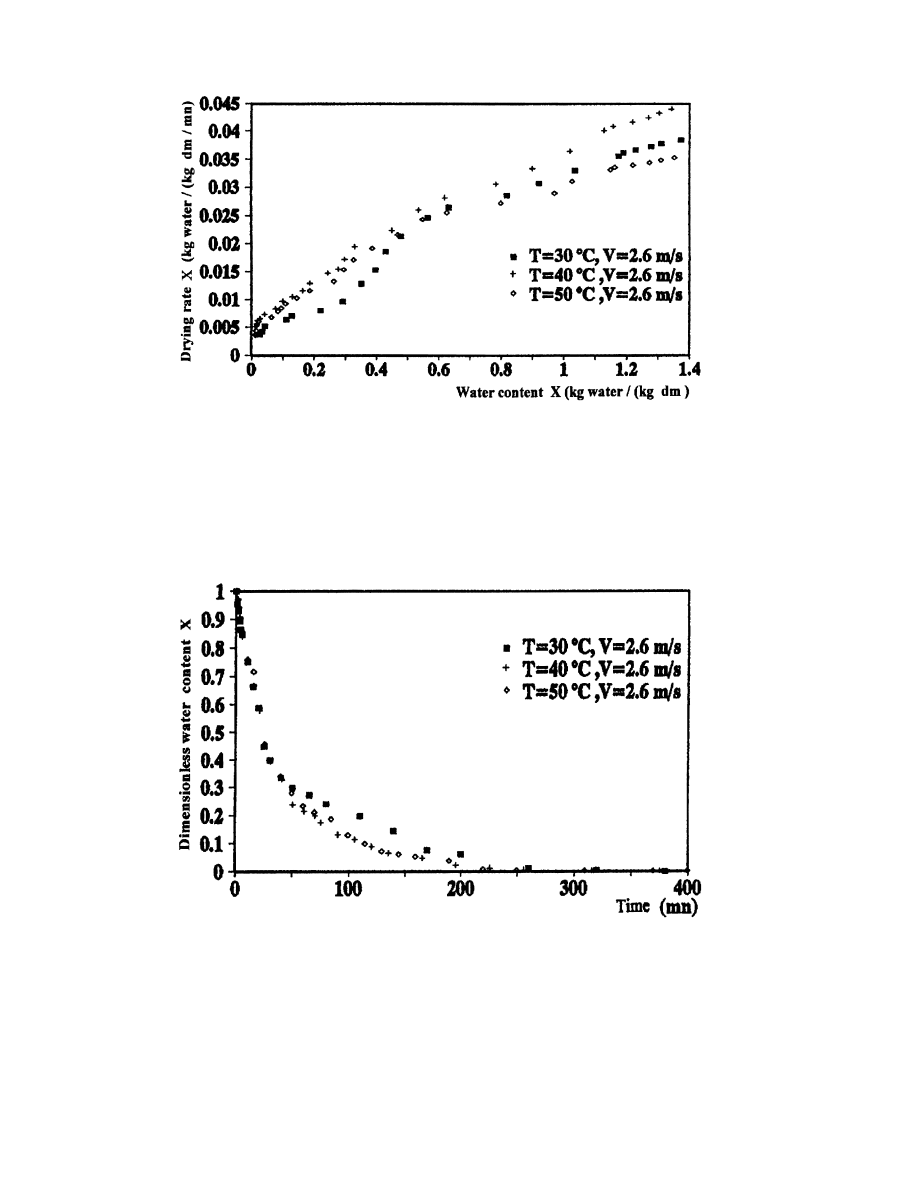
3.4.1. In¯uence of temperature
In this study, we are going to use the results of tests 2, 4 and 5 which are conducted at the
same drying air velocity for dierent temperatures. Figs. 12±14 represent the drying curves in
the speci®ed conditions. Fig. 15 represents the variation of dimensionless water content X
as a
function of time:
X
ÿ
X ÿ X
eq
ÿ
X
in
ÿ X
eq
5
The dimensionless water content is lower as the dry bulb temperature of air is bigger, but the
Fig. 9. Variation of verbena water content as a function of time for dierent drying air conditions.
A. Belghit et al. / Energy Conversion & Management 41 (2000) 1303±1321
1314
drying rate increases with temperature. However, for the ®fth experiment, an anomaly appears
because the drying rate is less than the cases of experiments 2 and 4, even though the
temperature has increased. This could be explained by the fact that the drying is not controlled
alone by the temperature (desorption), but rather by an appreciable diusional resistance
Fig. 10. Variation of verbena drying rate as a function of time for dierent drying air conditions.
Fig. 11. Variation of drying rate as a function of water content for dierent drying air conditions.
A. Belghit et al. / Energy Conversion & Management 41 (2000) 1303±1321
1315
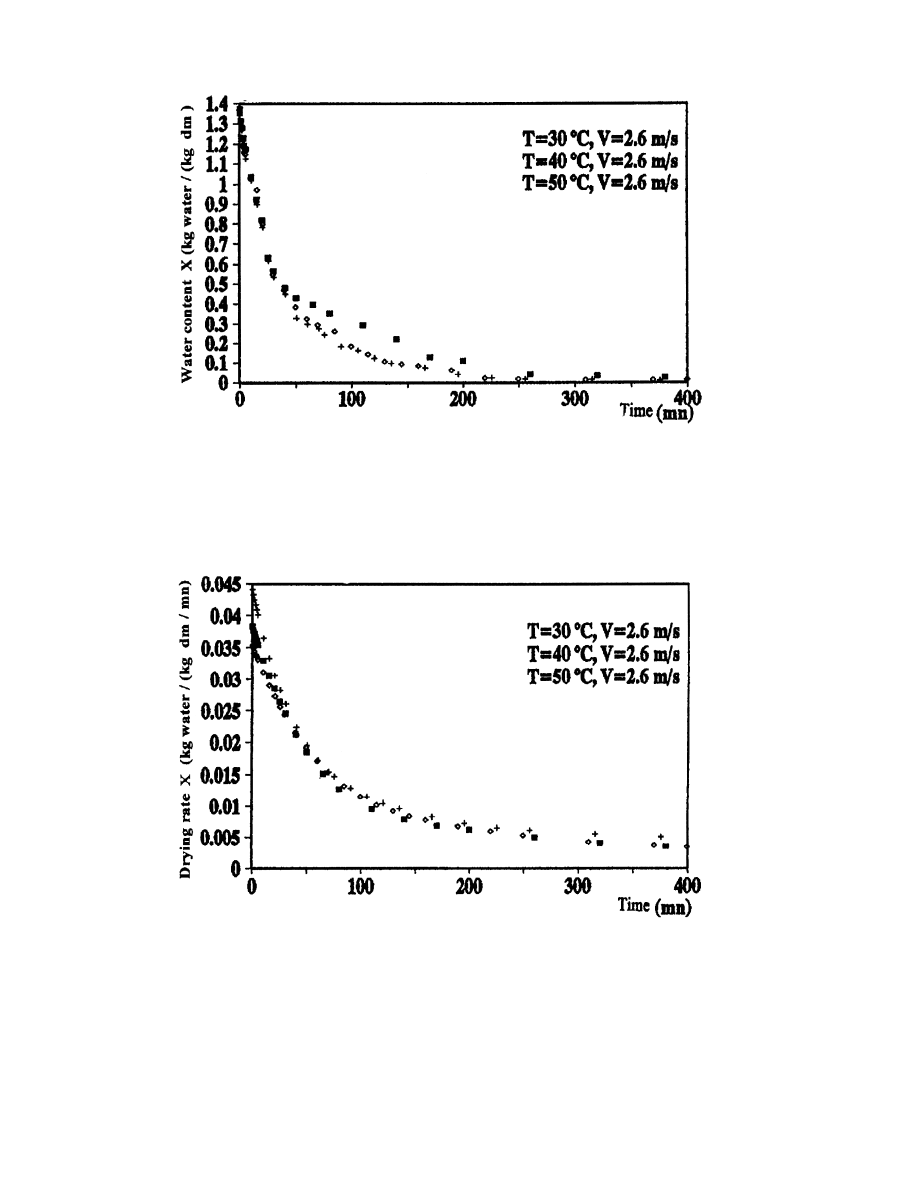
which is sensible to the drying air velocity [10]. Moreover, we note clearly, according to the
curves of Figs. 12±14, that the temperature does not have a great in¯uence. So, the resistance
due to the super®cial evaporation is not negligible.
Fig. 12. In¯uence of drying air temperature on the evolution of water content as a function of time.
Fig. 13. In¯uence of drying air temperature on the evolution of drying rate as a function of time.
A. Belghit et al. / Energy Conversion & Management 41 (2000) 1303±1321
1316
3.4.2. In¯uence of drying air velocity
In order to make evident the in¯uence of the drying air velocity on the kinetics of
drying, we conducted some experimental tests by varying the air velocity and keeping the
temperature stationary T
1
308C). The results of tests 1, 2 and 3 are shown in Figs.
16±19.
Fig. 14. In¯uence of drying air temperature on the evolution of drying rate as a function of water content.
Fig. 15. In¯uence of drying air temperature on the evolution of dimensionless water content as a function of time.
A. Belghit et al. / Energy Conversion & Management 41 (2000) 1303±1321
1317
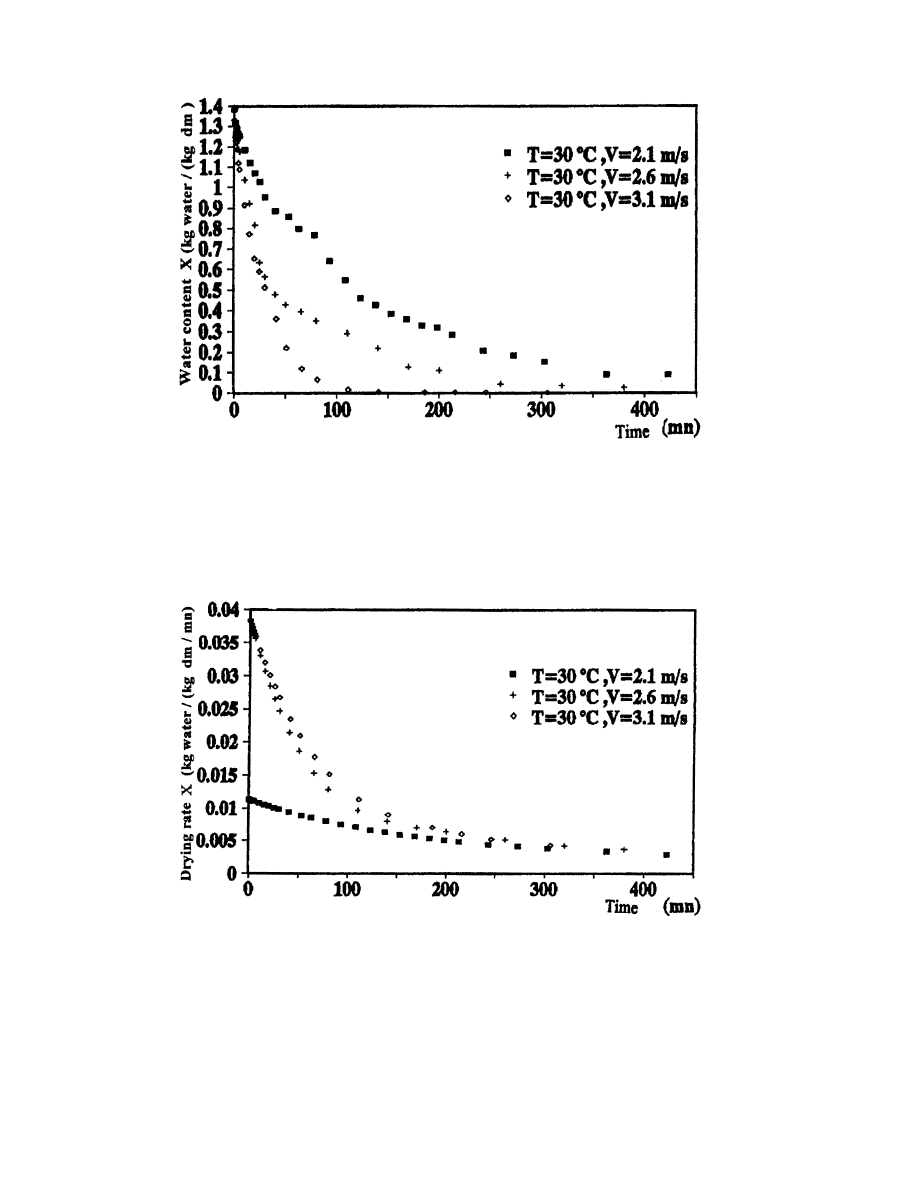
The obtained results are in perfect agreement with the theory [3]. Indeed, the water content has
a decreasing rate when the drying air velocity increases. However, the drying rate increases when
the drying air velocity increases. Daguenet [3] explains this phenomenon by giving the drying rate
as a function of a transfer coecient of the water vapor which increases with the air velocity. This
Fig. 16. In¯uence of drying air velocity on the evolution of water content as a function of time.
Fig. 17. In¯uence of drying air velocity on the evolution of drying rate as a function of time.
A. Belghit et al. / Energy Conversion & Management 41 (2000) 1303±1321
1318
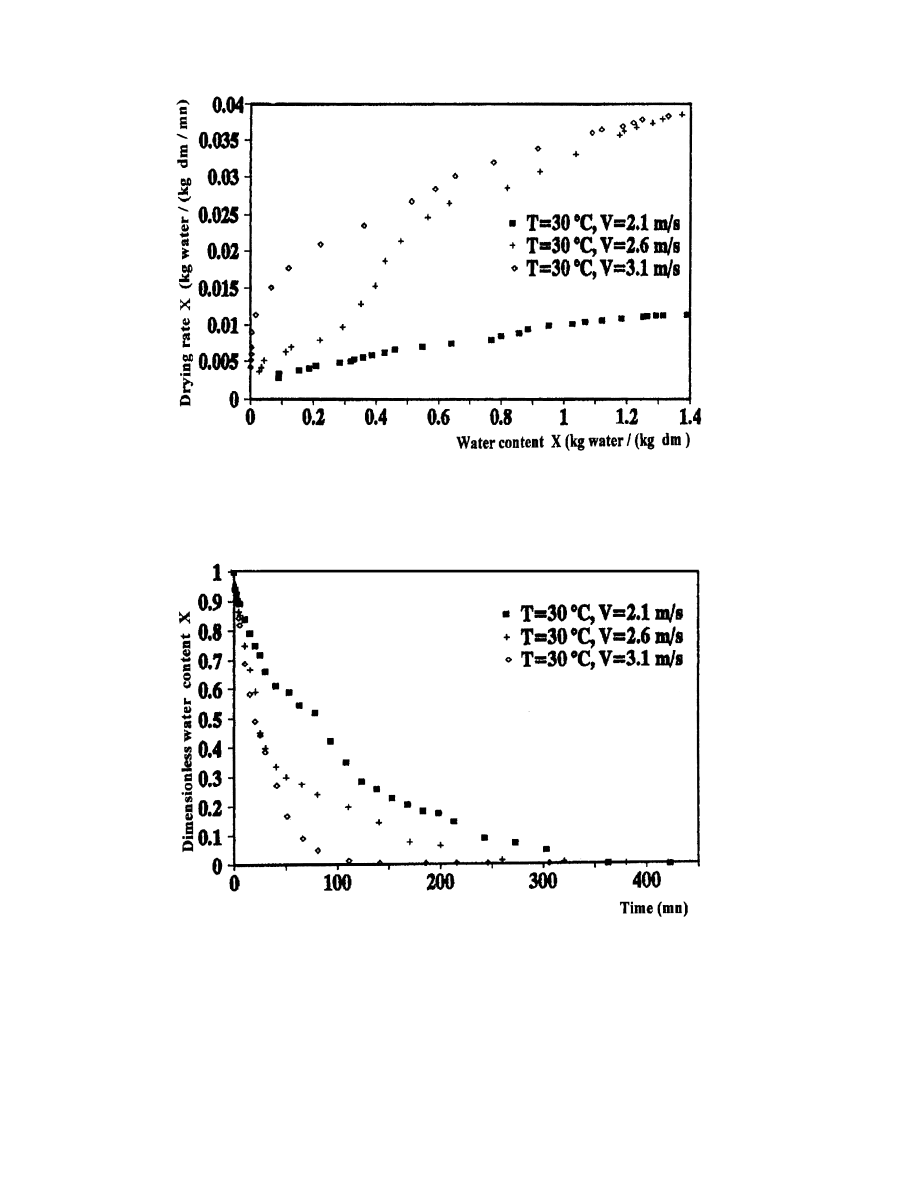
Fig. 18. In¯uence of drying air velocity on the evolution of drying rate as a function of water content.
Fig. 19. In¯uence of drying air velocity on the evolution of dimensionless water content as a function of time.
A. Belghit et al. / Energy Conversion & Management 41 (2000) 1303±1321
1319
parameter exerts, therefore, an important in¯uence on the rate of drying. In the case of verbena,
the drying air velocity seems to have a more important eect than the temperature.
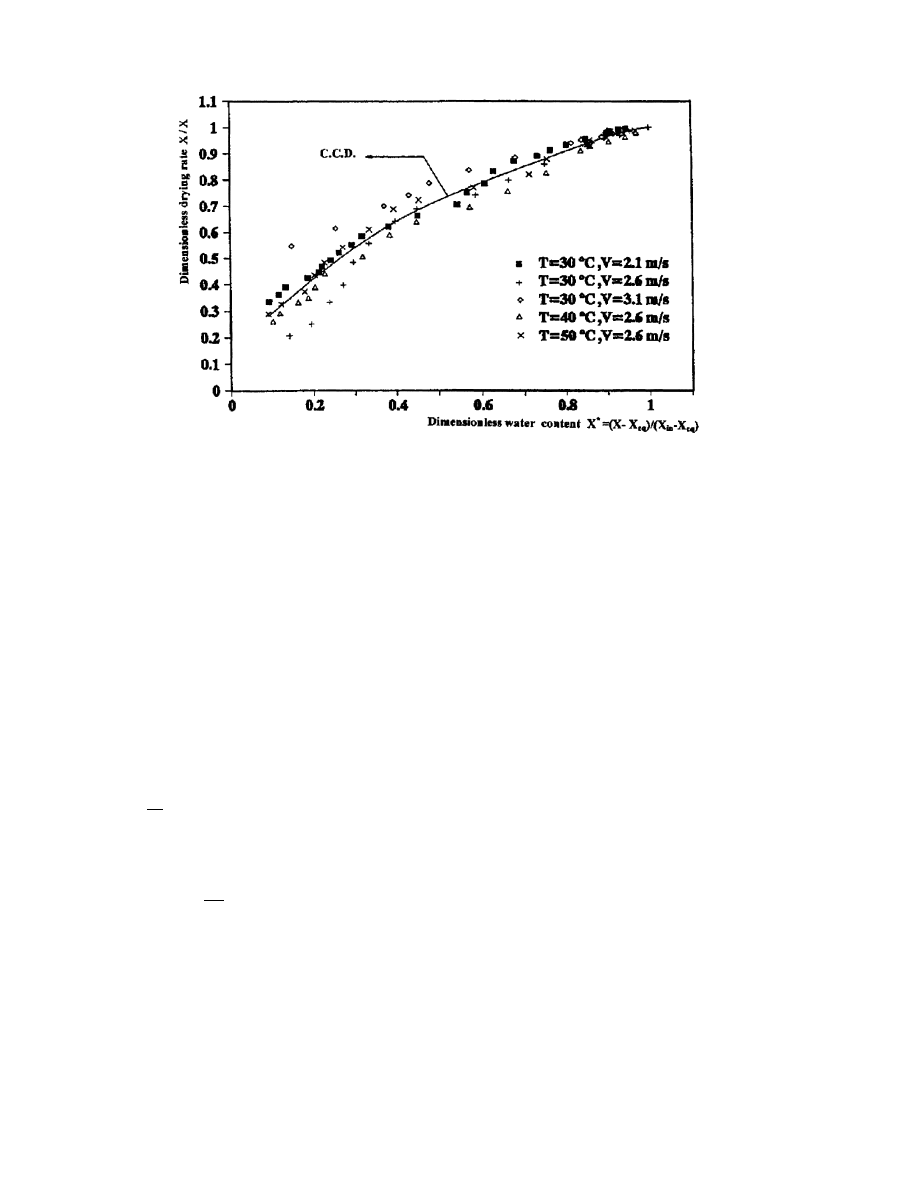
3.4.3. Determination of the characteristic curve of drying (C.C.D)
The goal of this section is to synthesize the obtained results by determining from the
dierent experiments a basic curve called the characteristic curve of drying (C.C.D). The
pursued method [11] consists of plotting the dimensionless drying rate _X= _X
i
as a function of
the dimensionless water content X
. This lead to a narrowing of the dierent values obtained
around an average curve called the C.C.D.
The equilibrium water content X
eq
can be determined from the isotherm of sorption. Fig. 20
represents the C.C.D. This kind of curve is interesting because it describes the drying kinetics
of a product by knowing its initial and equilibrium water contents for every drying air condition
A ®tting of the C.C.D allowed us to determine its equation. It is a ®fth degree polynomial
equation whose coecients are the following:
_X
_X
i
!
0:1880 0:8315X
3:2493X
2
ÿ 9:7577X
3
10:3257X
4
ÿ 3:8368X
5
6
For the determination of _X
i
, we used the relation suggested by Fornell [10]:
_X
i
ÿ
dX
dt
i
aV
b
T
1
ÿ T
h
7
The exploitation of the results permitted the identi®cation of the coecients a and b:
Fig. 20. Drying characteristic curve of verbena obtained for dierent air conditions.
A. Belghit et al. / Energy Conversion & Management 41 (2000) 1303±1321
1320

a 9:01 10
ÿ5
and b 3:25
4. Conclusions
The experiments described in the ®rst section consist of determining the isotherm of sorption
that led to other results. Thus, by smoothing six experimental points, we obtained a third degree
polynomial equation which describes the isotherm of sorption and whose coecients are the
following:
X
eq
408C 0:0037 0:00215 HR ÿ 0:00006 HR
2
5:8156 10
ÿ7
HR
3
8
The calculation of Henderson's constants (k and n ) allowed us to determine the isotherms of
sorption of verbena for dierent temperatures. By using the B.E.T. model, we have compared the
experimental points and the curves of sorption calculated by the two models.
From these results, we could conclude, on the one hand, that the sorption isotherm of
verbena follows the general rate of the sorption curve given by Multon [12]. On the other
hand, the model of Henderson describes very well the isotherm obtained at 408C. So, we could
exploit the obtained results at 408C with a satisfactory precision for the analysis of other
drying experiments conducted at temperatures neighboring to 408C.
In Section 2, we plotted the characteristic curve of drying of verbena that we have exploited
to determine the kinetic properties of verbena. We noted, in particular, the absence of phases 0
and 1 [9] and the in¯uence of air temperature and drying air velocity on the rate of drying.
Finally, we have determined the characteristic curve of drying of the verbena.
References
[1] Boutaleb CB. Etude expeÂrimentale du seÂchage convectif de plantes meÂdicinales: application aÁ la sauge et aÁ la
verveine. TheÁse de 3eÁme cycle, Universite Cadi Ayyad, Marrakesh, Morocco, 1997.
[2] Daudin JD. Calcul des cineÂtiques de seÂchage par l'air chaud des produits biologiques solides. Sciences des
Aliments 1983;3(1):1±36.
[3] Daguenet M. Les seÂchoirs solaires: theÂorie et pratique. Publication de l'UNESCO, Paris, France, 1985.
[4] Belahmidi M, Belghit A, Mrani A, Mir A, Kaoua M. Approche expeÂrimentale de la cineÂtique de seÂchage des
produits agro-alimentaires. Revue GeÂneÂrale de Thermique 1993;380/381:444±53.
[5] Henderson SM. A basic concept of equilibrium moisture. Agric Eng 1952;33(1):29±32.
[6] Brunauer S, Emmet PH, Teller E. Adsorption of gases in multimolecular layers. J Am Chem Soc 1983;60:309.
[7] Belghit A, Belahmidi M, Bennis A, Boutaleb BC, Benet S. Etude numeÂrique d'un seÂchoir solaire fonctionnant
en convection forceÂe. Revue GeÂneÂrale de Thermique 1997;36:837±50.
[8] Ferrao P, Figueiredo A, Freire F. Experimental analysis of the drying kinetics of a food product. Drying
Technology 1998;16(8):1687±702.
[9] Bimbenet JJ, Daudin JD, Wol E. Air drying kinetics of biological particles. In: Proceedings of the Fourth
International Drying Symposium, Kyoto. 1984.
[10] Fornell A. SeÂchage de produits biologiques par l'air chaud. Calcul de seÂchoirs. TheÁse de docteur ingeÂnieur,
ENSIA-Massy France, 1979.
[11] Van Arsdel WB, et al. Food dehydration. Westport: AVI Publishing Company, 1973.
[12] Multon JL. Etat de liaison de l'eau dans les aliments. ProbleÁmes fondamentaux de seÂchage. ATP-PIRDES, 1980.
A. Belghit et al. / Energy Conversion & Management 41 (2000) 1303±1321
1321
Wyszukiwarka
Podobne podstrony:
Experimental study on drying of chilli in a combined Microwave vacuum rotary drum dryer (Weerachai K
Ebsco Bialosky Manipulation of pain catastrophizing An experimental study of healthy participants
Ebsco Bialosky Manipulation of pain catastrophizing An experimental study of healthy participants
AN EXPERIMENTAL STUDY OF A 3 KW STIRLING ENGINEt
An experimental study on the drying kinetics of quince
Drying kinetics and quality of beetroots dehydrated by combination of convective and vacuum microwav
The drying kinetics of kale (Brassica oleracea) in a convective hot air dryer
Drying kinetics and rehydration characteristics of microwave vacuum and convective hot air dried mus
Microwave vacuum drying of porous media experimental study and qualitative considerations of interna
Drying kinetics and drying shrinkage of garlic subjected to vacuum microwave dehydration (Figiel)
Interruption of the blood supply of femoral head an experimental study on the pathogenesis of Legg C
An experimental study on the development of a b type Stirling engine
Microwave–vacuum drying kinetics of carrot slices (Zheng Wei Cui, Shi Ying Xu, Da Wen Sun)
Drying kinetics and drying shrinkage of garlic subjected to vacuum microwave dehydration (Figiel)
Interruption of the blood supply of femoral head an experimental study on the pathogenesis of Legg C
Shaman Saiva and Sufi A Study of the Evolution of Malay Magic by R O Winstedt
Drying kinetics and quality of vacuum microwave dehydrated garlic cloves and slices
więcej podobnych podstron