
Drying kinetics and rehydration characteristics
of microwave-vacuum and convective hot-air dried mushrooms
S.K. Giri, Suresh Prasad
*
Department of Agricultural and Food Engineering, Post Harvest Technology Centre, Indian Institute of Technology, Kharagpur 721 302, India
Received 5 March 2005; accepted 27 October 2005
Available online 20 December 2005
Abstract
Microwave-vacuum dehydration characteristics of button mushroom (Agaricus bisporus) were evaluated in a commercially available
microwave oven (0–600 W) modified to a drying system by incorporating a vacuum chamber in the cavity. The effect of drying param-
eters, namely microwave power, system pressure and product thickness on the drying kinetics and rehydration characteristics were inves-
tigated. The drying system was operated in the microwave power range of 115–285 W, pressure range of 6.5–23.5 kPa having mushroom
slices of 6–14 mm thickness. Convective air drying at different air temperatures (50, 60 and 70
C) was performed to compare the drying
rate and rehydration properties of microwave-vacuum drying with conventional method. Microwave-vacuum drying resulted in 70–90%
decrease in the drying time and the dried products had better rehydration characteristics as compared to convective air drying. The rate
constants of the exponential and Page’s model for thin layer drying were established by regression analysis of the experimental data
which were found to be affected mainly by the microwave power level followed by sample thickness while system pressure had a little
effect on the drying rate. Rehydration ratio was significantly affected by the system pressure. Empirical models are also developed for
estimating the drying rate constant and rehydration ratio as a function of the microwave-vacuum drying process parameters.
2005 Elsevier Ltd. All rights reserved.
Keywords: Microwave-vacuum drying; Button mushroom; Drying rate; Scanning electron microscopy; Rehydration ratio
1. Introduction
Mushrooms are edible fungi of commercial importance
and their cultivation and consumption has increased sub-
stantially due to their nutritional value, delicacy and flavor.
The button mushroom (Agaricus bisporus) is the most
widely cultivated and consumed mushroom throughout
the world and it contributes about 40% of the total world
production of mushroom. Mushrooms are extremely per-
ishable and the shelf life of fresh mushroom is only about
24 h at ambient conditions. Various physiological and mor-
phological changes occur after harvest, which make these
mushrooms unacceptable for consumption. Hence, they
should be consumed or processed promptly after harvest
and for this reason the mushrooms are traded mostly in
processed form in the world market.
Dehydration is one of the important preservation meth-
ods employed for storage of mushroom and dehydrated
mushrooms are valuable ingredients in a variety of sauces
and soups. As mushrooms are very sensitive to tempera-
ture, choosing the right drying method can be the key for
a successful operation. Mushroom growers continue to
dry mushroom under sun, which yields unhygienic and
poor quality product. The conventional hot-air drying of
mushrooms normally involves thermal and/or chemical
pretreatment and drying at temperature maintained
between 50 and 70
C. Due to long drying time and over-
heating of surface during hot-air drying, the problems of
darkening in colour, loss in flavour and decrease in rehy-
dration ability occur. Freeze drying produces a high quality
product, but being an expensive process, its application for
mushroom drying is limited. Vacuum drying is another
0260-8774/$ - see front matter
2005 Elsevier Ltd. All rights reserved.
doi:10.1016/j.jfoodeng.2005.10.021
*
Corresponding author. Fax: +91 3222 282288.
E-mail addresses:
(S.K. Giri),
(S. Prasad).
www.elsevier.com/locate/jfoodeng
Journal of Food Engineering 78 (2007) 512–521

alternative method and is especially suitable for products
that are prone to heat damage such as fruits and vegeta-
bles. However, in vacuum process requiring heat, transfer
of heat energy to the workload becomes difficult, as con-
vection is ineffective at low pressure. Most conventional
vacuum dryers rely on conduction heat transfer from hot
plates, which is slow, difficult to control and requires a
large surface area and therefore, conventional vacuum dry-
ing has high operating and installation cost (
). The desire to prevent significant quality loss
and to achieve fast and effective dehydration has resulted
in increasing use of microwave heating for food drying.
Microwave drying is rapid, more uniform and energy
efficient compared to conventional hot-air drying. In recent
years, Microwave-vacuum drying (MVD) has been investi-
gated as a potential method for obtaining high quality
dried food products, including fruits, vegetables and
grains. Microwave-vacuum drying combines the advanta-
ges of both microwave heating and vacuum drying. The
low temperature and fast mass transfer conferred by vac-
uum combined with rapid energy transfer by microwave
heating generates very rapid, low temperature drying and
thus it has the potential to improve energy efficiency and
product quality. Some fruits and grains have been success-
fully dried by microwave-vacuum drying techniques (
). Despite those investigations, there is
scanty information available either in terms of the drying
kinetics or quality of button mushroom undergoing micro-
wave-vacuum drying technique.
The drying kinetics is often used to describe the combined
macroscopic and microscopic mechanisms of heat and mass
transfer during drying, and it is affected by drying condi-
tions, types of dryer and characteristics of materials to be
dried. Since on-line measurement of temperature and mois-
ture is difficult and time-consuming for microwave assisted
heating and drying, the drying kinetics models are essential
for equipment design, process optimization and product
quality improvement. The effect of vacuum in microwave
drying operation is system specific, and for successful design
and operation of an industrial microwave-vacuum drying
system, knowledge of the drying characteristics of the mate-
rial to be dried under a range of condition is vital (
). The aim of the present work
was to investigate microwave-vacuum drying characteristics
of button mushroom slices and to compare with convective
hot-air drying in respect to drying kinetics, rehydration qual-
ities and micro structural changes of the dried products.
2. Material and methods
2.1. Materials
Fresh button mushrooms (A. bisporus) were obtained
from market and kept in cold storage at 4–5
C. Prior to
dehydration, mushrooms were thoroughly washed to
remove the dirt and graded by size to eliminate the varia-
tions in respect to exposed surface area. Slices of desired
thickness were obtained by carefully cutting mushrooms
vertically with a vegetable slicer and the slices from middle
portions with characteristics mushroom shape were used
for drying experiments without any pretreatments. They
were immediately weighed and placed into the dryer. Mois-
ture content of the samples was determined in a vacuum
oven at 70
C for 14–16 h (
). The initial mois-
ture content of the slices was ranged from 92% to 93%
(w.b.).
2.2. Drying
2.2.1. Hot-air drying
The mushroom slices were hot-air dried at air tempera-
ture of 50, 60 and 70
C in a cross-flow type dryer with air
flow rates of 1.5 m/s. Air was heated electrically before
entering the heater. Slices were spread in a single layer on
the tray. During air drying, weight and temperature of
the sample were recorded at regular interval of times.
2.2.2. Microwave-vacuum drying
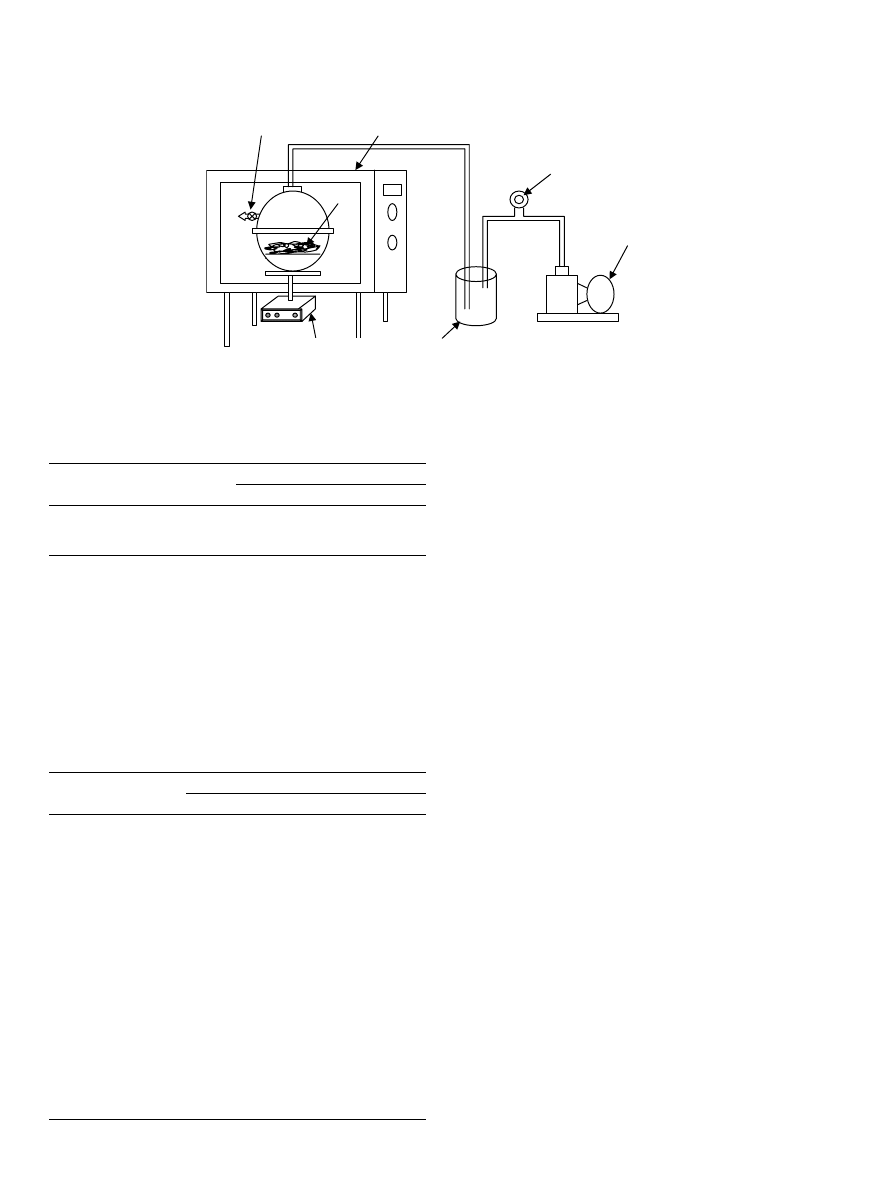
The experimental setup used for the microwave-vacuum
drying of the samples is depicted in
, which consists
of a microwave oven (IFB, model electron) of rated capac-
ity of 600 W at 2.45 GHz. The oven is modified to give
variable power output (from 0 to 600 W) by incorporating
a 230 V AC variac in the circuit (
A glass container containing the material to be dried was
placed inside the microwave cavity and a vacuum pump
was connected to the container for maintaining the desired
levels of vacuum inside it. Vacuum in the container was
monitored by using a vacuum gauge and a pressure regu-
lating valve to maintain the pressure at desirable levels. An
air tight condenser was also used in the vacuum line for
condensing the water vapour released from the samples.
About 100 g of sliced mushrooms were taken for each dry-
ing experiments in the microwave-vacuum dryer at differ-
ent microwave power and pressure levels. The sample
remained in the container for a specified time interval
while drying took place. The weight of the sample was
recorded at every 5 min intervals by switching off the
microwave oven and after releasing the vacuum, which
took about 40 s for each observation. The samples were
dried till the moisture content was reduced to 6–6.5%
(w.b.).
The variables chosen for microwave-vacuum drying
experiments were microwave power (Q), system pressure
(P) and thickness of the slices (T). Response surface
methodology was used to determine the relative contribu-
tions of the above three variables to the drying character-
istics and rehydration ratio. Twenty experiments were
performed according to a central composite rotatable
design with the three variables and with five levels of each
variable. The maximum and minimum variable levels
S.K. Giri, S. Prasad / Journal of Food Engineering 78 (2007) 512–521
513
were selected on the basis of preliminary drying experi-
ments.
gives the levels of variables in coded
and actual levels and
shows the combination of
variable levels used in the central composite design.
Experiments were randomized in order to minimize the
effects
of
unexplained
variability
in
the
observed
responses due to extraneous factors. The center point in
the design was repeated six times to calculate the repro-
ducibility of the method.
2.3. Modeling drying data
Various transport properties like moisture and thermal
diffusivity and mass and heat transfer coefficients, describe
completely the drying kinetics, although in the literature
sometimes the drying rate constant is used as their combina-
tion and as a trial for standardizing a process description
independently from the controlling mechanism (
). The exponential model, Eq.
and empirical Page’s
model, Eq.
, have been used to describe the drying kinet-
ics of various agricultural materials in convective and
microwave-convective drying (
2001; Pravanjan, Ramaswamy, & Raghavan, 1995; Sharma
& Prasad, 2001
). Both the models were tested for their
validity to mushroom under microwave-vacuum drying:
MR
¼ expðKtÞ;
ð1Þ
MR
¼ expðkt
n
Þ;
ð2Þ
where MR = moisture ratio = (M
M
e
)/(M
0
M
e
); M =
moisture content (kg water/kg dry matter) at time t;
M
e
= equilibrium moisture content (kg water/kg dry mat-
ter); M
0
= initial moisture content (kg water/kg dry mat-
ter) at time = 0; K = drying rate constant (min
1
); k and
n are the parameters of Page’s model; and t = drying time
in min.
The equilibrium moisture content during microwave-
vacuum drying is considered zero, due to vacuum condi-
tions of the process (
Kiranoudis, Tsami, & Maroulis,
). The parameters K, k and n of the above equations
were evaluated through non-linear regression analysis
using SYSTAT computer program. The goodness of fit
of the tested mathematical models to the experimental
data was evaluated from the coefficient of determination
(R
2
). The higher the R
2
-value, the better is the goodness
of fit.
Pressure regulating
valve
Microwave
oven
Vacuum pump
Vacuum gauge
Condenser
Product
Balance
Fig. 1. Experimental microwave-vacuum drying apparatus.
Table 1
Levels of microwave-vacuum drying process variables
Variable
Name (units)
Level
1.68
1
0
1
1.68
Q
Microwave power (W)
115
150
200
250
285
P
System pressure (kPa)
6.5
10
15
20
23.5
T
Thickness (mm)
5.8
7.5
10
12.5
14.2
Table 2
Central composite design showing variable level combinations
Experiment no.
Variable levels
Q
P
T
1
1
1
1
2
1
1
1
3
1
1
1
4
1
1
1
5
1
1
1
6
1
1
1
7
1
1
1
8
1
1
1
9
1.68
0
0
10
1.68
0
0
11
0
1.68
0
12
0
1.68
0
13
0
0
1.68
14
0
0
1.68
15
0
0
0
16
0
0
0
17
0
0
0
18
0
0
0
19
0
0
0
20
0
0
0
514
S.K. Giri, S. Prasad / Journal of Food Engineering 78 (2007) 512–521
2.4. Rehydration
Rehydration ratio (RR) which is a measure of rehydra-
tion characteristics of dried mushroom slices was deter-
mined by immersing 5 g of dried samples in distilled
water at 30 and 100
C temperatures. The water was
drained and the samples weighed at every 30 min intervals
for those immersed at 30
C and at every 2 min intervals
for those at 100
C. Triplicate samples were used. Rehydra-
tion ratio was defined as the ratio of weight of rehydrated
samples to the dry weight of the sample.
2.5. Scanning electron microscopy (SEM)
The structure of the dehydrated mushroom slices was
examined using a scanning electron microscope (JEOL
JSM-5800) coupled with an energy dispersive X-ray micro
analytical system (OXFORD ISIS-300). Thin slice of about
1 mm thick was cut from the dried samples and fixed on the
SEM stub, which were subsequently coated with gold in
order to provide a reflective surface for the electron
beam. Gold coating was carried out in a sputter coater
(BIO-RAD E-5200) under a low vacuum with the presence
of the inert gas, argon. The gold-coated samples were sub-
sequently viewed under the microscope.
3. Results and discussion
3.1. Drying kinetics
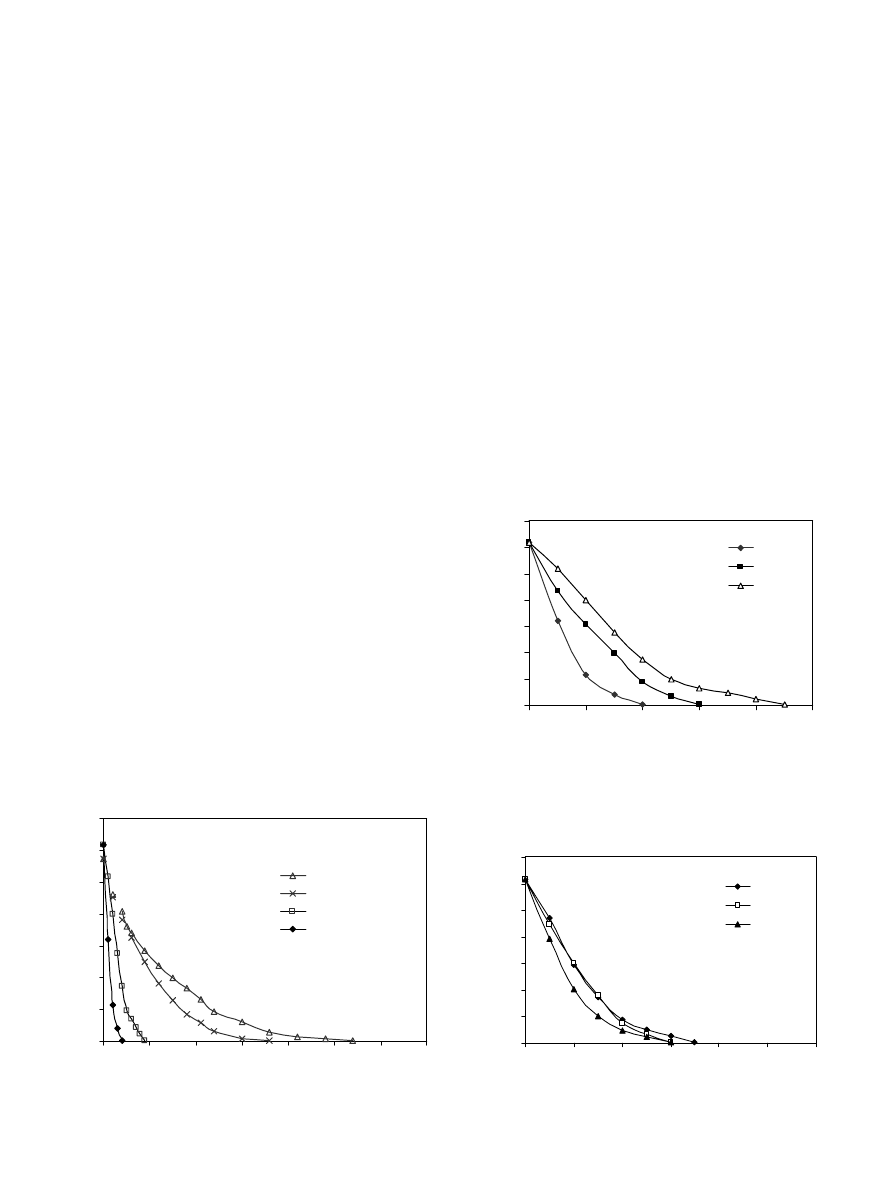
The drying curves for thin layer drying of mushroom
slices under microwave-vacuum drying and hot-air drying
conditions are shown in
, where the moisture content
of the samples at various time intervals and for varying
microwave power level and at various drying air tempera-
tures is recorded. The time required to reduce the moisture
content to any given level in microwave-vacuum drying
was dependent on the power level, being the highest at
115 W and lowest at 285 W. Mushroom having 92% initial
moisture content dried to a final moisture content of 6%
within 45 and 20 min at microwave power level of 115
and 285 W, respectively, at pressure level of 15 kPa. By
comparison, similar mushroom samples under convective
hot-air drying took 270 and 180 min at drying air temper-
ature 50 and 70
C, respectively. Thus, the microwave-
vacuum drying times were around 90% shorter at 285 W
and 75% shorter at 115 W than the corresponding convec-
tive air drying times.
further show the effect of changing the process
variables, namely microwave power, system pressure and
sample thickness on drying time during microwave-vacuum
drying. It is evident that the drying time decreases with the
increase in power output. When microwave power level
and product thickness remain constant, the drying rate at
higher vacuum level was slightly greater. However, the
effect of system pressure on drying time was not as signifi-
cant as that of microwave power. Concerning the effect of
the sample size on drying time, mushroom slices of smaller
0
2
4
6
8
10
12
14
0
50
100
150
200
250
300
350
Drying time, min
Moisture content, kg/kg dry matter
AD: 50
°C
AD: 70
°C
MVD: 115 W, 15 kPa
MVD: 285 W, 15 kPa
Fig. 2. Drying curves of air-dried (AD) and microwave-vacuum dried
(MVD) mushroom slice (10 mm thick).
0
2
4
6
8
10
12
14
0
10
20
30
40
Drying time, min
Moisture content, kg/kg dry matter
50
285 W
200 W
115 W
Fig. 3. Effect of microwave power levels on drying time for 10 mm thick
mushroom slices during MVD at 15 kPa system pressure.
0
2
4
6
8
10
12
14
0
10
20
30
40
50
60
Drying time, min
Moisture content, kg /kg dry matter
23.5 kPa
15 kPa
6.5 kPa
Fig. 4. Effect of pressure levels on drying time for 10 mm thick mushroom
slices during MVD at 200 W microwave power.
S.K. Giri, S. Prasad / Journal of Food Engineering 78 (2007) 512–521
515
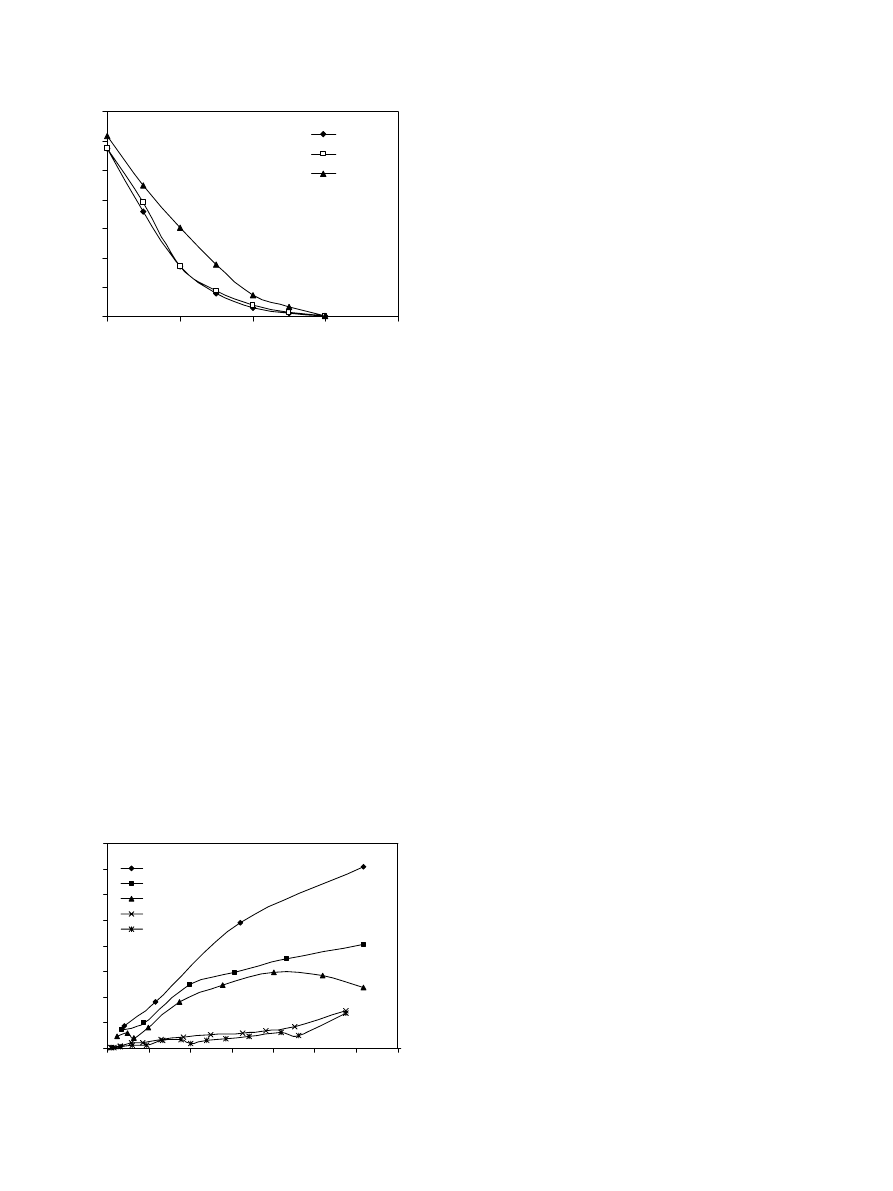
thickness exhibited more rapid dehydration. This can be
attributed to enhanced water transport phenomena within
the sample, which favour the thin samples.
The influence of microwave power on drying rate is
illustrated in
. There were no constant rates drying
under any of the test conditions. Although high moisture
foods like mushrooms can be expected to have a constant
rate of drying, this was not observed in the present study,
may be because of the thin (single) layer arrangement and
too rapid heating by microwaves, providing instant dry-
ing. As expected, higher drying rates were obtained with
higher microwave power. It can be seen from the figure
that the influence of power on drying rate is markedly
higher when the moisture is higher. At moisture content
of less than 4.0 kg/kg d.b. there is no difference in the dry-
ing rates among different power levels, indicating the sig-
nificance of internal resistance to mass transfer at low
water content in the material. The amount of microwave
energy absorbed by the material depends upon its dielec-
tric properties and the electric field strength (
). As the values of dielectric constant and loss factors
are higher at higher moisture content of the material,
obviously the material absorbs more microwave power
and heating is faster at high moisture content. As drying
progressed, the loss of moisture in the product decreases
the absorption of microwave power and resulted in a
fall in the drying rate during the later part of drying
(
Kharaisheh, Cooper, & Magee, 1995; Sharma & Prasad,
). Microwave heating under vacuum resulted in large
increase in drying rates (almost three to five-folds) as
compared to hot-air drying throughout the drying pro-
cess.
3.2. Modeling of the thin layer drying data of mushroom
slices
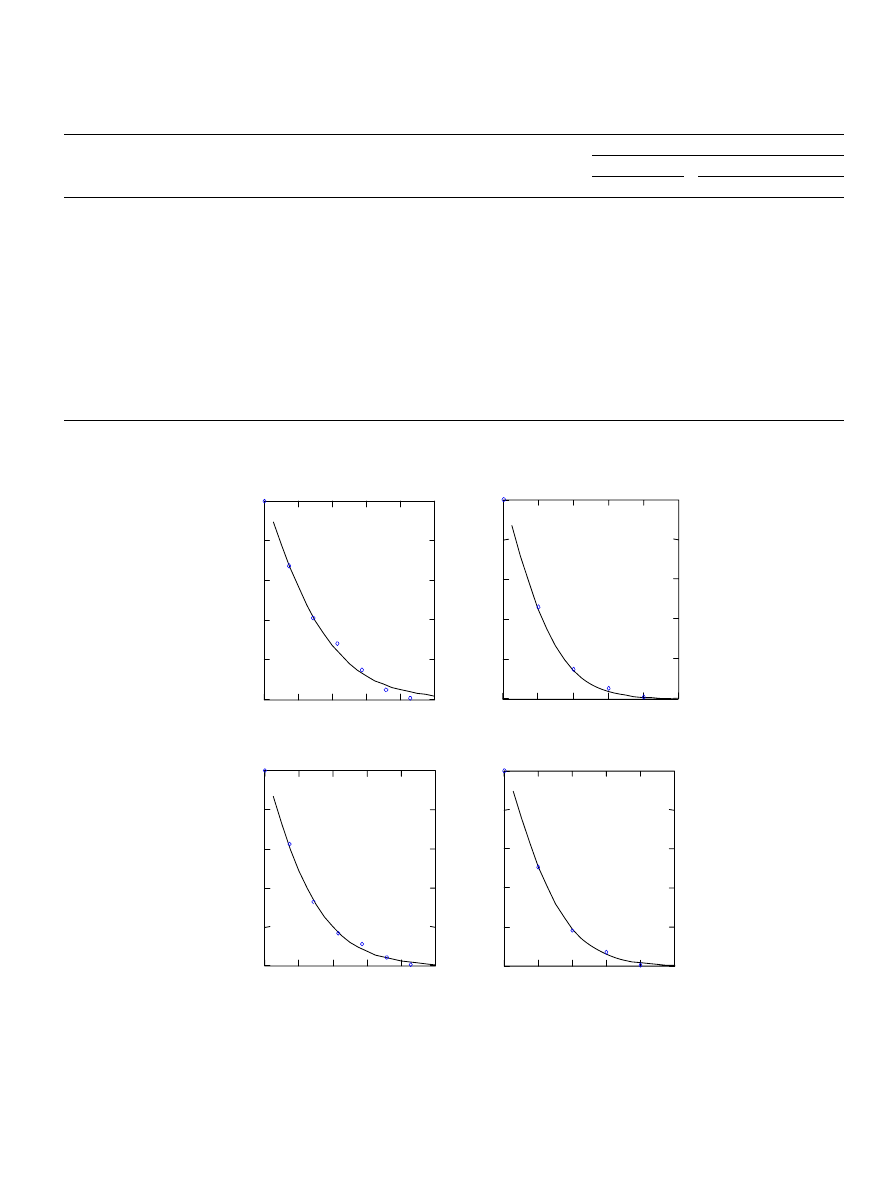
lists the model constants obtained by applica-
tion of exponential and Page’s equation to the experimen-
tal drying data. The empirical Page’s model gave better fit
for the drying data under all conditions tested with higher
R
2
(coefficient of determination) values. A good agreement
was found between the experimental and fitted values with
the R
2
-values of greater than 0.99 (
). The drying con-
stant (K) increased from 0.017 to 0.03 min
1
with the
increase in drying air temperature from 50 to 70
C for
7.5 mm thick mushroom slices. It can be seen that K- and
k-values for microwave-vacuum drying were higher than
hot-air drying. In microwave-vacuum drying of mushroom
slices of a particular thickness, these values were found to
increase as the microwave power was increased and pres-
sure was reduced. This can be attributed to the fact that
higher microwave power, lower pressure and smaller sam-
ple size help in increasing the driving force of heat and
mass transfer. For parameter n, it did not possess a clear
trend. For air drying, the n-values were close to one where
as in case of microwave-vacuum method the values were
more than one. The values for parameters ‘K’, ‘k’ and ‘n’
are in close proximity to those reported in the literature
for button mushrooms and other products (
The effect of process variables (microwave power, sys-
tem pressure and thickness) on rate constants were studied
by response surface method and fitting the data to a second
order
polynomial
model.
The
analysis
of
variance
(ANOVA) in
shows the significance of the models
and individual model terms. The models are found highly
significant (p < 0.05) with R
2
-values more than 0.86 (Eqs.
). The rate constant, K was highly affected by
microwave power and slice thickness, as the linear as well
as quadratic terms of these variables are significant. In case
of Page’s model constant, k, the linear effect of all the pro-
cess variables were found significant, with microwave
power having strongest effect as can be seen from
corresponding F-values. Significant lack of fit of the models
implied that a high proportion of the variability was
0
10
20
30
40
50
60
70
80
0
8
10
12
14
Moisture content, kg/kg dry matter
Drying rate, kg water/kg dry matter-hr
MVD: 285 W, 15 kPa
MVD: 200 W, 15 kPa
MVD: 115 W, 15 kPa
AD: 70
°C
AD: 50
°C
2
4
6
Fig. 6. Comparison of drying rate for microwave-vacuum drying and air
drying of 10 mm thick mushroom slices.
0
2
4
6
8
10
12
14
0
10
20
30
Drying time, min
Moisture content, kg /kg dry matter
40
6 mm
10 mm
14 mm
Fig. 5. Effect of slice thickness on drying time during MVD of mushroom
slices at 200 W microwave power and at 15 kPa system pressure.
516
S.K. Giri, S. Prasad / Journal of Food Engineering 78 (2007) 512–521
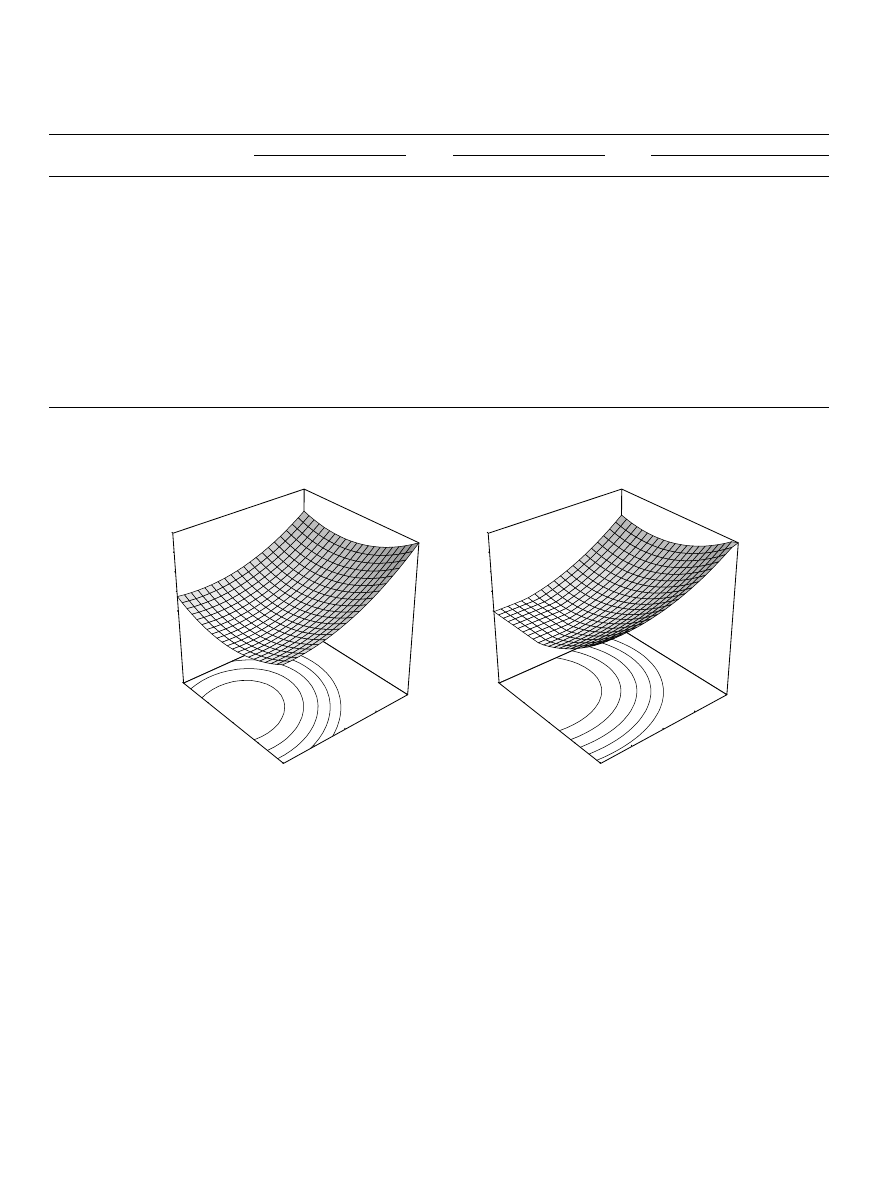
not explained by the data. The variation of ‘K’ and ‘k’
with microwave power and slice thickness are depicted in
Regression analysis of the drying rate constant, K and k
versus MW power (Q), system pressure (P) and thickness
(T) yielded the following second order equations:
Table 3
Effect of various drying conditions on parameters of exponential and empirical Page’s model
Drying method
Thickness (mm)
Air temperature (
C)
Microwave power (W)
Pressure (kPa)
Model parameters
Exponential
Page
K (min
1
)
R
2
k (min
1
)
n
R
2
AD
7.5
50
–
–
0.017
0.987
0.025
0.997
0.996
60
–
–
0.026
0.990
0.028
1.02
0.994
70
–
–
0.030
0.995
0.033
0.98
0.995
12.5
50
–
–
0.011
0.995
0.011
0.985
0.996
60
–
–
0.014
0.994
0.012
1.06
0.994
70
–
–
0.020
0.996
0.019
1.034
0.995
MVD
7.5
–
150
10
0.110
0.997
0.074
1.168
0.999
–
20
0.092
0.995
0.055
1.197
0.996
–
250
10
0.175
0.997
0.099
1.289
0.999
–
20
0.157
0.997
0.085
1.281
0.999
12.5
–
150
10
0.082
0.985
0.024
1.482
0.998
–
20
0.080
0.986
0.023
1.471
0.997
–
250
10
0.137
0.994
0.064
1.345
0.999
–
20
0.129
0.990
0.048
1.443
0.999
AD—air drying; MVD—microwave-vacuum drying.
Q = 150 W
P = 20 kPa
0
7
14
21
28
35
Time, min
0.0
0.2
0.4
0.6
0.8
1.0
MR
Q = 250 W
P = 20 kPa
0
5
10
15
20
25
Time, min
0.0
0.2
0.4
0.6
0.8
1.0
Q = 150 W
P = 10 kPa
0
7
14
21
28
35
Time, min
0.0
0.2
0.4
0.6
0.8
1.0
Q =250 W
P =10 kPa
0
5
10
15
20
25
Time, min
0.0
0.2
0.4
0.6
0.8
1.0
MR
MR
MR
Fig. 7. Moisture ratio (MR) versus time comparing experimental curves with the predicted one (–) by Page’s equation for microwave-vacuum drying of
mushroom.
S.K. Giri, S. Prasad / Journal of Food Engineering 78 (2007) 512–521
517
K
¼ 0:434 1:03 10
3
Q
0:011 P 0:04 T
þ 4:17 10
6
Q
2
þ 2:7 10
4
P
2
þ 2:15 10
4
T
2
þ 1:35 10
5
QP
2:7 10
5
QT
7:0 10
5
PT
ðR
2
¼ 0:93Þ;
ð3Þ
k
¼ 0:342 6:0 10
4
Q
9:28 10
3
P
0:034T
þ 2:24 10
6
Q
2
þ 2:38 10
4
P
2
þ 1:24 10
3
T
2
5:0 10
6
QP
þ 1:0 10
5
QT
þ 1:6 10
4
PT
ðR
2
¼ 0:86Þ.
ð4Þ
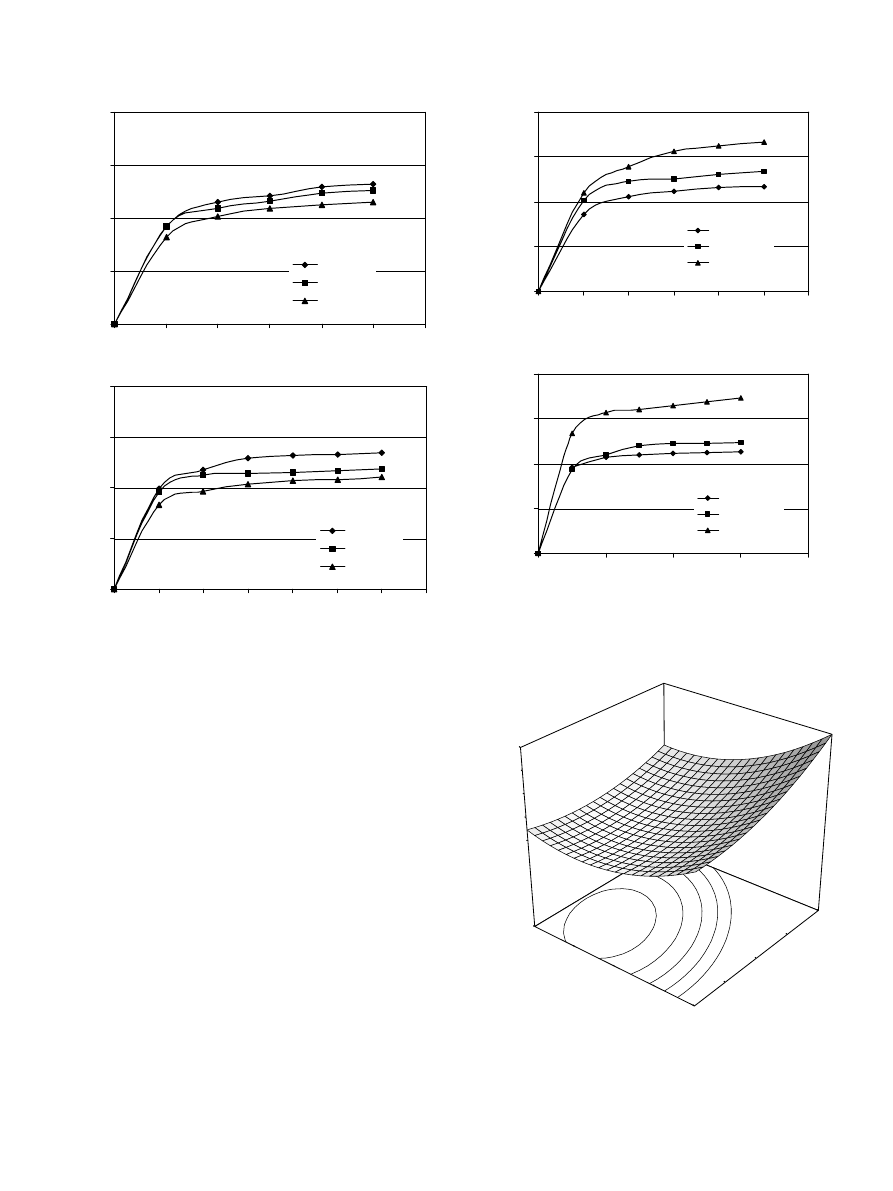
3.3. Rehydration characteristics
The rehydration curves of microwave-vacuum dried
mushroom samples, both at ambient (30
C) and at
100
C water temperatures, as affected by microwave
power and pressure levels are shown in
.
In all the cases the amount of moisture absorbed increases
with rehydration time, but at a decreasing rate up to sat-
uration level. The rehydration stabilized in about 10 min
at 100
C and in 3 h at 30 C and the rehydration ratio
was in the range of 2.3–3.4 under various drying condi-
tions. Rehydration properties were improved by drying
at lower system pressure and higher microwave power
as indicated by higher values of rehydration ratio. Simi-
lar results were reported by
(1996), Durance and Wang (2002), Pappas, Tsami, and
Marinos-Kouris (1999)
. The regression model for RR
relating the microwave-vacuum drying process variables
was found as
Table 4
ANOVA showing the linear, quadratic and cross-product effect of the variables on rate constants and rehydration ratio
Source of variation
df
K
k
RR
Mean square
F-value
Mean square
F-value
Mean square
F-value
Model
9
1.85
· 10
3
14.46
9.21
· 10
4
6.93
0.16
Q
1
1.10
· 10
2
87.27
3.58
· 10
3
26.96
0.11
2.44
P
1
2.01
· 10
4
1.57
7.92
· 10
4
5.96
0.61
T
1
9.98
· 10
4
7.78
2.30
· 10
3
17.42
0.34
Q
2
1
1.57
· 10
3
12.21
4.54
· 10
4
3.43
0.012
0.27
P
2
1
6.50
· 10
4
5.06
5.13
· 10
4
3.87
0.16
3.75
T
2
1
2.60
· 10
3
20.26
8.63
· 10
4
6.50
0.087
2.02
QP
1
9.11
· 10
5
0.71
1.25
· 10
5
0.094
0.017
0.40
QT
1
9.11
· 10
5
0.71
1.25
· 10
5
0.094
0.053
1.22
PT
1
6.12
· 10
6
0.048
3.21
· 10
5
0.24
0.021
0.49
Residual
10
1.28
· 10
4
1.32
· 10
4
0.043
Lack of fit
5
2.54
· 10
4
94.07
2.55
· 10
4
16.59
0.079
Pure error
5
2.70
· 10
6
1.51
· 10
5
0.0075
Total
19
df—Degree of freedom; F-ratio of variance estimate.
*
Significant at 1%.
**
Significant at 5%.
0.065
0.104
0.143
0.182
0.221
K (1/min)
115
158
200
243
285
6.0
8.0
10.0
12.0
14.0
Q (W)
T (mm)
(a)
0.022
0.045
0.068
0.090
0.113
k (1/min)
115
158
200
243
285
6.0
8.0
10.0
12.0
14.0
Q (W)
T (mm)
(b)
Fig. 8. Effect of microwave power and slice thickness on (a) drying rate constant (K) and (b) Page equations parameter (k), during microwave-vacuum
drying at 15 kPa pressure.
518
S.K. Giri, S. Prasad / Journal of Food Engineering 78 (2007) 512–521
RR
¼ 3:94 þ 0:0156Q 0:173P 0:244T 1:13 10
5
Q
2
þ 4:24 10
3
P
2
þ 0:012T
2
1:85 10
4
QP
6:5 10
4
QT
þ 4:1 10
3
PT
ðR
2
¼ 0:77Þ.
ð5Þ
The response surface plot for rehydration ratio is shown
in
) it can be concluded
that the rehydration ratio depends mainly on pressure level
while sample thickness and microwave power had less
effect. While the rehydration ratio is positively correlated
with microwave power that of system pressure is negatively
correlated. As the pressure level decreases, the rehydration
ratio increases, owing to the increased drying rate and
creation of pores that are induced by vacuum conditions
(
). The higher RR at higher micro-
wave power can be attributed to the development of greater
internal stresses during drying at higher power levels. The
quick microwave energy absorption causes rapid eva-
poration of water, creating a flux of rapidly escaping
vapour which helps in preventing the shrinkage and case
hardening, thus improving the rehydration characteristics
Kharaisheh et al., 1995; Lyons, Hatcher, & Sunderland,
). It is also clear from
0.0
1.0
2.0
3.0
4.0
0
4
6
10
12
Rehydration time (min)
Rehydration ratio
Q = 285 W
Q = 200 W
Q = 115 W
(a)
0.0
1.0
2.0
3.0
4.0
0
0.5
1.5
2
2.5
Rehydration time (h)
Rehydration ratio
Q = 285 W
Q = 200 W
Q = 115 W
(b)
2
8
1
3
3.5
Fig. 9. Effect of microwave power on rehydration ratio of 10 mm thick
mushroom slices dried at 15 kPa pressure: (a) at 100
C and (b) at 30 C
water temperature.
0.0
1.0
2.0
3.0
4.0
0
4
8
10
12
Rehydration time (min)
Rehydration ratio
P = 23.5 kPa
P = 15 kPa
P = 6.5 kPa
(a)
0.0
1.0
2.0
3.0
4.0
0
2
4
Rehydration time (h)
Rehydration ratio
P = 23.5 kPa
P = 15 kPa
P = 6.5 kPa
(b)
3
1
2
6
Fig. 10. Effect of system pressure on rehydration ratio of 10 mm thick
mushroom slices dried at 200 W microwave power: (a) at 100
C and (b) at
30
C water temperature.
2.37
2.73
3.08
3.43
3.78
Rehydration Ratio
6.5
10.8
15.0
19.3
23.5
6.0
8.0
10.0
12.0
14.0
P (kPa)
T (mm)
Fig. 11. Effect of system pressure and thickness on rehydration ratio of
mushroom slices dried at 200 W microwave power.
S.K. Giri, S. Prasad / Journal of Food Engineering 78 (2007) 512–521
519
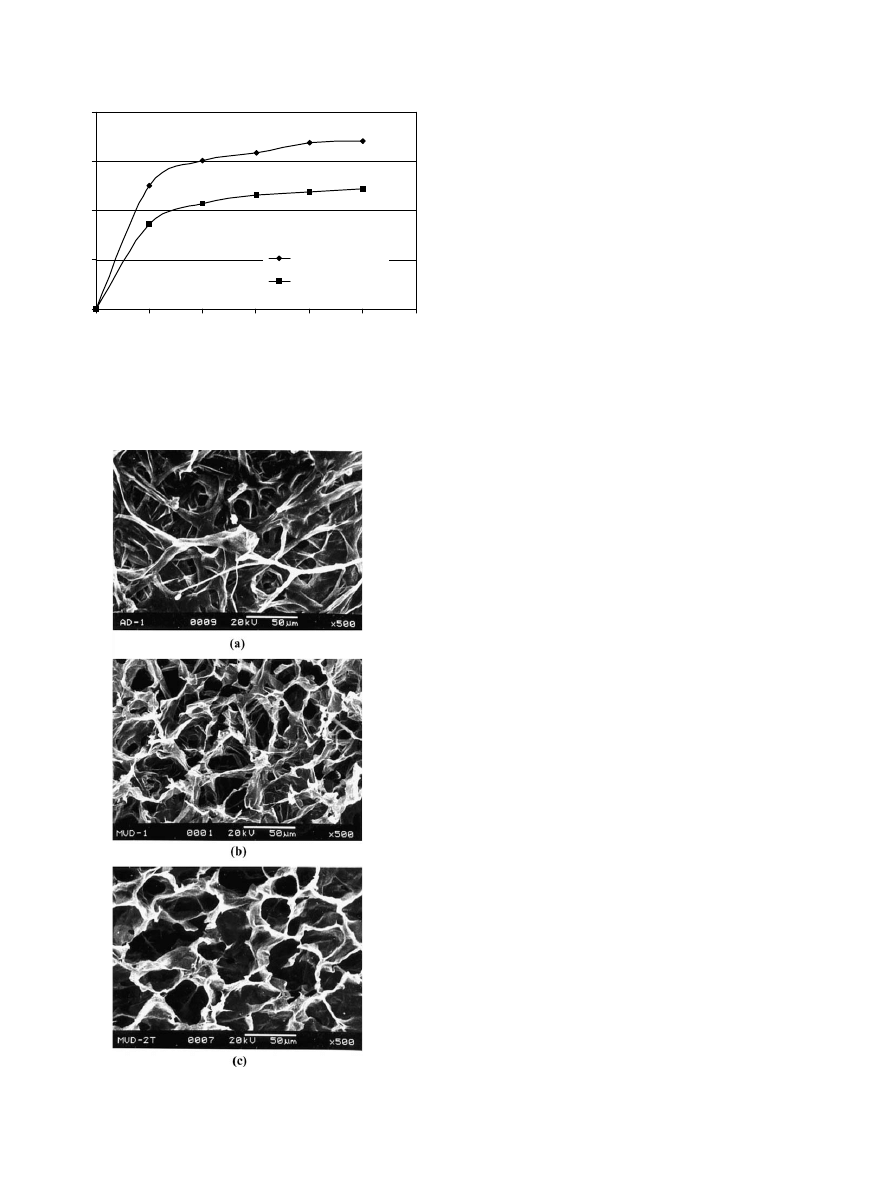
that the rehydration capacity, both in terms of final
moisture content and speed is higher for the microwave-
vacuum dried samples in comparison to air-dried samples.
Microwave-vacuum drying creates a porous structure with
very little shrinkage than those obtained by air drying,
thereby providing better rehydration char-acteristics.
3.4. SEM
Effect of different drying methods and conditions on the
structure of dried mushrooms was observed under scan-
ning electron microscope. In air-dried samples (
there is very less open structure and pores as compared
to microwave-vacuum dried samples (
b and c), indi-
cating severe tissue shrinkage and collapse during air dry-
ing. The less shrinkage in the microwave-vacuum dried
samples may be due to the shorter drying time, lower dry-
ing temperature and some tissue expansion from internal
water vapour. Again the structure is more porous in sam-
ples dried under more vacuum conditions (
c) during
microwave-vacuum drying.
4. Conclusions
Microwave-vacuum drying of mushroom was much fas-
ter than conventional hot-air drying, particularly towards
the end of the drying process. The exponential as well as
empirical Page’s model adequately described the micro-
wave-vacuum drying data. Statistical analysis of the drying
data showed that drying rate constant was highly influ-
enced by microwave power while system pressure had high-
est influence on the rehydration characteristics of the
dehydrated mushroom in a p 6 0.05. Sample thickness also
appeared to be factor influencing the drying rate with thin-
ner sample resulting in quick drying. Microwave-vacuum
dried mushroom also created a more porous dehydrated
product, which rehydrated more quickly and more com-
pletely than the air dried product. The button mushroom
slices could be microwave-vacuum dried to 6% moisture
content (w.b.) in 25–30 min, avoiding any burning of the
product and with good rehydration characteristics.
References
AOAC (1984). Official methods of analysis of the Association of Official
Analytical Chemists (14th ed.). Washington, DC.
Arora, S., Shivhare, U. S., Ahmed, J., & Raghavan, G. S. V. (2003).
Drying kinetics of Agaricus bisporus and Pleurotus florida mushrooms.
Transaction of the ASAE, 46(3), 721–724.
Cui, Z. W., Xu, S. Y., & Sun, D. W. (2003). Dehydration of garlic slices by
combined microwave-vacuum and air drying. Drying Technology,
21(7), 1173–1184.
Drouzas, A. E., & Schubert, H. (1996). Microwave application in vacuum
drying of fruits. Journal of Food Engineering, 28, 203–209.
Drouzas, A. E., Tsami, E., & Saravacos, G. D. (1999). Microwave vacuum
drying of model fruit gel. Journal of Food Engineering, 39, 117–122.
Durance, T. D., & Wang, J. H. (2002). Energy consumption, density and
rehydration rate of vacuum microwave and hot air convection
dehydrated tomatoes. Journal of Food Science, 67(6), 2212–2216.
0.0
1.0
2.0
3.0
4.0
0
8
10
12
Rehydration time (min)
Rehydration ratio
MVD: 200W, 15 kPa
AD: 60
°C
2
4
6
Fig. 12. Comparison of rehydration ratio of microwave-vacuum and air-
dried mushroom slices.
Fig. 13. Scanning electron micrographs of dried mushroom: (a) air-dried
at 60
C, (b) microwave-vacuum dried at 20 kPa pressure and (c)
microwave-vacuum dried at 10 kPa.
520
S.K. Giri, S. Prasad / Journal of Food Engineering 78 (2007) 512–521

Jasna, P. K., Sander, A., & Skansi, D. (2001). Comparison of convective,
vacuum and microwave drying chlorpropamide. Drying Technology,
19(1), 167–183.
Kar, A., & Gupta, D. K. (2003). Air drying of osmosed button
mushrooms. Journal of Food Science and Technology, 40(1), 23–27.
Kharaisheh, M. A. M., Cooper, T. J. R., & Magee, T. R. A. (1995).
Investigation and modeling of combined microwave and air drying.
Transaction of Institution of Chemical Engineers, 73(c), 121–126.
Kiranoudis, C. T., Tsami, E., & Maroulis, Z. B. (1997). Microwave vacuum
drying kinetics of some fruits. Drying Technology, 15(10), 2421–2440.
Lin, T. M., Durance, T. D., & Scaman, C. H. (1998). Characterization of
vacuum microwave, air and freeze-dried carrot slices. Food Research
International, 31(2), 111–117.
Lyons, D. W., Hatcher, J. D., & Sunderland, J. E. (1972). Drying of a
porous medium with internal heat generation. International Journal of
Heat and Mass Transfer, 15(5), 897–905.
McLoughlin, C. M., McMinn, W. A. M., & Magee, T. R. A. (2003).
Microwave-vacuum drying of pharmaceutical powders. Drying Tech-
nology, 21(9), 1719–1733.
Mudgett, R. E. (1990). Developments in microwave food processing. In H.
E. Schwartzberg & M. A. Rao (Eds.), Biotechnology and food process
engineering. Basic symposium series (pp. 359–403). New York: Marcel
Dekker.
Mujumdar, A. S. (1995). Handbook of industrial drying (2nd ed.). New
York: Marcel Dekker.
Pappas, C., Tsami, E., & Marinos-Kouris, D. (1999). The effect of process
conditions on the drying kinetics and rehydration characteristics of
some microwave-vacuum dehydrated fruits. Drying Technology, 17
(1 and 2), 157–174.
Pravanjan, D. G., Ramaswamy, H. S., & Raghavan, G. S. V. (1995).
Microwave assisted convective air drying of thin layer carrots. Journal
of Food Engineering, 25, 283–293.
Sharma, G. P., & Prasad, S. (2001). Drying of garlic (Allium sativum)
cloves by microwave-hot air combination. Journal of Food Engineering,
50, 99–105.
Wardsworth, J. I., Velupillai, L., & Verma, L. R. (1990). Microwave-
vacuum drying of parboiled rice. Transactions of ASAE, 33(1),
199–210.
Woodroof, J. G., & Luh, B. S. (1986). Commercial fruit processing.
Westport, CN: The AVI Publishing Company.
Yongsawatdigul, J., & Gunasekaran, S. (1996a). Microwave vacuum
drying of cranberries, part I: Energy use and efficiency. Journal of Food
Processing and Preservation, 20, 121–143.
Yongsawatdigul, J., & Gunasekaran, S. (1996b). Microwave vacuum
drying of cranberries, part II: Quality evaluation. Journal of Food
Processing and Preservation, 20, 145–156.
S.K. Giri, S. Prasad / Journal of Food Engineering 78 (2007) 512–521
521
Document Outline
- Drying kinetics and rehydration characteristics of microwave-vacuum and convective hot-air dried mushrooms
Wyszukiwarka
Podobne podstrony:
Characterization of microwave vacuum drying and hot air drying of mint leaves (Mentha cordifolia Opi
Drying kinetics and drying shrinkage of garlic subjected to vacuum microwave dehydration (Figiel)
Drying, shrinkage and rehydration characteristics of kiwifruits during hot air and microwave drying
Drying kinetics and drying shrinkage of garlic subjected to vacuum microwave dehydration (Figiel)
Drying kinetics and quality of vacuum microwave dehydrated garlic cloves and slices
Drying kinetics and quality of beetroots dehydrated by combination of convective and vacuum microwav
Drying kinetics and quality of potato chips undergoing different drying techniques
The drying kinetics of kale (Brassica oleracea) in a convective hot air dryer
Drying kinetics of apple cylinders under combined hot air–microwave dehydration
Energy Consumption and Colour Characteristics of Nettle Leaves during Microwave, Vacuum and Convecti
Microwave Drying of Parsley Modelling, Kinetics, and Energy Aspects
Microwave drying characteristics of potato and the effect of different microwave powers on the dried
Improving nutritional value of dried blueberries combining microwave vacuum, hot air drying and free
Headspace Volatiles and Physical Characteristics of Vacuum microwave, Air, and Freeze dried Oregano
Thin layer modelling of the convective, microwave, microwave convective and microwave vacuum drying
Microwave vacuum drying of porous media experimental study and qualitative considerations of interna
Microwave vacuum drying of marine sediment determination of moisture content, metals and total carbo
więcej podobnych podstron