So how can you gauge your electrical appetite? For a
quick snapshot of your electrical usage, check out your
monthly electricity bill. Most bills will include KWH usage
figures for the last twelve months; this will give you a good
idea of how much electricity your home uses each year.
Once you’ve got a handle on your electrical appetite, taking
steps to improve the efficiency of your home will be your next
best move. This can have a tremendous impact on the cost
of the system you install. Every dollar you spend on making
your home more efficient decreases the cost of your system
by approximately US$3 to $5. (For more information, see
“Calculating Your Energy Appetite,” in HP102.)
A huge disparity exists between home sizes, efficiencies,
and personal electrical appetites, and there’s also a similar
gap in the efficiency potential of different homes. If you
live in an efficiently built, well-insulated home, with
modern appliances, compact fluorescent lighting, and high
performance windows, you may only be able to reduce
your average electricity use by 5 or 10 percent. But if you’re
The truth is, it’s not much easier to
answer, “How much will a solar-electric
system cost me?” than it is to answer,
“How much will it cost me to build a
house?” In either case, the answer has to
start with two words—“It depends…”
That’s because several variables influence the cost of a
grid-tied solar-electric (photovoltaic; PV) system. Although
there’s no pat answer to the price question, the guidelines
and examples here will help you estimate your costs, and
get you started on your path to energy independence.
How Hungry Is Your Home?
The average American home uses roughly 830 kilowatt-
hours (KWH) of electricity each month. But basing system
costs solely on that number would most likely give you
an inaccurate and unhelpful result. Your electrical use
may vary wildly, depending on the season, what kind of
appliances you use, and your usage habits.
home power 109 / october & november 2005
22
As Home Power’s marketing director, I spend a lot of time at fairs and
other events aimed at getting people interested in renewable energy.
Without a doubt, the question I get more than any other is, “What does
a solar-electric system cost for an average home?” Understandably,
these folks are looking for the sticker price of a grid-tied solar-electric
system, something to walk away with and compare to other home
energy or greener living “investment” possibilities.
Making
$ense
of
Solar-Electric
System
Costs
Scott Russell
©2005 Scott Russell
on the other end of that spectrum, by
implementing efficiency measures you
may be able to reduce your use by
40 percent or more, shaving several
thousand dollars off the cost of your
system. For example, just replacing
an older model refrigerator with a
modern, more efficient one could
reduce your electrical usage by 50
KWH per month. Combine this with
household-wide efficiency strategies
and you can make a pretty sizeable
dent in your system cost.
Location, Location, Location
Where you live also affects your system
costs. Less sunny locales will call for
larger systems to generate the same
amount of electricity that a smaller
system in a sunnier spot can produce. In
the solar world, sunlight is measured in
units called “peak sun hours.” Phoenix,
Arizona, receives an annual average
of 6.5 peak sun hours per day, while
Seattle, Washington, only gets 3.7 peak
sun hours per day. To determine the
peak sun hours in your region, visit the
Renewable Resource Data Center’s Web site (see Access).
Besides the number of peak sun hours in your region,
average annual temperatures where you live also affect your
system size, and its relative cost. In colder regions, you may
use lots of electricity for space heating and water heating. In
warmer regions, air conditioning can dramatically amplify
your electricity use.
Climate and other site-specific variables will also
determine your solar-electric system’s size and its
production. PV panels operate more efficiently in cooler
climates and less efficiently in hot ones. Some locations
regularly receive morning fog or afternoon thunderstorms.
In dry, dusty climates without regular rains to clean the
panels, accumulated dust and dirt will reduce the output of
the system. All of these variables need to be considered when
sizing a system and estimating its annual production.
A Place in the Sun
Even the sunniest regions won’t guarantee you good system
performance unless you have unobstructed solar access
at your site. This daily access to the sun is called your
“solar window.” You’ll need a location on your rooftop or
elsewhere on your property that:
•
Ideally faces south, but east- or west-facing arrays make
sense in some cases;
•
Provides enough space for the number of PV
panels needed, possibly including room for expansion;
•
Enables the entire array of modules unshaded
exposure to the sun between the hours of 9 AM and
3 PM, year-round.
Compromising any of these three conditions can mean
having to increase the size of your system, which increases
its cost.
A Nibble or a Bite?
One of the best features of solar electricity is its
scalability. With a little foresight, you can start small
and build your system gradually if that better suits your
budget.
A starter system can be designed to meet just a portion of
your home’s daily electricity needs. This is one great benefit
of a grid-tied system—the remainder of your electricity
can be purchased from your electric utility, just as before.
And, if you plan your design for future expansion, adding
more modules to your array as your pocketbook allows is
relatively simple.
www.homepower.com
solar
sense
23
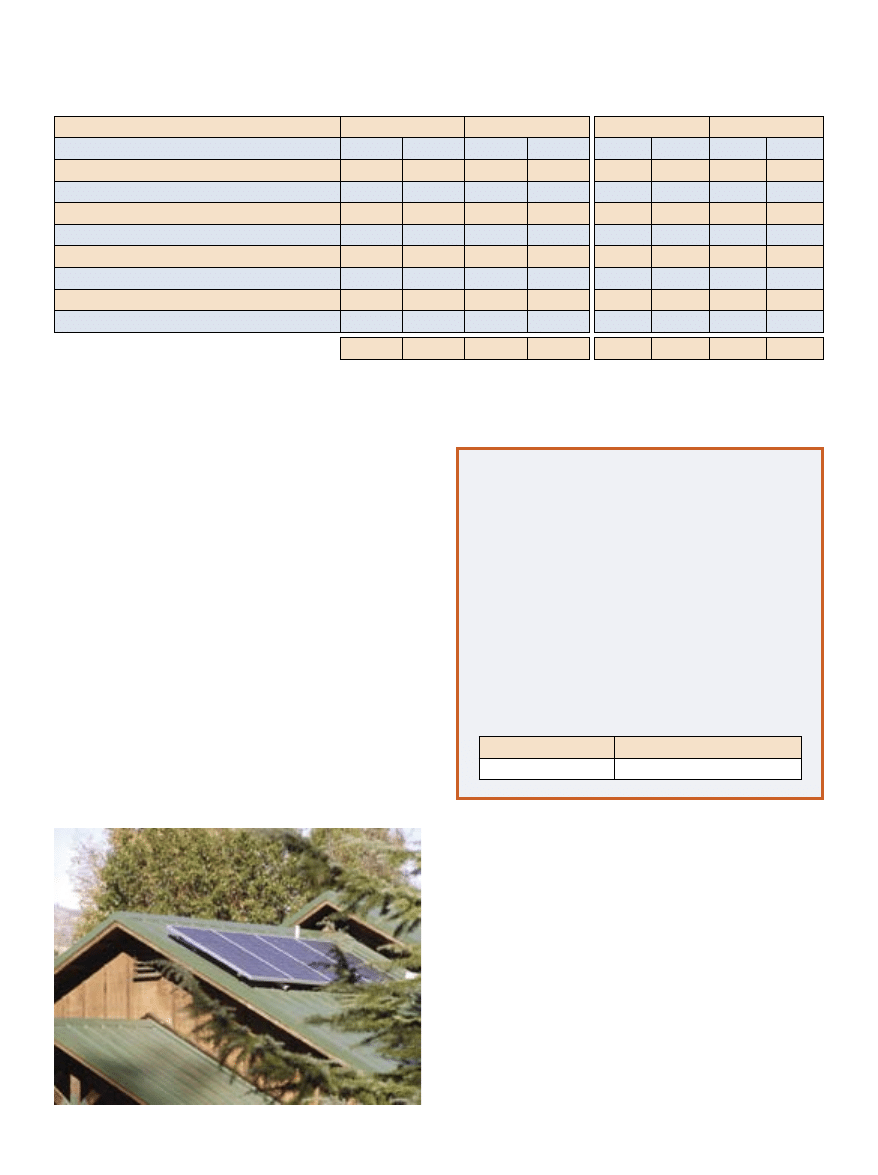
Sample Grid-Tied PV
System Costs (%)
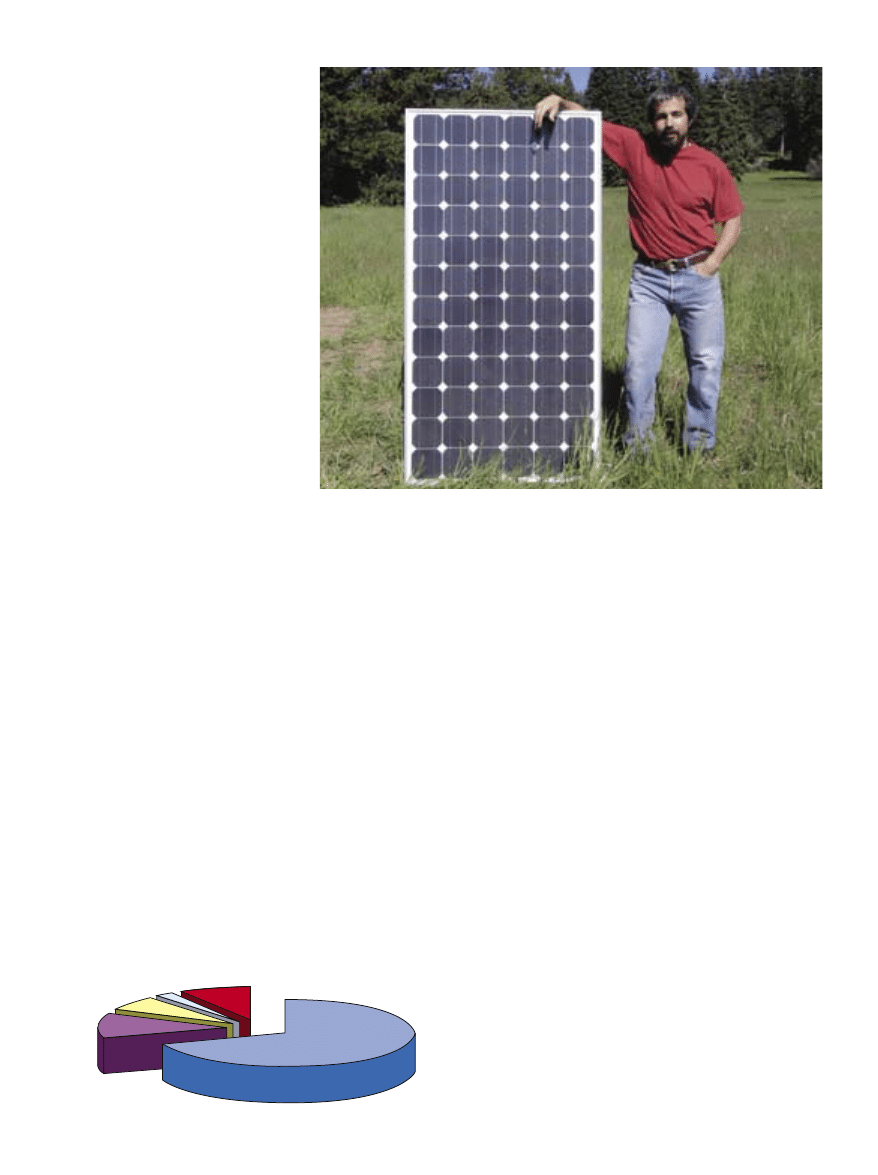
A Sharp 175-watt solar-electric module, 62 x 32.5 inches. The author, 66.25 x 18.5 inches.
PV Modules
70%
Labor
12%
Rooftop
PV Mounts
7%
Misc.
Electrical
2%
Inverter
9%
Free Money
Perhaps the most powerful impetus behind the exploding
popularity of grid-tied solar electricity is the availability
of generous financial incentives. In some states, rebate
programs refund as much as 60 percent of the system’s
installed cost to the homeowner! Illinois residents can
recoup from 25 to 50 percent of their costs; New York’s PV
incentive program pays up to 60 percent of total installed
costs; and Oregon homeowners can receive up to US$10,000
in rebates. Add to that state tax credits and exemptions, and
low-interest state loans, and the picture gets brighter still.
You can get up-to-date information on financial incentives
at the Database of State Incentives for Renewable Energy
Web site (see Access).
DIY or Go Pro
Whether to install your solar-electric system yourself or hire
a professional is a decision not to be taken lightly. Doing it
yourself can cut 15 to 25 percent from the total cost, but be
sure to realistically gauge your ability to design and install
an efficient, code-compliant, and safe system, and don’t
forget to consider what your time is worth. If you’re adept
at wiring and home improvement projects, and have the
considerable time required to learn the specialties of solar-
electric installation, you can join the ranks of homeowners
who successfully self-install. (For a list of recommended
tools, see “Tools of the Solar-Electric Trade,” in HP105.)
The vast majority of grid-tied systems are quickly
and competently installed by licensed professionals who
bring with them the experience to ensure a system design
that provides safe, maximized performance. Some rebate
programs require that a pro installs your system; be sure
to inquire. (For a directory of professional installers, see
Access.)
home power 109 / october & november 2005
24
solar
sense
Estimated System Costs Comparison
San Diego, CA
Seattle, WA
Duluth, MN
Atlanta, GA
Boston, MA
Average monthly electricity use (KWH)
500
1,000
500
1,000
500
1,000
500
1,000
500
1,000
Portion of electricity from solar energy*
25%
75%
25%
75%
25%
75%
25%
75%
25%
75%
25%
75%
25%
75%
25%
75%
25%
75%
25%
75%
Average sun hours per day
5.7
5.7
5.7
5.7
3.7
3.7
3.7
3.7
4.4
4.4
4.4
4.4
5.1
5.1
5.1
5.1
4.6
4.6
4.6
4.6
Approximate system efficiency
0.70
0.70
0.70
0.70
0.70
0.70
0.70
0.70
0.70
0.70
0.70
0.70
0.70
0.70
0.70
0.70
0.70
0.70
0.70
0.70
Number of 175 W modules needed*
6
18
12
36
10
28
19
56
8
24
16
47
7
21
14
41
8
23
15
45
Total system size (W)
1,050
3,150
2,100
6,300
1,750
4,900
3,325
9,800
1,400
4,200
2,800
8,225
1,225
3,675
2,450
7,175
1,400
4,025
2,625
7,875
Roof space needed (sq. ft.)
85.9
257.8
171.8
515.5
143.2
401.0
272.1
801.9
114.6
343.7
229.1
673.0
100.2
300.7
200.5
587.1
114.6
329.4
214.8
644.4
Estimated system cost per KW (US$)
10
8
9
6
9
6
8
6
10
7
8
6
10
7
9
6
10
7
8
6
Price of installed system (US$)
10,500
25,200
18,900
37,800
15,750 29,400 26,600 58,800
14,000
29,400
22,400
49,350
12,250 25,725 22,050 43,050
14,000
28,175
21,000
47,250
State rebates (US$; excludes tax incentives) 2,940
8,820
5,880
17,640
0
‡
0
‡
0
‡
0
‡
2,800
8,000
5,600
8,000
0
0
0
0
4,200
12,075
7,875
23,625
Cost after rebates (US$)
7,560
16,380
13,020
20,160
15,750 29,400 26,600 58,800
11,200
21,400
16,800
41,350
12,250 25,725 22,050 43,050
9,800
16,100
13,125
23,625
* Module counts are rounded up, since it’s not possible to install “fractions” of a module.
The result is that all of the examples will produce more than this nominal percentage.
‡ Washington State is currently implementing production-based incentives up to US$2,000 per year.
Estimating
Installed Costs
The U.S. Department of Energy (DOE) estimates
that a 2 KW (2,000 watt) system costs US$8 to
$10 per watt to install, while a 5 KW (5,000 watt)
system can cost US$6 to $8 per watt installed.
The actual cost of an installed system may vary
widely depending upon installation complexity,
location, component availability, and the size of
the installed system.
Rated System
Size (W)
Cost Per Installed
Watt (US$)
1,000 to 4,000 W
$8 to $10
5,000 W+
$6 to $8
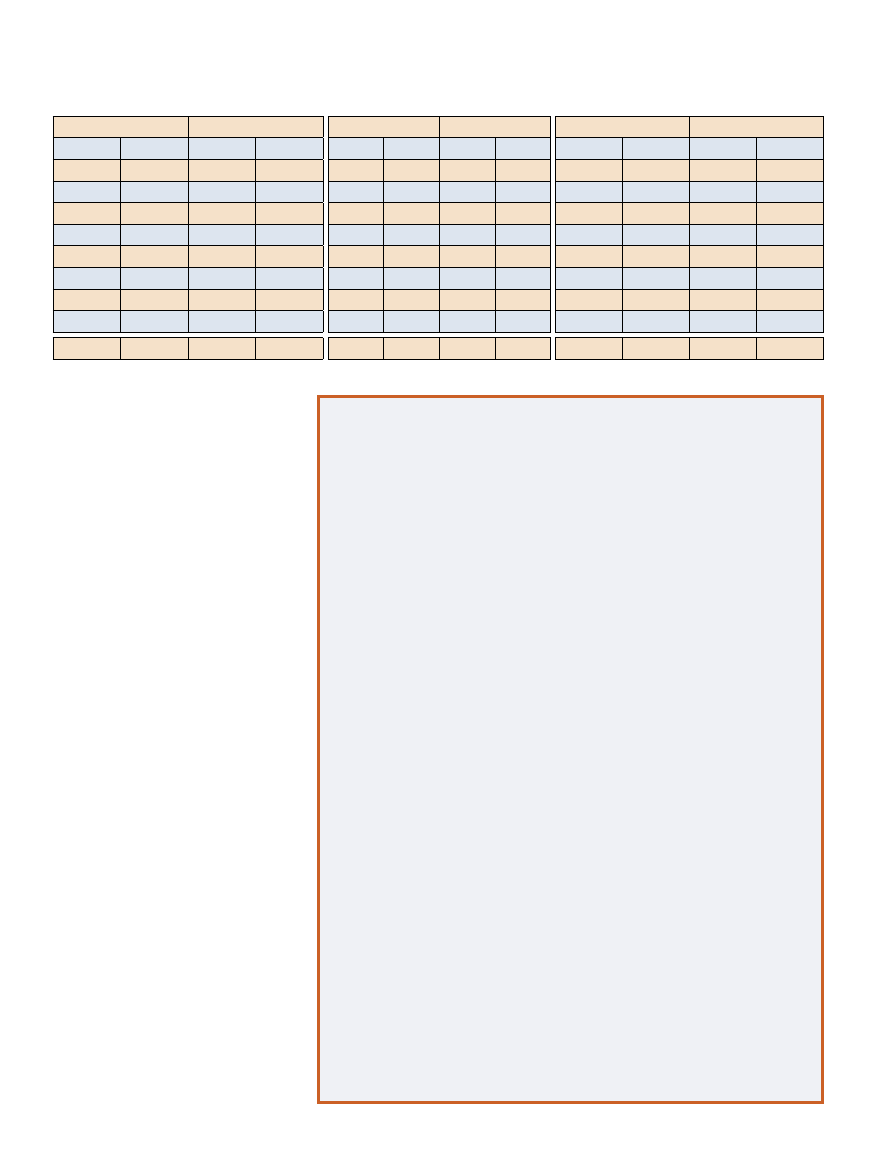
Even a small system can reduce your utility bills
while producing clean energy.
Next Steps
It’s easy to see why there’s no such
thing as a “one-size-fits-all” sticker
price for a solar-electric system, but
a little homework and understanding
your options both go a long way toward
reliable planning and budgeting. To
give you an even better idea of the
costs involved, check out the Estimated
System Costs Comparison table
above, which compares the energy
production, efficiency, and costs of
two sizes of solar-electric systems in
five U.S. cities.
To take a first pass in estimating
costs yourself, consider each of the
variables discussed above and
determine the:
•
Average KWH used by your home
each month
•
Peak sun hours for your location
•
Quality of your solar window
•
Financial incentives, if any,
available in your state
Use this information to fill in the
worksheet on the right to figure your
approximate system size in watts.
Finally, project your costs based on the
sliding scale that specifies total cost per
installed watt. This will give you a rough
cost projection from which to work.
To get a better picture of what such
a system might cost you, two options
exist: phone a local professional for a
quote or work through the calculations
yourself. (Before you call, gather a
www.homepower.com
solar
sense
25
Calculate Your Costs
Use this easy worksheet to figure out what a professionally installed
solar-electric system might cost. If you have last year’s electricity bills
handy, grab them and your calculator, and get started!
1. First, figure the daily output needed from your PV system:
Average Monthly Electricity Use ____________ KWH
x 1,000 [converts KWH to Watt-Hours] = _____________ WH
x Percent ( _____ %)* of Monthly Electrical Use from PVs = _____________ WH
÷ 30 days
= Daily PV Output Needed _____________ WH
(*Example: for 25%, multiply by 0.25)
2. Then, calculate the minimum system size [in watts]:
Daily PV Output Needed [from Step 1] _____________ WH
÷ Average Peak Sun Hours ( ______ hrs.) Per Day = _____________ W
÷ 0.7 [for 70 % System Efficiency Factor]
= Minimum System Size _____________ W
3. Next, determine the number of PV modules you’ll need:
Minimum System Size [from Step 2] _____________ WH
÷ Wattage Rating ( ________ W) of Chosen Module
= Number of Modules Required _____ Modules
4. Now you can figure the size of the system:
Number of Modules Required [from Step 3; round up] _____Modules
x Wattage Rating ( ________ W) of Chosen Module [also from Step 3]
= System Size [in Watts] _____________ W
5. Last, find the approximate system cost:
System Size [from Step 4] ____________ W
x System Cost Per Watt [from sidebar opposite] $______________
– Rebates & financial incentives $___________
= Approximate System Cost $___________
Estimated System Costs Comparison
San Diego, CA
Seattle, WA
Duluth, MN
Atlanta, GA
Boston, MA
Average monthly electricity use (KWH)
500
1,000
500
1,000
500
1,000
500
1,000
500
1,000
Portion of electricity from solar energy*
25%
75%
25%
75%
25%
75%
25%
75%
25%
75%
25%
75%
25%
75%
25%
75%
25%
75%
25%
75%
Average sun hours per day
5.7
5.7
5.7
5.7
3.7
3.7
3.7
3.7
4.4
4.4
4.4
4.4
5.1
5.1
5.1
5.1
4.6
4.6
4.6
4.6
Approximate system efficiency
0.70
0.70
0.70
0.70
0.70
0.70
0.70
0.70
0.70
0.70
0.70
0.70
0.70
0.70
0.70
0.70
0.70
0.70
0.70
0.70
Number of 175 W modules needed*
6
18
12
36
10
28
19
56
8
24
16
47
7
21
14
41
8
23
15
45
Total system size (W)
1,050
3,150
2,100
6,300
1,750
4,900
3,325
9,800
1,400
4,200
2,800
8,225
1,225
3,675
2,450
7,175
1,400
4,025
2,625
7,875
Roof space needed (sq. ft.)
85.9
257.8
171.8
515.5
143.2
401.0
272.1
801.9
114.6
343.7
229.1
673.0
100.2
300.7
200.5
587.1
114.6
329.4
214.8
644.4
Estimated system cost per KW (US$)
10
8
9
6
9
6
8
6
10
7
8
6
10
7
9
6
10
7
8
6
Price of installed system (US$)
10,500
25,200
18,900
37,800
15,750 29,400 26,600 58,800
14,000
29,400
22,400
49,350
12,250 25,725 22,050 43,050
14,000
28,175
21,000
47,250
State rebates (US$; excludes tax incentives) 2,940
8,820
5,880
17,640
0
‡
0
‡
0
‡
0
‡
2,800
8,000
5,600
8,000
0
0
0
0
4,200
12,075
7,875
23,625
Cost after rebates (US$)
7,560
16,380
13,020
20,160
15,750 29,400 26,600 58,800
11,200
21,400
16,800
41,350
12,250 25,725 22,050 43,050
9,800
16,100
13,125
23,625

few of your recent electric utility bills for easy reference.)
The pros know what questions to ask and the relevant
data for your geographic location, and should be able to
provide a preliminary estimate by phone. An on-site visit
will be necessary before they can give you a firm quote,
and get you on your way to making some or all of your
electricity with clean, renewable energy.
Access
Scott Russell, Home Power, PO Box 520, Ashland, OR 97520 •
scott.russell@homepower.com • www.homepower.com
Database of State Incentives for Renewable Energy •
dsireinfo@ncsu.edu • www.dsireusa.org
home power 109 / october & november 2005
26
solar
sense
National Renewable Energy Laboratory (NREL) •
http://rredc.nrel.gov/solar/pubs/redbook •
Solar insolation data •
http://rredc.nrel.gov/solar/calculators/PVWATTS •
PVWATTS calculator
Directories of Solar-Electric System Installers:
Home Power’s Installers Directory, see page 124 or visit
www.homepower.com/resources/directory.cfm
www.renewableenergyaccess.com/rea/market/business/
home
www.seia.org/about/statechapters.asp
Renewable Resource Data Center •
http://rredc.nrel.gov/solar/old_data/nsrdb/redbook/
Wyszukiwarka
Podobne podstrony:
Home Power Magazine Issue 109 Extract p12 Off Grid Living In The City
Home Power Magazine Issue 057 Extract p62 Food Dehydrator
Home Power Magazine Issue 072 Extract p34 Solar Hot Air Collectors
Home Power Magazine Issue 032 Extract p22 Whats An Inverter
Home Power Magazine Issue 021 Extract p78 Electric Fence Charger And Time Machine
Home Power Magazine Issue 063 Extract p42 Solar charge controller for Medium Power Applications
Home Power Magazine Issue 032 Extract p78 Me And My Panel
Home Power Magazine Issue 095 Extract p22 Solar Electric Grid Tie
Home Power Magazine Issue 055 Extract p72 Surge Arresters For Lightning And EMP Protection
Home Power Magazine Issue 039 Extract p74 Exceltechs 1000 Watt Sine Wave Inverter
Home Power Magazine Issue 037 Extract p22 Solar Cooker Contest
Home Power Magazine 024 Extract p26 p30 All Solar Panels Ever Tested
Home Power Magazine Extract Low Voltage Battery Disconnect
Home Power Magazine Extract Installation Basics For Solar Domestic Water Heating Systems Part 2
Home Power Magazine Extract ThermoElectric Generators
Home Power Magazine Extract Installation Basics For Solar Domestic Water Heating Systems Part 1
Home Power Magazine Extract Inverter Safety
[ebook renewable energy] Home Power Magazine 'Correct Solar Panel Tilt Angle to Sun'
Home Power Magazine Betting the Farm Wind Electricity Pays Off
więcej podobnych podstron