
Potential applications of renewable energy sources, biomass
combustion problems in boiler power systems and combustion
related environmental issues
Ayhan Demirbas*
Selcuk University, Department of Chemical Engineering, 42031 Konya, Turkey
Received 6 July 2004; accepted 17 February 2005
Abstract
This paper describes the potential applications of renewable energy sources to replace fossil fuel combustion as the prime
energy sources in various countries, and discusses problems associated with biomass combustion in boiler power systems. Here,
the term biomass includes organic matter produced as a result of photosynthesis as well as municipal, industrial and animal
waste material. Brief summaries of the basic concepts involved in the combustion of biomass fuels are presented. Renewable
energy sources (RES) supply 14% of the total world energy demand. RES are biomass, hydropower, geothermal, solar, wind
and marine energies. The renewables are the primary, domestic and clean or inexhaustible energy resources. The percentage
share of biomass was 62.1% of total renewable energy sources in 1995. Experimental results for a large variety of biomass fuels
and conditions are presented. Numerical studies are also discussed. Biomass is an attractive renewable fuel in utility boilers.
The compositions of biomass among fuel types are variable. Ash composition for the biomass is fundamentally different from
ash composition for the coal. Especially inorganic constituents cause to critical problems of toxic emissions, fouling and
slagging. Metals in ash, in combination with other fuel elements such as silica and sulfur, and facilitated by the presence of
chlorine, are responsible for many undesirable reactions in combustion furnaces and power boilers. Elements including K, Na,
S, Cl, P, Ca, Mg, Fe, Si are involved in reactions leading to ash fouling and slagging in biomass combustors. Chlorine in the
biomass may affect operation by corrosion. Ash deposits reduce heat transfer and may also result in severe corrosion at high
temperatures. Other influences of biomass composition are observed for the rates of combustion and pollutant emissions.
Biomass combustion systems are non-polluting and offer significant protection of the environment. The reduction of
greenhouse gases pollution is the main advantage of utilizing biomass energy.
q
2005 Elsevier Ltd. All rights reserved.
Keywords: Renewable energy; Biomass; Boiler; Emissions; Reburning; Alkali; Corrosion; Silica; Slagging; Fouling
Contents
1. Introduction . . . . . . . . . . . . . . . . . . . . . . . . . . . . . . . . . . . . . . . . . . . . . . . . . . . . . . . . . . . . . . . . . . . . . . . . . . . . 172
2. Renewable energy resources . . . . . . . . . . . . . . . . . . . . . . . . . . . . . . . . . . . . . . . . . . . . . . . . . . . . . . . . . . . . . . . . 172
2.1. Biomass energy and biomass conversion technologies . . . . . . . . . . . . . . . . . . . . . . . . . . . . . . . . . . . . . . . . . 174
Progress in Energy and Combustion Science 31 (2005) 171–192
0360-1285/$ - see front matter q 2005 Elsevier Ltd. All rights reserved.
doi:10.1016/j.pecs.2005.02.002
* Tel.: C90 462 230 7831; fax: C90 462 248 8508.
E-mail address: ayhandemirbas@hotmail.com.

2.2. Hydropower . . . . . . . . . . . . . . . . . . . . . . . . . . . . . . . . . . . . . . . . . . . . . . . . . . . . . . . . . . . . . . . . . . . . . . . . 175
2.3. Geothermal energy . . . . . . . . . . . . . . . . . . . . . . . . . . . . . . . . . . . . . . . . . . . . . . . . . . . . . . . . . . . . . . . . . . . 177
2.4. Solar energy . . . . . . . . . . . . . . . . . . . . . . . . . . . . . . . . . . . . . . . . . . . . . . . . . . . . . . . . . . . . . . . . . . . . . . . . 178
2.5. Wind energy . . . . . . . . . . . . . . . . . . . . . . . . . . . . . . . . . . . . . . . . . . . . . . . . . . . . . . . . . . . . . . . . . . . . . . . . 178
2.6. Other renewable energy sources . . . . . . . . . . . . . . . . . . . . . . . . . . . . . . . . . . . . . . . . . . . . . . . . . . . . . . . . . . 179
3. Biomass combustion . . . . . . . . . . . . . . . . . . . . . . . . . . . . . . . . . . . . . . . . . . . . . . . . . . . . . . . . . . . . . . . . . . . . . . 179
3.1. The chemistry of biomass combustion . . . . . . . . . . . . . . . . . . . . . . . . . . . . . . . . . . . . . . . . . . . . . . . . . . . . . 180
3.2. Wood combustion analyses . . . . . . . . . . . . . . . . . . . . . . . . . . . . . . . . . . . . . . . . . . . . . . . . . . . . . . . . . . . . . 181
3.2.1. Particle size and specific gravity . . . . . . . . . . . . . . . . . . . . . . . . . . . . . . . . . . . . . . . . . . . . . . . . . . . . 181
3.2.2. Ash content . . . . . . . . . . . . . . . . . . . . . . . . . . . . . . . . . . . . . . . . . . . . . . . . . . . . . . . . . . . . . . . . . . . 181
3.2.3. Moisture content . . . . . . . . . . . . . . . . . . . . . . . . . . . . . . . . . . . . . . . . . . . . . . . . . . . . . . . . . . . . . . . . 181
3.2.4. Extractive content . . . . . . . . . . . . . . . . . . . . . . . . . . . . . . . . . . . . . . . . . . . . . . . . . . . . . . . . . . . . . . . 181
3.2.5. Element content . . . . . . . . . . . . . . . . . . . . . . . . . . . . . . . . . . . . . . . . . . . . . . . . . . . . . . . . . . . . . . . . 182
3.2.6. Structural constituent content . . . . . . . . . . . . . . . . . . . . . . . . . . . . . . . . . . . . . . . . . . . . . . . . . . . . . . 182
3.3. The energy value of biomass . . . . . . . . . . . . . . . . . . . . . . . . . . . . . . . . . . . . . . . . . . . . . . . . . . . . . . . . . . . . 182
3.3.1. Pyrolysis . . . . . . . . . . . . . . . . . . . . . . . . . . . . . . . . . . . . . . . . . . . . . . . . . . . . . . . . . . . . . . . . . . . . . 182
3.3.2. Char combustion . . . . . . . . . . . . . . . . . . . . . . . . . . . . . . . . . . . . . . . . . . . . . . . . . . . . . . . . . . . . . . . . 183
3.3.3. Gasification . . . . . . . . . . . . . . . . . . . . . . . . . . . . . . . . . . . . . . . . . . . . . . . . . . . . . . . . . . . . . . . . . . . 183
3.4. Combustion properties and combustion considerations . . . . . . . . . . . . . . . . . . . . . . . . . . . . . . . . . . . . . . . . . 184
4. Energy related environmental issues . . . . . . . . . . . . . . . . . . . . . . . . . . . . . . . . . . . . . . . . . . . . . . . . . . . . . . . . . . 184
4.1. Greenhouse effect . . . . . . . . . . . . . . . . . . . . . . . . . . . . . . . . . . . . . . . . . . . . . . . . . . . . . . . . . . . . . . . . . . . . 185
4.2. Air pollution . . . . . . . . . . . . . . . . . . . . . . . . . . . . . . . . . . . . . . . . . . . . . . . . . . . . . . . . . . . . . . . . . . . . . . . . 185
4.3. Acid rain . . . . . . . . . . . . . . . . . . . . . . . . . . . . . . . . . . . . . . . . . . . . . . . . . . . . . . . . . . . . . . . . . . . . . . . . . . 185
5. Discussions . . . . . . . . . . . . . . . . . . . . . . . . . . . . . . . . . . . . . . . . . . . . . . . . . . . . . . . . . . . . . . . . . . . . . . . . . . . . 186
5.1. Environmental problems . . . . . . . . . . . . . . . . . . . . . . . . . . . . . . . . . . . . . . . . . . . . . . . . . . . . . . . . . . . . . . . 186
5.2. Pollutant emissions . . . . . . . . . . . . . . . . . . . . . . . . . . . . . . . . . . . . . . . . . . . . . . . . . . . . . . . . . . . . . . . . . . . 187
5.3. Biomass combustion problems in boiler . . . . . . . . . . . . . . . . . . . . . . . . . . . . . . . . . . . . . . . . . . . . . . . . . . . . 187
5.4. Reburning biomass fly ash . . . . . . . . . . . . . . . . . . . . . . . . . . . . . . . . . . . . . . . . . . . . . . . . . . . . . . . . . . . . . . 188
5.5. Corrosion . . . . . . . . . . . . . . . . . . . . . . . . . . . . . . . . . . . . . . . . . . . . . . . . . . . . . . . . . . . . . . . . . . . . . . . . . . 188
5.6. Ash related problems in biomass combustion . . . . . . . . . . . . . . . . . . . . . . . . . . . . . . . . . . . . . . . . . . . . . . . . 188
6. Conclusion . . . . . . . . . . . . . . . . . . . . . . . . . . . . . . . . . . . . . . . . . . . . . . . . . . . . . . . . . . . . . . . . . . . . . . . . . . . . . 190
References . . . . . . . . . . . . . . . . . . . . . . . . . . . . . . . . . . . . . . . . . . . . . . . . . . . . . . . . . . . . . . . . . . . . . . . . . . . . . 190
1. Introduction
Energy resources will play an important role in the
world’s future. Energy is considered a prime agent in the
generation of wealth and a significant factor in economic
development. There are many alternative new and renew-
able energy sources which can be used instead of fossil and
conventional fuels. The energy resources have been split
into three categories: fossil fuels, renewable resources, and
nuclear resources
. The decision as to what types of
energy source should be utilized must, in each case, be made
on the basis of economic, social, environmental and safety
considerations. The importance of energy in economic
development is recognized universally and historical data
verify that there is a strong relationship between the
availability of energy and economic activity
Renewable energy resources are also often called
alternative sources of energy. Renewable energy resources
that use domestic resources have the potential to provide
energy services with zero or almost zero emissions of both
air pollutants and greenhouse gases. Renewable energy
technologies produce marketable energy by converting
natural phenomena into useful forms of energy. These
technologies use the sun’s energy and its direct and indirect
effects on the earth (solar radiation, wind, falling water and
various plants, i.e. biomass), gravitational forces (tides), and
the heat of the earth’s core (geothermal) as the resources
from which energy is produced
A worldwide research and development in the field of
renewable energy sources (RES) and systems is carried out
during the last two decades. At the end of 2001 the total
installed capacity of renewable energy systems was
equivalent to 9% of the total electricity generation
. By
applying a renewable energy intensive scenario the global
consumption of renewable sources by 2050 would reach 318
exajoules (1 exajouleZ10
18
J)
.
2. Renewable energy resources
Currently, renewable energy resources supply 14% of
the total world energy demand. RES contributed 2% of
A. Demirbas / Progress in Energy and Combustion Science 31 (2005) 171–192
172

the world’s energy consumption in 1998, including seven
exajoules from modern biomass and two exajoules for all
other renewables
. The RES are readily available in
nature. Increasing atmospheric concentrations of green-
house gasses increase the amount of heat trapped (or
decrease the heat radiated from the earths surface), thereby
raising the surface temperature of the earth
. RES are
biomass, hydropower, geothermal, solar, wind and marine
energies. The renewables are the primary energy resources.
Renewable energy is a clean or inexhaustible energy like
hydrogen energy and nuclear energy. The most important
benefit of renewable energy systems is the decrease of
environmental pollution.
RES are derived from those natural, mechanical, thermal
and growth processes that repeat themselves within our
lifetime and may be relied upon to produce predictable
quantities of energy when required. Renewable technologies
like water and wind power probably would not have
provided the same fast increase in industrial productivity
as fossil fuels did
Oil and gas are expected to continue to be important
sources of energy
. The share of renewable energy
sources is expected to increase very significantly (to
30–80% in 2100). Biomass, wind and geothermal energy
are commercially competitive and are making relatively fast
progress
Known energy reserves of the world are
presented in
shows the energy production
and consumption in the world.
summarizes the
status of various renewable technologies, and also provides
information on trends in cost and production.
About 98% of carbon emissions result from fossil fuel
combustion. Reducing use of fossil fuels would consider-
ably reduce the amount of carbon dioxide produced, as well
as reducing the levels of the pollutants. Indeed, much of the
variation in cost estimates to control carbon emissions
revolves around the availability and cost of carbon-free
technologies and carbon-reducing technologies, such as
energy efficiency and energy conservation equipment. This
can be achieved by either using less energy altogether, or
using alternative energy resources. Much of the current
effort to control such emissions focuses on advancing
technologies that emit less carbon (e.g. high efficiency
combustion) or no carbon such as nuclear, hydrogen, solar,
wind, geothermal, other RES or on using energy more
efficiently, and on developing innovative technologies and
strategies to capture and dispose of carbon dioxide emitted
during fossil fuel combustion. Main renewable energy
Table 1
Global renewable energy resources
Resource
Capacity (MW)
Approx. annual
output (TWh/year)
Modern biomass
35,000
185
Wind
20,000
50
Geothermal
8200
44
Small hydro
3000
15
Solar photovoltaic
1200
1
Solar thermal
350
0.2
Source: Ref.
.
Table 2
Energy production and consumption in the world (1998)
Resources
Production
(exajoule)
Percent of
total pro-
duction (%)
Total
consumption
Oil
152.0
40.0
73.60 million
barrels/day
Natural gas
85.5
22.5
82.20 tcf/year
Coal
88.6
23.3
5.01 billion
tons/year
Nuclear
24.5
6.5
2.30 trillion
kWh/year
Hydroelectric
26.6
7.0
2.60 trillion
kWh/year
Biomass
2.5
0.7
196.00 billion
kWh/year
Source: Ref.
Table 3
Global status of various renewable energy technologies
Technology
Energy
production
(1998)
Turnkey
investment
cost
(US $/kWh)
Potential
future
energy cost
(¢/kWh)
Biomass energy
Electricity
160 TWh (e)
900–3000
4–10
District heating
O
700 TWh (th)
250–750
1–5
Ethanol
420 PJ
–
–
Geothermal energy
Electricity
46 TWh (e)
800–3000
1 or 2–8
Heat
40 TWh (th)
200–2000
0.5–5
Hydroelectricity
Large
2510 TWh (e)
1000–3500
2–8
Small
90 TWh (e)
1200–3000
3–10
Marine energy
Current
0.6 TWh (e)
1700–2500
8–15
OTEC
Unclear
1500–3000
Unclear
Tidal
Unclear
2000–3000
5–7
Wave
Unclear
Unclear
Unclear
Solar heat
Low-tempera-
ture
14 TWh (th)
500–1700
2 or 3–10
Solar photo-
voltaic
Electricity
0.5 TWh (e)
5000–10000
5 or 6–25
Solar thermal
Electricity
1 TWh (e)
3000–4000
4–10
Wind
Electricity
18 TWh (e)
1100–1700
3–10
E, electricity; th, thermal; Source: Ref.
A. Demirbas / Progress in Energy and Combustion Science 31 (2005) 171–192
173

sources and their usage forms are given in
.
shows the percentage share of each renewable energy source
in 1995. As seen in
, the percentage share of biomass
was 62.1% of total renewable energy sources in 1995.
2.1. Biomass energy and biomass conversion technologies
Biomass as the solar energy stored in chemical form in
plant and animal materials is among the most precious and
versatile resources on earth. Biomass is the name given all
the earth’s living matter. It is the general term for material
derived from growing plants or from animal manure. It is a
rather simple term for all organic materials that seems from
plants, trees, crops and algae. The components of biomass
include cellulose, hemicelluloses, lignin, extractives, lipids,
proteins, simple sugars, starches, water, HC, ash, and other
compounds. Two larger carbohydrate categories that have
significant value are cellulose and hemi-cellulose. The
lignin fraction consists of non-sugar type molecules.
The solar energy, which is stored in plants and animals,
or in the wastes that they produce, is called biomass energy.
This energy can be recovered by burning biomass as a fuel
. The average majority of biomass energy is produced
from wood and wood wastes (64%), followed by solid waste
(24%), agricultural waste (5%) and landfill gases (5%)
Biomass can be economically produced with minimal or
even positive environmental impacts through perennial
crops.
When biomass is used directly in an energy application
without chemical processing then it is combusted. Conver-
sion may be effected by thermochemical, biological or
chemical processes. These may be categorized as follows:
direct combustion, pyrolysis, gasification, liquefaction,
supercritic fluid extraction, anaerobic digestion, fermenta-
tion, acid hydrolysis, enzyme hydrolysis, and esterification.
Direct combustion and co-firing with coal for electricity
production from biomass has been found to be a promising
method in the nearest future. Biomass thermo-chemical
conversion technologies such as pyrolysis and gasification
are certainly not the most important options at present;
combustion is responsible for over 97% of the world’s
bio-energy production
. The supply is dominated by
traditional biomass used for cooking and heating, especially
in rural areas of developing countries. The traditional
biomass cooking and heating produces high levels of
pollutants.
Biomass is an attractive renewable fuel to supplement
coal combustion in utility boilers. Biomass fuels considered
for co-firing include forest waste, short rotation woody
crops, short rotation herbaceous crops, alfalfa stems, and
various types of manure, landfill gas and wastewater
treatment gas. The solid waste is a low cost fuel today
only when it is available as a waste of a higher-value activity
or product. The solid wastes represent a renewable and
sustainable resource.
Biomass fuels can be used in similar ways to fossil fuels.
They are readily available worldwide. In the developing
world, biomass is still the major source of energy. In Brazil,
large number of cars runs on alcohol rather than petrol. In
the Western world, people are developing ways of using
biomass as an alternative to fossil fuels. There is a large
biomass plant in Sweden and in the United Kingdom
attempts are being made to develop a power station that will
run solely on wood from a nearby farm. The world
production of biomass is estimated at 146 billion metric
tons a year, mostly wild plant growth. Some farm crops and
trees can produce up to 20 metric tons per acre of biomass a
year. Types of algae and grasses may produce 50 metric tons
per year
. Biomass accounts for 35% of primary energy
consumption in developing countries, raising the world total
to 14% of primary energy consumption. In the future,
biomass has the potential to provide a cost-effective and
sustainable supply of energy, while at the same time aiding
countries in meeting their greenhouse gas reduction targets.
Biomass is an important contributor to the world
economy. Biomass, mainly now represent only 3% of
primary energy consumption in industrialized countries.
Table 4
Main renewable energy sources and their usage forms
Energy source
Energy conversion and usage
options
Hydropower
Power generation
Modern biomass
Heat and power generation,
pyrolysis, gasification, digestion
Geothermal
Urban heating, power generation,
hydrothermal, hot dry rock
Solar
Solar home system, solar dryers,
solar cookers
Direct solar
Photovoltaics, thermal power
generation, water heaters
Wind
Power generation, wind generators,
windmills, water pumps
Wave
Numerous designs
Tidal
Barrage, tidal stream
Table 5
Percentage share of each renewable energy source in 1995
Resource
Percentage
Biomass
62.1
Wood in household
30.3
Wood in industry
12.7
Power station
11.8
Municipal solid waste
3.7
District heating
1.8
Biogas
1.0
Liquid fuels
0.8
Hydro
33.6
Geothermal
3.2
Wind
0.7
Solar
0.4
Source: Ref.
A. Demirbas / Progress in Energy and Combustion Science 31 (2005) 171–192
174

However, much of the rural population in developing
countries, which represents about 50% of the world’s
population, is reliant on biomass, mainly in the form of
wood, for fuel
.
Biomass energy currently represents approximately 14%
of world final energy consumption, a higher share than that
of coal (12%) and comparable to those of gas (15%) and
electricity (14%). Biomass is the main source of energy for
many developing countries and most of it is non-
commercial. Hence, there is enormous difficulty in collect-
ing reliable biomass energy data. Yet good data are essential
for analyzing tendencies and consumption patterns, for
modeling future trends and for designing coherent
strategies.
The energy dimension of biomass use is importantly
related to the possible increased use of this source as a
critical option to address the global warming issue. Biomass
is generally considered as an energy source completely
CO
2
-neutral. The underlying assumption is that the CO
2
released in the atmosphere is matched by the amount used in
its production. This is true only if biomass energy is
sustainably consumed, i.e. the stock of biomass does not
diminish in time. This may not be the case in many
developing countries.
The importance of biomass in different world regions is
given in
. As shown in
, the importance of
biomass varies significantly across regions. In Europe,
North America and the Middle East, the share of biomass
averages 2–3% of total final energy consumption, whereas
in Africa, Asia and Latin America, which together account
for three-quarters of the world’s population, biomass
provides a substantial share of the energy needs: a third on
average, but as much as 80–90% in some of the poorest
countries of Africa and Asia (e.g. Angola, Ethiopia,
Mozambique, Tanzania, Democratic Republic of Congo,
Nepal and Myanmar). Indeed, for large portions of the rural
populations of developing countries, and for the poorest
sections of urban populations, biomass is often the only
available and affordable source of energy for basic needs
such as cooking and heating.
Biomass is burned by direct combustion to produce
steam, the steam turns a turbine and the turbine drives
a generator, producing electricity. Gasifier is used to convert
biomass into a combustible gas (biogas). The biogas is then
used to drive a high efficiency, combined cycle gas turbine
. Biomass consumption for electricity generation has
been growing sharply in Europe since 1996, with 1.7% of
power generation in 1996. The use of wood and wood waste
as fuel in 1995 is given in
There are three ways to use biomass. It can be burned to
produce heat and electricity, changed to gas-like fuels such
as methane, hydrogen and carbon monoxide or changed to a
liquid fuel. Liquid fuels, also called bio-fuels, include
mainly two forms of alcohol: ethanol and methanol. The
most commonly used bio-fuel is ethanol, which is produced
from sugarcane, corn and other grains. A blend of gasoline
and ethanol is already used in cities with high air pollution.
2.2. Hydropower
The water in rivers and streams can be captured and
turned into hydropower, also called hydroelectric power.
Large scale hydro power provides about one-quarter of the
world’s total electricity supply, virtually all of Norway’s
electricity and more than 40% of the electricity used in
developing countries. The technically usable world potential
of large-scale hydro is estimated to be over 2200 GW, of
which only about 25% is currently exploited.
There are two small-scale hydropower systems: micro
hydropower systems (MHP) with capacities below 100 kW
and small hydropower systems (SHP) with capacity between
101 kW and 1 MW. Large-scale hydropower supplies 20%
of global electricity. In the developing countries, consider-
able potential still exists, but large hydropower projects may
face financial, environmental, and social constraints
The two small-scale hydropower systems, which are
being discussed in this section are the sites with capacities
below 100 kW (referred to as micro hydropower systems)
and sites with capacity between 101 kW and 1 MW
(referred to as small hydropower systems). Micro hydro-
power (MHP) systems which uses cross-flow turbines and
pelton wheels can provide both direct mechanical energy
(for crop processing) and electrical energy. However, due to
design constraints, turbines up to a capacity of 30 kW are
Table 6
The importance of biomass in different world regions
Region
Share of biomass in final
energy consumption
Africa
60.0
South Asia
56.3
East Asia
25.1
China
23.5
Latin America
18.2
Europe
3.5
North America
2.7
Middle East
0.3
Fig. 1. Use of wood and wood waste as fuel in 1995. (Source: IEA).
A. Demirbas / Progress in Energy and Combustion Science 31 (2005) 171–192
175

suitable for extracting mechanical energy. Of the total
installed capacity of about 12 MW of MHP systems, half is
used solely for crop processing. The most popular of the
MHP systems is the peltric set, which is an integrated pelton
turbine and electricity generation unit with an average
capacity of 1 kW. MHP systems are sometimes described as
those having capacities below 100 kW, mini hydropower
plants are those ranging from 100 to 1000 kW and small
hydropower (SHP) plants are those that produce from 1 to
30 MW.
Dams are individually unique structures and dam
construction represents the biggest structures in basic
infrastructure within all nations
. Today, nearly
500,000 km
2
of land are inundated by reservoirs in
the world, capable of storing 6000 km
3
of water. As a result
of this distribution of fresh water in the reservoirs, small but
measurable changes have occurred in the world. The total
installed capacity of hydropower is 640,000 MW (26% of
the theoretical potantial) generating an estimated 2380
TWh/year in the world, producing nearly 20% of the world’s
total supply of electricity. The current and estimated
electricity generation of the world from the hydropower is
given in
. 27,900 MW of the total hydropower is at
small scale sites, generating 115 TWh/year
. The
NAFTA countries are, now, the biggest producers, with
Latin America and EU/EFTA regions, but it is estimated
that Asia will be generating more hydroelectricty than
NAFTA countries at the end of the next decade (
Table 7
Current and estimated development of electricity generation from hydropower in the world
Location
Hydro scale
(Market area)
Current deployment 1995
(TWh/year)
Estimated deployment
in 2010 (TWh/year)
EUCEFTA
Large hydro
401.5
443
Small hydro
40
50
% of SHP
9.1
10.1
CEE
Large hydro
57.5
83
Small hydro
4.5
16
% of SHP
7.3
16.2
CIS
Large hydro
160
388
Small hydro
4
12
% of SHP
2.4
3.0
NAFTA
Large hydro
635
685
Small hydro
18
25
% of SHP
2.8
3.5
OECD Pacific
Large hydro
131
138
Small hydro
0.7
3
% of SHP
0.5
2.1
Mediterranean
Large hydro
35.5
72
Small hydro
0.5
0.7
% of SHP
1.4
1.0
Africa
Large hydro
65.4
147
Small hydro
1.6
3
% of SHP
2.4
2.0
Middle East
Large hydro
24.8
49
Small hydro
0.2
1
Total hydro
25
50
% of SHP
0.8
2.0
Asia
Large hydro
291
1000
Small hydro
42
100
% of SHP
12.6
9.1
Latin America
Large hydro
461.5
990
Small hydro
3.5
10
% of SHP
0.8
1.0
Worldwide
Large hydro
2265
3990
Small hydro
115
220
Total hydro
2380
4210
% of SHP
4.8
5.2
NAFTA, The North American Free Trade Agreement; EU/EFTA, The Europe Union/The European Fair Trade Association; CEE, The Central
and Eastern Europe; CIS, The Commonwealth of Independent States; OECD, The Organisation for Economic Co-Operation and Development.
Source: Ref.
A. Demirbas / Progress in Energy and Combustion Science 31 (2005) 171–192
176

There is no universal consensus on the definition of small
hydropower. In some countries of European Union such as
Portugal, Spain, Ireland, Greece, and Belgium 10 MW is
accepted as the upper limit for installed capacity. In Italy the
limit is 3 MW, in France 8 MW, in UK 5 MW, in Canada
20–25 MW, in the United States 30 MW, however, a value
of up to 10 MW total capacities is becoming generally
accepted as small hydropower in the rest of the world. If
total installed capacity of any hydropower system is bigger
than 10 MW, it is generally accepted as a large hydropower
system
. Small hydro can be further subdivided into
mini hydro usually defined as !500 kW and micro hydro is
!
100 kW. Small hydro installation limits are given in
. The definition of micro hydro or small-scale hydro
varies in different countries. Small hydropower is one of the
most valuable energy to be offered to the rural comminutes’
electrification. Small hydroelectricity growth is to decrease
the gap of decentralized production for private sector and
municipal activity production. Small-scale hydropower
systems supply the energy from the flowing or running
water and convert it to electrical energy. The potential for
small hydropower systems depends on the availability of
water flow where the resource exists. If a well-designed
small hydropower system is established in anywhere, it can
fit with its surroundings and will have minimal negative
impacts on the environment. Small hydropower systems
allow achieving self-sufficiency by using the scarce natural
water resources. These systems supply low cost of energy
production that is applying in many developing countries in
the world
2.3. Geothermal energy
As an energy source, geothermal energy has come of
age. Geothermal energy for electricity generation has been
produced commercially, since, 1913, and for four decades
on the scale of hundreds of MW both for electricity
generation and direct use. The utilization has increased
rapidly during the last three decades. In 2000, geothermal
resources have been identified in over 80 countries and there
are quantified records of geothermal utilization in 58
countries in the world.
shows the status of
geothermal energy.
Geothermal energy is clean, cheap and renewable, and
can be utilized in various forms such as space heating and
domestic hot water supply, CO
2
and dry-ice production
process, heat pumps, greenhouse heating, swimming and
balneology (therapeutic baths), industrial processes and
electricity generation. The main types of direct use are
bathing, swimming and balneology (42%), space heating
(35%), greenhouses (9%), fish farming (6%), and industry
(6%)
. Geothermal energy can be utilized in various
forms such as electricity generation, direct use, space
heating, heat pumps, greenhouse heating, and industrial
usage. Electricity is produced with geothermal steam in
21 countries spread over all continents. Low temperature
geothermal energy is exploited in many countries to
generate heat, with an estimated capacity of about
10,000 MW thermal.
Table 8
Classification of hydropower accepted in various countries according to the installed capacity
Country
Micro scale hydropower
(kW)
Mini scale hydropower
(kW)
Small scale hydropower
(MW)
Large scale hydropower
(MW)
USA
!
100
100–1000
1–30
O
30
Canada
–
–
1–25
O
25
China
–
!
500
0.5–25
O
25
Russia
!
100
–
–
–
France
5–5000
–
–
O
8
India
!
100
101–1000
1–15
O
15
UK
–
–
!
5
O
5
Brazil
!
100
100–1000
1–30
O
30
Turkey
1–100
101–1000
1–10
O
10
Various
!
100
!
1000
!
10
O
10
Sources: Refs.
.
Table 9
World’s top countries using geothermal energy in direct uses
Country
Installed
MWt
Production
(GWh/a)
China
2282
10531
Japan
1167
7482
USA
3766
5640
Iceland
1469
5603
Turkey
820
4377
New Zealand
308
1967
Georgia
250
1752
Russia
308
1707
France
326
1360
Sweden
377
1147
Hungary
473
1135
Mexico
164
1089
Italy
326
1048
Romania
152
797
Switzerland
547
663
Source: Ref.
A. Demirbas / Progress in Energy and Combustion Science 31 (2005) 171–192
177
In Tuscany, Italy, a geothermal plant has been operating
since the early 1900s. There are also geothermal power
stations in the USA, New Zealand and Iceland. In South-
ampton (UK) there is a district-heating scheme based on
geothermal energy. Hot water is pumped up from about
1800 m below ground.
Direct application of geothermal energy can involve a
wide variety of end uses, such as space heating and cooling,
industry, greenhouses, fish farming, and health spas. It uses
mostly existing technology and straight-forward engineer-
ing. The technology, reliability, economics, and environ-
mental acceptability of direct use of geothermal energy have
been demonstrated throughout the world.
2.4. Solar energy
Energy comes from processes called solar heating (SH),
solar home heating (SHH), solar dryer (SD), and solar
cooker (SC), solar water heating (SWH), solar photovoltaic
(SPV: converting sunlight directly into electricity), and
solar thermal electric power (STEP: when the sun’s energy
is concentrated to heat water and produce steam, which is
used to produce electricity). The major component of any
solar system is the solar collector. Solar energy collectors
are special kind of heat exchangers that transform solar
radiation energy to internal energy of the transport medium.
Solar dryers are used for drying fruits and spices. The
three most popular types of SD are box type, cabinet type,
and tunnel type. Box type uses direct heat for dehydration.
In cabinet type dryers, air heated by the collector dehydrates
the food product, whereas in tunnel type forced air
circulation is used to distribute heat for dehydration. Cabinet
and tunnel type dryers yield a high quality of dried products
but they are very bulky and costly compared to the box type
dryers. Of about 800 dryers disseminated so far, 760 are of
the box type
.
Solar energy systems are solar home system, solar
photovoltaic (SPV) systems, solar water heating (SWH)
systems, solar dryers, and solar cookers. These systems are
installed and managed by a household or a small commu-
nity. A solar home system is a PV system with a maximum
capacity of 40 W. These systems are installed and managed
by a household or a small community.
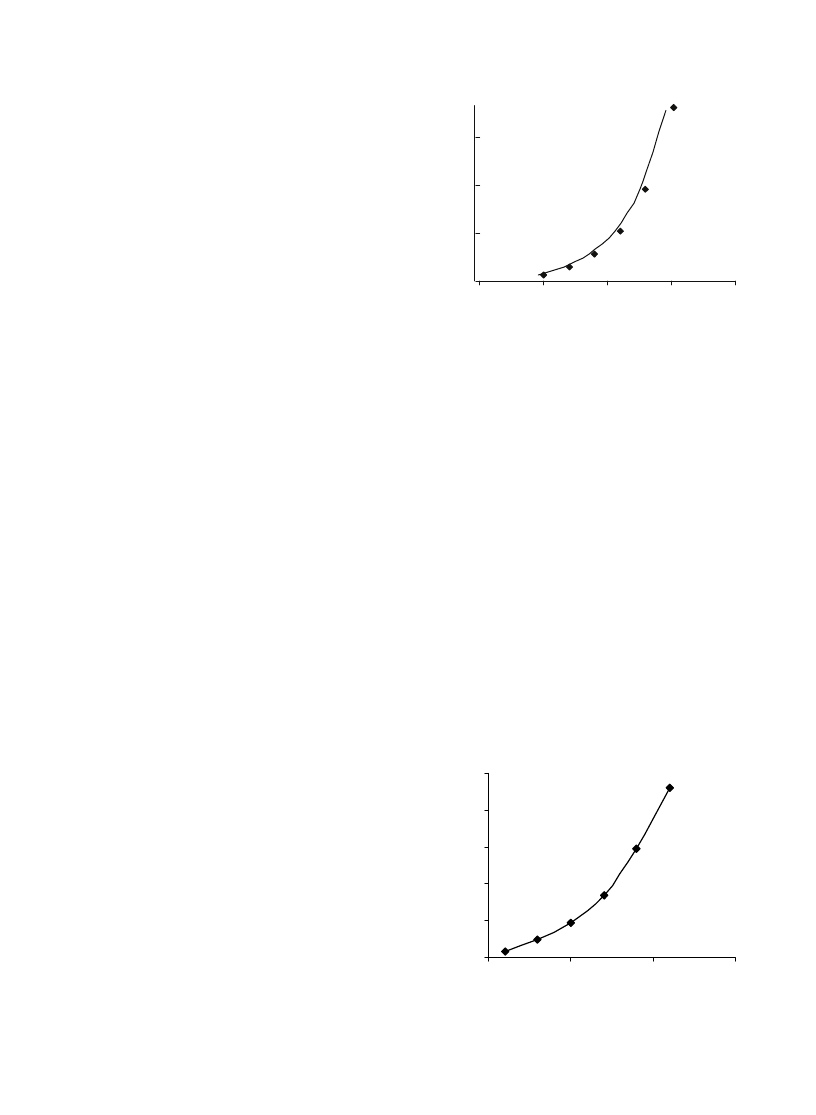
Photovoltaic (PV) systems, other than SHH systems, are
used for communication, water pumping for drinking and
irrigation, and electricity generation. Like wind power
markets, PV markets have seen rapid growth and costs have
fallen dramatically. The total installed capacity of such
systems is estimated at about 1000 kW. Solar photovoltaics
and grid-connected wind-installed capacities are growing at
a rate of 30% a year
shows the world PV module
shipments from 1990 to 2000.
The use of solar energy to split water into oxygen and
hydrogen is an attractive means to directly convert solar
energy to chemical energy
2.5. Wind energy
Renewable energy from the wind has been used for
centuries to power windmills to mill wheat or pump water.
More recently large wind turbines have been designed that
are used to generate electricity. This source of energy is non-
polluting and freely available in many areas. Wind turbines
are becoming more efficient. The cost of the electricity they
generate is falling.
There are wind farms around the world. Because the UK
is on the edge of the Atlantic Ocean it has one of the best
wind resources in Europe. Offshore wind farms in coastal
waters are being developed because winds are often stronger
blowing across the sea. Turbines can produce between
500 kW and 1 MW of electricity. Production of wind-
generated electricity has risen from practically zero in the
early 1980s to more than 7.5 TWh per year in 1995.
Cumulative generating capacity worldwide has topped
6500 MW in late 1997
shows the growth in
world wind turbine installed capacity.
An advantage of wind turbines over some forms of
renewable energy is that they can produce electricity
40
100
160
220
1985
1990
1995
Year
2000
2005
Capacity, MW
Fig. 2. World PV module shipments from 1990 to 2000. Source:
Ref.
2000
6000
10000
14000
18000
22000
1990
1995
2000
2005
Year
Installed capacity at year end, MW
Fig. 3. Growth in world wind turbine installed capacity.
A. Demirbas / Progress in Energy and Combustion Science 31 (2005) 171–192
178

whenever the wind blows (at night and also during the day).
In theory, wind systems can produce electricity 24 h every
day, unlike PV systems that cannot make power at night.
However, even in the windiest places, the wind does not
blow all the time. So while wind farms do not need batteries
for backup storage of electricity, small wind systems do
need backup batteries.
Wind power in coastal and other windy regions is
promising as well. By any measure the power in the wind is
no longer an alternative source of energy. Wind energy has
limitations based on geography and meteorology, plus there
may be political or environmental problems (e.g. dead birds)
with putting turbines in.
2.6. Other renewable energy sources
Marine energy, biogas from animal wastes, landfill gas,
hydrogen and peat energy are the other RES. Marine energy
sources are current, tidal, ocean thermal energy conversion
(OTEC) and wave technologies. The world wave resource is
between 200 and 5000 GW mostly found in offshore
locations
. Wave energy converters fixed to the shore-
line are likely to be the first to be fully developed and
deployed, but waves are typically 2–3 times more powerful
in deep offshore waters than at the shoreline. Wave energy
can be harnessed in coastal areas, close to the shore. The first
patent for a wave energy device was filed in Paris in 1799,
and by 1973 there were 340 British patents for wave energy
devices. By comparison to wind and PV, wave energy and
tidal stream are very much in their infancy. Currently,
around 1 MW of wave energy devices is installed world-
wide, mainly from demonstration projects.
The OTEC is an energy technology that converts solar
radiation to electric power. OTEC systems use the ocean’s
natural thermal gradient to drive a power-producing cycle.
As long as the temperature between the warm surface water
and the cold deep water differs by about 20 K, an OTEC
system can produce a significant amount of power. The
oceans are thus a vast renewable resource, with the potential
to help us produce billions of watts of electric power.
Landfill gas contains about 50% by volume methane.
Producing energy from landfill gas improves local air
quality, eliminates a potential explosion hazard and reduces
greenhouse gas emissions to the atmosphere. Hydrogen,
produced by passing an electrical current through water, can
be used to store solar energy and regenerate it when needed
for night-time energy requirements. Hydrogen can be
produced by pyrolysis from biomass
. It can be burned
to produce heat or passed through a fuel cell to produce
electricity.
3. Biomass combustion
The point where the cost of producing energy from fossil
fuels exceeds the cost of biomass fuels has been reached.
With a few exceptions, energy from fossil fuels will cost
more money than the same amount of energy supplied
through biomass conversion. Because of the concern over
global warming, there is considerable worldwide interest in
increased utilization of renewable energy sources, including
biomass fuels. Biomass not only has considerable potential
as a fuel source, it also shows a reasonable cost level in
comparison to other renewable energies
.
Many different types of biomass can be grown for the
express purpose of energy production. Crops that have been
used for energy include: sugar cane, corn, sugar beets,
grains, elephant grass, kelp (seaweed) and many others.
There are two main factors, which determine whether a crop
is suitable for energy use. Good energy crops have a very
high yield of dry material per unit of land (dry tons/hectare).
A high yield reduces land requirements and lowers the cost
of producing energy from biomass. Similarly, the amount of
energy, which can be produced from a biomass crop, must
be less than the amount of energy required to grow the crop.
Bio-ethanol production from lignocellulosic biomass is
beginning to emerge due to recent advances in conversion
technology
The compositions of biomass among fuel types are
considerable variable, especially with respect to inorganic
constituents important to the critical problems of fouling and
slagging. Alkali and alkaline earth metals, in combination
with other fuel elements such as silica and sulfur, and
facilitated by the presence of chlorine, are responsible for
many undesirable reactions in combustion furnaces and
power boilers.
Biomass fuel properties vary significantly more than
those of coal do. As examples, ash contents vary from less
than 1 to more than 16%, O
2
contents vary from less than 35
to more than 43% and fuel nitrogen (N) varies from w0.2 to
more than 1% (
). Other notable properties of
biomass relative to coal are high moisture content (usually
greater than 27% and sometimes greater than 51% as fired),
potentially high chlorine (Cl) content (ranging from
essentially 0.1 to 1.5%) (
), relatively low heating
value, and low bulk density.
Biomass offers important advantages as a combustion
feedstock because of the high volatility of the fuel and the
high reactivity of both the fuel and the resulting char.
Biomass differs from coal in many important ways,
including the organic, inorganic, and energy content and
physical properties. Relative to coal, biomass generally has
less C, more O
2
, more silica and potassium (K), less
aluminum (Al) and iron (Fe), lower heating value, higher
moisture content, and lower density and friability. Also, the
Cl contents of certain bio-fuels, like straw, can exceed the
levels of coal. The elemental composition differences
between coals and biomass are indicated by the ultimate
analyses (
The inorganic properties of coal also differ significantly
from biomass inorganic components in coal vary by rank
and geographic region. Ash compositions of typical fuel
A. Demirbas / Progress in Energy and Combustion Science 31 (2005) 171–192
179

samples are given in
. As a class, coal has more Al,
Fe, and Ti than biomass. Biomass has more silica, K, and,
sometimes, calcium (Ca) than coal.
In comparison with solid fossil fuels, biomass contains
much less carbon and more oxygen and has a low heating
value. Also, the chlorine contents of certain bio-fuels, like
straw, can exceed the levels of coal. Chlorine is a major
factor in ash formation. Chlorine facilitates the mobility of
many inorganic compounds, in particular potassium. In
combustion applications, biomass has been fired directly,
either alone or along with a primary fuel. The high moisture
and ash contents in biomass can cause ignition and
combustion problems. Because of the low heating values,
biomass is accompanied by flame stability problems. It is
anticipated that blending biomass with higher quality coal
will reduce the flame stability problems, as well as minimize
corrosion effects.
Biomass fuels are considered environmentally friendly
for several reasons
. There is no net increase in CO
2
as a
result of burning a biomass fuel. Biomass consumes the
same amount of CO
2
from the atmosphere during growth as
is released during combustion. The alkaline ash from
biomass also captures some of the SO
2
and CO
2
produced
during combustion
.
3.1. The chemistry of biomass combustion
Biomass combustion is a series of chemical reactions by
which carbon is oxidized to carbon dioxide, and hydrogen is
oxidized to water. Oxygen deficiency leads to incomplete
combustion and the formation of many products of
incomplete combustion. Excess air, cools the system. The
air requirements depend on the chemical and physical
characteristics of the fuel. The combustion of the biomass
relates to the fuel burn rate, the combustion products, the
required excess air for complete combustion, and the fire
temperatures.
In general, combustion properties of biomass can be
classified as macroscopic or microscopic. The macroscopic
properties of biomass fuels are given with for macroscopic
analysis, such as ultimate analysis, heating value, moisture
content, particle size, bulk density, and ash fusion
Table 10
Moisture, ash and higher heating value (HHV) analysis of biomass fuels
Fuel common/scientific name
Moisture (wt% of fuel)
Ash (wt% of dry fuel)
HHV (MJ/kg, daf)
Refs.
Almond shells/Pranus dulcis
7.5
2.9
19.8
Almond hulls/Pranus dulcis
8.0
5.8
20.0
Beech wood/Fagus orientalis
6.5
0.6
19.6
Hazelnut shell/Corylus avellena
7.2
1.4
19.5
Oak wood/Quersus predunculata
6.0
1.7
19.8
Oak bark/Quersus predunculata
5.6
9.1
22.0
Olive pits/Olea europaea
7.0
1.8
22.0
Olive husk/Olea europaea
6.8
2.1
21.8
Pistachio shells/Pistocia vera
8.1
1.3
19.9
Rice straw/Oryza sativa
11.2
19.2
18.7
Spruce wood/Picea orientalis
6.7
0.5
20.5
Switcgrass/Panicum virgatum
13.1
5.9
19.9
Wheat straw/Triticum aestivum
6.4
8.1
19.3
Table 11
Ultimate analyses and ash contents of coal and biomass samples (wt% dry basis)
C
H
N
O (diff.)
S
Cl
Ash
Coal
81.5
4.0
1.2
3.3
3.0
0.3
7.0
Lignite
65.2
4.5
1.3
17.5
4.1
0.4
7.4
Spruce wood
51.4
6.1
0.3
41.2
0.0
0.1
0.9
Hazelnut shell
50.8
5.6
1.0
41.1
0.0
0.2
1.3
Wheat straw
42.8
5.5
0.7
35.5
0.0
1.5
15.5
Corncob
49.0
5.4
0.4
44.2
0.0
0.2
1.0
Corn stover
49.4
5.6
0.6
42.5
0.1
0.3
3.9
Tobacco stalk
49.3
5.6
0.7
42.8
0.0
0.2
2.6
Tobacco leaf
41.2
4.9
0.9
33.9
0.0
0.3
19.2
Almond shell
47.9
6.0
1.1
41.7
0.0
0.1
3.3
Walnut shell
53.6
6.6
1.5
35.5
0.0
0.2
2.8
Source: Refs.
.
A. Demirbas / Progress in Energy and Combustion Science 31 (2005) 171–192
180

temperature.
Properties
for
microscopic
analysis
include thermal, chemical kinetic and mineral data
.
Fuel characteristics such as ultimate analysis, heating value,
moisture content, particle size, bulk density, and ash fusion
temperature of wood fuels have been reviewed
. Fuel
characteristics include proximate analysis, ultimate anal-
ysis, chlorine content, higher heating value, ash elemental
analysis, and trace metal content on a selective basis
.
Fuel properties for the combustion analysis of wood can be
conveniently grouped into physical, chemical, thermal, and
mineral properties.
Physical property values vary greatly and properties
such as density, porosity, and internal surface area are
related to wood species whereas bulk density, particle
size, and shape distribution are related to fuel preparation
methods.
Important chemical properties for combustion are the
elemental analysis, proximate analysis, analysis of pyrolysis
products, higher heating value, heat of pyrolysis, heating
value of the volatiles, and heating value of the char.
Thermal property values such as specific heat, thermal
conductivity, and emissivity vary with moisture content,
temperature, and degree of thermal degradation by one order
of magnitude. Thermal degradation products of wood fuels
consist of moisture, volatiles, char and ash.
Some properties vary with species, location within the
biomass fuels, and growth conditions. Other properties
depend on the combustion environment. Where the proper-
ties are highly variable, the likely range of the property is
given
.
Main combustion reactions are:
Non-reacting solid/Heat, drying/Pyrolysis (Vola-
tiles)/Precombustion reactions/Primary gas phase
combustion/Secondary combustion/Effluent stack
gas
shows the simple wood combustion model. Wood
fuels never burn directly: wood fuels are thermally
degradable and under the influence of a sufficiently strong
energy source they break down into a mixture of volatiles
and carbonaceous char. The two modes of combustion (solid
char and gaseous volatiles) have completely different
chemical mechanisms and kinetics.
3.2. Wood combustion analyses
Characteristics influencing combustion are (a) particle
size and specific gravity, (b) ash content, (c) moisture
content, (d) extractive content, (f) element (C, H, O and N)
content, and (g) structural constituent (cellulose, hemicellu-
loses and lignin) content.
3.2.1. Particle size and specific gravity
Particle size of biomass should be as much as 0.6 cm,
sometimes more, in a profitable combustion process.
Biomass is much less dense and has significantly higher
aspect ratios than coal. It is also much more difficult to
reduce to small sizes.
3.2.2. Ash content
Ash or inorganic materials in plants depend on the type
of the plant and the soil contamination in which the plant
grows. On average wood contains about 0.5% ash
. Ash
contents of hard and soft woods are about 0.5 and 0.4%,
respectively. Insoluble compounds act as a heat sink in the
same way as moisture, lowering combustion efficiency, but
soluble ionic compounds can have a catalytic effect on the
pyrolysis and combustion of the fuel. The presence of
inorganic compounds favors the formation of char
. Ash
content is an important parameter directly affecting the
heating value. High ash content of a plant part makes it less
desirable as fuel
The composition of mineral matter can vary between and
within each biomass sample. Mineral matter in fruit shells
consists mostly of salts of calcium, potassium, silica, and
magnesium, but salts of many other elements are also
present in lesser amounts
3.2.3. Moisture content
Moisture in biomass generally decreases its heating value
. Moisture in biomass is stored in spaces within the dead
cells and within the cell walls. When the fuel is dried the
stored moisture equilibrates with the ambient relative
humidity. Equilibrium is usually about 20% in air dried fuel.
Moisture percentage of the wood species varied from
41.27 to 70.20%
. Heating value of a wood fuel
decreases with increasing of moisture content of the wood.
Moisture content varies from one tree part to another. It is
often the lowest in the stem and increases toward the roots
and the crown
The presence of water in biomass influences its
behaviour during pyrolysis and affects the physical proper-
ties and quality of the pyrolysis liquid. The results obtained
show that for higher initial moisture contents the maximum
liquid yield on a dry feed basis occurs at lower pyrolysis
temperatures between 691 and 702 K
3.2.4. Extractive content
Again the heat content, which is a very important factor
affecting utilization of any material as a fuel, is affected by
WOOD
AIR
COMBUSTION
HEAT
COMBUSTION PRODUCTS
WATER
Fig. 4. A simple model for wood combustion.
A. Demirbas / Progress in Energy and Combustion Science 31 (2005) 171–192
181

the proportion of combustible organic components (called
as extractives) present in it
. The HHVs of the
extractive-free plant parts were found to be lower than
those of the unextracted parts, which indicate a likely
positive contribution of extractives towards the increase of
HHV. Extractive content is important parameter directly
affecting the heating value. High extractive content of a
plant part makes it desirable as fuel. Again the heat content,
which is a very important factor affecting utilization of any
material as a fuel, is affected by the proportion of extractives
present in it. Extractives raised the higher heating values of
the wood fuels
3.2.5. Element content
Both the chemical and the physical composition of the
fuel are important determining factors in the characteristics
of combustion. Biomass can be analyzed by breaking it
down into structural components (called as proximate
analysis) or into chemical elements (called as ultimate
analysis).
The heat content is related to the oxidation state of the
natural fuels in which carbon atoms generally dominate and
overshadow small variations of hydrogen content. On the
basis of literature values for different species of wood,
Tillman
also found a linear relationship between HHV
and carbon content.
3.2.6. Structural constituent content
Biomass fuels are composed of biopolymers that consist
of various types of cells and the cell walls are built of
cellulose, hemicelluloses and lignin. HHVs of biomass fuels
increase as increase lignin contents
. In general, the
FC content of wood fuels increases with increase in their FC
contents
3.3. The energy value of biomass
Moisture, ash and HHV analysis of the biomass fuels
are given in
. The standard measure
of the energy content of a fuel is its heating value,
sometimes called the calorific value or heat of combustion.
The higher heating value at constant pressure measures the
enthalpy change of combustion with water condensed.
There have been many attempts at correlating the heating
value with the composition. Cellulose has a smaller
heating value than lignin because of its higher degree of
oxidation. Other compounds, such as HC in the fuel with
lower degrees of oxidation, tend to raise the heating value of
the biomass
In earlier work
, formulae were developed for
estimating the HHVs of various lignocellulosic materials,
using their ultimate analysis data. The relation between the
observed HHV and C, H and O contents of the samples
(wt %) was investigated. Thus the HHV (MJ/kg) of
lignocellulosic materials including C, H and O can be
calculated from Eq. (1):
HHV Z 0:335C C 1:423H K 0:154O
(1)
3.3.1. Pyrolysis
Pyrolysis is defined as the thermal destruction of organic
materials in the absence of oxygen. Pyrolysis is the basic
thermochemical process for converting biomass to a more
useful fuel. Biomass is heated in the absence of oxygen, or
partially combusted in a limited oxygen supply, to produce a
hydrocarbon rich gas mixture, an oil-like liquid and a carbon
rich solid residue.
The thermochemical transformation (pyrolysis and/or
gasification) represents certainly more than 95% of the
energetic valorization of biomass. Slow pyrolysis, generally
associated with medium temperatures (825 K) leads to
the production of a pyrolysis gas composed of H
2
and CO
. Pyrolysis is the simplest and almost certainly the
oldest method of processing one fuel in order to produce a
better one. Pyrolysis can also be carried out in the presence
of a small quantity of oxygen (‘gasification’), water (‘steam
gasification’) or hydrogen (‘hydrogenation’). One of the
most useful products is methane, which is a suitable fuel for
electricity generation using high-efficiency gas turbines.
Cellulose and hemicelluloses form mainly volatile
products on heating due to the thermal cleavage of the
sugar units. The lignin forms mainly char since it is not
readily cleaved to lower molecular weight fragments. The
progressive increase in the pyrolysis temperature of the
wood led to the release of the volatiles thus forming a solid
Table 12
Ash compositions of typical fuel samples (wt% of ash)
Fuel sample
Si
2
O
Al
2
O
2
TiO
2
Fe
2
O
3
CaO
MgO
Na
2
O
K
2
O
SO
3
Cl
Coal type 1
42.0
20.0
1.2
17.0
5.5
2.1
1.4
5.8
5.0
–
Coal type 2
59.7
19.8
2.1
8.3
2.1
1.8
0.8
2.1
2.0
–
Coal type 3
51.5
22.6
2.0
14.9
3.3
0.9
1.0
2.0
3.5
–
Lignite
35.3
17.3
1.2
5.4
18.1
3.3
1.1
4.6
12.1
–
Spruce wood
49.3
9.4
–
8.3
17.2
1.1
0.5
9.6
2.6
0.8
Wheat straw
48.0
3.5
–
0.5
3.7
1.8
14.5
20.0
1.9
3.6
Hazelnut shell
33.7
3.1
0.1
3.8
15.4
7.9
1.3
30.4
1.1
0.1
Source: Ref.
A. Demirbas / Progress in Energy and Combustion Science 31 (2005) 171–192
182

residue that is different chemically from the original starting
material.
Pyrolysis of wood has been studied as a zonal process
. Thermal degradation properties of hemicelluloses,
celluloses and lignin can be summarized as follows
Thermal degradation of hemicellulosesOof celluloseO
of lignin
Torrefaction is a feasible method for improvement the
properties of wood as a fuel. It consists of a slow heating of
wood in an inert atmosphere to a maximum temperature of
575 K
. The treatment yields a solid uniform product
with lower moisture content and higher energy content
compared to those in the initial wood.
The content of carbon in the solid product increases at
higher temperature of the torrefaction and longer residence
time while the content of hydrogen and oxygen decrease,
increasing the calorific value of the torrified wood. The
content of CH
4
, H
2
, C
x
H
y
, and CO in the product gases
increases when the temperature is increased while the
content of CO
2
decreases. The torrefied samples absorb
small amounts of moisture, however, the moisture content is
much less compared to the content of moisture in the raw
material
Cellulose and hemicelluloses initially break into com-
pounds of lower molecular weight. This forms an ‘activated
cellulose’ which decomposes by two competitive reactions:
one forming volatiles (anhydrosugars) and the other char
and gases. The thermal degradation of the activated
cellulose and hemicelluloses to form volatiles and char
can be divided into categories depending on the reaction
temperature. Within a fire all these reactions take place
concurrently and consecutively.
Gaseous emissions are predominantly a product of
pyrolitic cracking of the fuel. If flames are present, fire
temperatures are high, and more oxygen is available from
thermally induced convection.
A comparison of pyrolysis, ignition, and combustion of
coal and biomass particles reveals the following:
(1) Pyrolysis starts earlier for biomass compared with coal.
(2) The VM content of biomass is higher compared with
that of coal.
(3) The fractional heat contribution by VM in biomass is on
the order of 70 compared with 36% for coal.
(4) Biomass char has more O
2
compared with coal. The
fractional heat contribution by biomass is on the order
of 30 compared with 70% for coal.
(5) The heating value of volatiles is lower for biomass
compared with that of coal.
(6) Pyrolysis of biomass chars mostly releases CO, CO
2
,
and H
2
O.
(7) Biomass has ash that is more alkaline in nature, which
may aggravate fouling problems.
The organic compounds from biomass pyrolysis are the
following groups:
(1) A gas fraction containing: CO, CO
2
, some hydro-
carbons and H
2
.
(2) A condensable fraction containing: H
2
O and low
molecular weight organic compounds (aldehydes,
acids, ketones and alcohols).
(3) A tar fraction containing: higher molecular weight
sugar residues, furan derivatives, phenolic compounds
and airborne particles of tar and charred material which
form the smoke.
3.3.2. Char combustion
The char in which is formed is highly reactive because of
the trapped free radicals, and porous. Char is very different
from pure carbon compounds like graphite. This means a
large surface area which has a large absorptive capacity. The
properties of the char are related to the pyrolysis conditions
as well as the physical and chemical properties of the fuel.
The burning of the active carbon (the char) to form CO
2
in the presence of sufficient oxygen and high enough
temperatures is known as glowing combustion. The yield of
solid product decreases while the yield of gas, tar and water
increases with the temperature and the residence time. It was
not found a strong influence of the inert gas flow on the
product distribution at the selected conditions. Where
temperatures are too low, or where there is insufficient
oxygen for complete combustion smouldering occurs
(characterized by smoking or emission of unoxidized
pyrolysis products). The burning of the VMs is known as
flaming combustion. Flaming dominates at higher tempera-
tures and smouldering at lower temperatures.
3.3.3. Gasification
Biomass gasification technologies have historically been
based upon partial oxidation or partial combustion prin-
ciples, resulting in the production of a hot, dirty, low Btu gas
that must be directly ducted into boilers or dryers. In
addition to limiting applications and often compounding
environmental problems, these technologies are an ineffi-
cient source of usable energy
.
Gasification is a form of pyrolysis, carried out at high
temperatures in order to optimize the gas production. The
resulting gas, known as producer gas, is a mixture of carbon
monoxide, hydrogen and methane, together with carbon
dioxide and nitrogen. The gas is more versatile than the
original solid biomass (usually wood or charcoal): it can be
burnt to produce process heat and steam, or used in gas
turbines to produce electricity.
Biomass gasification technologies are expected to be an
important part of the effort to meet these goals of expanding
the use of biomass. Gasification technologies provide the
opportunity to convert renewable biomass feedstocks into
clean fuel gases or synthesis gases. Biomass gasification is
the latest generation of biomass energy conversion
A. Demirbas / Progress in Energy and Combustion Science 31 (2005) 171–192
183

processes, and is being used to improve the efficiency, and to
reduce the investment costs of biomass electricity gener-
ation through the use gas turbine technology. High
efficiencies (up to about 50%) are achievable using
combined-cycle gas turbine systems, where waste gases
from the gas turbine are recovered to produce steam for use
in a steam turbine. Economic studies show that biomass
suffocation plants can be as economical as conventional
coal-fired plants
Commercial gasifier are available in a range of size and
types, and run on a variety of fuels, including wood,
charcoal, coconut shells and rice husks. Power output is
determined by the economic supply of biomass, which is
limited to 80 MW in most regions.
Various gasification technologies include gasifiers where
the biomass is introduced at the top of the reactor and the
gasifying medium is either directed co-currently (down-
draft) or counter-currently up through the packed bed
(updraft). Other gasifier designs incorporate circulating or
bubbling fluidized beds. Tar yields can range from 0.1
(downdraft) to 20% (updraft) or greater in the product gases.
The process of synthetic fuels (synfuels) from biomass
will lower the energy cost, improve the waste management
and reduce harmful emissions. This triple assault on plant
operating challenges is a proprietary technology that gasifies
biomass by reacting it with steam at high temperatures to
form a clean burning synthetic gas (syngas: COCH
2
). The
molecules in the biomass (primarily carbon, hydrogen and
oxygen) and the molecules in the steam (hydrogen and
oxygen) reorganize to form this syngas.
The composition of the syngas can be varied by control
of key process parameters but is generally as follows:
Hydrogen (30–40%), carbon monoxide (20–30%), methane
(10–15%), carbon dioxide (15–20%), ethylene (1%), water
vapor (6%), and nitrogen (1%)
.
In all types of gasification, biomass is thermochemi-
cally converted to a low or medium-energy content gas.
The higher heating value of syngas produced from
biomass in the gasifier is 10–13 typically MJ/Nm
3
. Air-
blown biomass gasification results in approximately
5 MJ/Nm
3
and oxygen-blown 15 MJ/Nm
3
of gas and is
considered a low to medium energy content gas compared
to natural gas (35 MJ/Nm
3
)
3.4. Combustion properties and combustion considerations
The combustion consequences of the biomass compo-
sition, particularly the fuel volatility, involve changing
the process of combustion within any device. The
introduction of biomass into a coal-fired PC boiler adds
a fuel whose dominant reaction sequence is volatilization
and gas-phase combustion, rather than char formation and
gas-solids oxidation as is the dominant combustion
process for coal
Combustion
of
biomass
in
coal-fired
boilers
introduces a fundamentally different fuel into the furnace.
shows the physical, chemical and fuel properties
of biomass and coal fuels. Biomass has significantly lower
heating values than most coals. This is caused, in part, by
the generally higher moisture content and, in part, by the
high O
2
content. One might be led to believe that the
lower heating values lead to lower flame temperatures.
Biomass fuels also have higher volatile matter (VM)
yields than coals. Biomass usually consists of 70–80% VM
whereas coal consists of 10–50% VM. Notice the relative
volatility of the two types of fuel; the biomass typically has a
VM/fixed carbon (FC) ratio O4.0. The VM/FC ratio for coal
is virtually always !1.0. The American Society for Testing
and Materials (ASTM) tests for volatile yields consistently
under predict the actual yields during combustion, but in
both cases, bio-fuel yields exceed those of coal by a
substantial margin. Carbon consumption is a potential
problem when co-firing bio-waste with coal.
4. Energy related environmental issues
The presence in the atmosphere of one or more
contaminants in such quality and for such duration as is
injurious, or tends to be injurious, to human health or
welfare, animal or plant life. It is the contamination of air
by the discharge of harmful substances. Air pollution can
cause health problems and it can also damage the
environment and property. It has caused thinning of the
protective ozone layer of the atmosphere, which is leading
to climate change.
Air quality standard (AQS) is the prescribed level of a
pollutant in the outside air that should not be exceeded
during a specific time period to protect public health. Air
pollution is the presence of polluting gases and suspended
particles in the atmosphere in excess of the AQSs.
Air quality criteria (AQC) is the varying amounts of
pollution and lengths of exposure at which specific adverse
effects to health and comfort take place. The main air
Table 13
Physical, chemical and fuel properties of biomass and coal fuels
Property
Biomass
Coal
Fuel density (kg/m
3
)
w500
w1300
Particle size (mm)
w3
w100
C content (wt% of dry fuel)
42–54
65–85
O content (wt% of dry fuel)
35–45
2–15
S content (wt% of dry fuel)
Max 0.5
0.5–7.5
SiO
2
content (wt% of dry ash)
23–49
40–60
K
2
O content (wt% of dry ash)
4–48
2–6
Al
2
O
3
content (wt% of dry ash)
2.4–9.5
15–25
Fe
2
O
3
content (wt% of dry ash)
1.5–8.5
8–18
Ignation temperature (K)
418–426
490–595
Peak temperature (K)
560–575
–
Friability
Low
High
Dry heating value (MJ/kg)
14–21
23–28
Source: Ref.
.
A. Demirbas / Progress in Energy and Combustion Science 31 (2005) 171–192
184

pollutants are carbon monoxide, lead, nitrogen dioxide,
ozone, persistent organic pollutants (POPs), suspended
particulate matter and sulfur dioxide
4.1. Greenhouse effect
Increased levels of greenhouse gases (GHGs) in the
atmosphere should lead to warmer temperatures on the
earth’s surface. CO
2
is main greenhouse gas associated with
global warning. At the present time, coal is responsible for
30–40% of world CO
2
emissions from fossil fuels. About
98% of carbon emissions result from fossil fuel (coal, oil,
and natural gas) combustion.
shows the plot for
carbon dioxide concentrations by years.
shows the
world CO
2
emissions between 1990 and 2020. Currently, it
is estimated that CO
2
contributes about 50% to the
anthropogenic greenhouse effect.
shows contribution
each gas to the greenhouse effect.
The greenhouse effect is the rise in temperature that
the Earth experiences because certain gases such as water
vapor, carbon dioxide (CO
2
), nitrous oxide (N
2
O),
chlorofluorocarbons (CFCs), methane (CH
4
), and other
trace gases [hydrofluorocarbons (HFCs), perfluorocarbons
(PFCs), sulfur hexafluorane (SF6), and trifluoromethyl
sulfur pentafluoride (SF
5
CF
3
)] in the atmosphere trap
energy from the sun.
There are a large number of scientists who believe that
human activities, which have increased atmospheric con-
centrations of CO
2
by more than one-third over the past 100
years, may be leading to an increase in globally average
temperatures. However, this so-called ‘global warming’
theory is not without challengers who argue that scientific
proof supporting such theories is incomplete, and that many
uncertainties remain surrounding the nature and direction of
Earth’s climate.
4.2. Air pollution
Air pollution is a very broad term, which actually covers
many different types of pollution. The presence in the
atmosphere of one or more contaminants in such quality and
for such duration as is injurious, or tends to be injurious, to
human health or welfare, animal or plant life. It is the
contamination of air by the discharge of harmful substances.
Air pollution can cause health problems and it can also
damage the environment and property. It has caused
thinning of the protective ozone layer of the atmosphere,
which is leading to climate change.
In cities across the globe, the personal automobile is the
single greatest polluter, as emissions from millions of
vehicles on the road add up to a planet-wide problem.
In addition to carbon dioxide and water from engine
combustion reaction, however, the petroleum-based engine
discharges other substances into the atmosphere, substances
that are either smog-production or downright poisonous:
unburned hydrocarbons, carbon monoxide, nitrogen oxides,
and various compounds of lead from the leaded gasoline
engine
. Growing public concern about these pollutants
has caused a minor revolution in the petroleum and auto
industries.
4.3. Acid rain
It is well known that some energy-related activities are
the major sources of acid precipitation. Acid rain is a term,
which is used to describe a variety of processes which might
more accurately be referred to as acidic deposition. The acid
rain occurs when sulfur dioxide and nitrogen oxides from
Year
1750
1800
1850
1900
1950
2000
Carbon dioxide concentration (ppm)
270
280
290
300
310
320
330
340
350
Fig. 5. Plot for carbon dioxide concentrations by years.
5000
6000
7000
8000
9000
10000
11000
1985
1995
2005
2015
2025
Years
World carbon dioxide emissions
(million metric tons)
Fig. 6. World CO
2
emissions between 1990 and 2020.
N
2
O (6 %)
CH
4
(15 %)
CFCs (24 %)
CO
2
(55 %)
Fig. 7. Contribution each gas to the greenhouse effect.
A. Demirbas / Progress in Energy and Combustion Science 31 (2005) 171–192
185

the burning of fossil fuels such as, petrol, diesel, and coal
combine with water vapor in the atmosphere and fall as rain,
snow or fog. These gases can also be emitted from natural
sources like volcanoes. Nitrogen oxides (NO
x
) cause smog
and acid rain. It is produced from burning fuels including
petrol, diesel, and coal in automobiles, homes, and
industries is a major source of pollution in the air. Average
AQS value in respirable air of SPM is 140–200 mg/m
3
.
Acid rain causes extensive damage to water, forest, soil
resources and even human health. It is said that it can
corrode buildings and be hazardous to human health. The
international scope of the problem has led to the signing of
international agreements on the limitation of sulfur and
nitrogen oxide emissions.
5. Discussions
5.1. Environmental problems
Global warming has been increasingly associated with
the contribution of CO
2
. The gases (they consist of three or
more atoms) with higher heat capacities than those of O
2
and
N
2
cause greenhouse effect.
CH
4
C
2O
2
/
CO
2
C
2H
2
O
1
:00 g
2
:75 g
(2)
2C
4
H
10
C
13O
2
/
8CO
2
C
10H
2
O
1
:00 g
3
:03 g
(3)
C C O
2
/
CO
2
1
:00 g
3
:66 g
(4)
From Eq. (2), among the fossil fuels, natural gas is the
least responsible for CO
2
emissions. Liquefied petroleum
gas (LPG) causes higher CO
2
than that of natural gas Eq. (3).
The highest amount of CO
2
occurs according to Eq. (4).
Thus responsibility of the fossil fuel increases with
increasing its carbon number. In addition, overall CO
2
emissions can be reduced by biomass combustion because it
is a CO
2
neutral fuel.
Increased levels of greenhouse gases (GHGs) in the
atmosphere should lead to warmer temperatures on the
earth’s surface. There is a consensus amongst scientists that
biomass fuels used in a sustainable manner result in no net
increase in atmospheric CO
2
. Some would even go as far as
to declare that sustainable use of biomass will result in a net
decrease in atmospheric CO
2
. This is based on
the assumption that all the CO
2
given off by the use of
biomass fuels was recently taken in from the atmosphere by
photosynthesis. Increased substitution of fossil fuels with
biomass based fuels would therefore help reduce the
potential for global warming, caused by increased atmos-
pheric concentrations of CO
2
.
Most scientists consider it likely that if the atmospheric
concentrations of carbon dioxide (CO
2
) and other so-called
greenhouse gases continue to rise; the earth’s climate will
become warmer
. An increase in average global
temperatures of approximately 0.56 K has been measured
over the past century. This increase is called as ‘global
climate change’ or global warming. If current trends
continue, the latest projections for future warming have
been increased to between 1.5 and 5.8 K over the next
century.
shows the measured global surface
temperatures relative to the average for the 130-year period
1861–1990.
During the past 1000 years, temperatures have naturally
fluctuated by about 1 degree so this rise is not necessarily a
result of the greenhouse effect. The latest computer models
predict that global temperatures could raise 1–3 K by the
middle of the next century if current trends persist. Global
climate change could result in sea level raises, changes to
patterns of precipitation, increased variability in the weather
and a variety of other consequences. The production and
human use of energy contributes 60% of the human impact
on global climate change. Other activities which increase
the level of greenhouse gases in the atmosphere are the use
of chemicals such as chlorofluorocarbons (15%), agriculture
(12%), land-use modifications (9%), and other human
activities (4%). At the present time, the rate of world-wide
greenhouse gas emissions is increasing every year.
Global climate change is an issue where energy
questions will be the subject of considerable international
political activity. It is an issue that raises key questions
about politically sensitive topics such as national sover-
eignty and international equity. But the Kyoto conference
attended by 160 countries in December 1997 and world
summits such as the Rio and Montreal meetings showed that
most governments feel the need to address the question.
According to the Kyoto protocol, so-called Annex I
countries (OECD Members plus economies in transition)
must reduce their emissions of six greenhouse gases by at
least 5% compared with 1990 levels over 2008–2012.
The earth’s surface temperature has increased by about
0.6 K over the last century, and as a consequence the sea
level is estimated to have risen by perhaps 20 cm.
Predictions show that if atmospheric concentrations of
greenhouse gasses, mainly due to fossil fuels combustion,
continue to increase at the present rates, the earth’s
temperature may increase by another 2–4 K in the next
century. If this prediction is realized, the sea level could rise
between 30 and 60 cm before the end of this century
The environmental protection agency (EPA) of USA has
identified six criteria main air pollutants: carbon monoxide,
lead, nitrogen dioxide, ozone, suspended particulate matter
and sulfur dioxide.
Carbon dioxide (CO
2
) is the principle greenhouse gas
emitted as a result of human activities such as the burning of
coal, oil, and natural gases. CO
2
emissions from the burning
of fossil and biomass fuels play a key role in the greenhouse
A. Demirbas / Progress in Energy and Combustion Science 31 (2005) 171–192
186

effect, which affects climate change. At present, the OECD
countries account for 54% of CO
2
emissions worldwide.
Carbon monoxide (CO) is a colourless, odourless gas
that is produced by the incomplete burning of carbon-based
fuels including petrol, diesel, and wood. It is also produced
from the combustion of natural and synthetic products such
as cigarettes. It lowers the amount of oxygen that enters our
blood. It can slow our reflexes and make us confused and
sleepy. Average AQS value of CO is 2.0–4.0 mg/m
3
.
Ozone (O
3
) occurs naturally in the upper layers of the
atmosphere. This important gas shields the earth from the
harmful ultraviolet rays of the sun. However, at the ground
level, it is a pollutant with highly toxic effects. Ozone
depletion is another result of pollution. The ozone layer in
the stratosphere protects the earth from harmful ultraviolet
radiation from the sun. Release of chlorofluorocarbons
(CFCs) from aerosol cans, cooling systems and refrigerator
equipment removes some of the ozone, causing ‘holes’; to
open up in this layer and allowing the radiation to reach the
earth.
Nitrogen oxides (NO
x
) cause smog and acid rain. It is
produced from burning fuels including petrol, diesel, and
coal. Nitrogen oxides can make children susceptible to
respiratory diseases in winters. Average AQS limit value in
air of NO
x
is 60–80 mg/m
3
.
Biomass combustion emits CO
2
and when the combus-
tion is incomplete, it also emits CO, N
2
O, CH
4
other HCs
and particulate matter. Smoke from low efficient wood fuel
stoves has proved to be one of the important risk factors in
many health problems. Significant environmental benefits
can be obtained by using biomass fuels in direct combustion,
gasification, or pyrolysis systems, although some uncertain-
ties exit at present. SO
2
, CO
2
, and ash production will be
typically being far lower for biomass power systems than for
coal combustion and conversion systems.
Sulfur dioxide (SO
2
) is a gas produced from burning
coal, mainly in thermal power plants. Some industrial
processes, such as production of paper and smelting of
metals, produce sulfur dioxide. It is a major contributor to
smog and acid rain. Sulfur dioxide can lead to lung diseases.
Average AQS value in air of SO
2
is 60–80 mg/m
3
.
Chloroflorocarbons (CFC) are gases that are released
mainly from air-conditioning systems and refrigeration.
When released into the air, CFCs rise to the stratosphere,
where they come in contact with few other gases, which lead
to a reduction of the ozone layer that protects the earth from
the harmful ultraviolet rays of the sun.
Hazardous air pollutant (HAP) means an air pollutant
which presents, through inhalation or other routes of
exposure, a threat of adverse human health effects or
adverse environmental effects whether through ambient
concentrations, bio-accumulation, deposition, or otherwise.
Toxic chlorinated hydrocarbons (polychlorinated biphe-
nyls, benzenes and dioxins and furans) and polyaromatic
hydrocarbons were examined in the flue gas
. The levels
of dioxins in gases and ashes produced in wood combustion
were reported
. Dioxins are persistent, toxic and bio-
accumulative chemicals and because they can be transported
over long distances from the source of emission, they are
also persistent organic pollutants (POPs). Wood offers
advantages over fossil fuels with regard to emissions: the
sulfur and nitrogen contents of wood are low, thus SO
x
emissions are negligible, and, if temperature is controlled to
reduce oxidation of nitrogen from the air, the overall NOx
will also be low
5.2. Pollutant emissions
Significant environmental benefits can be obtained by
using biomass fuels in direct combustion, gasification, or
pyrolysis systems, although some uncertainties exist at
present. CO
2
, SO
2
, and ash production will be typically
being far lower for biomass power systems than for coal
combustion and conversion systems
.
Primary pollutant emissions formed are particulate
matter PM, CO, HC, oxides of nitrogen NO
x
, principally
NO and NO, and oxides of sulfur SO, principally as SO.
Acid gases, such as HCl, may also be emitted, as may lead
and other heavy metals. CO and HC, including volatile
organic compounds (VOC) and polycyclic aromatic hydro-
carbons (PAH), are products of incomplete combustion
Smoke is generated by thermal pyrolysis of a certain
kind of biomass when there is limited access of oxygen to
prevent combustion, but allows destructive. A recent review
of biomass smoke composition records over 400 volatile
components comprising acids, alcohols, carbonyls, esters,
furans, lactones, phenols, PAHs and other miscellaneous
compounds distillation
Dioxins emissions from power boilers fuelled with salt-
laden wood waste was investigated
. Dioxins emissions
were found to offer effective control (stack dioxins
emissions of 0.064–0.086 ng/m
3
) in good combustion
conditions. Biomass combustion, particularly forest fires,
have been implicated as a major source of dioxins and
furans.
5.3. Biomass combustion problems in boiler
Biomass-firing technology has some technological
problems. First, the issue of combustor fouling and
corrosion caused by the alkaline nature of the biomass ash
needs attention. Fouling of combustor surfaces is a major
issue that has played an important role in the design and
operation of combustion equipment. Slagging and fouling
reduces heat transfer of combustor surfaces and causes
corrosion and erosion problems, which reduce the lifetime
of the equipment. The main contributions to fouling come
from the inorganic material in the fuel. Sodium and
potassium lower the melting point of ash and, hence, can
increase ash deposition and fouling of boiler tubes
The straws and grasses have relatively high alkali indexes as
well as higher chloride and sulfate ratios, consistent with
A. Demirbas / Progress in Energy and Combustion Science 31 (2005) 171–192
187

the higher rates of fouling and slagging observed for these
fuels. Both almond hull and almond shell are regarded as
high fouling fuels. Although they contain large quantities of
alkali, they have lower chlorine and sulfur concentrations
compared with many other fuels. Almond hulls and shells
are also known to contribute to rapid corrosion of boiler
surfaces, but the role of Cl and S in corrosion for these fuels
has not been detailed
.
The ash deposition rate from biomass can greatly exceed
or be considerably less than that from coal. Deposition rates
from blends of biomass and coal lie between the observed
rates for the neat fuels but are generally lower than one
would expect if interpolating between the behaviors of the
neat fuels. Baxter
addressed ash deposition and
corrosion problems during coal and biomass combustion.
Ash deposition properties such as thermal conductivity,
tenacity, emissivity and morphology were discussed in
relation to fuel characteristics and operating conditions.
Baxter concluded that the ash deposition rate in biomass
combustion would peak at early times and then decrease
monotonically. The tenacity and the strength of the biomass
combustion deposits will be higher as compared to deposits
from coal combustion.
Second, the maximum particle size of a given biomass
that can be fed to and burned in a given boiler through a
given feeding mechanism requires additional studies.
Third, practical pulverizer performance needs to be
examined. Biomass may require separate pulverizers to
achieve
high
blend
ratios
and
good
combustion
performance.
5.4. Reburning biomass fly ash
Circulating fluidised bed (CFB) boilers are particularly
suitable for reburning ash, as they are fuel-flexible and
produce well burntout ashes. A high level of unburnt carbon
in ash not only indicates inefficient fuel use, but also reduces
ash stabilization (chemical hardening) and dramatically
increases the ash volume. This, in turn, raises the cost of
handling, transportation and spreading. To enable recycling,
the boiler combustion efficiency must be improved or the
ash must be reburnt to reduce carbon levels.
The ash reburning results in 20% lower NO
X
emissions
but somewhat increased CO emissions. CO is somewhat
increased, from about 100–140 ppm, but it can still be kept
below the allowed average limit of 150 ppm CO. The good
quality of the fly ash produced in the CFB boiler remains.
The economical benefits are reduced fuel cost and ash
handling cost. The resulting ash can be recycled to the
forest, replacing nutrients lost through tree felling. How-
ever, the amount of ash added must be kept at a relative low
level to avoid increased tendency for corrosion in the boiler
. For a sustainable energy system based on biomass
the nutrious substances in the ash should be recycled to the
forest. Fly ash from biomass-fired grate boilers containing
high levels of unburnt carbon and is not suitable for direct
recycling. Grate boilers often produce a fly ash with 50% or
more of unburnt carbon. This ash has to be better burned
before it can be recycled to the forest. CFB boilers are
especially suitable since they are fuel flexible and produce
well burnt out ashes. The unburnt carbon has replaced 1–2%
of the fuel input to a CFB boiler reducing NO
X
emissions
and fuel costs. A positive effect is the decreased NO
x
emission, about 20–30% depending on the amount of ash.
5.5. Corrosion
The corrosion observed in the air preheater is caused by a
combination of the presence of hygroscopic (i.e. water-
absorbing) species in the deposits, particularly iron
chlorides, and temperature variations caused by intermitting
plant operation. It generally demonstrates that the alkali in
general (and the potassium and sodium in particular) are
more available and reactive in the biofuels than in the
various deposits of coal. It is this ash reactivity that can
cause significant difficulties in biowaste combustion
.
Ash deposits reduce heat transfer and may also result in
severe corrosion at high temperatures. Compared with
deposits generated during coal combustion, deposits from
biomass fuels are denser and more difficult to remove.
Chlorine, which is found in certain biomass types, such
as straw, may affect operation by corrosion. The high Cl and
alkali contents of some biomass, like wheat straw, raise
concerns regarding corrosion. The Cl content of wheat straw
is w1.5%. The greatest concern focuses on high tempera-
ture corrosion of superheater tubes induced by the presence
of Cl on the tube surface. The corrosion aspects of this
investigation characterized Cl concentration in the deposit
and its dependence on operating conditions. The Cl
concentration should be minimized in all cases. The data
indicate
that the amount of Cl in the deposit decreases
sharply with increasing S content, and that cofiring a high-
Cl, low-S biomass fuel with an S-containing coal often
results in deposits with very low Cl useful for N
2
O control.
NO
x
emissions during may be obeyed through well-
established, stoichiometric-driven means. The corrosion is
a function of total fuel Cl content, available (not total) alkali
content, and total S content.
5.6. Ash related problems in biomass combustion
Trace elements present in biomass plays an important role
in the various practices of this renewable feedstock
. The
trace elements (generally metals) are of great biochemical
interest and them nutritional, clinical and environmental
importance. The amounts of trace element levels are related
to species of biomass, growing site of the sample, age of
plant, and distance the source of pollution
. It has been
reported that Pb(II), Cd(II), and Hg(II) ions especially are
environmentally harmful to some plants
The content of residual toxic metals in treated biomass,
being in direct relation with the efficiency of the applied
A. Demirbas / Progress in Energy and Combustion Science 31 (2005) 171–192
188

metal removal process, highly influences the refuse options
of them. Several methods such as adsorption using activated
carbon or other appropriate sorbents, post-precipitation, ion
exchange, etc. have been applied in order to remove the
greatest possible degree of toxic metals residual concen-
trations
The removal of arsenic, cadmium, chromium, copper,
lead, and mercury, a toxic metal of high environmental
priority due to its toxicity, from char and ash samples of
biomass was investigated in the earlier works
Extensive information is not available on the metal
contents in many biomass species. Therefore their assess-
ment has been difficult due to limited knowledge on their
chemical forms. Limited information is available on the
proportion of highly toxic methylmercury. This was
reported to be usually only a few per cent of total mercury
content
The utilization of biomass and waste as fuels has a
positive environmental. However, it also introduces
environmental risks due to the content of heavy metals
(especially Cd) in the combustion residues. The results from
bulk analysis showed that the quantity of Cd in MSW and
biomass fly ashes was high. Fly ash from solid waste showed
to have the highest total level of Cd (270 mg/kg)
; on the
other hand, fly ash from biomass combustion contained a
level of Cd (20 mg/kg). The most abundant heavy metals in
solid waste fly ash are zinc (11,000 mg/kg) and lead
(4000 mg/kg). The information on chemical forms of
cadmium in biomass has been very scarce.
Inorganic elements and compounds in biomass fuels
influence the combustion process and the composition of the
ashes produced. The results of the material balances for
inorganic elements showed that the concentrations of
environmentally relevant heavy metals (especially Cd
and Zn) in biomass ashes increase with decreasing precipi-
tation temperature and particle size
. This effect is
independent of the bio-fuel used. The high concentrations of
elements (K, Na, Cl and S) in biomass fly ash as well as in the
boiler fly ash are of great relevance for reactions that can take
place in the boiler section where the flue gas is subjected to a
considerable temperature gradient which is accompanied by
chemical reactions, phase transitions and precipitation
Table 14
Average toxic metal levels of the bottom ashes from coal and biomass species (mg/kg)
Fuel species
Arsenic
Cadmium
Chromium
Copper
Lead
Mercury
Coal
5.16
2.84
8.23
23.5
64.1
0.206
Lignite
8.54
6.18
9.40
72.8
80.7
0.426
Spruce wood
3.48
0.92
2.56
42.7
33.2
0.121
Beech wood
4.12
0.84
4.38
29.3
35.0
0.126
Oak wood
1.98
1.06
3.51
37.9
28.4
0.087
Solid waste
2.46
0.86
2.73
52.8
36.2
0.106
Wheat straw
0.18
0.20
3.08
25.1
5.68
0.062
Hazelnut shell
0.12
0.23
4.15
32.3
6.62
0.051
Walnut shell
0.26
0.18
2.18
23.6
5.09
0.077
Peanut shell
0.09
0.16
1.16
34.3
3.55
0.087
Almond shell
0.16
0.13
1.04
12.8
1.16
0.049
Sunflower shell
0.06
0.10
0.95
13.3
1.63
0.032
Sources: Refs.
.
Table 15
Average toxic metal levels of the fly ashes from coal and biomass species (mg/kg)
Fuel species
Arsenic
Cadmium
Chromium
Copper
Lead
Mercury
Coal
9.84
12.4
21.6
66.2
260.4
0.426
Lignite
15.8
31.5
49.0
214.6
345.8
0.768
Spruce wood
11.6
18.4
30.2
153.8
376.3
0.582
Beech wood
12.8
16.3
26.8
90.6
531.4
0.608
Oak wood
6.37
20.8
34.4
106.4
345.9
0.426
Solid waste
7.22
17.5
28.6
158.0
658.0
0.524
Wheat straw
1.24
4.68
7.68
76.9
104.2
0.318
Hazelnut shell
0.74
4.96
8.16
95.2
136.5
0.264
Walnut shell
1.35
3.68
6.05
67.1
102.3
0.406
Peanut shell
0.48
3.36
5.79
102.8
72.6
0.450
Almond shell
0.98
2.70
4.43
40.2
29.5
0.473
Sunflower shell
0.39
2.09
3.42
41.8
38.7
0.168
Sources: Refs.
.
A. Demirbas / Progress in Energy and Combustion Science 31 (2005) 171–192
189

processes that can support or initiate fouling and corrosion.
These effects are of special importance for bio-fuels that are
rich in alkali metals and Cl such as straw and cereals.
The composition of ash depended on plant species (e.g.
wheat, rape, Salix) and variety, growth conditions, ash
fraction and heating plant. Independent of the bio-fuel
source, fly ash has generally higher concentrations of
several heavy metals than bottom ash
. Wood ash
has generally higher As, Cd, Pb and Hg contents
than agricultural residue, such as wheat straw and fruit
shells, ash (
). Compared with bottom ash, Pb and
Cd concentrations in fly ash were 10–20 times higher
(
).
A medium term solution to the recycling of solid
residues from biomass combustion is blending cyclone fly-
ash and bottom ash and using the mixture in agriculture
.
Although a large part of nutrients might be recycled in
this manner, care has to be taken of the relatively high
amount of cadmium in this material. This is especially
important in cases when cadmium accumulating species are
used as fuel
.
6. Conclusion
The use of biomass energy has many unique qualities
that provide environmental benefits. It can help mitigate
climate change, reduce acid rain, soil erosion, water
pollution and pressure on landfills, provide wildlife habitat,
and help maintain forest health through better management.
Modern boilers usually produce heat, steam or electri-
city. Direct combustion systems vary considerably in their
design. The fuel choice makes a difference in the design and
efficiency of the combustion system. Direct combustion
technology using biomass as the fuel is very similar to that
used for coal.
Air toxic emissions during biomass combustion were
typically very low, and often near or below detection limits,
largely as a result of the good air-fuel mixing and high
furnace temperatures associated with pulverized coal
combustion.
The application of such fuels in industry offers a wide
range of ecological and, in many cases, economical
advantages like: conservation of fossil fuel resources,
reduction of the dependence on fuel imports, utilization of
agricultural and forest residues, reduction of emission
of harmful species from fossil fuel combustion, recultivation
of non-utilized farming areas, and minimization of waste
disposal.
Biomass-firing technology has some technological
problems.
First,
the
issue
of
combustor
fouling
and corrosion caused by the alkaline nature of the biomass
ash needs attention. Fouling of combustor surfaces is a
major issue that has played an important role in the design
and operation of combustion equipment. Fouling and
corrosion problems are presented by high temperature
molten products of biomass combustion. Slagging and
fouling reduces heat transfer of combustor surfaces and
causes corrosion and erosion problems, which reduce the
lifetime of the equipment
The ash deposition rate from biomass can greatly exceed
or be considerably less than that from coal. Deposition rates
from blends of biomass and coal lie between the observed
rates for the neat fuels but are generally lower than one
would expect if interpolating between the behaviors of the
neat fuels. Second, the maximum particle size of a given
biomass that can be fed to and burned in a given boiler
through a given feeding mechanism requires additional
studies.
Third, practical pulverizer performance needs to be
examined. Biomass may require separate pulverizers to
achieve
high
blend
ratios
and
good
combustion
performance.
Numerical studies are also discussed. Biomass is an
attractive renewable fuel in utility boilers. The compositions
of biomass among fuel types are variable. Ash composition
for the biomass is fundamentally different from ash
composition for the coal. Especially inorganic constituents
cause to critical problems of toxic emissions, fouling and
slagging. Metals in ash, in combination with other fuel
elements such as silica and sulfur, and facilitated by the
presence of chlorine, are responsible for many undesirable
reactions in combustion furnaces and power boilers.
Elements including Si, K, Na, S, Cl, P, Ca, Mg, Fe are
involved in reactions leading to ash fouling and slagging in
biomass combustors. Chlorine in the biomass may affect
operation by corrosion. Ash deposits reduce heat transfer
and may also result in severe corrosion at high temperatures.
Other influences of biomass composition are observed for
the rates of combustion and pollutant emissions. Biomass
combustion systems are non-polluting and offer significant
protection of the environment. The reduction of greenhouse
gases pollution is the main advantage of utilizing biomass
energy.
References
[1] Demirbas A. Recent advances in biomass conversion technol-
ogies. Energy Edu Sci Technol 2000;6:19–40.
[2] Kalogirou SA. Solar thermal collectors and applications. Prog
Energy Combust Sci 2004;30:231–95.
[3] Sayigh AAW. Renewable energy: global progress and
examples. Renew Energy 2001, WREN; 2001 p. 15–7.
[4] Johanson TB, Kelly H, Reddy AKN, Williams RH. Renewable
fuels and electricity for a growing world economy. In:
Johanson TB, Kelly H, Reddy AKN, Williams RH, editors.
Renewable
energy—sources
for
fuels
and
electricity.
Washington, DC: Island Press; 1993. p. 1–71.
[5] UNDP. World energy assessment 2000—energy and the
challenge of sustainability. New York: UNDP; 2000 (ISBN
9211261260).
A. Demirbas / Progress in Energy and Combustion Science 31 (2005) 171–192
190

[6] Edinger R, Kaul S. Humankind’s detour toward sustainability:
past, present, and future of renewable energies and electric
power generation. Renew Sustain Energy Rev 2000;4:
295–313.
[7] Nakicenovic N, Gru¨bler A, McDonald A, editors. Global
energy perspectives. Cambridge, UK: Cambridge University
Press; 1998.
[8] Fridleifsson IB. Geothermal energy for the benefit of the
people. Renew Sustain Energy Rev 2001;5:299–312.
[9] Tewfik SR. Biomass utilization facilities and biomass
processing technologies. Energy Edu Sci Technol 2004;14:
1–19.
[10] Demirbas A. Biomass resources for energy and chemical
industry. Energy Edu Sci Technol 2000;5:21–45.
[11] Demirbas A. Combustion characteristics of different biomass
fuels. Progress Energy Combus Sci 2004;30:219–30.
[12] Cuff DJ, Young WJ. US energy atlas. New York: Free Press;
1980.
[13] Ramage J, Scurlock J. In: Boyle G, editor. Biomass, in
renewable energy-power for a sustainable future. Oxford:
Oxford University Press; 1996.
[14] Dogru M, Howarth CR, Akay G, Keskinler B, Malik AA.
Gasification of hazelnut shells in a downdraft gasifier. Energy
2002;27:415–27.
[15] Novak P, Moffat AIB, Nalluri C, Narayanan R. Hydraulic
structures. 2nd ed. E&FN Spon, an imprint of Champman &
Hall, London, UK; 1996.
[16] Gleick PH. The world’s water, the biennial report on
freshwater resources. Oakland, CA: Pacific Institute for
Studies in Development, Environment, and Security; 1999.
[17] Demirbas A. Sustainable development of hydropower energy
in Turkey. Energy Sources 2002;2:27–40.
[18] Penche C. Layman’s guidebook on how to develop a small
hydro site. ESHA, European Small Hydropower Association,
Directorate General for Energy (DG XVII); 1998.
[19] Adıgu¨zel F, Tutus¸ A. Small hydroelectric power plants in
Turkey, Hydro 2002, Development, Management Perform-
ance, Proceedings, 283–93, 4–7 November, 2002.
[20] IASH. International Association for Small Hydro [
]; 2004.
[21] ISHA. International Small Hydro Atlas [
]; 2004.
[22] UNIDO. United Nation Industrial Development Organization
); 2003.
[23] Cunningham P, Atkinson B. Micro hydro power in the nineties
1998 [
http://www.microhydropower.com
[24] Kueny JL. Part I: Objectives for small hydro technology,
Institute National Polytechnique de Grenoble, p. 1–35, B.P.
53–38041- Grenoble cedex 9-France, [
]; 2003.
[25] Romas H, De Almedia AB. Small hydropower schemes as an
important renewable energy sources. Hidroenergia 99, 1–13
October, Vienna, Australia; 1999.
[26] Romas H, De Almedia AB. Small hydro as one of the oldest
renewable energy sources, Water power and dam construction,
Small hydro, 8–12 May, Lisbon; 2000.
[27] Pokharel S. Promotional issues on alternative energy technol-
ogies in Nepal. Energy Policy 2003;31:307–18.
[28] Chum HL, Overend RP. Biomass and renewable fuels. Fuel
Process Technol 2001;71:187–95.
[29] Garg HP, Datta G. Global status on renewable energy, in
‘Solar Energy Heating and Cooling Methods in Building’,
International Workshop: Iran University of Science and
Technology. 19–20 May, 1998.
[30] Arni S. Hydrogen-rich gas production from biomass via
thermochemical pathways. Energy Edu Sci Technol 2004;13:
47–54.
[31] Gera D, Mathur MP, Freeman MC, Robinson A. Effect of
large aspect ratio of biomass particles on carbon burnout in a
utility boiler. Energy Fuels 2002;16:1523–32.
[32] Sami M, Annamalai K, Wooldridge M. Co-firing of coal and
biomass fuel blends. Progress Energy Combust Sci 2001;27:
171–214.
[33] Hein KRG, Bemtgen JM. EU clean coal technology,
cocombustion of coal and biomass. Fuel Process Technol
1998;54:159–69.
[34] Spliethoff H, Hein KRG. Effect of co-combustion of biomass
on emissions in pulverized fuel furnaces. Fuel Process Technol
1998;54:189–205.
[35] Bushnell DJ, Haluzok C, Dadkhah-Nikoo A. Biomass fuel
characterization testing and evaluating the combustion
characteristics of selected biomass fuels. Corvallis, OR:
Bonneville Power Administration; 1989.
[36] Hughes EE, Tillman DA. Biomass cofiring: status and
prospects 1996. Fuel Process Technol 1998;54:127–42.
[37] Demirbas¸ A. Determination of combustion heat of fuels by
using non-calorimetric experimental data. Energy Edu Sci
Technol 1998;1:7–12.
[38] Demirbas¸ A. Relationships between heating value and lignin,
moisture, ash and extractive contents of biomass fuels. Energy
Explor Exploit 2002;20:105–11.
[39] Demirbas¸ A. Fuel characteristics of olive husk and walnut,
hazelnut, sunflower and almond shells. Energy Sources 2002;
24:213–9.
[40] Demirbas¸ A. Fuelwood characteristics of six indigenous wood
species from Eastern Black Sea region. Energy Sources 2003;
25:309–16.
[41] Wenger KF. Forestry handbook. 2nd ed. New York: Wiley;
1984.
[42] Demirbas A. Effect of initial moisture content on the yields of
oil from pyrolysis of biomass. J Anal Appl Pyrolysis 2004;71:
803–15.
[43] Kataki R, Konwer D. Biomass Bioenergy 2001;20:17.
[44] Tillman DA. Wood as an energy resource. New York:
Academic Press; 1978.
[45] Demirbas A. Relationships between lignin contents and fixed
carbons of biomass samples. Energy Convers Manage 2003;
44:1481–6.
[46] Demirbas A. Relationships between heating value and lignin,
fixed carbon and volatile material contents of shells from
biomass products. Energy Sources 2003;25:629–35.
[47] Demirbas A. Calculation of higher heating values of biomass
fuels. Fuel 1997;76:431–4.
[48] Baxter LL, Miles TR, Miles Jr TR, Jenkins BM, Milne T,
Dayton D, et al. The behavior of inorganic material in
biomass-fired power boilers: field and laboratory experiences.
Fuel Process Technol 1998;54:47–78.
[49] Demirbas A. Yields of hydrogen-rich gaseous products via
pyrolysis from selected biomass samples. Fuel 2001;80:
1885–91.
A. Demirbas / Progress in Energy and Combustion Science 31 (2005) 171–192
191

[50] Morf P, Hasler P, Nussbaumer T. Mechanisms and kinetics of
homogeneous secondary reactions of tar from continuous
pyrolysis of wood chips. Fuel 2002;81:843–53.
[51] Demirbas A. The importance of biomass. Energy Sources
2004;26:361–6.
[52] Demirbas A. Biomass co-firing for coal-fired boilers. Energy
Explor Exploit 2003;21:269–78.
[53] Morrison RT, Boyd RN. Organic chemistry. Singapore: Allyn
and Bacon, Inc.; 1983.
[54] Tester JW, Wood DO, Ferrari NA. Energy and the
environment in the 21st century. New York: MIT Press; 1991.
[55] Cline W. The economics of global warming. Washington, DC:
Institute for International Economics; 1992.
[56] Colonbo U. Development and the global environment. In:
Hollander JM, editor. The energy–environment connection.
Washington: Island Press; 1992. p. 3–14.
[57] Ruokojarvi P, Aatamila M, Ruuskanen J. Toxic chlorinated
and polyaromatic hydrocarbons in simulated house fires.
Chemosphere 2000;41:825–8.
[58] Lavric ED, Konnov AA, De Ruyck J. Dioxin levels in wood
combustion—a review. Biomass Bioenergy 2004;26(115):
145.
[59] McIlveen-Wright DR, Williams BC, McMullan JT. A re-
appraisal of wood/red combustion. Biores. Technol 2001;
76:183–90.
[60] Bain RL, Overend RP, Craig KR. Biomass-fired power
generation. Fuel Process. Technol 1998;54:1–16.
[61] Donovan Associates, C.T.Air emissions and ash disposal at
wood-burning facilities: a sourcebook and case studies for the
Great Lakes region, Great Lakes Regional Biomass Energy
Program; 1995.
[62] Conde FJ, Ayala JH, Afonso AM, Gonza´lez V. Optimization
of a sampling method to determine polycyclic aromatic
hydrocarbons in smoke from incomplete biomass combustion.
Analytica Chimica Acta 2004;524:287–94.
[63] Luthe C, Karidio I, Uloth V. Towards controllıng dıoxıns
emıssıons from power boılers fuelled wıth salt-laden wood
waste. Chemosphere 1997;35:557–74.
[64] Tillman DA. Biomass cofiring: the technology, the experience,
the combustion consequences. Biomass Bioenergy 2000;19:
365–84.
[65] Easterly JL, Burnham M. Overview of biomass and waste fuel
resources for power production. Biomass Bioenergy 1996;
10(2-3):79–92.
[66] Jenkins BM, Baxter LL, Miles Jr TR, Miles TR. Combustion
properties of biomass. Fuel Processing Technol 1998;54:
17–46.
[67] Baxter LL. Ash deposition during biosolid and coal combus-
tion. A mechanistic approach. Biomass Bioenergy 1993;4(2):
85–102.
[68] Demirbas A. Air toxic emissions from biomass combustion.
Energy Sources 2003;25:419–27.
[69] Demirbas¸ A. Trace metal concentrations in ashes from various
types of biomass species. Energy Sources 2003;25:743–51.
[70] Pastircakova K. Determination of trace metal concentrations
in ashes from various biomass materials. Energy Edu Sci
Technol 2004;13:97–104.
[71] Liu J. Co-firing and fuel properties of coal and bio-waste
blends. Energy Edu Sci Technol 2004;13:55–64.
[72] Suarez-Garcia
FA,
Martinez-Alonso
M,
Fernandez
Llorente JMD, Tascon JMD. Inorganic matter characterization
in vegetable biomass feedstocks. Fuel 2002;81:1161–9.
[73] Kalac P, Svoboda L, Havliekova B. Contents of detrimental
metals mercury, cadmium and lead in wild growing edible
mushrooms: a review. Energy Edu Sci Technol 2004;13:31–8.
[74] Liukkonen-Lilja H, Kuusi T, Laaksovirta K, Lodenius M,
Piepponen S. The effect of lead processing works on the lead,
cadmium and mercury contents of fungi. Z Lebens Unters
Forsch 1983;A177:257–60.
[75] Kefala MI, Zouboulis AI, Matis KA. Biosorption of cadmium
ions by Actinomycetes and separation by flotation. Environ
Pollut 1999;104:283–93.
[76] Fischer RG, Rapsomanikis S, Andreae MO, Baldi F. Bioac-
cumulation of methylmercury and transformation of inorganic
mercury by macrofungi. Environ Sci Technol 1995;29:993–9.
[77] Remond S, Pimienta P, Bentz DP. Effects of the incorporation
of municipal solid waste incineration fly ash in cement pastes
and mortars. I. Experimental study. Cement Conc Res 2002;
32:303–11.
[78] Obernberger I. Concentrations of inorganic elements in
biomass fuels and recovery in the different ash fractions.
Biomass Bioenergy 1997;12:211–24.
[79] Sander M-L, Andre´n O. Ash from cereal and rape straw used
for heat production: liming effect and contents of plant
nutrients and heavy metals. Water Air Soil Pollut 1997;93:
93–108.
[80] Sander M-L, Ericson T. Vertical distribution of plant nutrients
and heavy metals in salix viminalis stems and their implications
for sampling. Biomass Bioenergy 1998;14:57–66.
[81] Holzner H. Ecological and economic evaluation of biomass
ash utilization—the Austrian approach. In: BIOS, editor.
Ashes and particulate emissions from biomass combustion,
Series Thermal Biomass Utilization, 3. Graz, Austria: cbv;
1998. ISBN 3-7041-0254-7.
[82] Ericson SO. Salix cleans soil from cadmium. In: Ademe,
editor. Proceedings of the 8th European conference on
biomass for energy, agriculture and industry.
[83] Demirbas A. Global energy sources, energy usage and future
developments. Energy Sources 2004;26:191–204.
[84] Demirbas A. Sustainable cofiring of biomass with coal.
Energy Convers Manage 2003;44:1465–79.
A. Demirbas / Progress in Energy and Combustion Science 31 (2005) 171–192
192
Document Outline
- Potential applications of renewable energy sources, biomass combustion problems in boiler power systems and combustion related environmental issues
Wyszukiwarka
Podobne podstrony:
[2006] Application of Magnetic Energy Recovery Switch (MERS) to Improve Output Power of Wind Turbine
[2006] Application of Magnetic Energy Recovery Switch (MERS) to Improve Output Power of Wind Turbine
Alternative Renewable Energy Source Free electricity
04 Laws of Microactuators and Potential Applications of Electroactive Polymers in MEMS
Production of Energy from Biomass Residues 020bm 496 1993
An analysis of the energy efficiency of winter rapeseed biomass under
Comparative assessment of the energy effects of biomass combustion
0 Renewable Energy Analysis Of A Wind Turbine Kelley 1997
renewable energy
[ebook renewable energy] Home Power Magazine 'Correct Solar Panel Tilt Angle to Sun'
Applications of polyphase filters for bandpass sigma delta analog to digital conversion
2 Application of Distributed Loads
2004 Applications of RT to translation
application of solid state fermentation to food industry a review
Final Secret of Free Energy Bearden
Power Converters And Control Renewable Energy Systems
94 1363 1372 On the Application of Hot Work Tool Steels for Mandrel Bars
1 Application of Joints and Springs in ANSYS
więcej podobnych podstron