
Comparative assessment of the energy effects of biomass combustion
and co-
firing in selected technologies
Stanis
ław Tokarski
, Krzysztof G
łod
*
, Marek
Scia
˛ _zko
, Jaros
ław Zuwała
a
TAURON Polska Energia S.A, Poland
b
Institute for Chemical Processing of Coal, Poland
a r t i c l e i n f o
Article history:
Received 15 December 2014
Received in revised form
18 May 2015
Accepted 14 June 2015
Available online 10 July 2015
Keywords:
Biomass co-
firing
Biomass
Energy requirement
Utility plants
CFB boilers
a b s t r a c t
The rational use of renewable energy sources depends largely on the processing technology applied and
is a key element of sustainable development. The most widespread method of producing electricity from
renewable sources in power plants involves the co-
firing of biomass with fossil fuels, utilizing the
existing infrastructure. In recent years, many existing units have been modernized to enable co-
firing,
including dedicated systems for feeding biomass directly to the combustion chamber. Simultaneously,
work has also begun on building new units designed for the exclusive combustion of biomass, whereas
other units have been retro
fitted to replace coal with biomass combustion.
To establish a comparative assessment of the energetic and environmental effectiveness of the con-
version of biomass into electricity, indicators are developed based on the unit consumption of energy,
chie
fly electrical, that is used to prepare the fuel. These indicators reflect the effect the energy consumed
by different biomass conversion processes have on CO
2
emissions. The results of the calculations are
presented for technologies involving combustion and co-
firing in both pulverized fuel and fluidized bed
boilers. To determine the energy required from the biomass and coal portion of the mixture fed to the
boiler, a consistent methodology is developed analogous to the method of avoided fuel inputs used to
determine the indicators during the cogeneration of electricity and heat.
The input data for the simulations originated from industrial tests performed under different tech-
nological con
figurations.
© 2015 Elsevier Ltd. All rights reserved.
1. Introduction
The generation of CO
2
free energy can be achieved by either
implementing CCS (carbon capture and storage) technologies or
partially (or completely) substituting fossil fuels with biomass
(commonly considered a CO
2
-neutral fuel). Apart from having a
positive environmental effect in terms of CO
2
direct emission re-
ductions, biomass combustion reduces the depletion of non-
renewable fuel resources.
The world CO
2
emissions statistics (2008) illustrate that 41% of
total CO
2
emissions originate from electricity and heat generation
industries. The share of the energy industry in total anthropogenic
GHG (greenhouse-gas) emissions volume reaches 83%, of which
94% is CO
2
thus, reducing these emissions in the energy supply
sector remains an important issue.
Currently, the Polish energy sector is facing a number of serious
challenges due to obligation to reducing CO
2
emission by 2020,
while maintaining a high level of energy security. The TAURON
group, second largest energy producer in Poland, joined R
&D
Strategic Programme
“Development of a technology for highly
ef
ficient zero-emission coal-fired power units integrated with CO
2
capture
”
developing post-combustion CO
2
capture
and oxy-
fuel combustion technology
, as well as biomass co-
firing
to
find economically and technically acceptable way to reduce CO
2
emissions.
This paper presents a newly developed methodology for
determining the energy- and environment-related indicators to
support the scienti
fic debate concerning the real effectiveness of
the technological options available for the conversion of biomass
into electricity during combustion and co-
firing. The methodology
used to determine the indicators for units that are used for the co-
firing or combustion of biomass is consistent with analogous to the
method of reduced fuel inputs used to determine indicators for the
cogeneration of electricity and heat
.
* Corresponding author.
E-mail address:
(K. G
łod).
Contents lists available at
Energy
j o u r n a l h o me p a g e :
w w w . e l s e v i e r . c o m/ l o ca t e / e n e r g y
http://dx.doi.org/10.1016/j.energy.2015.06.044
0360-5442/
© 2015 Elsevier Ltd. All rights reserved.

The Polish Draft Act on Renewable Sources of Energy
lists the
available renewable (non-fossil) energy sources, including wind
energy, solar energy, aerothermal energy, geothermal energy, hy-
drothermal energy, hydroenergy, energy from sea currents, tides
and waves, and energy obtained from biomass, biogas, agricultural
biogas and bioliquids. Each of these sources is subject to different
conditions for the exploitation of its full potential, in which a
notable factor is the average time over the course of a year during
which the source can be used. For example, the available time for
the use of solar energy by means of photovoltaic cells is approxi-
mately 700 h; for wind power plants, the maximum is approxi-
mately 2500 h; a biomass-
fired power plant can operate at its rated,
nominal output for ca 7000 h; and the annual operational time of
biomass co-
firing units is close to that of conventional, coal-fired
units
To obtain a full picture, renewable sources of energy should also
be analysed in terms of their effect on the energy security of a
country. Based on the de
finition of energy security, as established in
the Polish Energy Law
e “Energy security is a state of the
economy which enables the satisfaction of the current and antici-
pated needs of customers for fuels and energy in a technically and
economically justi
fied manner and with adherence to the re-
quirements of environmental protection
”, it can be concluded that
among the analysed types of renewable energy sources, only the
use of biomass, as a form of accumulated solar energy that is
relatively easy to store and transport, appears to satisfy all of the
conditions included in the de
finition.
As previously mentioned, biomass plays a fundamental role in
reducing effective carbon dioxide emissions in conventional elec-
tricity production by replacing coal
e fossil fuel; the combustion of
fossil fuels is a main source of anthropogenic CO
2
emissions. The
need to reduce global emissions of carbon dioxide, in the absence of
any other substitute fuels with a zero CO
2
emission index, estab-
lishes biomass as the only direct substitute for coal that can provide
the possibility of zero-emission combustion. These considerations
have driven the development of technologies for the co-
firing and
combustion of biomass. In the present work, these technologies are
assessed in terms of their energy, economic and environmental
effectiveness.
Aspects of the assessment of biomass combustion and co-
firing
on energy and ecological effects have already been subject to an-
alyses e.g.,
. The economic aspects of biomass co-
firing
have been studied with regard to incentive systems
. The pro-
cess simulation package, ECLIPSE has been used here to analyse
three different biomass co-
firing configurations and to perform
techno-economic assessment studies of each technology. The SI
(speci
fic investment) and BESP (Break-Even Electricity Selling
Price) for each system were calculated and compared with the coal-
fired plants. The sensitivity of the economics of these large power
plants to such factors as fuel cost, load factor and insurance, oper-
ational and maintenance costs for two discount cash
flow rates was
investigated. The effect of applying the ROC (Renewable Obligations
Certi
ficate) subvention to the economics of the power plants was
also assessed for a wide range of wood fuel costs. When retro
fitting
coal-
fired condensing power plants to co-fire with biomass, two
methods were used to determine whether co-
firing is an environ-
mentally friendly solution
to cover all signi
ficant aspects of the
electricity production process that may in
fluence the environment:
carbon footprint and energy evaluation. These environmental ac-
counting approaches were selected to determine the maximum
supply distance of biomass that allows the co-
firing of coal and
biomass to be more environmentally ef
ficient than pure coal
combustion. Furthermore, the geological origin of the coal com-
busted was considered because the environmental inputs for
feedstock varied. The results of the study showed that the addition
of approximately 20% biomass to the mass of the combustion
mixture decreases carbon-dioxide emissions by nearly 11
e25% and
total energy
flow by 8e15%.
A previous study
evaluated the technical and economic
aspects of biomass co-
firing electricity production with and without
CC (CO
2
capture) using different mixtures of coal and sawdust. The
effect of biomass co-
firing on the performance of power plants was
evaluated in terms of energy ef
ficiency, auxiliary power consump-
tion, capital costs, operational
& maintenance costs, specific CO
2
emissions, electricity cost and CO
2
avoidance costs. Depending on
the feedstock composition, the biomass co-
firing power plant
generated 750
e800 MW electricity in the case of carbon capture
and 980
e1027 MW electricity without capture. This indicated a
continuous decrease in both technical and economical perfor-
mances with increasing biomass content in the feedstock.
A techno-economic model for the estimation of economics of
co-
firing was previously presented
using pilot plant test results
for biomass co-
firing and general heat and mass balances. Addi-
tionally, a sensitivity analysis was performed with this developed
model to investigate the effects of different operating and logical
parameters on the economics of the biomass coal co-
firing process.
In the process of co-
firing of coal and biomass, directly deter-
mining the quantity of energy consumed by the auxiliary needs of
devices (e.g., blowers, ventilators, mills) that are associated directly
with the biomass is not technically possible. Therefore, an indirect
method must be used to determine the components related to the
ef
ficiency of the conversion of biomass and the actual reduction in
carbon dioxide emissions. In the present work, a detailed analysis
of this problem is undertaken using an example of a co-
firing
process performed in a PF (pulverized fuel boiler) with the co-
firing of sunflower husks and spent hops at three characteristic
loads(electric power output): 200 MW, 180 MW and 140 MW. The
identical procedure was applied for the co-
firing of biomass in a
fluidized bed boiler (CFB) at characteristic electric power output:
66 MW, 56 MW and 42 MW. In the case of biomass combustion in a
dedicated
fluidized bed boiler, the process energy requirement
could be calculated directly from measurements taken for the
system as a whole.
In consequence, a de
finitive comparison of the following in-
dicators is possible: unit consumption of energy on driving process
devices, boiler net energy ef
ficiency, efficiency of electricity pro-
duction from biomass, and reduction in carbon dioxide emissions.
In this paper, the results of the calculations are reported for
technologies related to the combustion and co-
firing of pulverized
fuel and in
fluidized bed boilers. The results are based on data that
were
obtained
in
trial
tests
performed
under
different
Abbreviations
CCS
carbon capture and storage
GHG
greenhouse gas
CC
carbon capture
PF
pulverized fuel boiler
CFB
circulating
fluidized bed boiler
C
hard coal
SU
sun
flower husks
HO
brewer's spent grain
CE
cereal waste
BM
biomass mixture
ACC
alternative coal con
figuration
COF
co-
firing
REF
reference con
figuration
S. Tokarski et al. / Energy 92 (2015) 24
e32
25

technological con
figurations and loads. The results enable a reliable
evaluation of the effectiveness of producing electricity from
renewable sources in the analyzed technological conditions.
2. Experimental
The study was conducted on the following four generating units
using industrial processes:
biomass co-combustion in a CFB boiler type CFB-260 (boiler
speci
fication: 260 Mg/h, temperature and pressure steam:
540
C and 13.7 MPa,
biomass co-firing in a pulverized coal fired boiler type OP-650k
(boiler speci
fication: stream steam 650 Mg/h, temperature and
pressure live steam: 540
C and 13.5 MPa),
100% biomass fired fluidized bed boiler type OFz-201 (boiler
speci
fication: stream steam 200 Mg/h, temperature and pres-
sure live steam: 510
C and 9.7 MPa), and
100% biomass fired burning pulverized coal boiler type OP-120
(boiler speci
fication: stream steam 120 Mg/h, temperature and
pressure live steam: 500
C and 7.6 MPa).
The biomass co-
firing in a fluidized bed boiler CFB-260 was fed
by steam coal, sun
flower husks and cereal waste. Tests were per-
formed for a baseline coal combustion and for the co-combustion of
coal with biomass for three characteristic boiler loads
e 100%, 80%
and 60%
e which correspond to the unit electric power outputs of
66 MW, 56 MW and 42 MW, respectively. Fuel analysis of coal,
biomass used in the co-
firing trial tests shown in
.
The biomass co-
firing in pulverized coal fired boiler OP-650k
was fed by steam coal and biomass in the form of brewer's spent
grain and sun
flower husks. Tests were performed at baseline coal
combustion, and co-combustion tests of coal with biomass were
performed for three characteristic loads of 89%, 80% and 62%, which
correspond to the electric load of 200 MW, 180 MW and 140 MW.
Fuel analysis of coal, biomass used in the co-
firing trial tests is
shown in
. Mass fraction of Brewer's spent grain in the fuel
mixture was 2,8% for electric power output of 140 MW and 5,2% for
200 MW test. Mass fraction of sun
flower husks in the fuel mixture
was 4,1%, 3,5% and 4,8% for electric power output of 140 MW,
180 MW and 200 MW test respectively.
The unit dedicated exclusively to biomass combustion in a
biomass boiler type
fluidized OFz-201 uses a biomass mixture of
wood chips and sun
flower husk pellets. Tests were performed on
the combustion of biomass for several characteristic loads
e
30 MW, 40 MW, 45 MW and 50 MW
e which correspond to 60%,
80%, 90% and 100% boiler load level, respectively. Fuel analysis of
coal, biomass used in the trial tests shown in
.
Because of the requirements of the boiler manufacturer, tests
were performed on only one type of blend, with sun
flower husks
forming 22% of the mass fraction and wood chips forming the
remaining 78%.
Technical solutions are available for the fuel delivery systems
(forest biomass and agro), i.e., blend the biomass before its delivery
to the boiler bunkers to burn a mixture during the administration of
the share, regardless of the current load of the boiler.
In the unit dedicated exclusively to biomass combustion in the
pulverized coal boiler OP-120, a biomass mixture of wood chips,
wood pellets and agro biomass was used. Three mixtures were
tested and were composed of wood chips, wood pellets and
biomass agro for three characteristic loads: 20 MW, 16 MW and
12 MW. At these loads, the steam boiler ef
ficiency (depending on
the parameters of the steam outlet) are in the range of
102.5
e106 Mg/h, 81e90 Mg/h and 71e74.6 Mg/h, respectively. Fuel
analysis of coal, biomass used in the trial tests shown in
To obtain stable parameters, the chemical composition of the
bed material and the particle size of the bed material during the co-
Table 1A
Fuel analysis of coal used in the co-
firing trial tests (CFB-C).
Parameter
Coal
Coal
Coal sludge
Coal
Coal sludge
E
el
42
56
66
W
t
r
21.4
18.9
38.8
19.2
37.8
W
a
2.9
2.8
2
2.9
1.9
A
a
13.5
18.1
47
16,2
48,6
St
a
1.53
1.43
1.05
1.64
0.66
NHV
19 962
19 455
8 063
19 903
7 839
m
m
100
83
17
78
22
where:
Eel is the electric power outputs, MW
W
t
r
is the total moisture, %;
W
a
is the moisture, %;
A
a
is the ash, %;
St
a
is the total sulphur, %;
NHV is the is the net calori
fic value, kJ/kg;
m
m
is the mass participation, %.
Table 1B
Fuel analysis of coal and biomass used in the co-
firing trial tests (CFB-SU).
Parameter
Coal
Sun-
flower husks
Coal
Sun-
flower husks
Coal sludge
Coal
Sun-
flower husks
Coal sludge
E
el
42
56
66
W
t
r
17.4
11
20
11.1
38.1
21.4
10
39.4
W
a
3.5
3.8
2.9
4.1
1.7
3.7
3.8
2.2
A
a
13.9
3.9
16.3
4.1
48.4
12.5
3.8
48.8
St
a
1.52
0.13
1.36
0.13
0.72
1.75
0.12
0.65
NHV
21 019
16 843
19 598
16 708
7 793
20 216
17 031
7 563
m
m
81
19
70
19
11
68
22
10
Table 1C
Fuel analysis of coal and biomass used in the co-
firing trial tests (CFB-CE).
Parameter
Coal
Cereal waste
Coal
Cereal waste
Coal sludge
Coal
Cereal waste
Coal sludge
E
el
42
56
66
W
t
r
17.4
11.8
16.7
12.7
38
18.6
11.9
39
W
a
3.1
3.8
2.6
3.7
1.9
3.5
3.9
1.8
A
a
19.3
6.3
22.2
6.1
51
16.2
6.2
51.1
St
a
1.41
0.12
1.54
0.12
0.96
1.64
0.13
0.92
NHV
19 576
14 754
18 846
14 701
7 235
20 044
14 811
6 806
m
m
84
16
67
26
7
74
19
7
S. Tokarski et al. / Energy 92 (2015) 24
e32
26

firing tests in the fluidized bed boiler, the combustion of the fuel
mix started the day before testing. After each change in boiler load
to a mixture of a given type, the boiler was run for at least two
hours to obtain stable thermal parameters. The biomass boiler fed
two systems using the basic installation of biomass supply and the
installation of the modernized administration of the bed material.
Delivery systems for fuels (coal, coal sludge, and biomass) allow a
steady stream of fuel to be established, regardless of a change in
boiler load or a change to another fuel stream.
During the test, a series of changes in boiler ef
ficiency was
performed by varying the steady supply amount of coal, coal sludge
and limestone while maintaining the supply of biomass. This
regulation of the amount of fuel fed to the boiler reduced the boiler
load and increased the share of biomass fuel in the mixture. During
a series of tests at 60% load, the addition of coal sludge was halted.
Because of the need to meet the demand for heat when the tests
were conducted, the heat production on the exchanger resulted
from external weather conditions.
For a stable performance of the boiler during the tests of the co-
firing pulverized coal fired boiler, as in the case of the fluidized bed
boiler, the mixture of fuel was ignited on the day before the test.
After each change in boiler load, the boiler was run for at least two
hours to obtain stable thermal parameters.
To ensure the administration of a particular type of biomass in a
given time, each biomass was fed into the boiler by two systems
through the primary biomass feeding installation and a simpli
fied
installation. The share of biomass in the mixture was determined
by the coal and biomass weights averaged over the duration of the
tests. To obtain stable operating parameters in the pulverized boiler
during the combustion of only the biomass, the combustion of the
mixture of biomass was initiated on the night preceding the given
series. After each change in boiler load, the boiler was run for at
least two hours to obtain stable thermal parameters.
The biomass is fed to the boiler using a biomass feeding
installation, which allows any mixture of the three types of
biomass, i.e., two types of dry biomass (pellets of agricultural and/
or forestry biomass) and dried biomass in the form of chips.
Appropriate shares of different types of biomass in the mixture are
obtained by adjusting the steady stream of biomass in the form of
pellets with an appropriate ratio of agro and forest biomass.
The process was analyzed using measurement systems installed
on the plant. All resulting measurements and the analysis of the
composition of the samples are the average of the series of mea-
surements performed for a given boiler load and the composition of
the supplied fuel.
The energy ef
ficiency of the boiler including an uncertainty was
estimated regarding to proper procedures (according to standard
No. PN-EN 12952-15 Water-tube boilers and auxiliary installations.
Acceptance tests.). It is linked to a fractional uncertainty of indi-
vidual measurements.
3. Results and discussion
3.1. Process energy requirements for biomass co-
firing
The consumption of electrical energy to drive the principal
boiler devices during co-
firing that are associated with both coal
and biomass, which have different properties, depends partly on
the proportion of biomass in the mixture. For this reason, the dif-
ference in the consumption of energy for the needs of auxiliary
devices, as shown in
, does not exhibit an unambiguous
trend.
To determine the process requirements associated with the
particular fuels present in the mixture (that is, separately for the
coal fuel and biomass), an indirect method must be used. For this
purpose, the consumption of energy must be analyzed by boiler
device for the case of combustion of coal fuel alone (the reference
test). These results must be compared with the results of the tests
of biomass co-
firing using the proposed methodology described
below.
To determine the process energy consumption and the reduc-
tion in CO
2
emissions resulting from the production of electricity
when using biomass as a substitute for fossil fuel, three electricity
production scenarios were considered:
The reference configuration with a unit used for coal-only
combustion. The indicators relating to the operation of the
unit, the boiler and auxiliary devices in this case were taken as
reference (baseline) values.
Co-firing, in which a portion of the chemical energy of the fuel
supplied to the boiler comes from biomass.
ACC (alternative coal configuration) determines the indicators
relating to the operation of the unit based on data obtained from
the analysis of the above two con
figurations, assuming that the
chemical energy from the biomass is replaced by energy from
Table 2
Fuel analysis of coal and biomass used in the co-
firing trial tests.
Parameter
Coal
Coal
Brewer's spent grain
Coal
Brewer's spent grain
Test
PF-C
PF-HO
PF-SU
W
t
r
12.1
7.1
50.3
8.8
7.2
W
a
1.3
1.1
5.1
1.2
5.9
A
a
33.1
30.5
18.6
28.5
2.6
St
a
1.08
1.06
0.43
1.16
0.13
NHV
18 706
20 633
7 237
20 791
18 910
Table 3
Fuel analysis of biomass used in the trial tests (CFB-BM).
Parameter
Wood chips
Sun
flower husks
Wood chips
Sun
flower husks
E
el
40, 45, 30
50, 50opty
W
t
r
40.3
10.0
45.1
10.4
W
a
6.0
6.4
5.9
4.9
A
a
16.6
3.3
3.5
3.7
St
a
0.03
0.14
0.04
0.16
NHV
8 273
16 739
9 131
17 337
m
m
22
78
22
78
a
Test after optimization of its operation.
Table 4
Fuel analysis of biomass used in the trial tests (PF-BM).
Parameter
Wood chips
Wood pellets
Sun
flower husks
W
t
r
37.7
9.2
10.6
W
a
5.7
4.9
5.7
A
a
2.5
1.6
2.9
St
a
0.03
0.06
0.12
NHV
10 973
16 988
16 555
S. Tokarski et al. / Energy 92 (2015) 24
e32
27
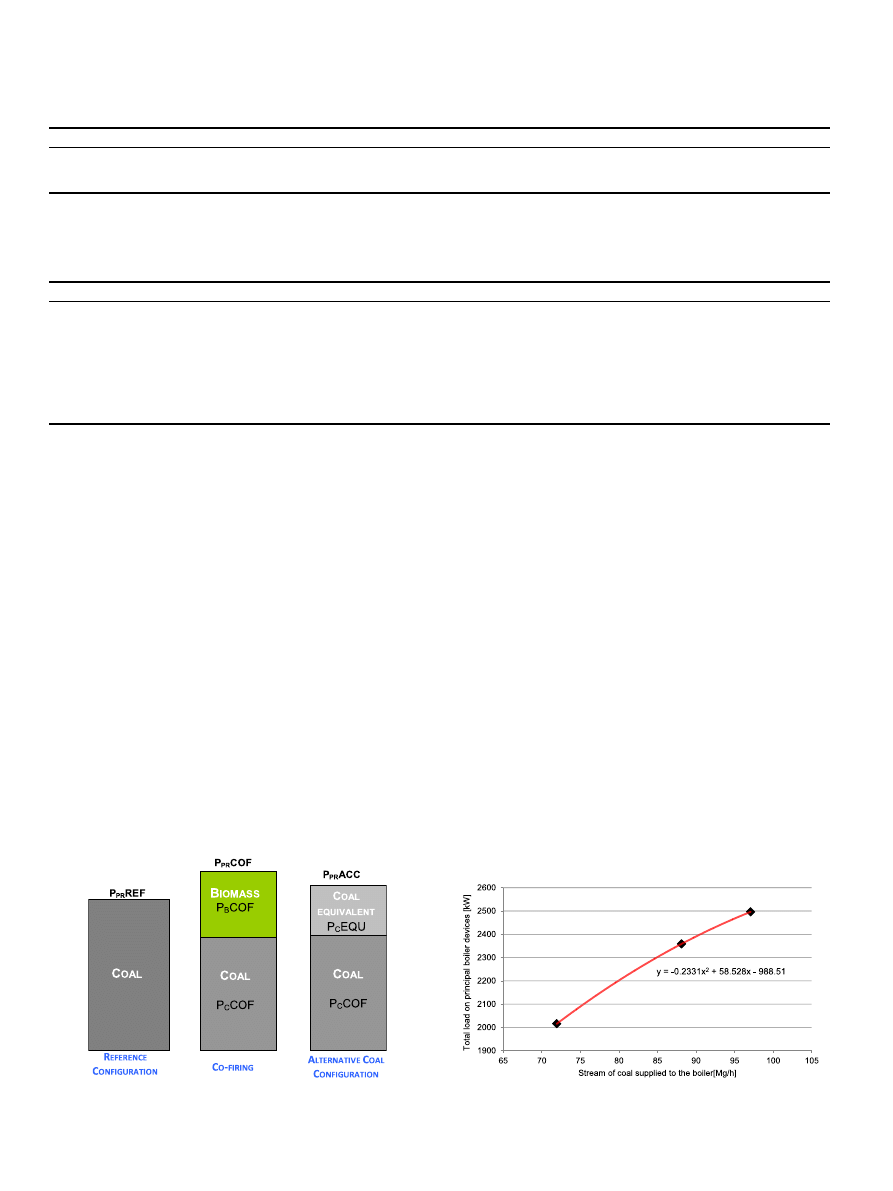
the coal (equivalent coal). If the coal used in the reference and
co-
firing scenarios have identical physicochemical parameters,
then the indicators obtained for the alternative coal con
figura-
tion should be identical.
For a clear interpretation of the de
fined component loads
associated with the conversion of the fuels used in the various
electricity production scenarios, refer to
Based on the measured results
covering the tests that
involved the combustion of coal fuel only (without biomass),
henceforth called the reference tests, a graph was plotted (
) for
the total load on the principal boiler devices (coal mills, mill ven-
tilators, primary and secondary air ventilators, waste gas ventilator)
depending on the rate of supply of coal to the boiler. This rela-
tionship is represented by three points for different boiler loads,
which were approximated by a second-degree polynomial. This
characteristic is a function of the fuel stream, despite the variability
in quality parameters. This relationship is supported by the fact that
the calori
fic value of a given type of coal is a linear function of the
total percentage content of moisture and ash (
). These pa-
rameters primarily affect the consumption of energy during the
grinding of coal and the quantity of waste gases produced; these
effects are re
flected in the consumption of energy by process de-
vices. The assumption of this dependence is also supported by the
basic characteristics of the operation of the individual process de-
vices. Such a relationship is valid within the range of analysis and
for the analyzed group of devices. Previously performed analyses
also con
firmed this assumption
.
Based on the data shown in
for the rate of supply of coal
fuel to the boiler in the mixture with biomass and the relationship
obtained (in the form of a second-degree polynomial), as shown in
, the load on boiler process devices which is attributable to the
coal fuel, P
C
COF, can be determined. The results of the analysis are
Table 5
Mass participation of biomass
m
m
, % in fuel mixture used in the trial tests.
Type of biomass
PF-BM1 20
PF-BM2 20
PF-BM2 16
PF-BM4 16
PF-BM2 12
PF-BM4 12
Wood chips
40
50
48
42
47
40
Wood pellets
40
30
30
28
30
30
Sun
flower husks
20
20
22
30
23
30
where:
PF-BM1 20 described in abbreviations: PF- Pulverized Fuel boiler, BM
e biomass mixture, 20 e characteristic electric power output, MW;
Table 6
Real electrical load on boiler process devices.
Parameter
PF-C 200
PF-C 180
PF-C 140
PF-HO 200
PF-HO 140
PF-SU 200
PF-SU 180
PF-SU 140
NHV
C
19 385
19 276
18 706
20 633
20 633
20 791
20 791
20 791
M
C
COF
97.1
88.1
71.9
89.6
65.0
87.6
79.8
62.6
Q
chC
COF
522.8
471.9
373.9
513.8
374.4
506.2
460.9
361.7
NHV
B
0
0
0
7 237
7 237
18 910
18 910
18 910
M
B
COF
0.0
0.0
0.0
4.9
1.9
4.4
2.9
2.7
Q
chB
COF
0.0
0.0
0.0
9.8
1.9
23.2
15.2
14.1
P
PR
REF
2496.4
2358.8
2015.7
P
PR
COF
2547.2
2016.5
2521.4
2424.1
2056.4
D
I
pr
T
50.9
0.8
25.1
65.3
40.7
where:
PF-HO 200 described in abbreviations: PF- Pulverized Fuel boiler- type od boiler, HO
e brewer's spent grain -type of fuel used in the trial test:, 200 e characteristic electric
power output, MW;
NHV
C
/NHV
B
is the net calori
fic value of the coal/biomass, kJ/kg;
M
C
COF/M
B
COF is the stream of coal/biomass supplied in the mixture for co-
firing, Mg/h;
Q
chC
COF/Q
chB
COF is the stream of chemical energy supplied in the coal/biomass, MW;
P
PR
REF is the total electrical load on process devices during coal combustion, kW;
P
PR
COF is the total electrical load on process devices during co-
firing of coal and biomass, kW; and
D
I
PR
T is the difference between the electrical loads on process devices during co-
firing and in the reference test, kW.
Fig. 1. Conceptual scheme for determining component loads on process devices; the
symbols are detailed in the description of the methodology.
Fig. 2. Load on boiler devices as a function of the rate of supply of mass of coal fuel (for
boiler type OP-650k).
S. Tokarski et al. / Energy 92 (2015) 24
e32
28

given in
; the unit load on process devices,
b
PC
COF, is
computed using
.
b
PC
COF
¼
P
C
COF
M
C
COF
(1)
where
P
C
COF is the component electrical load on process devices
attributable to coal in the co-
firing process, kW; M
C
COF is the
stream of coal supplied in the mixture for co-
firing, Mg/h; (
).
The load on the process devices attributable to biomass was
determined as the difference between the measured total load
during co-
firing, P
PR
COF, and the component load during co-
firing
attributable to coal, P
C
COF (as determined above). The results of
the calculations of the formulae below are shown in
.
P
B
COF
¼ P
PR
COF
P
C
COF
(2)
where
P
PR
COF is the total electrical load on process devices during co-
firing of coal and biomass, kW; P
C
COF is the component electrical
load on process devices attributable to coal in the co-
firing process,
kW
b
PB
COF
¼
P
B
COF
M
B
COF
(3)
where
b
PB
COF is the unit load on process devices attributable to the
biomass in the co-
firing process, kWh/Mg.
M
B
COF is the stream of biomass supplied in the mixture for co-
firing, Mg/h; (
).
As the load on the unit decreases, the unit electrical load on the
process devices attributable to biomass signi
ficantly increases
during the co-
firing process, and in both cases, a rising trend is
observed as the load on the unit is reduced. For the unit electrical
load attributable to coal during co-
firing, an increase is noted in the
electrical load when the load on the unit decreases, but in this case,
the change is small (
). This result indicates that a change in
the quantity of biomass supplied to the boiler, within the analyzed
range of loads, will cause signi
ficant differences in the quantity of
process energy required by the boiler.
3.2. Consumption of equivalent fuel
The purpose of this analysis is to illustrate the effects of
replacing coal with biomass by determining the quantity of
“equivalent coal” that could replace the stream of biomass during
co-
firing and to determine the process load for the alternative coal
scenario.
The equivalent quantity of conventional fuel that could replace
the stream of biomass can be found using Equation
:
M
C
EQU
¼
M
B
$NHV
B
NHV
C
(4)
where
M
B
COF is the stream of biomass supplied during co-
firing, Mg/h;
NHV
B
is the net calori
fic value of the biomass, kJ/kg; and
NHV
C
is the calori
fic value of coal during co-firing, kJ/kg.
The total quantity of coal fuel used during the operation of the
boiler with coal-only combustion under the alternative coal
con
figuration is given by
M
C
ACC
¼ M
C
COF
M
C
EQU
(5)
where
M
C
COF is the stream of coal supplied in the mixture for co-
firing,
Mg/h; M
C
EQU is the stream of coal which could replace the biomass
(equivalent coal), Mg/h.
The electrical load on process devices in the alternative coal
scenario is found from the relationship shown in
The results of the calculations are given in
.
To assess the effect of the type (quality) of the fuel on the
electricity consumed to drive the principal boiler devices, re-
lationships were found based on the differences arising between
the different boiler operating con
figurations.
Fig. 3. Variation in calori
fic value of coal as a function of total content of moisture and
ash.
Table 7
Load on boiler process devices attributable to coal fuel in the co-
firing process.
Parameter
PF-HO 200
PF-HO 140
PF-SU 200
PF-SU 180
PF-SU 140
P
C
COF
2383.3
1830.1
2349.0
2196.5
1761.8
b
PC
COF
26.6
28.2
26.8
27.5
28.1
where
P
C
COF is the component electrical load on process devices attributable to coal in the
co-
firing process, kW; and
b
PC
COF is the unit electrical load on process devices attributable to coal in the co-
firing process, kWh/Mg.
Table 8
Component load on boiler process devices attributable to the biomass in the co-
firing process.
Parameter
PF-HO 200
PF-HO 140
PF-SU 200
PF-SU 180
PF-SU 140
P
B
COF
163.9
186.4
172.4
227.6
294.6
В
PB
COF
33.6
98.1
39.0
78.6
110.0
where:
P
B
COF is the component load on process devices attributable to the biomass in the
co-
firing process, kW; and
b
PB
COF is the unit load on process devices attributable to the biomass in the co-
firing
process, kWh/Mg.
Table 9
Calculations of the equivalent coal stream and process electrical loads in the alter-
native coal con
figuration.
Parameter
PF-HO 200
PF-HO 140
PF-SU 200
PF-SU 180
PF-SU 140
M
C
EQU
1.71
0.67
4.02
2.63
2.44
M
C
ACC
91.35
65.67
91.66
82.44
65.06
P
PR
ACC
2411.2
1848.8
2416.1
2250.9
1831.8
where
M
C
EQU is the stream of coal which could replace the biomass (equivalent coal), Mg/
h;
M
C
ACC is the total stream of coal in the alternative coal scenario, Mg/h and
P
PR
ACC is the load on process devices in the alternative coal scenario, kW.
S. Tokarski et al. / Energy 92 (2015) 24
e32
29

The component load on process devices attributable to the
“preparation” of the equivalent coal to replace the biomass was
found from the following equation:
P
C
EQU
¼ P
PR
ACC
P
C
COF
(6)
where
P
PR
ACC is the load on process devices in the alternative coal
scenario, kW.
P
C
COF is the component electrical load on process devices
attributable to coal in the co-
firing process, kW.
The indicator of unit electrical load on the process devices per
unit mass of equivalent coal was determined from the following
equation:
b
PC
EQU
¼
P
C
EQU
M
C
EQU
(7)
P
C
EQU is the component process electrical load attributable to
the coal equivalent to biomass, kW; M
C
EQU is the stream of coal
which could replace the biomass (equivalent coal), Mg/h; The re-
sults of the calculations of the indicators for the coal equivalent to
biomass are given in
The values obtained for the indices of process electricity con-
sumption per unit mass of equivalent coal are signi
ficantly lower
than those obtained for biomass, but these values are also lower
than the values obtained for the coal combusted during co-
firing.
The differences between the indicators found for the co-
fired coal
and for the equivalent coal result from the idle load on the drives of
the process devices, which is attributable chie
fly to work required
during the grinding of coal (co-
firing). This contribution to the in-
dicators for co-
fired coal decreases as the load on the unit
decreases.
3.3. Impact of process electricity consumption on the ef
ficiency of
the boiler and of electricity production
The principal indicators that determine the effectiveness of the
co-
firing process and can be evaluated are the gross energy effi-
ciency of the boiler and, in assessing the effect of the consumption
of energy for driving the auxiliary devices, the net ef
ficiency.
Because the type of fuel combusted did not affect the obtained
steam parameters (it was maintained on the same level) and
thereby mechanical and thermal ef
ficiency of the turbine, and thus
does not in
fluence the efficiency of electricity production, the
effectiveness of the conversion of the chemical energy of the
biomass was evaluated only for the boiler. This conversion ef
fi-
ciency was combined with a determination of the effect of the
biomass on the consumption of electricity to drive the boiler
devices.
The effect of the consumption of electricity by the principal
boiler devices on the (net) energy ef
ficiency of the boiler is given by
the following:
h
BN
¼ h
BG
P
mech
Q
chF
$100
(8)
Q
chF
is the stream of chemical energy of the fuel mixture sup-
plied for combustion [MW]; and
P
mech
is the mechanical energy required to drive the process
devices [MW].
Table 10
Comparison of loads between different operating con
figurations.
Parameter
PF-HO 200
PF-HO 140
PF-SU 200
PF-SU 180
PF-SU 140
P
C
EQU
27.9
18.7
67.1
54.4
70.0
В
PC
EQU
16.3
28.0
16.7
20.7
28.7
where
P
C
EQU is the component process electrical load attributable to the coal equivalent to
biomass, kW; and
b
PC
EQU is the unit electrical load on process devices attributable to the equivalent
coal in the equivalent coal scenario, kWh/Mg.
Table 11
Values obtained for the ef
ficiency of electricity production.
Parameter
PF-C 200
PF-C 180
PF-C 140
PF-HO 200
PF-HO 140
PF-SU 200
PF-SU 180
PF-SU 140
h
BG
91.78
91.94
91.75
91.96
91.20
91.73
92.10
91.07
h
BN
91.26
91.39
91.16
91.43
90.60
91.21
91.54
90.47
b
P el RES
e
e
43.7
101.8
19.6
39.6
56.2
where
h
bG
is the gross energy ef
ficiency of the boiler, %;
h
bN
is the net energy ef
ficiency of the boiler, %; and
b
P el RES
is the indicator of the unit load for the production of electricity from renewable energy sources, kW/MW
RES
.
Table 12
Values obtained for the ef
ficiency of the boiler during testing.
Parameter
CFB-C 66
CFB-C 56
CFB-C 42
CFB-SU 66
CFB-SU 56
CFB-SU 42
CFB-CE 66
CFB-CE 56
CFB-CE 42
b
PC
COF
e
e
e
31.7
36.1
54.9
31.7
32.6
50.6
b
PC
EQU
e
e
e
21.4
13.7
2.9
20.8
24.9
4.2
b
PB
COF
e
e
e
21.6
5.4
14.3
22.8
5.7
13.6
h
bG
92.08
92.08
92.58
91.63
91.35
91.85
91.62
91.88
92.17
h
bN
91.37
91.31
91.65
90.91
90.60
90.93
90.90
91.10
91.23
b
P el RES
e
e
e
13.8
3.0
8.9
16.5
4.0
9.8
where
b
PC
COF is the unit electrical load on process devices attributable to coal in the co-
firing process, kWh/Mg.
b
PC
EQU is the unit electrical load on process devices attributable to the equivalent coal in the equivalent coal scenario, kW/Mg;
b
PB
COF is the unit load on process devices attributable to the biomass in the co-
firing process, kWh/Mg;
h
bG
is the gross energy ef
ficiency of the boiler,%;
h
bN
is the net energy ef
ficiency of the boiler, %; and
b
P el RES
is the indicator of the unit load for the production of electricity from renewable energy sources kW/MW
RES
.
S. Tokarski et al. / Energy 92 (2015) 24
e32
30

The indicator of the quantity of process energy used for the
production of electricity from renewable sources is the indicator of
the unit electrical load on the process devices when electricity is
produced from such sources and is computed from the following
equation:
b
Pel RES
¼
P
B
COF
E
el RES
(9)
where
P
B
COF is the component electrical load on process devices
attributable to biomass in the co-
firing process, kW; E
el RES
is the
production of electricity from renewable energy sources, MW
RES
.
Calculation results are shown in
3.4. Indicator values obtained for co-
firing in a fluidized bed boiler
and for biomass combustion in a dedicated system
The table below contains the
final results calculated in accor-
dance with the proposed procedure for assigning the energy
consumed to drive the principal boiler devices during the process of
co-
firing of coal fuel and biomass.
For units burning biomass only, the results are given for the
determined energy ef
ficiency of the boiler and for indicators of unit
consumption of process energy for the conversion of biomass.
contains the results of an analysis performed for a
fluidized bed boiler in which coal fuel (coal together with coal
slurry) is co-
fired with sunflower husks and cereal waste at three
different values for the load on the unit (66 MW, 56 MW and
42 MW).
At the time of the test measurements, the unit was being used
for electricity and heat cogeneration, which caused a reduction in
electrical output.
contains the results of an analysis performed for a
fluidized bed boiler used for the combustion of BM (biomass) only.
The biomass was a mixture of wood chips and sun
flower husks in a
ratio of 78:22. Measurements were taken for characteristic levels of
load on the unit: 30 MW, 40 MW, 45 MW and 50 MW. In addition,
indicators were calculated for the unit following the optimization
of its operation
eCFB-BM 50 opt.
contains the results of calculations for a pulverized
fuel boiler used for the combustion of biomass only. The biomass
was a mixture of wood chips and sun
flower husk pellets in various
proportions for different biomass types. Measurements were
taken for characteristic loads on the unit: 20 MW, 16 MW and
12 MW.
4. Conclusions
The indicators determined according to this methodology
enable a comparison and unequivocal assessment of the effec-
tiveness of the conversion of the chemical energy of biomass to
electrical energy. These indicators may be used as a basis for further
energetic, environmental and
financial analyses.
From the results of the calculations performed for technologies
involving the combustion or co-
firing of biomass in pulverized fuel
and
fluidized bed boilers, the lowest process energy consumption
for the production of electricity from renewable energy sources is
obtained in the case of the co-
firing of biomass in a fluidized bed
boiler based on the data obtained in tests using different techno-
logical con
figurations. In the co-firing of biomass in a fluidized bed
boiler case, the energy ef
ficiency of the boiler is close to that ob-
tained by a
fluidized bed boiler dedicated to the combustion of
biomass only. The highest indicators of process energy required per
unit of energy produced are recorded for the technology of co-
firing
in a pulverized fuel boiler. This, however, is the technology for
which the greatest net energy ef
ficiency of the boiler was obtained
out of all of the technologies analysed. Another advantage of this
technology is the possibility of obtaining the greatest ef
ficiency of
electricity production because of the thermal parameters of the
steam supplied to the turbine.
In spite of their superior indicators, co-
firing technologies are
subject to limitations in terms of the maximum quantity of biomass
that can be added. Therefore, to produce the identical quantity of
renewable electricity as in a dedicated unit, the co-
firing process
has to be performed in several units.
Table 13
Values obtained for the ef
ficiency of the boiler during testing.
Parameter
CFB-BM 30
CFB-BM 40
CFB-BM 45
CFB-BM 50
CFB-BM 50 opt
h
bG
90.61
90.30
90.85
91.76
92.18
h
bN
89.31
89.18
89.82
90.76
91.26
b
PB
DED
33.5
28.6
26.6
27.6
25.6
b
P el RES
37.3
30.9
28.3
26.9
24.8
where
h
bG
is the gross energy ef
ficiency of the boiler,%;
h
bN
is the net energy ef
ficiency of the boiler, %;
b
PB
DED is the unit load on process devices attributable in the dedicated system, kWh/Mg;
b
P el RES
is the indicator of the unit load for the production of electricity from renewable energy sources kW/MW
RES
.
Table 14
Values obtained for the ef
ficiency of the boiler during testing.
Parameter
PF-BM1 20
PF-BM2 20
PF-BM2 16
PF-BM4 16
PF-BM2 12
PF-BM4 12
h
bG
89.69
89.25
88.97
88.95
88.81
88.72
h
bN
88.8
88.3
88.0
87.8
87.7
87.6
b
PB
DED
37.7
42.4
39.7
51.3
48.4
50.7
b
P el RES
34.4
38.6
38.3
46.7
52.0
52.9
where
h
bG
is the gross energy ef
ficiency of the boiler,%;
h
bN
is the net energy ef
ficiency of the boiler, %;
b
PB
DED is the unit load on process devices attributable in the dedicated system, kWh/Mg;
b
P el RES
is the indicator of the unit load for the production of electricity from renewable energy sources kW/MW
RES
.
S. Tokarski et al. / Energy 92 (2015) 24
e32
31

References
[1] CO
2
emissions from fuel combustion. Highlights. Paris, France: IEA Statistics.
International Energy Agency; 2011. Available from:
[last
accessed 17.04.12].
[2]
otki A, Tatarczuk A, Wie˛cław-Solny L, Stec M, Sobolewski A, Tokarski S. CO
.
[3]
˛cław-Solny L, Krotki A, Scia˛_zko M, Tokarski S. Pilot
capture process using amine scrubbing at the
Jaworzno II Power Plant in Poland. Fuel 2015;151:50
e6
.
[4]
łod K, Janusz M, Kazalski K, Zuwała J. Pressurized oxy-fuel com-
bustion: a study of selected parameters. Energy Fuels 15 November
2012;26(11):6492
e500
.
[5]
ła J, Głod K, Iluk A. Oxy-fuel combustion of selected
solid fuels under atmospheric and elevated pressures. Energy December
2013;62(1):105
e12
[6]
nski M, Zuwała J, Robak J. Coupled torrefaction e pelletization process
firing in the aspects of techno-economic issues. Energy Policy J
[7]
˛bik A, Szargut J. Podstawy gospodarki energetycznej. Gliwice: Silesian
University of Technology Script; 1996 [in Polish]
[8] Draft Act on Renewable Sources of Energy. presented to the Polish parliament
(source:
http://legislacja.rcl.gov.pl/docs//2/19349/212691/212692/
).
[9]
ła J. Czy wspołspalanie biomasy mo_ze stanowic droge˛ do “Zer-
” energetyki? [Can biomass co-firing be a road to zero-emission
[10]
Polish energy law. 1997 (as amended), in Polish
[11]
ła J. An evaluation of biomass co-firing in Europe. Biomass
e9
.
[12]
ła J, Scia˛_zko M. Full e scale co-firing trial tests of sawdust and bio-waste
e fired 230 t/h steam boiler. Biomass Bioenergy 2010;34:
[13]
ła J. Life cycle approach for energy and environmental analysis of
firing in CHP plant with backpressure turbine. J Clean
[14]
e404
[15]
fitting existing coal fired power plants to co-
firing with biomass: carbon footprint and emergy approach. J Clean Prod
2014:1
[16]
Sz Fogarasi. Calin-Cristian Cormos: technico-economic assessment of coal and
sawdust co-
firing power generation with CO
.
[17]
firing biomass with coal in power plants e a
techno-economic assessment. Biomass Bioenergy 2009;33:283
[18]
łod K, Zuwała J, Hrycko P. Report on energy tests in selected units of Tauron
.
[19]
ła J. Ocena efektow energetycznych and ekologicznych wspołspalania
firing of fossil fuels and biomass in
cogeneration technologies]. Katowice: We
˛glogryf Publishers, Central Mining
Institute; 2013 (ISSN 1230-2643, ISBN 978-83-61126-57-7), in Polish
S. Tokarski et al. / Energy 92 (2015) 24
e32
32
Document Outline
- Comparative assessment of the energy effects of biomass combustion and co-firing in selected technologies
- 1. Introduction
- 2. Experimental
- 3. Results and discussion
- 3.1. Process energy requirements for biomass co-firing
- 3.2. Consumption of equivalent fuel
- 3.3. Impact of process electricity consumption on the efficiency of the boiler and of electricity production
- 3.4. Indicator values obtained for co-firing in a fluidized bed boiler and for biomass combustion in a dedicated system
- 4. Conclusions
- References
Wyszukiwarka
Podobne podstrony:
Assessment of Borderline Pathology Using the Inventory of Interpersonal Problems Circumplex Scales (
An analysis of the energy efficiency of winter rapeseed biomass under
Walterowicz, Łukasz A comparative analysis of the effects of teaching writing in a foreign language
Wigner The Unreasonable Effectiveness of Mathematics in the Natural Sciences
The energy consumption and economic costs of different vehicles used in transporting woodchips Włoch
Fricke Visual assessments of the surface diusion properties of concert halls
Sandra Marco Colino Vertical Agreements and Competition Law, A Comparative Study of the EU and US R
A randomized, controlled comparative study of the wrinkle reduction benefits of a cosmet
Intoxication Anosognosia The Spellbinding Effect of Psychiatric Drugs Peter R Breggin, MD
Comparative Analyses of the Bacterial Microbiota of the Human Nostril and Oropharynx
The Two Effects of the Gospel
U S Government Assessment of the Syrian Government s Use of Chemical Weapons on August 21 2013
Assessment of the human fecal microbiota I Measurement and reproducibility of selected enzymatic act
A comparative study of inverter and line side filtering schemes in the dynamic voltage restorer
(IV)Interexaminer reliability of low back pain assessment using the McKenzie method
Evaluation of biomass quality of selected woody species depending on the method of soil enrichment a
Functional and Computational Assessment of Missense Variants in the Ataxia Telangiectasia Mutated (A
Psychological Therapies 4 Personal Assessment of the Counsellor
A Permanent Solution to Internal Displacement An Assessment of the Van Action Plan for IDPs
więcej podobnych podstron