
CWB-1/2008
7
B.B. Das
1
, D.N. Singh
2
, S.P. Pandey
1
1
Central R&D-Cement business, Grasim Industries Ltd., Khor, India
2
Dept. of Civil Engineering, Indian Institute of Technology, Bombay, India
Doświadczalne sprawdzenie pewnych zabezpieczeń projektowych
dotyczących trwałości betonu w nawiązaniu do indyjskich zaleceń
praktycznych
Experimental revalidation of certain durability design provisions for
concrete with reference to the indian code of practice
Part 4. Use in geothermal wells
1. Introduction
Achieving durability of concrete structures is a multifaceted phe-
nomenon in which the material design to match the environmental
exposure conditions is of prime importance. Volumes have been
written on this subject, some glimpses of which can be had in
(1-4). Codes of practices for plain and reinforced concrete have
also been drawn up in various countries by defi ning the exposure
conditions in terms of their degree of severity on one hand, and
prescribing the corresponding concreting parameters to withstand
such environments on the other.
The bases of classifying the exposure conditions are quite different
in different codes. The nature and mechanism of degradation,
transport of aggressive ions in aqueous media, distance from the
marine environment, microclimate around the concrete, etc. have
formed the bases to defi ne the severity of exposure conditions.
Further, the number of classes and sub-classes vary from one
code to another (5-11).
In order to combat the severity of the above exposure conditions the
concrete mix design parameters have generally been prescribed in
terms of minimum cement content, maximum water-cement ratio
and minimum cover thickness, although the certainty of achieving
the desired performance of concrete in aggressive environments
has been questioned in (12). The classifi cation of environmental
exposure conditions and the corresponding material design para-
meters as provided in the Indian Code of practice are reproduced
in Table 1 (a&b) (8). The recommendation includes the potential
use of blended cements in concrete as well as the direct use of
blending materials in concrete for appropriate exposure conditions.
The benefi ts of using such materials, and more specifi cally of fl y
ash to produce durable concrete have been extensively dealt
with in (13).
Because of the widely adopted practice of specifying the concreting
parameters in terms of minimum cement/cementitious materials
1. Wprowadzenie
Zapewnienie trwałości konstrukcji betonowych należy do złożone-
go zagadnienia, w którym projektowanie materiałowe uwzględnia-
jące warunki ekspozycji ma podstawowe znaczenie. Napisano na
ten temat całe tomy, których skrótowe omówienie można znaleźć
w publikacjach (1-4). Zalecenia praktyczne dla betonu i żelbetu
zostały również opracowane w różnych krajach, które defi niują
warunki ekspozycji w stopniach agresywności, z jednej strony
i zalecają odpowiednie właściwości betonu, który byłby odporny
na te warunki, z drugiej.
Podstawy do klasyfi kacji warunków ekspozycji są bardzo różne
w różnych zaleceniach. Rodzaj i mechanizm zniszczenia, transport
agresywnych jonów w wodnym środowisku, odległość od otoczenia
morskiego, mikroklimat w otoczeniu betonu etc. stanowią podstawę
defi niowania agresywności warunków ekspozycji. Dalej ilość klas
i ich podział na podklasy zmienia się w tych zaleceniach (5-11).
W celu uodpornienia betonu na agresywne warunki ekspozycji
wprowadza się parametry projektowe w formie minimalnej zawar-
tości cementu maksymalnego wskaźnika wodno-cementowego
i minimalnej grubości warstwy ochronnej, aczkolwiek pewność
osiągnięcia pożądanego zachowania betonu w agresywnym śro-
dowisku jest kwestionowana (12). Klasyfi kacje warunków ekspo-
zycji i odpowiadające im parametry projektowania materiałowego
podane w indyjskich zaleceniach praktycznych są podane w tablicy
1 (a i b) (8). Zalecenia obejmują potencjalne zastosowanie ce-
mentów z dodatkami w betonie lub bezpośrednie wykorzystanie
dodatków mineralnych w betonie dla odpowiednich ekspozycji.
Korzyści ze stosowania takich materiałów, a szczególnie popiołów
lotnych w celu otrzymania trwałego betonu zostały omówione wy-
czerpująco w pracy (13). W związku z szeroko przyjętą praktyką
precyzowania właściwości betonu w formie minimalnej zawartości
cementu (spoiwa i maksymalnego wskaźnika wodno-spoiwowego
w celu zapewnienia odporności w różnych warunkach ekspozycji i
ich opisanej zmienności, o czym wspomniano wcześniej, podjęte

8
CWB-1/2008
zostały doświadczenia w celu zbadania właściwości betonu posia-
dającego minimalną zawartość cementu i maksymalny wskaźnik
wodno-cementowy, jak to przewidziano w normie 456:2000 dla
trzech warunków ekspozycji (umiarkowanej, ostrej i ekstremalnej)
przy wykorzystaniu cementu portlandzkiego OPC i przemysłowego
cementu pucolanowego z dodatkiem popiołu (PPC). Szczegóły
doświadczalne i właściwości świeżego i stwardniałego betonu
opisano w tym artykule w odniesieniu do ważnych warunków za-
wartych w zaleceniach praktycznych. Otrzymane wyniki wykorzy-
stano także w celu sprawdzenia czy wyniki otrzymane dla betonu
otrzymanego z OPC mogą objąć także beton z PPC.
2. Charakterystyka materiałów
2.1. Cementy
Skład chemiczny próbek OPC i PPC stosowanych w tych bada-
niach jest podany w tablicy 2. Oba elementy są otrzymane z tego
samego klinkieru, a PPC zawiera około 20% popiołu lotnego.
Zawartość alkaliów w obu cementach była na podobnym pozio-
content and maximum water-cementitious material ratio to with-
stand various exposure conditions and their reported fallibility as
mentioned earlier, an experimental investigation was carried out
to check the characteristics of concrete made with the minimum
cement content and maximum water-cement ratio as provided in IS
456:2000 for three exposure conditions (mild, severe and extreme),
using Ordinary Portland Cement (OPC) and factory-produced fl y
ash-based Portland Pozzolana Cement (PPC). The experimental
details and the properties of the fresh and hardened concrete are
presented in this paper with reference to relevant provisions in
the code of practices. The data generated have also been used to
check if the provisions made on the basis of OPC based concrete
could be extended to PPC-based concrete as well.
2. Characterisation of materials
2.1. Cements
The chemical compositions of OPC and PPC samples used in
this study are given in Table 2. Both the cements are of the same
Tablica 1 (a) / Table 1 (a)
WARUNKI EKSPOZYCJI
ENVIRONMENTAL EXPOSURE CONDITIONS
Sl. No.
Środowisko
Environmental
Warunki ekspozycji
Exposure Conditions
i
Łagodne
Mild
Powierzchnia betonu zabezpieczona przed pogodowymi lub korozyjnymi warunkami, z wyjątkiem warun-
ków nadbrzeżnych
Concrete surface protected against weather or aggressive conditions, except those situated in coastal area
ii
Umiarkowane
Moderate
Poweirzchnie betonu osłonięte od silnych deszczów i od mrozu gdy są mokre
Concrete surfaces sheltered from severe rain or freezing whilst wet
Beton wystawiony na skraplanie wilgoci i deszcz
Concrete exposed to condensation and rain
Beton w sposób ciągły pod wodą
Concrete continuously under water
Beton w kontakcie lub częściowo pogrążony w nieagresywnym gruncie lub z wodą gruntową
Concrete in contact or buried under non-aggressive soil/ground water
Powierzchnie betonu osłonięte od powietrza nasyconego solą w obszarach nadbrzeżnych
Concrete surfaces sheltered from saturated salt air in coastal area
iii
Agresywne
Severe
Powierzchnie betonu wystawione na gwałtowne ulewy, sukcesywnie nawilżane i suszone lub zamrażane w
stanie wilgotnym względnie w agresywnym środowisku
Concrete surfaces exposed to severe rain, alternate wetting and drying or occasional freezing whilst wet or
severe condition
Beton całkowicie zanurzony w wodzie morskiej
Concrete completely immersed in sea water
Beton wystawiony na warunki nadbrzeżne
Concrete exposed to coastal environment
iv
Bardzo agresywne
Very severe
Powierzchnie betonu wystawione na strumienie wody morskiej, korozyjne dymy lub na duży mróz w stanie
wilgotnym
Concrete surfaces exposed to sea water spray, corrosive fumes or severe freezing conditions whilst wet
Beton w kontakcie lub pogrążony w agresywnych wodach gruntowych
Concrete in contact with or buried under aggressive sub-soil/ ground water
v
Ekstremalne
Extreme
Powierzchnie elementów w strefi e przypływów
Surface of members in tidal zone
Elementy w bezpośredniej styczności z ciekłymi lub stałymi chemikaliami agresywnymi
Members in direct contact with liquid/solid aggressive chemicals

CWB-1/2008
9
mie, a wahania zawartości siarczanów pozostawały zgodnie z ich
powierzchnią właściwą. Gęstość cementów zmierzono za pomocą
piknometru Quantachrome, a otrzymane wyniki pozostawały na
spodziewanym poziomie.
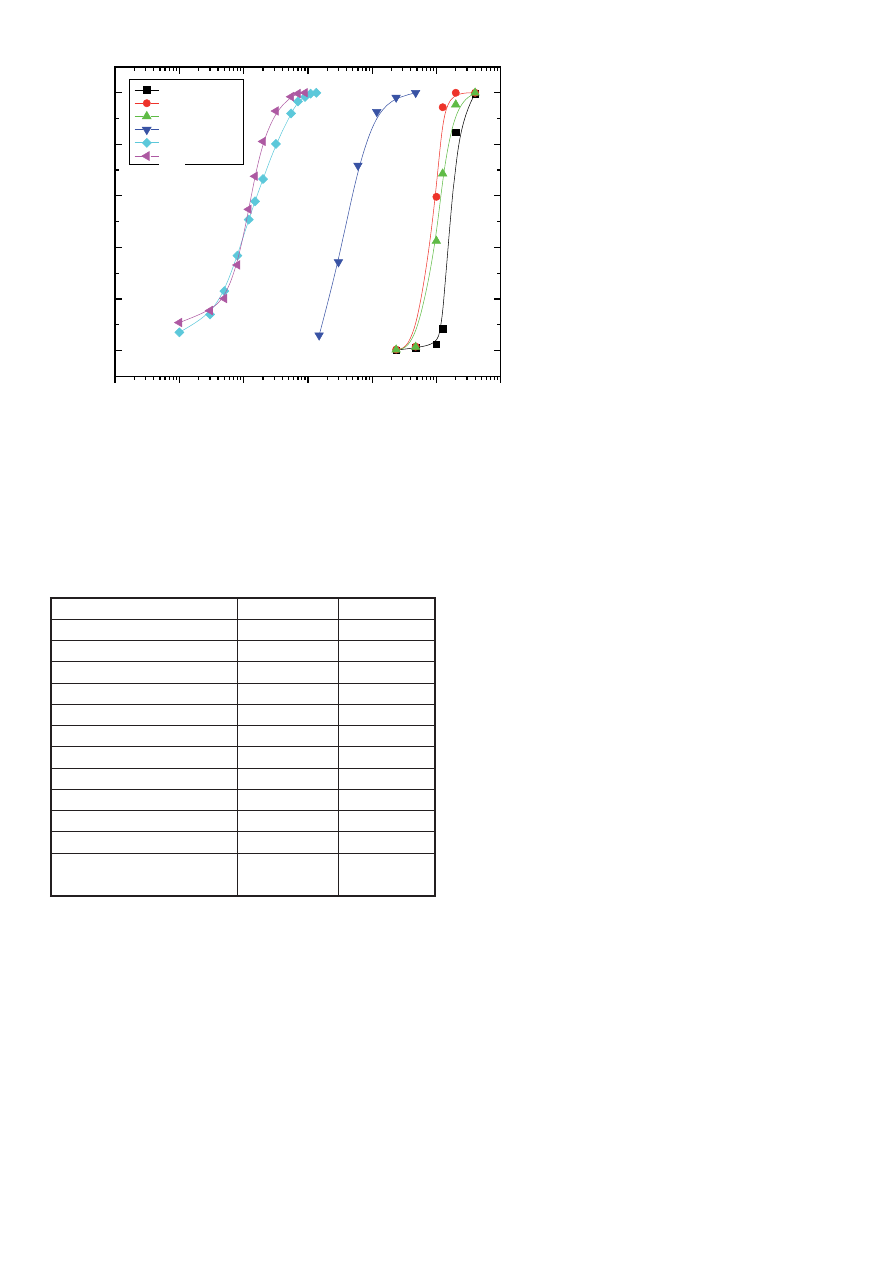
Skład ziarnowy cementu oznaczono za pomocą urządzenia la-
serowego (CILAS model 520) i otrzymane krzywe pokazano na
rysunku 1.
Wytrzymałość na ściskanie cementów oznaczono na kostkach za-
prawy 1:3 zgodnie z indyjską normą i zebrano w tablicy 3. Badane
zgodnie z normą ASTM spełniały odpowiednio warunki ASTM–150
rodzaj I i ASTM C-595 rodzaj P (14 i 15).
2.2. Kruszywo
Piasek rzeczny stosowany jako kruszywo drobne w tych doświad-
czeniach wykazywał punkt piaskowy 1,99 i z tego względu należał
do III zakresu według normy indyjskiej (16).
clinker stock and the PPC had about 20 per cent fl y ash. The
alkali contents of both the cements were of the similar range and
the variation in the sulphate content was in agreement with their
specifi c surface areas. The density of the cements was measured
with the help of an ultra-pycnometer of Quantachrome make and
the values were obtained in the expected range.
The particle size distribution of the cements was determined with
the help of a Laser Granulometer (CILAS Model 920) and the
patterns obtained are shown in Figure 1.
The compressive strengths of both the cements in 1:3 mortar
cubes as tested by the Indian Standard procedure are shown
in Table 3. When tested as per ASTM standards, the cements
complied with ASTM C-150 Type I and ASTM C-595 Type P (14
& 15) respectively.
Tablica 1 (b) / Table 1 (b)
Minimalna zawartość cementu, maksymalny wskaźnik wodno-cementowy minimalna klasa betonu przeznaczona do różnych warunków
ekspozycji z kruszywem o wymiarach nie przekraczających 20 mm
Minimum Cement Content, Maximum Water-Cement Ratio and Minimum Grade of Concrete for Different Exposures with Normal Weight
Aggregates of 20 mm Nominal Maximum Size
Sl.
No.
Środowisko
Exposure
Zwykły beton
Plain Concrete
Żelbet
Reinforced Concrete
Minimalna
zawartość
cementu kg/
m3
Minimum
Cement Content
kg/m
3
Maksymalny
wskaźnik w/c
Maximum Free
Water-Cement
Ratio
Minimalna
masa betonu
Minimum Grade
of Concrete
Minimalna
zawartość
cementu
Minimum
Cement
Content kg/m
3
Maksymalny
wskaźnik w/c
Maximum Free
Water-Cement
Ratio
Minimalna klasa
betonu
Minimum Grade
of Concrete
(1)
(2)
(3)
(4)
(5)
(6)
(7)
(8)
i
Łagodne
Mild
220
0.60
--
300
0.55
M 20
ii
Umiarkowane
Moderate
240
0.60
M 15
300
0.50
M 25
iii
Agresywne
Severe
250
0.50
M 20
320
0.45
M 30
iv
Bardzo agresywne
Very severe
260
0.45
M 20
340
0.45
M 35
v
Ekstremalne
Extreme
280
0.40
M 25
360
0.40
M 40
UWAGI:
1. Zawartość cementu podana w tej tablicy jest niezależna od klasy cementu i obejmuje dodatki zastępujące cement. Takie dodatki jak popiół lotny lub
mielony granulowany żużel wielkopiecowy mogą być uwzględnione w składzie betonu w stosunku do zawartości cementu i wskaźnika wodno-cemen-
towego, gdy ich przydatność jest ustalona i tak długo jak maksymalna ilość wzięta pod uwagę nie przekracza granicznej zawartości pucolany lub żużla
odpowiednio podanych w normie 1489 (część I) i 455.
2. Minimalna klasa zwykłego betonu w przypadku łagodnej ekspozycji nie jest podana.
NOTES:
1. Cement content prescribed in this table is irrespective of the grades of cement and it is inclusive of additions of cement replacement materials. The
additions such as fl y ash or ground granulated blast furnace slag may be taken into account in the concrete composition with respect to the cement
content and water-cement ratio if the suitability is established and as long as the maximum amounts taken into account do not exceed the limit of
pozzolona and slag specifi ed in IS 1489 (Part I) and IS 455 respectively.
2. Minimum grade for plain concrete under mild exposure condition is not specifi ed.
10
CWB-1/2008
W normalnych warunkach taki piasek nie powinien być zalecany
do stosowania w produkcji betonu. Jednak w niniejszych doświad-
czeniach ten piasek używano w celu wyjaśnienia jego wpływu na
właściwości betonu. Grube kruszywo stosowane w tych badaniach
miało maksymalny wymiar 20 mm. Rozkład ziarnowy drobnego
i grubego kruszywa pokazano na rysunku 1. Wolna wilgotność
powierzchniowa i zawartość trakcji pylastych w drobnym kruszywie
wynosiła odpowiednio 0,55% i 0,57%. Adsorpcja wody na drobnym
i grubym kruszywie wynosiła odpowiednio 1,21% i 0,26%. Gęstość
drobnego kruszywa, a także mniejszego od 10 mm i 20 mm była
odpowiednio 2,21, 2,99 i 2,77.
2.2. Aggregates
The river sand used as fi ne aggregates in this study
exhibited a fi neness modulus of 1.99 and, thus, be-
longed to zone-III as per the Indian Standard Speci-
fi cation (16).
Under normal circumstances such sand is not prefer-
red to be used in concrete making. However, in the
present investigation, this sand was used to study its
impact on concrete properties. The coarse aggregate
used in this study had maximum size of 20 mm. The
particle size distribution of fi ne and coarse aggregates
is shown in Fig.1. The free surface moisture and the
silt content of the fi ne aggregates were 0.55 per cent
and 0.57 per cent respectively. The water absorption
of the fi ne and coarse aggregates was determined
to be 1.21 per cent and 0.26 per cent respectively.
The specifi c gravity values of fi ne aggregates, 10 mm
aggregates and 20 mm aggregates were 2.71, 2.99
and 2.77 respectively.
The details of the concrete mix proportions based
on OPC and PPC for the three exposure conditions are given in
Table 4.
3. Testing methodology
Cubes of size 150 mm, beams of size 100 x 100 x 500 mm and
cylinders of size 100 mm diameter and 300 mm height were cast
for three grades of concrete: M20, M30 and M40, designated as
C1, C2, and C3 for OPC concretes and F1, F2 and F3 for the
PPC concretes respectively. For the sake of uniformity of the
concrete, mixing was done in a rotary mixer for 2 minutes. The
desired compaction of the concrete was achieved with the help
of a table vibrator. These samples were stored in a humidity
chamber (at 95
± 5% relative humidity and 27 ± 2°C). After 24 h
of storage, the concrete specimens were demoulded and stored
in a submerged condition in an automatic temperature controlled
curing tank (temperature of the water maintained at 27
±2°C).
Six curing periods (1,3,7,28,56 and 90 day) were chosen for this
study. At the end of each curing period, samples were tested in an
automatic compression testing machine (ACTM, AIMIL India) for
their compressive (f
ck
), fl exural (f
cr
) and split tensile (f
ct
) strength.
Modulus of elasticity of concrete was determined by measuring
the compression of the cubes with the help of a linear variable
differential transformer (LVDT). All tests were conducted on three
identical specimens for a specifi c grade of the mix and the average
of the three results has been reported in this article.
Ultrasonic Pulse velocity test was performed as per ASTM C597
(17). A commercially available USPV tester of 54 KHz frequency
was employed for this investigation.
1E-4
1E-3
0.01
0.1
1
10
100
0
20
40
60
80
100
% Finer
CA (20 mm)
CA (10 mm)
CA (Combined)
FA
OPC
PPC
Particle Size (mm)
Rys. 1. Składy ziarnowe materiałów stosowanych w badaniach
Fig. 1. Particle-size distribution patterns of the materials used in the study
Tablica 2 / Table 2
SKŁAD CHEMICZNY I WŁAŚCIWOŚCI FIZYCZNE STOSOWANYCH
CEMENTÓW
CHEMICAL COMPOSITION AND PHYSICAL CHARACTERISTICS OF
THE CEMENTS USED
Tlenek/Oxide, %
OPC
PPC
LOI
2.26
1.40
SiO
2
20.89
31.45
Al
2
O
3
5.55
9.57
Fe
2
O
3
4.98
3.54
CaO
60.46
46.07
MgO
1.27
1.22
Na
2
O
0.232
0.331
K
2
O
0.49
0.50
SO
3
2.39
2.88
IR
2.88
20.06
Gęstość/Density
3.15
2.95
Powierzchnie właściwa
Specifi c Surface Area, m
2
/kg
294
356

CWB-1/2008
11
Skład mieszanki betonowej wykonanej z OPC i PPC dla
trzech warunków ekspozycji podano w tablicy 4.
3. Metody badań
Sporządzono kostki o wymiarach 150 mm, beleczki o wy-
miarach 100 x 100 x 500 mm i walce o średnicy 100 mm
i wysokości 300 mm dla betonu trzech klas: M20, M30
i M40 oznaczone C1, C2 i C3 dla betonów z OPC i F1,
F2 i F3 w przypadku betonów wykonanych z PPC. W celu
zapewnienia jednorodności betonu mieszanie prowadzono
2 minuty w mieszarce obrotowej. Natomiast pożądane
zagęszczenie zapewniono stosując stół wibracyjny. Prób-
ki przechowywano w komorze klimatycznej (wilgotność
względna 95 ± 5% w 27 ± 2
o
C). Po 24 h przechowywa-
nia próbki wyjmowano z form i wkładano do wody w zbiorniku
o automatycznie kontrolowanej temperaturze (temperatura wody
27 ± 2
o
C). Wybrano w tych doświadczeniach sześć okresów
dojrzewania (1, 3, 7, 28, 56 i 90 dni). Na końcu każdego okresu
przechowywania oznaczono wytrzymałości próbek na ściskanie
(f
ck
), rozciąganie przy zginaniu (f
cr
) i rozciąganie bezpośrednie (f
ct
)
wykorzystując automatyczne urządzenie badawcze (ACTM, A i M
i L, Indie). Moduł sprężystości betonu oznaczano na podstawie
pomiaru odkształcenia liniowego na kostkach za pomocą różni-
cowego aparatu do pomiaru zmian liniowych. Wszystkie pomiary
przeprowadzano na trzech identycznych próbkach dla danej klasy
mieszanki i jako wynik przyjmowano średnią z trzech pomiarów.
Przeprowadzono także pomiar szybkości rozchodzenia się (fali)
ultradźwiękowej zgodnie z normą ASTM C 597 (17). Zastosowano do-
stępne w handlu urządzenie pracujące przy częstotliwości 54 KHz.
4. Wyniki i dyskusja
4.1. Urabialność
Urabialność różnych klas przygotowanych betonów oznaczano
za pomocą stożka Abrambsa. Jak to podano w tablicy 4 oba be-
4. Results and discussions
4.1. Workability
Workability of the different grades of concretes prepared was deter-
mined with the help of a slump cone. As indicated in Table 4, both
the OPC and PPC concretes exhibited zero slump and were very
stiff to work with. This could be attributed to inadequate proportion
of cementitious materials present in the mix with correspondingly
high aggregate-cement ratio (about 6.5 parts). Thus, for the given
coarse and fi ne aggregates the stipulations of the minimum cement
contents and maximum w/c ratios did not allow the required slump
to be achieved, even when a fi ner than usual sand was used as
the fi ne aggregate.
4.2. Attaining the target characteristic strengths
The compressive strength results of both OPC and PPC concretes
are presented in Table 5. By comparing the 28-days compressive
strength values in Table 5 with the corresponding compressive
strengths indicated in Table 4, one could observe that all the
concrete achieved more than the target compressive strengths and
interestingly, the F series exceeded the compressive strengths by
wider margin than the C series.
Tablica 3 / Table 3
WYTRZYMAŁOŚĆ NA ŚCISKANIE CEMENTÓW OZNACZONA NA KOSTKACH
ZAPRAWY 1:3
COMPRESSIVE STRENGTH OF THE CEMENTS IN 1:3 MORTAR CUBES
Materiał
Material
Wytrzymałośc na ściskanie
Compressive Strength, MPa
1 dzień
1 day
3 dni
3 days
7 dni
7 days
28 dni
28 days
Cement portlandzki
Ordinary Portland Cement (OPC)
23.9
37.6
47.4
61.7
Portlandzki cement pucolanowy
Portland Pozzolana Cement
(PPC)
18.2
28.3
40.1
60.9
Tablica 4 / Table 4
SKŁAD MIESZANKI DLA RÓŻNYCH KLAS BETONU
MIX PROPORTIONS FOR DIFFERENT GRADES OF CONCRETE
Oznaczenie
mieszanki
Mix designation
Rodzaj
cementu
Type of
cement
Zawartość
cementu
Cement content,
kg/m
3
w/c
Udziały składników
mieszanki
Mix proportion C:W:
FA:CA
Rozpływ
Slump, mm
Cel/Target
Klasa
Grade
Wytrzymałość na ściskanie
Compressive strength,
N/mm
2
C1
OPC
300
0.55
1:0.55:2.06:4.37
NIL
M 20
27.6
C2
OPC
320
0.45
1:0.48:1.98:4.60
M 30
39.9
C3
OPC
360
0.40
1:0.40:1.88:4.59
M 40
50.9
F1
PPC
300 +
0.55
1:0.55:2.06:4.37
M 20
27.6
F2
PPC
320 +
0.45
1:0.48:1.98:4.60
M 30
39.9
F3
PPC
360 +
0.40
1:0.40:1.88:4.59
M 40
50.9
+ z dodatkiem 20% popiołu
+ with 20% fl y ash content.

12
CWB-1/2008
tony wykonane z OPC i PPC
wykazywały rozpływ zerowy,
były gęste bardzo trudno
urabialne.
Mogło to być spowodowane
niewłaściwymi udziałami spoi-
wa w mieszance o stosunkowo
dużym stosunku kruszywo-ce-
ment (około 6,5 części) z tego
względu dla danego grubego
i drobnego kruszywa warunek
minimalnej zawartości cemen-
tu i maksymalnego wskaźnika
w/c nie pozwalał na uzyskanie
wymaganego rozpływu, nawet
w przypadku zastosowania
piasku drobniejszego niż nor-
malnie stosowany jako drobne
kruszywo.
4.2. Osiągnięcie
zakładanej
wytrzymałości
Wyniki oznaczonej wytrzy-
małości na ściskanie dla obu
betonów wykonanych z OPC i PPC pokazano w tablicy 5. Porów-
nując wytrzymałości na ściskanie po 28 dniach podaną w tablicy
5 z odpowiednią wytrzymałością z tablicy 4 można zauważyć, że
wszystkie próbki betonu osiągnęły wyższą od założonej wytrzyma-
łości na ściskanie i co jest interesujące, seria F wykazała większy
przyrost wytrzymałości niż seria C.
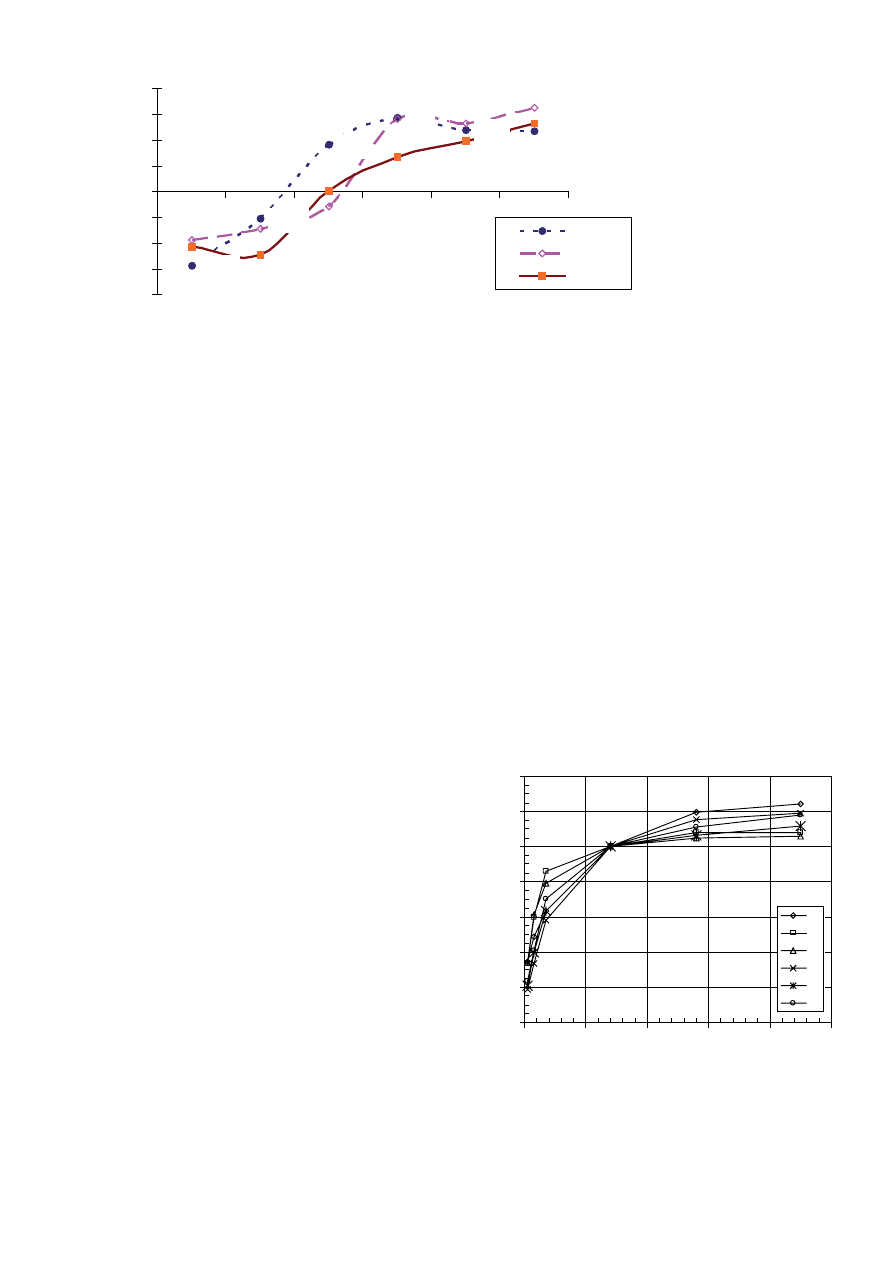
4.3. Porównawczy przyrost wytrzymałości betonów
wykonanych z OPC i PPC
Tendencje w różnicach przyrostu wytrzymałości w seriach betonów C
i F pokazano na rysunku 2. Z tendencji wynika, że przy stałej zawar-
tości popiołu lotnego w cemencie, co ma miejsce w tych badaniach,
względny przyrost wytrzymałości serii F betonów w stosunku do serii
C był bardzo zmienny. Jednak, dla wszystkich trzech klas to jest M
20, M 30 i M 40 wytrzymałość na ściskanie serii F jest taka sama
lub większa od serii C w okresie bliskim 7 dniom. Później wzrost
wytrzymałości jest szybszy dla serii F, jednak zróżnicowany. Po 28
dniach względny przyrost wytrzymałości betonów klasy M 20 i M 30
wynosił 28-29%, podczas gdy betonu M 40 był mniejszy o prawie
13%. Względny przyrost wytrzymałości po 90 dniach zamykał się
w przydziale od 23,6% do 32,7% bez dostrzegalnej korelacji z klasą
betonu. Ponieważ w tych badaniach tak składniki, jak i warunki przy-
gotowania i dojrzewania betonu były stałe takie ilościowe zmiany we
względnym przyroście wytrzymałości nie mogą być prosto (łatwo)
wyjaśnione z wyjątkiem być może w oparciu o wpływ mikrostruktury
betonu obejmujący pustki zaformowanych elementów. Stąd modele
prognozujące nie mogą opierać się tylko na stałości składników be-
tonu i procesach jego wytwarzania i warunkach dojrzewania.
4.3. Comparative strength gain characteristics of OPC
and PPC concretes
The trend of difference in the strength gain of C and F series of
concretes are presented in Fig.2. From the trends it is evident that
with constant fl y ash content in cement, which is the case in this
study, the relative strength gain characteristics of the F series of
concrete with respect to C series were quantitatively quite variable.
However, for all the three grades, i.e., M20, M30 and M40, the
compressive strengths of F series equalized or exceeded that of
C series at ages close to 7 days. Thereafter the strength gains
were faster for the F series, but with differing rates. At 28 days
the relative strength gains for M20 and M30 concrete were aro-
und 28-29%, while for the M40 concrete it came down to almost
13% level. At 90 days the relative strength gains were seen in
the range of 23.6% to 32.7% without any discernible correlation
with the grade of concrete. Since in this study the ingredients and
the concreting as well as curing parameters were constant, such
quantitative variations in the relative strength gain characteristics
could not be readily explained, except, perhaps, due to the effects
of concrete microstructure including voids of the cast specimens.
Hence, the predictive models cannot be too much reliant on the
constancy of concreting materials and processes of concrete
making and curing alone.
An attempt was made also to see the strength gain patterns of all
the six concretes with respect to their 28-day strength which was
assumed to be 100 per cent. The trend curves are given in Fig.3.
From the data one may notice that for the PPC-based concretes
(F-series) the early-age strength gains were systematically infl u-
Tablica 5 / Table 5
WYTRZYMAŁOŚĆ PRÓBEK BETONU RÓŻNYCH KLAS
THE STRENGTH CHARACTERISTICS OF DIFFERENT GRADES OF CONCRETE
Wiek, dni
Age, day
C1
F1
% zmiany
change
C2
F2
% zmiany
change
C3
F3
% zmiany
change
Wytrzymałość na ściskanie/Compressive strength (f
ck
)
1
10.95
7.82
-28.58
14.28
11.64
-18.49
17.51
13.80
-21.19
3
15.42
13.82
-10.38
25.53
21.90
-14.22
31.38
23.69
-24.51
7
20.06
23.75
18.39
36.91
34.86
-5.55
40.60
40.73
0.32
28
31.76
40.94
28.90
42.81
54.88
28.19
51.20
58.02
13.32
56
38.06
47.24
24.12
46.14
58.43
26.64
53.82
64.37
19.60
90
39.44
48.76
23.63
46.25
61.35
32.65
54.13
68.40
26.36
Wytrzymałość na rozciąganie przy zginaniu/Flexural strength (f
cr
)
1
1.80
1.60
-12.50
2.70
2.39
-11.48
3.32
2.75
-17.17
3
3.23
2.72
-15.79
3.80
3.36
-11.58
4.27
3.78
--11.48
7
3.61
3.95
9.42
4.85
4.08
-15.88
5.52
5.58
1.09
28
5.29
5.79
9.45
6.19
6.63
7.11
6.42
6.92
7.79
56
5.63
6.27
11.37
6.56
7.53
14.79
7.45
7.88
5.77
90
6.42
6.63
3.27
6.58
7.57
15.05
7.53
8.25
9.56
Wytrzymałość na rozciąganie bezpośrednie/Split tensile strength (f
ct
)
1
0.88
0.28
-68.18
1.13
0.86
-23.89
1.47
1.09
-25.85
3
1.28
0.98
-23.44
2.15
1.35
-37.21
2.32
1.77
-23.71
7
1.91
1.5
-21.47
2.5
1.79
-28.40
2.64
2.34
-11.36
28
2.5
2.49
-0.40
2.77
3.04
9.75
3.24
3.34
3.09
56
2.57
3.42
33.07
2.96
3.65
23.31
3.54
3.95
11.58
90
2.74
3.54
29.20
3.14
3.75
19.43
3.8
4.12
8.42
CWB-1/2008
13
Podjęto także próbę pokazania przyrostu wytrzymałości wszystkich
sześciu betonów w stosunku do ich wytrzymałości po 28 dniach,
którą przyjęto za 100%. Krzywa tendencji zmian pokazano na
rysunku 3. Na podstawie tych wyników można stwierdzić, że dla
betonów z PPC (seria F). Początkowy przyrost wytrzymałości
zasadzał się bez wyjątku na wpływie zawartości cementu w prób-
kach betonu. Innymi słowy wytrzymałość betonów z PPC po 1, 3
i 7 dniach jako procent wytrzymałości po 28 dniach wzrastał ze
wzrostem zawartości cementu w próbce betonu. Taka prosta za-
leżność nie występuje w betonach wykonanych z OPC (seria C).
4.4. Wytrzymałość na rozciąganie przy zginaniu i na
rozciąganie bezpośrednie
Obie wytrzymałości na rozciąganie betonu pokazano w tablicy
5. W przypadku obu serii stwierdzono, że wzrost zawartości
cementu i zmniejszenie wskaźnika w/c powoduje zwiększenie
wytrzymałości na rozciąganie przy zginaniu o przy rozciąganiu
bezpośrednim z upływem czasu. Charakterystyczny względny
przyrost wytrzymałości w przypadku serii F w stosunku do serii
C był, mniej lub więcej, taki sam jak wytrzymałość na ściskanie
omówiona wcześniej. Z oceny wyników podanych w tablicy 5 jest
oczywiste, że obie wytrzymałości na rozciąganie betonu z PPC
były zawsze większe po wszystkich okresach pomiarowych dłuż-
szych od 28 dni niż betonów z OPC. W indyjskich zaleceniach
praktycznych (8) zalecono stosowanie następującej zależności
łączącej wytrzymałość na rozciąganie przy zginaniu z wytrzyma-
łością na ściskanie:
f
cr
=0.7
√ f
ck
N/mm
2
[1]
gdzie: f
cr
wytrzymałość walców na ściskanie
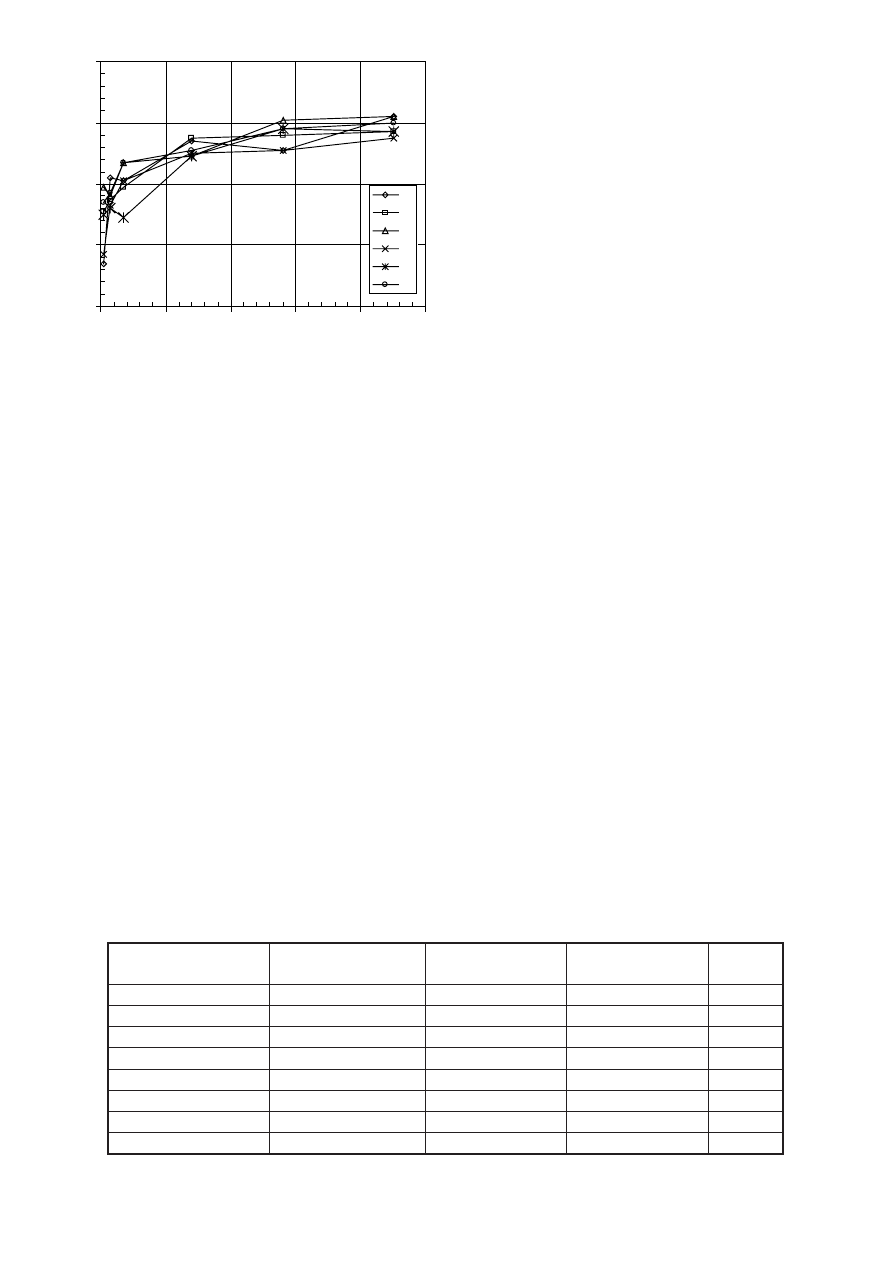
W celu określenia tej zależności z pokazanego zbioru wyników
obliczono stosunki Y (f
cr
/
√ f
ck
) i pokazano na rysunku 4. Można
zauważyć, że dla obu betonów przygotowanych z OPC jak
i z PPC, stosunki te w przypadku 28 dni i krótszych okresów leżą
w przedziale od 0,9 do 1,0. W tym świetle przyjęcie współczynnika
enced by the cement content in
the concrete specimens. In other
words the strength values of PPC
concretes at 1-day, 3-day and
7-day as percentage of 28-day
strength increased with increa-
sing cement content in concrete.
Such a clear pattern could not be
seen for the OPC-based concre-
tes (C-series).
4.4. Flexural and splitting
tensile strengths
The fl exural and splitting tensile
strengths of the concretes are
presented in Table 5. For both
the series it was observed that
with increase in cement contents
and decrease in w/c ratios, the
flexural and splitting tensile
strength increased with age. The relative strength gain characte-
ristics of the F series with respect to C series followed, more or
less, the same pattern as for the compressive strength discussed
earlier. From the data in Table 5 it is evident that both the fl exural
and splitting tensile strength values of the PPC concrete were
always higher at all ages after 28 days of curing than the OPC
concretes.
In the Indian Code of Practice (8), the following relationship
has been recommended between the fl exural and compressive
strength:
f
cr
=0.7
√ f
ck
N/mm
2
[1]
where f
ck
is the characteristic cube compressive strength of concre-
te in N/mm
2
. In order to fi nd out this relationship from the present
-28,58
-10,38
18,39
28,9
24,12
23,63
-18,49
-14,22
-5,55
28,19
26,64
32,65
-21,19
-24,51
0,32
13,32
19,6
26,36
-40
-30
-20
-10
0
10
20
30
40
1
3
7
28
56
90
Ag e in d ays
Diffrerence in the strength
gain between C&F series
(%)
M -20
M -30
M -40
Rys. 2. Względny przyrost wytrzymałości różnych klas betonów jako % wytrzymałości po 28 dniach
Fig. 2. Differential strength gain patterns of different grades of concrete
0
20
40
60
80
100
120
140
0
20
40
60
80
100
A ge in days
Compressive strength as % of
28days value
C1
C2
C3
F1
F2
F3
Rys. 3. Przyrost wytrzymałości na ściskanie różnych betonów w stosunku
do wyników po 28 dniach
Fig. 3. Rate of compressive strength gain of different concretes with respect
to the 28 day values
14
CWB-1/2008
0,7 w wytycznych praktycznych jest zbyt ostrożne. Trzeba także
podkreślić, że nie ma różnic pomiędzy betonami przygotowanymi
z OPC i PPC w zakresie tej zależności.
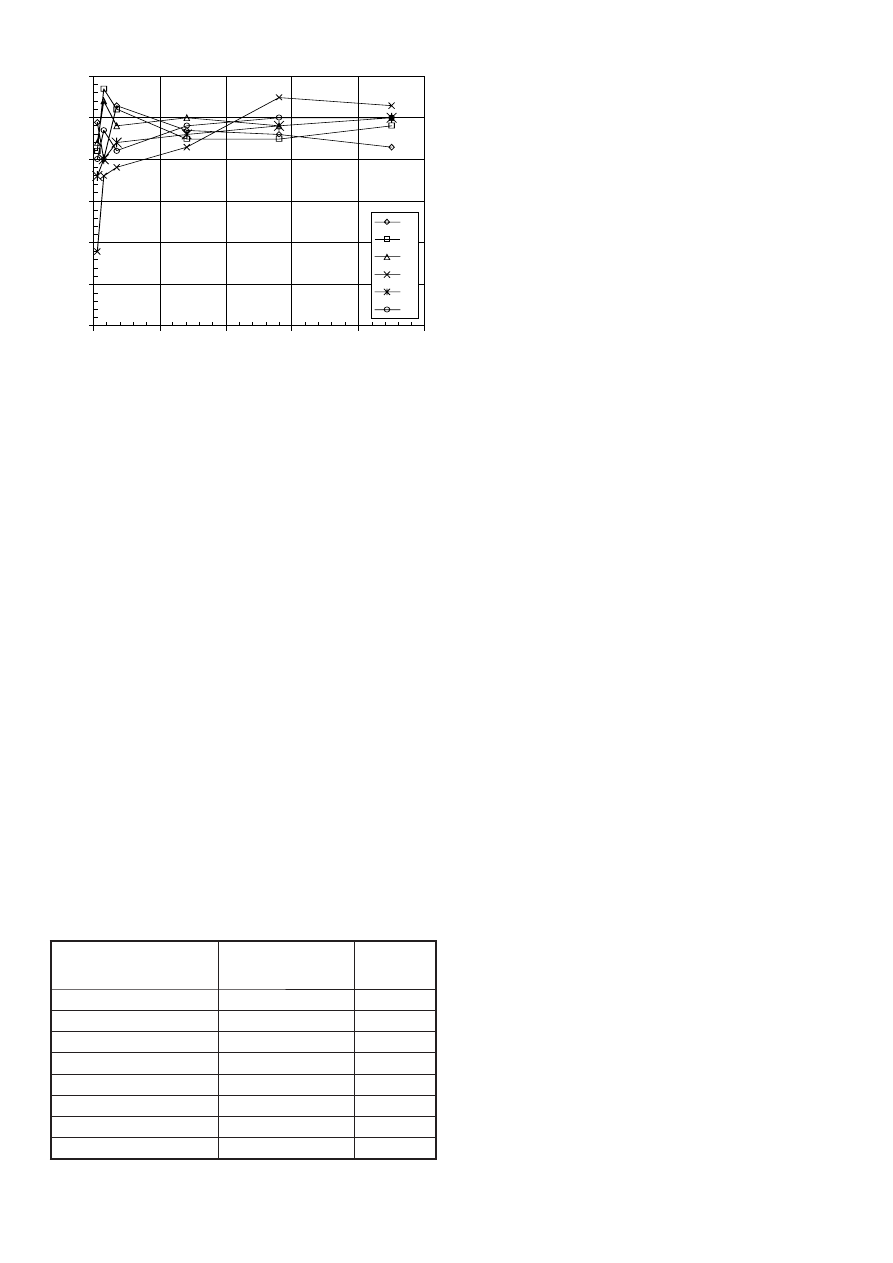
Zależności pomiędzy wytrzymałością na rozciąganie przy zgi-
naniu i na rozciąganie bezpośrednie pokazano na rysunku 5.
W przypadku wszystkich próbek z betonu wykonanego z OPC
i po wszystkich okresach badawczych od 1 do 90 dni stosunek
tych wytrzymałości pozostawał w wąskim przedziale od 0,40 do
0,57 bez jakichkolwiek dostrzegalnych różnic. Jednak w przypadku
betonów z PPC jest wyraźny wzrost tego stosunku z wiekiem dla
wszystkich trzech klas.
4.5. Statyczny moduł sprężystości
W tablicy 6 podano wyniki odnoszące siedo statycznego modułu
sprężystości, E
c
– zmierzone i obliczone wartości dla betonów C1,
C3, F1 i F3. Na moduł sprężystości wpływają przede wszystkim
właściwości sprężyste kruszywa i w mniejszym stopniu warunki
dojrzewania i wiek betonu, skład mieszanki oraz rodzaj stosowa-
nego cementu. Zależność modułu sprężystości od wytrzymałości
na ściskanie jest ujęta w zaleceniach praktycznych w formie
równania 2:
set of data, the ratios Y (f
cr
/√ f
ck
) were calculated and plotted in
Fig.4. One may observe that for both the OPC and PPC concretes
the ratios for 28 days and beyond were in the range of 0.9 to 1.0.
Thus, the present provision of the co-effi cient of 0.7 in the code
of practice turns out to be more conservative. It should also be
noted that there is hardly any difference between the OPC and
PPC concretes in this relationship.
The ratios between the fl exural strengths and the splitting tensile
strengths are plotted in Fig.5. For all the PPC-based concrete
and for all their ages from 1 to 90 days the ratios remained within
a narrow range of 0.40 to 0.57 without any discernible pattern.
But for the OPC-based concretes there was visible increase in
the ratios with age for all the three grades.
4.5. Static modulus of elasticity
Table 6 present the data pertaining to the static modulus of ela-
sticity, E
c
– both measured and computed for C1, C3, F1, and F3
concretes. The modulus of elasticity is primarily infl uenced by the
elastic properties of the aggregate and to a lesser extent by the
conditions of curing and age of the concrete, the mix proportions
and the type of cement used. The relationship of the modulus of
elasticity with the compressive strength as given in the code of
practice is presented in equation 2.
Ec = 5000
√f
ck
[2]
It is also stipulated that the actual measured values may differ
by ±20 per cent from the values obtained from the above ex-
pression.
From the data in Table 6 one may observe that the elasticity
modulus of PPC concretes of both the grades were higher than
the corresponding OPC concretes. Further for all the concretes
the difference between the computed and measured values was
much below 20%. Thus, the coeffi cient of 5000 in equation 2, is
as applicable to OPC concretes as to the PPC specimens.
4.6. Ultrasonic properties
The ultrasonic pulse velocity, USPV, was measured in a limited
manner for both the OPC and PPC concretes of M20 and M40
0.4
0.6
0.8
1
1.2
0
20
40
60
80
100
Ag e in d ays
f
cr
/sqrt(f
ck
)
C1
C2
C3
F1
F2
F3
Rys. 4. Zależność (f
cr
/√f
ck
) wytrzymałości na rozciąganie przy zginaniu
i na ściskanie
Fig. 4. Relationship of fl exural and compressive strengths
Tablica 6 Table 6
STATYCZNY MODUŁ SPRĘŻYSTOŚCI (E
C
) RÓŻNYCH BETONÓW
STATIC MODULUS OF ELASTICITY (EC) OF DIFFERENT CONCRETES
Rodzaj i klasa betonu
Type and grade concrete
Wiek betonu, dni
Age of concrete, days
Obliczony Computed
Ec, GPa
Zmierzony
Measured Ec, GPa
Ec/√f
ck
C1
28
28.2
28.9
5123.3
90
31.4
31.9
5076.7
C3
28
35.8
37.8
5282.1
90
36.8
40.6
5518.0
F1
28
31.9
33.6
5252.4
90
34.9
36.6
5237.1
F3
28
38.1
40.2
5273.4
90
41.4
43.9
5309.8
CWB-1/2008
15
Ec = 5000
√f
ck
[2]
Podano również, ze zmierzone wartości mogą różnić się o ± 20%
od obliczonych z tego wzoru.
Z danych zamieszczonych w tablicy 6 wynika, że moduł sprężysto-
ści w przypadku betonów z PPC obu klas jest wyższy od modułu
odpowiednich betonów z OPC. Dalej, w przypadku wszystkich
betonów różnica pomiędzy obliczonymi i zmierzonymi wartościami
jest znacznie mniejsza od 20%. W związku z tym, współczynnik
5000 w równaniu 2 może być stosowany zarówno do betonów
z OPC jak i wykonanych z PPC.
4.6. Rozchodzenie się fal ultradźwiękowych
Zmierzono szybkość rozchodzenia się fali ultradźwiękowej
(SRFU), w ograniczonym zakresie, w betonach z cementów OPC
i PPC klas M 20 i M 40 w próbkach przechowywanych 28 i 90 dni
(tablica 7). W jednakowych warunkach pomiarowych otrzymane
wyniki układają się zgodnie z wytrzymałościami na ściskanie,
grades in the samples cured for 28 and 90 days (Table 7). Under
identical conditions of measurements the USPV values followed
the trends of the compressive strengths as tested and the veloci-
ties were always higher for PPC concretes as compared to OPC
concretes of the same age. The differences, however, did not show
any consistent pattern and they varied from 200 to 350 m/s.
5. Conclusions
The experimental studies on the validity of the existing stipulations
of minimum contents of cementitious materials and maximum
water-cement ratios in the Indian code of practice for plain and
reinforced concrete revealed the following:
1. There could be problems of workability for both OPC and PPC
concretes under the conditions of stipulated minimum cement
content and maximum w/c ratio. However, this aspect requires
further examination.
2. The target characteristic cube compressive strengths were
easily achieved for both OPC and PPC concretes. The PPC
concretes exceeded the target strengths by wide margins.
3. The compressive strengths of PPC concretes equalized
those of OPC concretes at ages close to 7 days. Thereafter
the strength gains were faster for the PPC concretes but with
varying rates. The differing rates perhaps could be due to the
microstructural differences of the concrete specimens studied,
including their voids.
4. From the experimental data it was evident that the fl exural and
splitting tensile strengths of the PPC concretes were always
higher than the OPC concretes at all ages after 28 days. It was
also observed that for both concretes the ratio f
cr
/√f
ck
ranged
from 0.9 to 1.0 for all specimens aged 28 days and more. The
ratio was higher than what is conservatively specifi ed in the
code. The ratio of fl exural strength and the splitting tensile
strength for all OPC concretes was within a band of 0.40 to
0.57 without any specifi c pattern. But for PPC concretes there
was a relationship with age of curing.
5. The measured and actual static modulus of elasticity for all
OPC and PPC concretes were within 10 per cent of each other,
although the code provides for 20 per cent variation.
6. The ultrasonic pulse velocity values of all OPC and PPC concre-
tes followed the trend of their compressive strengths and the
values for PPC concretes were always marginally higher than
those of OPC concretes.
Acknowledgement
The authors are thankful to Mr. S.K. Maheshwari, Group Execu-
tive President, and Mr. M.C. Agrawal, Joint Executive President,
Grasim Industries Ltd (Cement Business) for their support to carry
out the experimental work and also for their permission to publish
the fi ndings.
Tablica 7 / Table 7
SZYBKOŚĆ ROZCHODZENIA SIĘ FALI ULTRADŹWIĘKOWEJ (SRFU)
USPV VALUES OF DIFFERENT CONCRETES
Rodzaj i klasa betonu
Type and grade of concrete
Wiek betonu, dni
Age of concrete, days
SRFU, m/s
USPV, m/s
C1
28
4250
90
4760
C3
28
4720
90
4850
F1
28
4680
90
5050
F3
28
4980
90
5160
Rys. 5. Stosunek wytrzymałości na rozciąganie bezpośrednie i na rozcią-
ganie przy zginaniu różnych betonów
Fig. 5. Ratio of splitting tensile strengths and fl exural strengths of different
concretes
0
0.1
0.2
0.3
0.4
0.5
0.6
0
20
40
60
80
100
Age in days
Y(
f
cr
/f
ck
)
C1
C2
C3
F1
F2
F3

16
CWB-1/2008
Literatura / References
1. J. R. Mackechine, M. G. Alexander, Exposure of concrete in
different marine environments. Journal of materials in civil engi-
neering, ASCE
, February 1997, Vol.9(1), pp. 41-44.
2. V. Sirivivatnanon, E. Meck, H. T. Cao, Performance based
specifi cations in harmonization of durability standards, 1st Asia/
Pacifi c Conference on Harmonisation of Durability Standards and
Performance Tests for Components in Buildings and Infrastructure,
September 1999. Bangkok, Thailand.
3. S. Collepardi, L. Coppola, R. Troli, M. Collepardi, A critical review
of the durability criteria in the new European standard (EN 206) for
concrete structures. Proceedings of the international conference on
a vision for the next millennium
, edited by R. N. Swamy, Sheffi eld,
July 1999, pp.1097-1106.
4. V. Sirivivatnanon, E. Meck, H. T. Cao, Build to Last with the
Right Materials, Proceedings CPAC Annual Seminar, Bangkok,
Thailand, September 1995.
5. ACI 318, Building code requirements for reinforced concrete
with commentary, American Concrete Institute. Detroit, Michigan,
USA 1999.
6. AS 3600, Standard Association of Australia, Australian Standard
for Concrete Structures
, Sydney, 1990.
7. BS 8110, Code of practice for design and construction, Structure
use of concrete – Part 1. British Standard, 1985.
8. IS 456, Code of practice for plain and reinforced concrete, Bureau of
India Standard
. New Delhi, India 2000.
9. Eurocode 2, Design of concrete structures, The Concrete Centre Bla-
ckwater, Camberley.
10. CEB Design guide, Durable concrete structures, Second Edition,
Thomas Telford, London, 1989.
11. EN 206, Guide to the selection of concrete quality and cover to rein-
forcement for normal concrete structures, British Cement Association, The
Meadows Business Park, Camberley, Surrey GU179AB, 2002.
12. C. J. Lynsdale, J. G. Cabrera, “Parameters infl uencing the oxygen and
chloride permeability of superplasticized normal Portland cement and fl y
ash-normal Portland cement mortar and concrete”, 1994, Proceedings
of 4th CANMET/ACI Int. Conf. On Superplasticizers and Other Chemical
Admixtures in Concrete
, American Concrete Institute, Detroit 275-294.
13. P. K. Mehta, “Role of Pozzolanic and Cementitious Material in Su-
stainable Development of the Concrete Industry”, Proceedings of the 6th
International Conference on the Use of Fly Ash, Silica Fume, Slat, and
Natural Pozzolans in Concrete
, ACI SP-178, Bangkok, 1998, pp. 1-25.
14. ASTM C 150, Standard Specifi cation for Portland Cement, Annual book
of ASTM Standards, Vol.04-01, ASTM, West Conshohocken, PA, 2002.
15. ASTM c 595, Specifi cation for Blended Hydraulic Cements, Annual book
of ASTM Standards, Vol.04.01, ASTM, West Conshohocken, PA 2002.
16. IS 383, Specifi cation for coarse and fi ne aggregates from natural sou-
rces for concrete, Bureau of Indian Standards, New Delhi, 1970.
17. ASTM C 597-83, “Test for Pulse Velocity Through Concrete,” American
Society of Testing and Materials
, Philadelphia USA, 1991.
a szybkości były zawsze większe w przypadku betonów z PPC
w porównaniu z betonami z OPC tego samego wieku. Różnice te
nie wykazały jednak jakiejś tendencji i zmieniały się w przedziale
od 200 do 350 m/s.
5. Wnioski
Badania sprawdzające zaleceń zawartych w indyjskich wytycznych
praktycznych, dotyczących minimalnej zawartości spoiwa i mak-
symalnego stosunku w/c dla zwykłego betonu i żelbetu wykazały
co następuje:
1. Mogą wystąpić trudności z urabialnością dla obu rodzajów be-
tonów w warunkach zalecanej minimalnej zawartości cementu
i maksymalnego stosunku w/c. Jednak, ten wniosek wymaga
dalszych badań.
2. Zakładaną, charakterystyczną wytrzymałość na ściskanie wal-
ców można łatwo otrzymać tak w przypadku betonów z OPC
jak i z PPC. Betony wykonane z PPC przekraczały zakładaną
wytrzymałość bardzo znacznie.
3. Wytrzymałość na ściskanie betonów z PPC była analogiczna
do wytrzymałości betonów z OPC w wieku bliskim do 7 dni. Po
tym okresie przyrost wytrzymałości betonów z PPC był więk-
szy, jednak w zmiennym stopniu. Te różne wielkości przyrostu
mogły wynikać z różnic w mikrostrukturze badanych kształtek,
obejmujących także pustki.
4. Wyniki doświadczalne jasno dowodzą, że wytrzymałość na
rozciąganie przy zginaniu i na rozciąganie bezpośrednie be-
tonów z PPC była zawsze większa od betonów wykonanych
z OPC, po okresie przekraczającym 28 dni. Stwierdzono także,
że w przypadku obu rodzajów betonów stosunek f
cr
/
√f
ck
zawarty
w przedziale od 0,9 do 1,0 dla wszystkich kształtek dojrzewa-
jących 28 dni lub dłużej. Ten stosunek był większy zalecanego
w wytycznych. Stosunek wytrzymałości na rozciąganie przy
zginaniu do wytrzymałości na rozciąganie bezpośrednie miał
wartości w zakresie od 0,40 do 0,57, nie wykazując żadnych
tendencji zmian. Jednak, w przypadku betonów z PPC wystę-
powała ta tendencja związana z okresem dojrzewania.
5. Zmierzony i obliczony statystyczny moduł sprężystości wszyst-
kich betonów wykonanych z OPC i PPC leżał w przedziale
±10% chociaż zalecenia podają wahania w przedziale
± 20%.
6. Szybkości rozchodzenia się fali ultradźwiękowej we wszystkich
betonach z OPC i PPC wykazywały tendencje zmian zgodne
z wytrzymałością na ściskanie, a wartości dla betonów z PPC
były zawsze nieznacznie większe niż w przypadku betonów
z OPC.
Podziękowanie
Autorzy wyrażają podziękowania dla Pana S. K. Maheshwari,
Przewodniczącego Grupy Wykonawczej i dla Pana M. C. Agra-
wal, Towarzyszącego Przewodniczącego, Grasim Industries Ltd
(Przemysł Cementowy) za ich pomoc w przeprowadzeniu badań,
a także za pozwolenie na publikowanie ich wyników.
Wyszukiwarka
Podobne podstrony:
Doświadczalne sprawdzenie twierdzeń o wzajemności prac i przemieszczeń
Zgorzel słoneczna w bazalcie i jej wpływ na trwałość betonu
Projekt dotyczący formy opieki nad dzieckiem w wieku przedszkolnym, Dokumenty(1)
Doświadczalne sprawdzanie metody sił
DOŚWIADCZALNE SPRAWDZENIE METODY SIŁ., Technologiczne
pytania sprawdzającego wraz z odpowiedziami, Budownictwo 2 rok, Technologia betonu
DOŚWIADCZALNE SPRAWDZENIE METODY CLEBCHA, Technologiczne
DOŚWIADCZALNE SPRAWDZENIE UGIĘCIA RAMY, Technologiczne
Projekty dotyczące odnawialnych źródeł energii
Trwalosc betonu w konstrukcjach zwiazanych z energetyka atomowa Brandt Andrzej
Projekty dotyczące in vitro niezgodne z prawem UE
Projekt odchowu 20 cieląt od 1 do 120 dnia życia, egzamin zawodowy
Dokumentacja technologiczna do projektów - karty 2010, T-8 rysunek zespołu do montażu
Informacja dla Kredytobiorcy Pożyczkobiorcy dotycząca ubezpieczenia kredytu pożyczki do momentu usta
Projekt i implementacja internetowej bazy danych do wymiany i promowania wiedzy ekologicznej
więcej podobnych podstron