
Electronic copy of this paper is available at: http://ssrn.com/abstract=976871
University of Tartu
Faculty of Economics and Business Administration
EFFECTS OF DIFFERENT
DIMENSIONS OF SOCIAL
CAPITAL ON INNOVATION:
EVIDENCE FROM EUROPE
AT THE REGIONAL LEVEL
Anneli Kaasa
Tartu 2007

Electronic copy of this paper is available at: http://ssrn.com/abstract=976871
ISSN 1406–5967
ISBN 978–9949–11–560–0
Tartu University Press
www.tyk.ee
Order No. 69

EFFECTS OF DIFFERENT DIMENSIONS
OF SOCIAL CAPITAL ON INNOVATION:
EVIDENCE FROM EUROPE AT THE
REGIONAL LEVEL
Anneli Kaasa
1
Abstract
This paper investigates how different dimensions of social capital
influence innovation output. The novelty of the paper lies in the
fact that for measuring social capital, instead of one overall index,
six factors are constructed of 20 indicators using principal compo-
nents analysis. Then, human capital and R&D are also included in
the analysis as factors of innovation. Unlike many previous
studies, this one uses the structural equation modelling approach
instead of regression analysis in order to take into account the
relationships between the factors of innovation. Regional-level
data from Eurostat Regio and the European Social Survey are
analysed. Compared to preceding studies, a larger number of
observations is used. The findings provide strong support for the
argument that social capital indeed influences innovative activity
and furthermore, that different dimensions of social capital have
dissimilar effects on innovation.
Keywords: innovation, social capital, human capital, R&D
1
Lecturer in Economics, Ph.D., University of Tartu, Faculty of
Economics and Business Administration, Narva Road 4-A210, Tartu
51009, Estonia, Phone: +372 7 375 842, Fax +372 7 376 312, E-mail:
Anneli.Kaasa@ut.ee

1. INTRODUCTION
It is commonly accepted that innovation plays an important role in
economic development and growth. Hence, there is no doubt that
investments in research and development (R&D) as a main catalyst
of innovation are needed. However, the same expenditures on
R&D in different countries or regions fail to yield similar results
and success in innovation, for example, a comparable number of
new patent applications. This is so because the innovation process
is additionally influenced by many other factors. One of the factors
that has received much attention in the literature is the overall level
of human capital of a particular country or region. Another very
important factor is the social environment, i.e. networks, norms,
trust, etc., which can be jointly referred to as social capital.
Social capital as a relevant factor of innovation has been actively
dealt with in the literature over the last few years. Notwithstanding,
there are as yet very few empirical tests assessing the effect of
social capital on innovation. It can be assumed that one possible
reason for this lies in the problems with the measurement of social
capital. First, the concept of social capital has many dimensions
that have to be taken into account when discussing social capital
and its influences. Due to the heterogeneous character of social
capital, no unique indicator of social capital can be used and
therefore measurement methods using many indicators have to be
applied. Second, these indicators cannot be found among the usual
indicators published by statistical offices. Hence, special surveys
have to be conducted in order to get appropriate data. As the
concept of social capital itself is quite new, not many surveys
offering data about social capital are available yet.
The purpose of this article is to examine the effect of social capital
on innovation in Europe at the regional level. Analysing European
regions has an advantage of a relatively homogeneous sample,
where the possible unobserved factors of innovation are less
influential (Ackomak and ter Weel, 2005). The regional level was
chosen for two reasons. First, prior research has shown significant

Effects of different dimensions of social capital on innovation
5
within-country differences in the levels of innovative activities,
human and social capital (see, for instance, Daklhi and de Clercq
(2004) for a review). Second, considering the number of possible
variables in the model, for the sake of getting reliable results, a
larger sample than the number of European countries is necessary.
The current study uses data from the European Social Survey and
Eurostat. Although previous studies have examined analogical
data, their number of observations has been smaller.
To measure social capital, many previous studies have used an
overall index, one variable or one latent construct (see, for
instance, Subramaniam and Youndt, 2005; Ackomak and ter Weel,
2005; Ackomak and ter Weel, 2006). However, it can be assumed
that different dimensions of social capital may have dissimilar
impacts on innovation. Therefore, this paper tests the influence of
social capital on innovation by separate dimensions. In addition,
the number of different dimensions of social capital included in the
present analysis is higher than in previous studies analysing more
than one dimension (Tsai and Ghoshal, 1998; Landry et al. 2002;
Daklhi and de Clercq, 2004).
To take account of other main factors of innovation, the current
analysis includes human capital and R&D as factors of innovation.
With regard to methodology, the previous studies using regression
analysis have failed to take into account the relationships between
the factors of innovation themselves. To overcome this problem,
this study uses the structural equation modelling approach.
The paper is structured as follows. Section 2 presents the con-
ceptual background. Section 3 discusses the causal relationships
between innovation, social capital, and other factors of innova-
tion − R&D and human capital. Section 4 introduces the data
analysed. Section 5 deals with the measurement and Section 6
presents the results of the structural model estimation. Section 7
comprises the discussion, while Section 8 points out the limitations
and makes recommendations for future research. Section 9
concludes.

Anneli Kaasa
6
2. CONCEPTUAL BACKGROUND
Innovation is usually understood as the introduction of something
new or significantly improved, be they products (goods or servi-
ces) or processes. The involvement of a country or a region in
innovative activity has two aspects: inputs and outputs (see, for
instance, Nasierowski and Arcelus, 1999). The inputs include, for
example, expenditures on R&D and employment in R&D, both in
the government and business sector. The results of innovative
activity such as patent applications, publications, and the growth of
the high-technology sector are understood as the outputs of innova-
tion. It is important to distinguish between inputs and outputs when
constructing a theoretical model and testing it empirically.
Hereinafter, when innovation is mentioned, the outputs of innova-
tive activity are actually borne in mind, while the inputs of inno-
vation activity will be considered as an influencing factor of
innovation.
One important factor of innovation is human capital – an indivi-
dual’s knowledge, skills and abilities that can be improved with
education – both regular education and lifelong learning. Human
capital can be firm-specific, industry-specific or individual-specific
(Daklhi and de Clercq, 2004). The last type can also be understood
as the general level of human capital in a country or region. The
general level of human capital is more connected with regular
education, while lifelong learning contributes more often to the
industry- or firm-specific human capital. Therefore, this regional-
level analysis focusses on the general level of human capital
usually measured with the population’s average number of years of
schooling, or with the percentage of population with different
levels of education attained.
Next, social capital can be considered as a factor of innovation.
There are many definitions of social capital. Adler and Kwon
(2002) and Tamaschke (2003) provide exhaustive overviews of
different definitions. Social capital has been analysed at different
levels (see, for example, Leana and van Buren, 1999): it can be
considered as an asset of an individual, but it can also be viewed at
the community or firm level. The third approach advocated by

Effects of different dimensions of social capital on innovation
7
Robert Putnam is to study social capital as an attribute of a country
or a region (Portes, 1998). According to Putnam (1995) social
capital ”refers to features of social organization such as networks,
norms, and social trust that facilitate coordination and cooperation
for mutual benefit.” The definitions covering networks, norms and
trust have often been used when analysing the impact of social
capital on economic growth or, more specifically, on innovation
(see, for instance, Knack and Keefer, 1997; Fountain, 1998;
Landry et al. 2002 and Daklhi and de Clercq, 2004 for further
references).
Social capital is often divided into two forms or types: structural
and cognitive social capital (Hjerppe, 2003; Chou, 2006). Cogni-
tive social capital encompasses norms and trust, while structural
social capital includes social networks: both formal and informal.
Norms can be viewed as a social contract or unwritten rules, for
example, the norms of helping and good citizenship – cooperation
and subordination of self-interest to that of the society (Daklhi and
de Clercq, 2004). Trust can be described as confidence in the
reliability of others. The trust that people have in other people in
general can be referred to as generalised or general trust. In
addition, often also the trust in different institutions like police,
government, church, banks, media, etc. – also referred to as
institutional trust, is studied. Trust and norms are strongly related:
civic norms guiding people’s behaviour can be viewed as trust-
worthiness that increases trust in other people. Also, the norm that
voting is a civic duty may increase political participation and
improve governmental performance and hence also the trust in
government (Knack and Keefer, 1997). On the other hand, one
important norm is reciprocity (Fountain, 1998): people act for the
benefit of others and expect to get help in return when it is needed.
Therefore, in case of high trust, the expectations that others will
reciprocate are high and people tend to really follow the civic
norms in their actions (Knack and Keefer, 1997).
Informal networks are formed by the interpersonal relationships
between friends, relatives, colleagues, neighbours, etc. Formal net-
works refer to participation in the associations and voluntary
organisations: professional, religious, cultural, etc. In contrast to

Anneli Kaasa
8
the informal networks, in case of formal networks, the boundaries
can be drawn on the basis of membership in these organisations.
Both formal and informal networks provide support and commu-
nication channels for information exchange. Activity in voluntary
organisations is often also considered as social participation
(Harper and Kelly, 2003; Franke, 2005). In addition, civic partici-
pation is considered as a dimension of social capital, being
expressed, for example, by voting activity (ibid.). While cognitive
social capital is a rather subjective concept usually measured with
the help of surveys, networks and participation are more objective,
although also measured by surveys alongside the objective
measures of memberships in organisations or voting activity.
As can be seen, social capital is a complex concept with many
dimensions. In the next section, the influences of different factors
on innovation will be discussed. For reasons of space, the review is
intended as illustrative, not exhaustive.
3. THE FRAMEWORK OF CAUSAL
RELATIONSHIPS
As noted before, R&D as an input of innovation is unquestionably
a key factor of innovation. Also, the general level of human capital
of a region or a country is commonly supposed to positively
influence innovation. An overview of theoretical reasoning and
empirical results can be found, for instance, in Daklhi and de
Clercq (2004) or Subramaniam and Youndt (2005). The general
level of human capital determines the quality of the labour force
which is employed or can potentially be employed in R&D. In
addition to the direct positive influence on innovation, a higher
educational level of the labour force in R&D demands lower extra
expenditures on additional training, leaving more finances for
other innovative activities. Daklhi and de Clercq (2004), for
example, have found that human capital has a significant positive
influence on R&D expenditures.

Effects of different dimensions of social capital on innovation
9
The influence of social capital on innovation can be described as
forming the innovative milieu (Daklhi and de Clercq, 2004). A
good overview on the development of theories concerning social
capital as a factor of innovation can be found in Landry et al.
(2002). Next, the impact and the influence mechanisms of social
capital on innovation will be discussed, distinguishing between
different dimensions of social capital.
It is generally accepted that firms do not innovate in isolation but
need interaction with their environment. Hence, the structural
dimension of social capital − both formal and informal networks −
can be thought to be paramount for several reasons. First, inno-
vation significantly depends on the spread of information, especial-
ly in high-technological fields, where information is very specific
(Fukuyama, 2000). Further specialisation and more complex
technologies demand more cooperation. Networks consist of ties
between individuals and through them also between firms. These
ties enable, help and speed information exchange and also lower
the costs of information search. It has been said that access to
know-how can be gained with the help of know-who, that is,
information about who knows what (Gregersen and Johnson, 2001;
Lundvall, 2006). Often, networks may help to avoid duplication of
the costly research. Second, networks have a synergy effect,
bringing together complementary ideas, skills and also finance.
Connecting different creative ideas and thoughts can lead to un-
usual combinations and radical breakthroughs (Subramaniam and
Youndt, 2005). In addition, networks not only facilitate the inno-
vations themselves, but also help and speed the diffusion of inno-
vations (Abrahamson and Rosenkopf, 1997). However, the
information exchange via networks cannot work without trust (see
also Tsai and Ghoshal, 1998).
Next, the cognitive dimensions of social capital are considered as
the factors of innovation. Trust can influence innovation through
many mechanisms. First, the higher the general trust, the lower the
monitoring costs of possible malfeasance or non-compliance by
partners and the smaller the need for written contracts (Knack and
Keefer, 1997; Tamaschke, 2003). Hence, higher trust enables firms
to spend more time and finances on other purposes, innovative
activity being one of them. Second, the higher the general trust in a

Anneli Kaasa
10
society, the less risk averse are its members, including investors. It
is commonly known that innovation is closely associated with risk
and venture capital markets are critical for innovation − higher
trust encourages investors to invest more in R&D projects (Acko-
mak and ter Weel, 2006). Third, in case of higher general trust,
when workers are selected, their human capital is more important
and their acquaintances are less important (Knack and Keefer,
1997). Thus, the labour force employed in R&D probably has
higher skills and education that are needed for innovative activity.
Fourth, as it was noted before, cooperation needs trust. Therefore,
trust between firms developed by repeated cooperation may lead to
riskier and more radical innovative cooperation projects (Ackomak
and ter Weel, 2006). The trust in institutions like the government
and legal system is also substantial. In case of a reliable legal
system and effective patent registration, the motivation to innovate
is higher: the innovators feel that the results of their activity and
R&D expenditures are protected and they can expect their activity
to pay off (Dakhli and de Clercq, 2004; Tabellini, 2006).
Although norms are strongly related to trust, norms themselves
have received less attention in the previous literature about the
impacts of social capital on innovation. Dakhli and de Clercq
(2004) argue that the higher the norms of civic behaviour, for
instance, the norm of helping others, the higher the country’s level
of innovation. Reciprocity can be one important factor to en-
courage the diffusion of resources: for example, the amounts of
information given to each other at a given point of time do not
have to be equal – the information is expected to be returned in the
future. The norm that prefers society’s interests to self-interest also
supports the diffusion of information. In addition, the shared norms
help to avoid misunderstandings and facilitate cooperation.
Although the literature on the impact of social capital on inno-
vation has been proliferating in the last decade, to date there are
only a few studies that have empirically tested this impact. Landry
et al. (2002) analysed the effects of networks and trust on the
likelihood and on the radicalness of innovation at the firm level.
They found confirmation for the innovation-increasing effect of
networks, but trust turned out to be insignificant in determining
both likelihood and radicalness of innovation. Dakhli and de

Effects of different dimensions of social capital on innovation
11
Clercq (2004) analysed the impact of networks, trust and norms on
different indicators of innovation at the country level. It turned out
that none of these three dimensions of social capital influence the
number of patents, that higher institutional trust increases high-
tech export, and unexpectedly for the authors, that higher norms of
civic behaviour appear to decrease high-tech export. The authors
supposed that the norms of being a good citizen are contradictory
to the intentions to think differently and create new ideas.
There are also studies with more optimistic results. For example,
Tsai and Ghoshal (1998) found in their firm-level analysis that
both social interactions and trustworthiness increase the number of
innovations via resource exchange and combination. The firm-
level study by Subramaniam and Youndt (2005) showed that the
overall social capital influenced positively both incremental and
radical innovative capabilities. Ackomak and ter Weel (2006)
analysed European regional-level data, finding that trust has a
positive influence on the number of patent applications.
The relationship between human and social capital has also been
the subject of discussion. First, it is often argued that social capital
has a positive impact on education and human capital. However,
by that it is usually meant that surrounding social capital helps to
create the human capital of a child or young person (see Chou,
2006 for an overview). Hence, the influence of the present level of
social capital will become evident in a longer perspective. There-
fore, when analysing social and human capital concurrently, this
influence cannot be expected to emerge. Second, there are many
proponents of a view that a higher level of education means higher
social capital. Norms, and cooperation and social participation
skills can be viewed as by-products of education. Further, more
educated people are usually more informed and able to make
evaluations of social and political issues, hence their civic partici-
pation is also higher (see Denny, 2003 and Dee, 2004 for a more
exhaustive overview). Dee (2004) provided empirical evidence that
educational attainment largely affects both attitudes and civic
engagement. Denny (2003) found that education has a significant,
but rather small impact on social participation. Thus, in the context
of the current study the direction of causal relationship from
human capital to social capital can be presumed.

Anneli Kaasa
12
In summary, it can be assumed that besides R&D and human
capital, social capital also influences innovative activity. More-
over, considering the heterogeneous character of social capital, it
can be supposed that different dimensions of social capital have
dissimilar impacts on innovation. In addition, the indirect influen-
ces of social capital and human capital on innovation have to be
tested: social capital via R&D, and human capital via social capital
and R&D. Next, the data used for testing these propositions will be
introduced.
4. DATA
The data used in this study were drawn from two databases. The
measures of R&D, innovation, and one indicator of human capital
came from the Eurostat’s Regio database (Eurostat, 2007) while
the measures of social capital and the other indicators of human
capital were taken from the database of the European Social
Survey (ESS) (Jowell et al., 2003; Norwegian…, 2007). Data were
available for 20 countries
2
at the regional level. Although the
author’s intention was to include all countries at the NUTS2 level
(European …, 2007), the data in ESS were available only at the
NUTS1, NUTS2 or NUTS3 level
3
for each country. Therefore, the
data available at the NUTS3 level were aggregated to the NUTS2
level. For the aggregation the raw data were used, ensuring that the
data aggregated to the NUTS2 level were completely comparable
to the data already presented at the NUTS2 level. For Belgium,
2
The countries included in the analysis are: Austria, Belgium, the
Czech Republic, Denmark, Finland, France, Germany, Greece, Hun-
gary, Ireland, Italy, Luxembourg, the Netherlands, Norway, Poland,
Portugal, Slovenia, Spain, Sweden, and the United Kingdom. In case
of Switzerland, the innovation data were not available; hence Switzer-
land was not included in the analysis.
3
The NUTS (Nomenclature of Territorial Units for Statistics) is
established by Eurostat. This hierarchical classification subdivides
each country into a number of NUTS1 regions, each of which is in
turn subdivided into a number of NUTS2 regions and so on (see
European ..., 2007 for further information).

Effects of different dimensions of social capital on innovation
13
France, Germany and the United Kingdom, the data were available
at the NUTS1 level and these countries had thus to be included in
the analysis at this level. To ensure that the data drawn from ESS
would be representative of the demographic structure of a region,
weighted data were chosen. Six regions, where the number of
respondents in ESS was below 25, were omitted. The final number
of observations used is 162. Analogical data were used in the
studies by Ackomack and ter Weel (2005; 2006), but they analysed
only 11 countries (divided into 87 regions) (2005) or 14 countries
(102 regions) (2006), respectively. It has to be mentioned that the
data in the two databases used differ in their nature: while the ESS
data were obtained from a survey where the number of respondents
was quite small in some regions, the data in Eurostat Regio gained
from the national statistical offices are of a more general character.
However, because of the complex character of the concept of
social capital, surveys are the best option available for measuring
social capital. Although not all-including, the weighted ESS data
are the best proxy for different dimensions of social capital in
European regions at present.
It makes sense to assume that the innovation process takes time
and thus a time lag should be considered between the observations
of the factors of innovation and the observations of innovation.
Daklhi and de Clercq (2004) and Subramaniam and Youndt
(2005), for instance, use innovation data observed three years later
than the factors of innovation. Yet, many studies do not use the
time lag (Tsai and Ghoshal, 1998; Nasierowski and Arcelus, 1999;
Landry et al. 2002) or use innovation data observed even earlier
than the factors of innovation (Ackomack and ter Weel, 2005;
Ackomack and ter Weel 2006). As the stock of social or human
capital does not change rapidly, it is possible that the results are
not drastically influenced by the chosen time lag. Still, whenever
feasible, it is reasonable to use such data about the factors of
innovation which are observed before the innovation data. In this
study, all the indicators of social capital and one indicator of
human capital were drawn from the ESS, which has had two
rounds: 2002 and 2004. As the latest innovation data in the
Eurostat Regio database pertained to 2003, the first round of ESS
(2002) was chosen. Hence, considering the data, the best choice is
a one-year time lag: the innovation data for 2003 and the data

Anneli Kaasa
14
measuring factors of innovation for 2002. The only exception is
that in case of R&D the missing data for Germany, Greece, Italy,
Luxembourg and Sweden in 2002 were replaced with the obser-
vations for 2003. As the correlations between the data for 2002 and
2003 ranged between 0.976 and 0.991, the replacements pre-
sumably do not decrease the reliability of the analysis.
Next, the indicators included in the analysis will be briefly intro-
duced. The exact descriptions of the indicators included in the
analysis are presented in Appendix A.
Innovation is measured by the number of patent applications to the
European Patent Office (EPO). However, the reliability of this
measure can be questioned, as it covers only one aspect of inno-
vative activity, excluding, for example, process innovations or
product modifications (see Daklhi and de Clercq (2004) for a more
in-depth discussion). Yet, this is the only way at the moment to
proxy innovation outputs at the regional level in Europe and it cap-
tures the main patterns of innovative results (Daklhi and de Clercq,
2004; Ackomack and ter Weel, 2006). Three indicators: the numbers
of all patent applications, high-tech and biotechnology patent
applications were included in the analysis. As the number of ICT
patent applications, which was also available, was highly correlated
(0.94) with the number of high-tech patent applications, it was not
included in the analysis to balance the set of innovation indicators.
Innovation inputs, i.e. R&D, are described by four indicators: the
R&D expenditures and the employment in R&D both in the business
and government sector. Two indicators are used to measure human
capital. First, the average number of school years was taken from
ESS. Since the number of respondents to ESS is quite small in some
regions, this measure should be compared and complemented with
some more reliable indicator. Therefore, and in order to capture
another aspect of human capital, the percentage of labour force with
tertiary education was drawn from Eurostat Regio.
Regarding social capital, it is assumed that different dimensions of
social capital can influence innovation in dissimilar ways. There-
fore, for describing social capital, an overall index, one variable or
one latent construct cannot be used. This idea is supported by the

Effects of different dimensions of social capital on innovation
15
argument pointed out by Franke (2005) that grouping several
dimensions of social capital into one index may eliminate the
substance of the concept and its explanatory power may be lost in
an analysis. In this study, first informal networks are described by
the frequency of meeting friends, relatives or colleagues and the
importance of friends in life. Here and hereafter the scales are
chosen so that larger values reflect a larger stock of social capital.
Formal networks, which can also be referred to as social partici-
pation, are measured by the average number of memberships in
various voluntary organisations as a more objective measure and
by the importance of organisations in life as a more subjective
measure. Civil participation is described by voting activity.
Three indicators used to measure general trust are the answers to
three questions about whether most people can be trusted, whether
most people are fair, and whether most people are helpful.
Institutional trust is measured by four indicators: trust in the legal
system and politicians, and satisfaction with the government and the
way democracy works. When attempting to describe and analyse
norms, one has to bear in mind that the claimed norms can
noticeably differ from actual behaviour. However, even the indi-
cators of actual behaviour, if drawn from surveys, are subjective,
because the respondents are likely to be reluctant to admit bad
behaviour (Knack and Keefer, 1997). In this paper, norms are
described by eight indicators. At the same time, the norm of activity
in organisations can also be viewed as an indicator of social partici-
pation and the norm of duty to vote as an indicator of civic parti-
cipation. The other six indicators are the norms of helping, loyalty,
supporting, following rules, behaving properly and obeying the laws.
Concerning data normality, the outlier values were omitted. In
order to preserve as much valuable information as possible, instead
of deleting whole observations, each variable was considered
separately and values more than three standard deviations away
from the mean of a particular indicator (Kline, 1998, p. 79) were
deleted. After this, the data satisfy the normality assumption with
absolute values of skewness ranging from 0.041 to 1.317 (should
be less than 3 (Kline, 1998, p. 82)) and of kurtosis from 0.032 to
1.247 (less than 8 or 10 (ibid.)). The numbers of usable obser-
vations are presented in Appendix B. For the data analysis here and

Anneli Kaasa
16
hereafter SPSS for Windows 11.5 and Amos 4.0 were used. Next,
the measurement of latent variables will be introduced.
5. MEASUREMENT OF LATENT
VARIABLES
As mentioned before, this paper aims to analyse the effects of
different dimensions of social capital on innovation separately.
This is a complicated task, as collinearity problems can be ex-
pected if different dimensions are separately included in the model
(Ackomak and ter Weel, 2005). Therefore, first multicollinearity
diagnostics were inspected. The condition index (if only the
indicators of social capital are included) is 185.74, which is larger
than both limit values suggested in the literature: 30 and 100
(Maruyama, 1998, p.64). Hence, there exists multicollinearity
between the variables describing social capital. This is supported
by the variance inflations factors (VIF) ranging from 1.98 to
11.492, as it is commonly accepted that VIF greater than 10
indicates multicollinearity (Kline, 1998, p.78).
One possible way to overcome this problem is to use confirmatory
factor analysis
4
as a part of the structural equation modelling
(SEM)
5
methodology to generate latent variables describing diffe-
rent dimensions of social capital (trust, norms, informal and formal
networks, civic participation), human capital, R&D and innova-
tion. However, when this method was applied on the data, the
results showed persisting multicollinearity problems. Some
standardised regression coefficients describing the influence of
different latent factors on innovation were significantly higher than
one (reaching even values over 100 or below -100 in case of some
4
While in case of exploratory factor analysis any indicator may be as-
sociated with any factor, in case of confirmatory factor analysis the
indicators describing a particular latent factor are predetermined on the
basis of theoretical considerations (see, for instance, Maruyama, 1998).
5
See, for instance, Maruyama (1998) or Kline (1998) for an overview
of SEM as a method.

Effects of different dimensions of social capital on innovation
17
specifications) and very unstable, which is a sign of multicolli-
nearity (Maruyama, 1998, p. 63).
This is presumably caused by the problems with attaining conver-
gent and discriminant validity. Many of the indicators of different
constructs are quite strongly correlated, for example, correlations
between the indicators of general trust and membership in
voluntary organisations, or frequency of meeting (see Appendix B
for correlations). At the same time, some correlations between the
indicators describing the same construct are quite small − often the
correlations between indicators that reflect different constructs are
smaller than within-construct correlations. Also, it is possible that
some indicators simultaneously reflect different latent constructs.
Thus, it can be supposed that it is more reasonable to group the
indicators of social capital in some other way which is more
consistent with the data structure. This supposition can be tested by
exploratory factor analysis, which also solves multicollinearity
problems resulting in variables describing social capital and not
correlating with each other.
Thus, an exploratory factor analysis was conducted using the
principal components method with equamax
6
rotation. In order to
test for stability of the results, other extraction methods (maximum
likelihood, generalised least squares) and other rotation methods
(varimax, quartimax) were implemented, but the pattern of loadings
of indicators into factors remained the same. To decide the number
of factors, the Kaiser criterion was used: only the factors with
eigenvalue greater than 1 were retained (Statsoft, 2003). The factor
loadings and percentages of total variance explained by the factors
are presented in Table 1. For reasons of simplicity and clarity, the
coefficients with absolute values less than 0.4 are suppressed. The
extracted six factors explain altogether 82.04% of the total variance
of indicators included in the analysis.
6
Equamax is chosen, because it is a combination of varimax, which
minimises the number of variables that have high loadings on each
factor, and quartimax, which minimises the number of factors needed
to explain each variable (SPSS, 2005).

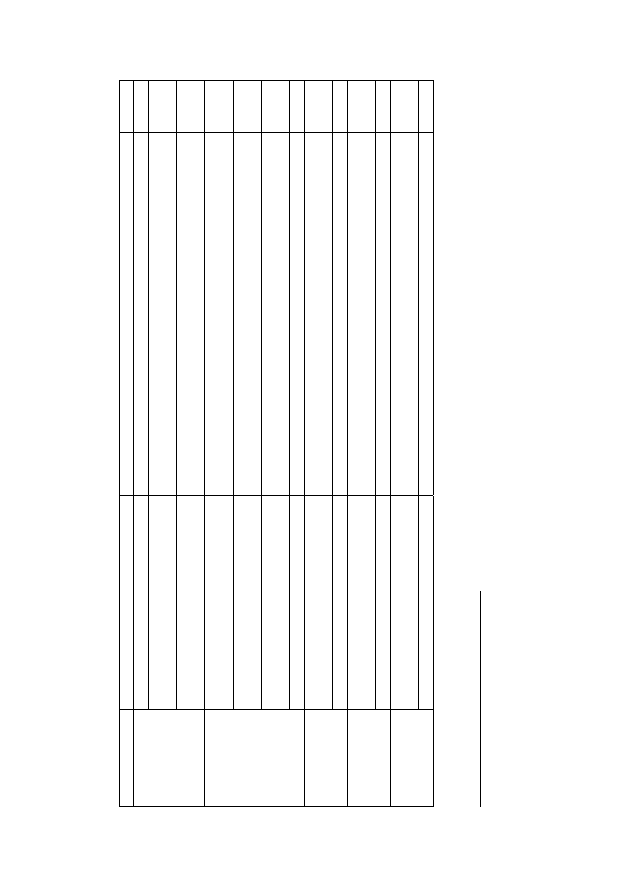
Table 1.
Rotated component matrix of social capital
indicators and % of total variance explained
Indicators Factors
1 2 3 4 5 6
Importance
of
friends
0.77
Trust in fairnes
s
0.76
–0.
41
General
trust
0.69
0.43
Trust
in
helpfulness
0.67
Membership
in
voluntary
organisations
0.67
Frequency of meeting socially
0.55
0.49
Satisfaction
with
the
government
0.87
Satisfaction
with
the
democracy
0.79
Trust
in
politicians
0.75
Norm of loyalty and devotion
0.84
Norm of helping and care
0.80
Norm of behaving properly
–0.
47
0.56
0.45
Norm of activity in organisations
0.90
Importance of voluntary organisations
0.86
Norm
of
supporting
0.68
Norm of obeying laws
0.86
Norm of following rules
0.45
0.72
Voting
0.78
Norm of duty to vote
0.48
0.76
Trust in the legal system
0.53
0.66
Variance explained (%)
17.
01 14.
43 14.
26 12.
74 11.
85 11.
75
Cumulative variance explained
(%)
17.
01 31.
44 45.
70 58.
44 70.
29 82.
04

Effects of different dimensions of social capital on innovation
19
The first factor can be interpreted as ‘general trust and networks’
as it covers all three indicators of general trust but also both
indicators of informal networks and the objective measure of
formal networks. It is interesting that this factor is negatively
related to the norm of behaving properly – this can be caused by
the contradiction mentioned before between the norms and actual
behaviour. The second factor represents institutional trust, in-
cluding all four indicators of institutional trust. This factor is also
positively related to general trust, which is quite logical. The third
factor can be referred to as the norms of helping and decency. It
has high loadings of the norm of helping and loyalty and somewhat
lower but still significant loadings of the norms of behaving
properly and following rules. The negative relationship with trust
in fairness can again be explained by the contradiction between
norms and behaviour: behaviour does not favour trust in fairness.
The fourth factor represents the norms of active social participation
as it includes both subjective indicators related to organisational
activity, and the norm of supporting, and is positively related to the
activity of meeting other people. The fifth factor describes the
norms of orderliness. It has high loadings of the norms of obeying
laws and following rules, and somewhat lower loadings of the
norms of behaving properly and the duty to vote. The sixth factor
can be interpreted as civic participation, including both the norm
and practice of voting. It is logical that this factor is also positively
related to trust in the legal system.
The results show that different dimensions of social capital are indeed
strongly related. In case of social participation, it is possible to se-
parately consider the norms and actual behaviour, but this may rather
reflect the problems connected with the subjective character of data.
Before estimating the structural model, also the latent variables of
human capital, R&D and innovation, or more precisely patenting
intensity
7
, were constructed. Principal components analysis of parti-
7
As innovation is measured by patent applications, here and hereafter,
when presenting the results of the analysis, under innovation the
activity of submitting patent applications, that is, patenting intensity,

Anneli Kaasa
20
cular indicators was conducted to capture the information into one
variable. An analogical method has been used earlier by Whiteley
(2000) to create one variable describing social capital. The results
are presented in Table 2. The percentages of total variance explained
are quite large, considering that only one factor was extracted.
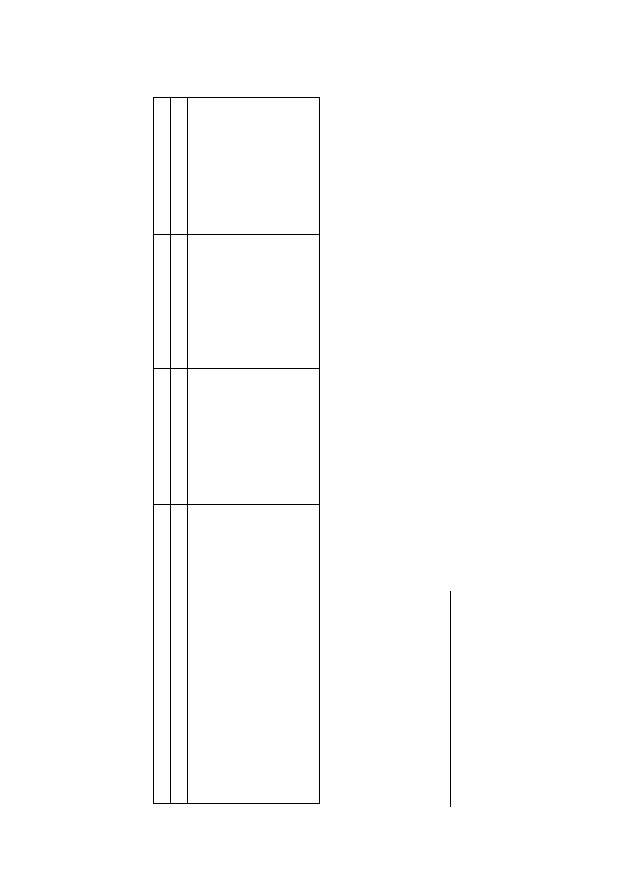
Table 2. Factors of human capital, R&D and innovation: factor loadings
and % of variance explained
Latent
variable/factor
Indicator
Factor
loadings
Variance
explained
(%)
Labour force with tertiary
education
0.88
Human
capital
Years of education
completed
0.88
77.21
R&D expenditure in the
business sector
0.82
R&D personnel in the
business sector
0.82
R&D expenditure in the
government sector
0.77
R&D
R&D personnel in the
government sector
0.66
59.40
High-tech patent applications
0.91
Patent applications
0.90
Innovation
(patenting
intensity)
Biotechnology patent
applications
0.78
74.97
The factor scores of all latent variables discussed so far were saved
as variables and entered into the structural model presented in the
next section.
is meant and the term innovation is used rather for reasons of conci-
sion than generalisation.
Effects of different dimensions of social capital on innovation
21
6. RESULTS OF THE STRUCTURAL
MODEL ESTIMATION
Next, the structural equation modelling (SEM) approach was used
to analyse how different factors influence innovation. First of all,
the model includes the direct effects of R&D, human capital and
six factors describing social capital on innovation. According to
the literature and theoretical considerations discussed before, the
direct effects of human capital on all social capital factors and
R&D are also presumed and tested. This enables capturing the
indirect effect of human capital on innovation through social
capital and R&D. In addition, it can be supposed that some
dimensions of social capital, especially those connected with trust,
influence innovation not only directly but also through R&D. To
test these influences, the direct effects of social capital factors on
R&D were also included in the initial model. As the factors
describing social capital are uncorrelated because of the specificity
of principal component analysis, different dimensions of social
capital are assumed to have no causal relationships to each other.
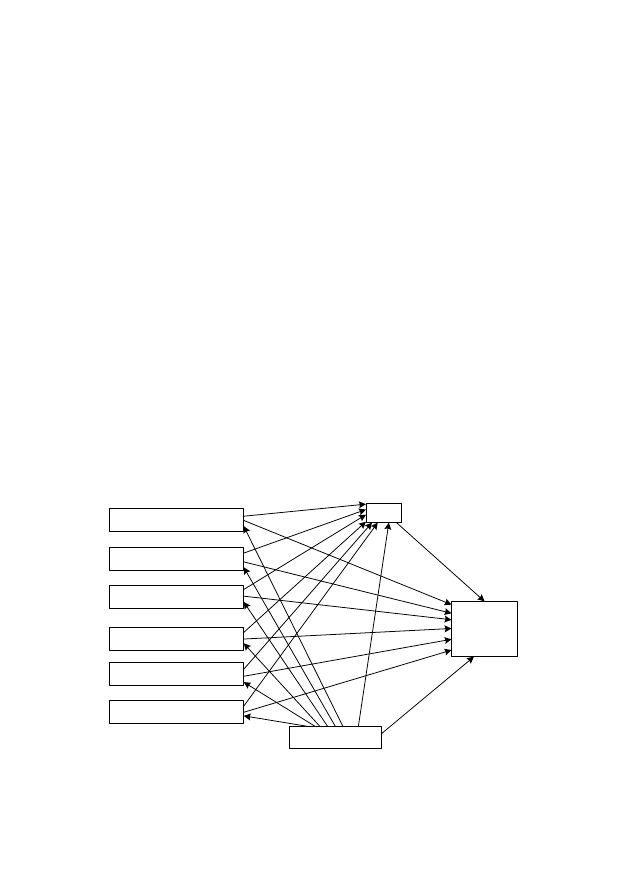
All the direct effects (which also form the indirect effects) tested
are presented in Figure 1.
Innovation
(patenting
intensity)
R&D
Social capital (factor 4)
Human capital
Social capital (factor 1)
Social capital (factor 2)
Social capital (factor 3)
Social capital (factor 5)
Social capital (factor 6)
Figure 1. Structural model.

Anneli Kaasa
22
As mentioned before, the indicators measuring human capital were
drawn from different sources and the reliability of the indicator of
the average years of education completed (hereafter referred to as
‘the years of education’) can be more questionable than that of the
indicator of labour force with tertiary education (hereafter referred
to as ‘tertiary education’). Also, they capture different aspects of
human capital: the former indicates overall educational level of the
population, while the latter focuses on the spread of tertiary edu-
cation among labour force. Therefore, three model specifications
were tested: models using the latent construct including both
indicators and both indicators alone as a measure of human capital.
The full information maximum likelihood (FIML) method was
used for estimation. This method enables utilising all the infor-
mation available in case of missing data because in case of every
observation it takes into account only variables with available data
for this observation (Enders and Bandalos, 2001). All the variables
were standardised before the analysis to ensure comparability of
the relative fit indices calculated by AMOS. The standardised
regression coefficients, squared multiple correlations and fit
measures of the initial models are displayed in Appendix D.
According to the squared multiple correlations, 72–74% of
variance in innovation, or more precisely, patenting intensity is
explained by the initial models described before. The overall
model fit has been assessed in terms of five measures. The
df
2
χ
ratio (discrepancy / degrees of freedom) indicates the best fit (2.46)
if tertiary education is used as a measure of human capital,
followed by the model with the latent construct (2.86) and the
years of education (2.90). Whereas commonly the values less than
3 are considered as favourable (Kline, 1998, p. 131), all three
models are acceptable. The RMSEA (root mean square error
approximation) values range from 0.09 to 0.10. These values lie on
the borderline of model acceptance (Arbuckle and Wothke, 1999).
With regard to the relative fit indices, those indices that are less
sensitive to the sample size (according to Hu and Bentler 1999,
pp.89-91) were chosen because of the relatively small sample size
in this study. Still, the indices used have also been reported to
undervalue the models if the sample size is smaller than

Effects of different dimensions of social capital on innovation
23
250 (ibid.). The values of normed fit indices (NFI) are ranging
from 0.82 to 0.85, incremental fit indices (IFI) from 0.87 to 0.90,
and comparative fit indices (CFI) from 0.85 to 0.89. Usually the
values higher than 0.9 (Kline, 1998, p. 131; Hu and Bentler 1999,
pp.89-91), but also those higher than 0.8 (Tsai and Ghoshal, 1998)
have been considered as indicators of a good fit. Hence, the initial
models, especially the model including tertiary education, can be
viewed as acceptable, but the differences in fit measures are too
small to decide that one model is better than the others.
As can be seen from Appendix D, the fit measures can be signifi-
cantly improved by deleting the insignificant paths one by one
(backward method), but the variance of patenting intensity explained
and the statistically significant regression coefficients do not change
significantly. It can be assumed that in calculating the indirect and
total effects
8
, the insignificant regression coefficients have very little
influence, if any. As the insignificant regression coefficients are
mostly close to 0, the indirect effect through the particular insigni-
ficant path will also be close to 0 and it does not change the total
effect significantly. This can be seen from Table 3. Therefore, the
implications can be drawn on the basis of the results of the initial
models. In addition, the specifications without the effects of human
capital on social capital or the effects of social capital on R&D were
tested. The results are not presented in this paper for reasons of
space, but the patterns of regression coefficients, the variance
explained and the fit measures did not change significantly.
As expected, R&D has a statistically significant large
9
positive
effect on patenting intensity in the case of tertiary education as a
measure of human capital (0.52), and it is slightly smaller in the
models including the latent construct (0.46) and the years of
education (0.42). Contrary to expectations, only the direct effect of
8
See, for example, Maruyama (1998) for principles of calculating
indirect and total effects.
9
Here and hereafter the interpretation bases on the recommendations
that the standardised regression coefficients with absolute values of
0.5 or more can be interpreted as large, coefficients with absolute
values around 0.3 as medium, and coefficients with absolute values
less than 0.1 as small effects (Kline 1998, pp. 149–150).

Anneli Kaasa
24
the years of education on patenting intensity turned out to be
statistically significant, although rather small (0.19). The other
measures of human capital had no statistically significant direct
effect on patenting intensity. However, human capital influences
patenting intensity also through other variables. Mainly because of
a large direct effect on R&D, but also because of direct effects on
different dimensions of social capital (see Appendix D), the
indirect effect compensates the missing direct effect. Hence, the
total effect of human capital on patenting intensity turned out to be
a large positive effect (coefficients between 0.51 and 0.57, see
Table 3) in all the models. It is interesting to note that human
capital has a rather positive direct effect on institutional and gene-
ral trust, networks and civic participation, but a rather negative
direct effect on all factors describing norms.
As regards social capital, a statistically significant positive influen-
ce is exerted on patenting intensity by general trust and networks,
institutional trust, and civic participation. Among them, civic parti-
cipation has the largest effect. In models with the latent construct
of human capital and the years of education, the total effect (0.33
and 0.29, respectively) mainly comprises the direct effect, while in
the model with tertiary education, the somewhat smaller direct
effect is compensated by the positive indirect effect through R&D,
resulting in an analogical total effect (0.36). Both general trust and
networks, and institutional trust have a rather small but statistically
significant positive impact on patenting intensity (coefficients
ranging from 0.19 to 0.24 and from 0.18 to 0.26, respectively).
These are mainly direct effects, except the effect of general trust
and networks, which has a small positive indirect effect on
patenting intensity through R&D in the model with the years of
education as a measure of human capital. The norms of orderliness
turn out to have a significant negative total effect of medium size:
coefficients ranging from –0.33 to –0.39, which consists mainly of
the statistically significant direct effect. The norms of helping and
decency, and the norms of active social participation have no
statistically significant effect on patenting intensity.
Effects of different dimensions of social capital on innovation
25
Table 3.
Standardised total effects of factor
s on innovation (patenting intensity)
10
Measure of human capital
Latent construct
Tertiary education
Years of education
Model initial
(modified)
initial
(modified) initial
(modified)
R&D 0.46
(0.52)
0.52
(0.50)
0.42
(0.43)
Human capital
0.57
(0.53)
0.51
(0.52)
0.55
(0.52)
General trust and networks
0.19
(0.15)
0.24
(0.16) 0.21
(0.23)
Institutional trust
0.21
(0.2
1)
0.18
(0.20) 0.26
(0.22)
Norms of helping and decency
–0.
02
–0.
06
–0.
02
Norms of active social par
ticipation –0.
03
–0.
10
0.03
Norms of orderliness
–0.
33
(–0.31)
–0.
32
(–0.28)
–0.
39
(–0.40)
Civic participation
0.33
(0.31)
0.36
(0.43)
0.29
(0.26)
10
Unfortunately, it was not possible to obtain any indicators abou
t the statistical significance of the total effects in AMOS.
However, according to the results concerning
the direct effects, it can be assumed th
at the border value for significance at
the 0.01 level is around 0.19 and for significance at the 0.10
level around 0.13. Therefore,
except for the two factors of
social capital left out from modified models, all other tota
l effects can be considered as statistically significant.

Anneli Kaasa
26
7. DISCUSSION AND
IMPLICATIONS
The results of this paper provide significant support for the argu-
ment that social capital indeed influences innovative activity. Also,
the findings indicate that different dimensions of social capital
affect innovation in dissimilar ways. As expected, institutional
trust, general trust and networks have a positive, although rather
small, impact on innovation measured by patenting intensity.
These findings provide regional-level support to the results of the
firm-level study by Tsai and Ghoshal (1998). The results support
the idea that higher trust allows spending more time on innovative
activity (Knack and Keefer, 1997; Tamaschke, 2003). Although it
can be expected that higher trust also enables firms to spend more
finances on innovative activity, in two models out of three, the
effect of the factor including general trust on R&D turned out to be
statistically insignificant. This can be explained by the fact that this
factor also includes networks, which are not explicitly expected to
affect R&D expenditures. With regard to networks, the results
support the argument that both formal and informal networks
contribute to innovation. The results also show that among the
dimensions of social capital, civic participation has the strongest
positive effect on innovation measured by patenting intensity. The
positive effect of both institutional trust and civic participation
provide support for the argument that a reliable legal system is
accompanied by effective protection for the results of innovative
activity, which in turn stimulates innovative activity (Dakhli and
de Clercq, 2004; Tabellini, 2006). Until today, the impact of civic
participation has not received much attention in the literature as a
factor of innovation. This can be put down to the fact that many of
the studies published so far are firm-level studies, while civic
participation is rather a country-level concept. However, civic
participation can also be viewed as an indicator of participation
activity, which can be expected to influence innovation at the firm
level, too. Hence, in future research this dimension of social capital
should get more attention as a factor of innovative activity.

Effects of different dimensions of social capital on innovation
27
The norms of orderliness appeared to have a negative medium
effect on innovation measured by patenting intensity. This result
provides support to the findings of Dakhli and de Clercq (2004)
and confirms the idea that the norms of being a good citizen are
contradictory to creativity and thinking differently. The other
factors describing the norms of helping, decency, and active social
participation turned out to have no significant influence on
patenting intensity. Here, two implications can be pointed out.
First, it is rather the actual behaviour that matters, and not the
norms, whereas the norms may but need not guide the actual
behaviour. Second, the insignificance of some norms as factors of
patenting intensity can explain the little attention they have
received in the literature about the effect of social capital on
innovative activity. However, as some norms turned out to have a
significant negative influence, the effects of different norms on
innovation need to be analysed more thoroughly in the future.
Thus, different dimensions of social capital seem to influence inno-
vation in differing ways: although the impact is mostly positive,
some dimensions can have a negative impact. Therefore, the posi-
tive impact of some dimensions can be counteracted by the
negative impact of other dimensions, and if only the impact of
overall social capital is studied, the impact can seem relatively
small. Thus, the analyses that do not distinguish between the
dimensions of social capital may undervalue the impact of social
capital. These results provide support to Franke’s (2005) argument
about the risk of losing the explanatory power when grouping all
the dimensions of social capital together into one index.
With regard to policy implications, if only one measure of social
capital is used, the conclusion may easily be that there are no pos-
sibilities to encourage innovation through social capital. However,
if different dimensions of social capital are distinguished, there
may be some dimensions that have a strong impact on innovation.
Focussing on these dimensions, for example, on civic participation
or intentions to increase trust in institutions, may help foster
innovative activity. Consequently, it is not appropriate to test the
impact of social capital on innovation using one overall measure
comprising all the dimensions of social capital.

Anneli Kaasa
28
As expected, R&D turned out to have a large positive effect on
innovation measured by patenting intensity. The results with
respect to the direct effect of human capital are mixed. Human
capital appeared to have a significant positive direct effect on
patenting intensity only if measured by the average number of
years of education completed. If the percentage of labour force
with tertiary education or a latent construct including both
indicators were used, the direct effect turned out to be insignifi-
cant. There are several possible interpretations to that. First, the
different results can be caused by the different aspects captured by
the two indicators of human capital: it is likely that in the context
of innovative activity the overall educational level of the popula-
tion is more important than the spread of tertiary education. Se-
cond, the differences can be put down to the possible unreliability
of the indicator of the years of education, since it is drawn from a
survey with quite a low number of respondents in some regions.
Hence, one may rather trust the results of the model including only
the indicator of tertiary education. Unfortunately, no analogical
studies are available to enable comparison of the results. However,
two aspects should be pointed out. First, regardless of the different
results concerning the direct effect, in case of all model
specifications, the total effect of human capital appears to be the
same – positive and large as expected. Second, the differences
discussed do not significantly affect the results with respect to the
influence of social capital on patenting intensity. Hence, the con-
fusion with human capital and its measures should not be con-
sidered as decreasing the reliability of the findings about the
influence of different dimensions of social capital on innovation.
8. LIMITATIONS AND FUTURE
RESEARCH
Several limitations should be recognised with respect to this study.
Although the sample size of this study was larger than that of
analogical previous studies, it was still relatively small. Also, while
most of the countries were represented at the NUTS2 level, four
countries had to be included into the analysis at the NUTS1 level

Effects of different dimensions of social capital on innovation
29
because of data unavailability. It is possible that this imbalance in
representation may have caused some bias in the results. Thus, the
future availability of data for all countries at the NUTS2 or NUTS3
level would be very useful. Also, there are many missing data in
the data set compiled for this study. Here, new surveys and better
cooperation between the national statistical offices and some
central statistical institution are needed.
There are also some problems with respect to measurement. First,
measuring innovation is problematic. The number of patent
applications as a measure of innovation focusses only on one
aspect of innovation, failing to capture process innovations,
product modifications, or radicalness of innovation. It can be
assumed that social capital can have an even stronger impact on
the diffusion and adaptation of innovations. The current study is
not the only one suffering from this shortcoming. Hence, there
exists a strong motivation to develop and collect indicators
capturing other aspects of innovation, too, both at the national and
regional level. Also, the reliability of the measure of the overall
educational level of the population used in this study is question-
able. The indicator of the average years of education completed
was calculated on the basis of the European Social Survey, where
the number of respondents has been quite small in some regions.
Although the weights were used to ensure that the data would be
representative according to the demographic structure of regions,
this indicator may still by unreliable. Therefore, the question
remains if the differences in results concerning the direct effect of
human capital are due to the unreliable indicator or the fact that
different aspects of human capital have dissimilar impacts on
innovation. Hence, if a regional-level indicator based on the whole
population in Europe becomes available about the average years of
education, it would be interesting to rerun the analysis.
As noted before, although the results of this study refer to a strong
positive effect of civic participation on innovation, this influence
has not received much attention in the empirical research so far.
Hence, future research should lay more emphasis on this influence
and re-examine it. In addition, one more aspect that certainly
deserves further attention is the influence of different norms on
innovation. In the current study, the norms of orderliness appeared

Anneli Kaasa
30
to have a negative impact on patenting intensity, while the other
norms had no influence on it. However, if data describing more
different norms will become available, future studies could
supplement the findings and improve the understanding of the
influence of different norms on innovative activity.

9. CONCLUSIONS
In summary, this paper attempted to examine the impact of diffe-
rent dimensions of social capital on innovation, including also
human capital and R&D in the analysis as the factors of inno-
vation. It was assumed that different dimensions of social capital
might influence innovation in dissimilar ways. Therefore, instead
of one overall index, six factors were constructed of 20 indicators
of social capital. Because of multicollinearity, principal compo-
nents analysis had to be used instead of confirmatory factor ana-
lysis. After constructing the latent variables measuring social and
human capital, R&D and innovation measured by patenting
intensity, structural equation modelling was used to examine the
influences of social and human capital and R&D on innovation.
Besides the direct effects, the possible relationships between the
factors of innovation themselves were taken into account. Hence,
the conclusions are drawn on the basis of the total effects on
innovation.
The findings provide strong support for the argument that social
capital influences innovative activity. The results also show that
different dimensions of social capital have dissimilar effects on
patenting intensity. Among the dimensions of social capital, civic
participation, which has not received much attention in the
literature so far, appeared to have the strongest positive effect on
innovation measured by patenting intensity. Institutional trust,
general trust and networks turned out to have a positive, although
rather small, impact on patenting intensity. In keeping with the
author’s assumptions and previous results, the norms of orderliness
appeared to have a negative medium effect on patenting intensity.
The other factors describing the norms of helping, decency, and
active social participation turned out to have no significant
influence on patenting intensity. As the positive impact of some
dimensions of social capital can be compensated by the negative
impact of others, the analyses using only one overall index for
social capital are likely to undervalue the influence of social capital
on innovation. As expected, R&D turned out to have a large
positive effect on innovation. The results with respect to the direct

Anneli Kaasa
32
effect of human capital were mixed, but the total effect of human
capital appeared to be positive and large as expected.
This study has some limitations. Its sample size is relatively small
and has missing data. Also, the patent data capture only one aspect
of innovation. However, despite these deficiencies, this study indi-
cates that social capital has a significant impact on innovation and
that it is important to analyse this impact, distinguishing between
different dimensions of social capital. In the future, especially the
norms and civic participation will need further study as factors of
innovative activity.

REFERENCES
Abrahamson, E., Rosenkopf, L. (1997) ‘Social Network Effects on the
Extent of Innovation Diffusion: A Computer Simulation.’ Organi-
zation Science, Vol 8, No. 3, pp. 289–309.
Adler, P. S., Kwon S.-W. (2002) ‘Social capital: prospects for a new
concept.’ Academy of Management Review, Vol. 27, No. 1, pp.
17–40.
Akçomak, I. S., ter Weel, B. (2005) ‘How do social capital and
government support affect innovation and growth? Evidence from
the EU regional support programs’, Mimeo, Maastricht University.
Akçomak, I. S., ter Weel, B. (2006) ‘Social Capital, Innovation and
Growth: Evidence from Europe’, UNU-MERIT Working Paper,
No: 2006–040.
Arbuckle, J. L., Wothke, W. (1999) ‘Amos 4.0 User’s Guide.’ Chica-
go: SPSS, 452 p.
Chou, Y. K. (2006) ‘Three simple models of social capital and econo-
mic growth.’ The Journal of Socio-Economics, 35, pp. 889–912.
Coleman, J. S. (1988) ‘Social capital in the creation of human capital.’
American Journal of Sociology, Vol. 94 (suppl.), pp. S95–S120.
Dakhli, M., de Clercq, D. (2004) ‘Human capital, social capital, and
innovation: a multi-country study.’ Entrepreneurship & Regional
Development, 16, March, pp. 107–128.
Dee, Thomas S. (2004) ‘Are there Civic Returns to Education?’
Journal of Public Economics, Vol 88, pp. 697–720.
Denny, K. (2003) ‘The effects of human capital on social capital: a
cross-country analysis.’ The Institute for Fiscal Studies, WP03/16
Enders, C. K., Bandalos, D. L. (2001) ‘The Relative Performance of
Full Information Maximum Likelihood Estimation for Missing
Data in Structural Equation Models.’ – Structural Equation Mo-
deling, Vol. 8, No. 3, pp. 430–457.
European Communities (2007) ‘Nomenclature of territorial units for
statistics – NUTS Statistical Regions of Europe.’
[http://ec.europa.eu/comm/eurostat/ramon/nuts/
home_regions_en.html], 13.01.2007.
Eurostat (2007) ‘Regio.’
[http://epp.eurostat.ec.europa.eu/portal/page?_pageid=
1335,47078146 &_dad=portal&_schema=PORTAL], 13.01.2007.

Anneli Kaasa
34
Fountain, J. E. (1998) ‘Social capital: its relationship to innovation in
science and technology.’ Science and Public Policy, vol. 25, No.2,
pp. 103–115.
Franke, S. (2005) ‚Measurement of Social Capital. Reference Docu-
ment for Public Policy Research, Development, and Evaluation.’
[http://www.recherchepolitique.gc.ca/doclib/
Measurement_E.pdf], 16.01.2007.
Fukuyama, F. (2000) ‚Social Capital and Civil Society.’ International
Monetary Fund (IMF) Working Paper, WP/00/74.
Gregersen, B., Johnson, B. (2001), ‘Learning Economy, Innovation
Systems and Development.’ paper prepared for the ESST Conver-
ge project (“Strategies and policies for systemic interactions and
convergence in Europe – Converge”).
Harper, R., Kelly, M. (2003) ‚Measuring Social Capital in the United
Kingdom.’ Office for National Statistics.
[http://www.statistics.gov.uk/socialcapital/downloads/
harmonisation.pdf], 16.01.2007.
Hjerppe, R. (2003) ‘Social Capital and Economic Growth Revisited.’
VATT Discussion Paper, Government Institute for Economic
Research, Helsinki.
Hu, L.-T., Bentler, P. M. (1995) ‘Evaluating Model Fit.’ (1995) In R.
H. Hoyle (Ed.) Structural equation modeling: Concepts, issues and
application. Thousand Oaks, CA: Sage, pp. 76–99.
Jowell, R. and the Central Co-ordinating Team (2003) ‘European
Social Survey 2002/2003: Technical Report.’ London: Centre for
Comparative Social Surveys, City University.
Kline, R. B. (1998) ‘Principles and Practice of Structural Equation
Modeling.’ New York, NY: Guilford Press, 354 p.
Knack, S., Keefer, P. (1997) ‘Does social capital have an economic
payoff? A Cross-country investigation.’ Quarterly Journal of
Economics, Vol. 112, No. 4, pp. 1251–1288.
Landry R., Amara N., Lamari M. (2002) ‘Does Social Capital Deter-
mine Innovation? To What Extent?’ Technological Forecasting
and Social Change, Vol. 69, pp. 681–701.
Leana, C. R., van Buren III, H. J. (1999) ‘Organizational Social
Capital and Employment Practices.’ Academy of Management
Review, 24, pp. 538–555.
Lundvall, B.-A. (2006) ‚One Knowledge Base or Many Knowledge
Pools?’ DRUID Working Paper No. 06–8.
Maruyama, G. M. (1998) ‘Basics of Structural Equation Modeling.’
Thousand Oaks, CA: Sage, 311 p.

Effects of different dimensions of social capital on innovation
35
Nasierowski, W., Arcelus, F. J. (1999) ‘Interrelationships among the
elements of national innovation systems: A statistical evaluation.’
European Journal of Operational Research, 119, pp. 235–253.
Norwegian Social Science Data Services (2007). ‘European Social
Survey Data.’
[http://ess.nsd.uib.no/index.jsp?module=main&country=],
13.01.2007.
Portes A. (1998) ‘Social Capital: Its Origins and Application in Con-
temporary Sociology.’ Annual Review of Sociology, 24, pp. 1–24.
Putnam, R. (1995) ‘Bowling alone: America's declining social capi-
tal.’ Journal of Democracy, Vol. 6, No. 1, pp. 65–78.
Rodriguez-Pose A. (1999) ‘Innovation Prone and Innovation Averse
Societies: Economic Performance in Europe.’ Growth and
Change, Vol. 30, pp.75–105.
SPSS (2005) SPSS Base 14.0 User’s Guide.
[http://cmsprod.bgu.ac.il/NR/rdonlyres/838C0ECE-46F7-432B-
A503-BE016AFF689F/0/SPSSBaseUserGuide140.pdf],
13.01.2007.
Statsoft (2003) ‘Principal Components and Factor Analysis.’
[http://www.statsoft.com/textbook/ stfacan.html], 14.01.2007
Subramaniam, M., Youndt, M. A. (2005) ‘The influence of intellec-
tual capital on the types of innovative capabilities.’ Academy of
Management Journal, Vol. 48, No.3, pp. 450–463.
Tabellini, G. (2006) ‘Culture and Institutions: Economic Development
in the Regions of Europe.’ IGIER, Bocconi University
[http://www.dklevine.com/archive/
refs4321307000000000466.pdf], 16.01.2007.
Tamaschke, L. (2003) ‘The role of social capital in regional
technological innovation: seeing both the wood and the trees’, in
Huysman, M., Wenger, E., Wulf, W. (eds), Communities and
technologies, Deventer, Kluwer B.V.
Tsai, W., Ghoshal, S. (1998) ‘Social Capital and Value Creation: The
Role of Intrafirm Networks.’ Academy of Management Journal,
Vol. 41, No.4, pp. 464–476.
Whiteley, P. F. (2000) ‘Economic Growth and Social Capital.’
Political Studies, Vol. 48, 443–466.

Anneli Kaasa
36
KOKKUVÕTE
Erinevate sotsiaalkapitali dimensioonide mõju
innovatsioonile: analüüs regionaalsel tasemel Euroopas
Käesolevas artiklis analüüsitakse sotsiaalkapitali erinevate dimen-
sioonide mõju innovatsioonile, kaasates analüüsi ka uurimis- ja
arendustegevuse ning inimkapitali eeldatava mõju innovatsioonile.
Sotsiaalkapitali mõju innovatsioonile on viimase kümnendi jooksul
pälvinud teaduskirjanduses järjest enam tähelepanu. Siiski on selle-
alaseid empiirilisi uurimusi veel küllalt vähe. Üheks oluliseks
põhjuseks on arvatavasti sotsiaalkapitali mõõtmise keerukus. Esi-
teks, kuna sotsiaalkapitali kontseptsioon sisaldab palju erinevaid
dimensioone, ei ole seda võimalik mõõta vaid ühe näitajaga. Tei-
seks tuleb sotsiaalkapitali mõõtmiseks läbi viia eraldi uuringuid,
mida pole seni sotsiaalkapital mõiste uudsuse tõttu veel kuigi palju
tehtud. Käesolevas artiklis kasutatakse andmebaase ESS (European
Social Survey) ja Eurostat Regio. Seejuures kasutatakse võrreldes
varasemate analoogiliste uurimustega rohkem vaatlusi ja sobi-
vamat ajalist nihet innovatsiooni ja selle mõjurite näitajate vahel.
Erinevalt paljudest varasematest, regressioonanalüüsi kasutanud
uurimustest, võetakse käesolevas uurimuses tänu struktuurse mo-
delleerimise (structural equation modelling) kasutamisele arvesse
ka erinevate innovatsiooni mõjurite omavahelised mõjud.
Sotsiaalkapitali mõõtmiseks tuli multikollineaarsuse tõttu kinnitava
faktoranalüüsi asemel kasutada peakomponentide meetodit. Selle
tulemusena moodustus 20 sotsiaalkapitali näitaja alusel kuus fak-
torit: üldine usaldus ja võrgustikud, institutsionaalne usaldus,
kodanikuosalus, abistamise ja lojaalsusega, aktiivse osalusega ning
korralikkusega seostuvad normid. Samuti on peakomponentide
meetodil moodustatud innovatsiooni (täpsemalt patenteerimisinten-
siivsust), uurimis- ja arendustegevust ning inimkapitali kirjeldavad
muutujad.
Struktuurse mudeli hindamise tulemused kinnitavad esiteks, et
sotsiaalkapital mõjutab innovatsiooni, ja teiseks, et sotsiaalkapitali
erinevatel dimensioonidel on innovatsioonile erinev mõju.
Kodanikuosalus, mis ei ole seni kirjanduses eriti tähelepanu pälvi-

Effects of different dimensions of social capital on innovation
37
nud, osutus kõige rohkem innovatsiooni, täpsemalt patenteerimis-
intensiivsust positiivselt mõjutavaks sotsiaalkapitali dimensioo-
niks. Institutsionaalsel ja üldisel usaldusel ning võrgustikel ilmnes
samuti olevat positiivne, kuid nõrgem mõju patenteerimisintensiiv-
susele. Kooskõlas varasemate uurimuste ja teoreetiliste oletustega
ilmnes, et korralikkusega seostuvad normid avaldavad patentee-
rimisintensiivsusele negatiivset mõju. Teiste norme kirjeldavate
faktorite mõju patenteerimisintensiivsusele osutus statistiliselt eba-
oluliseks. Lisaks näitasid tulemused, et uurimis- ja arendustegevus
avaldab patenteerimisintensiivsusele oodatult tugevat positiivset
mõju. Inimkapitali otsene mõju patenteerimisintensiivsusele osutus
erinevaks sõltuvalt kasutatud inimkapitali näitajast, kuid kogumõju
osutus tugevaks positiivseks mõjuks kõigi inimkapitali näitajate
korral. Mainitud erinevused ei mõjutanud tulemusi sotsiaalkapitali
mõju osas innovatsioonile.
Kuna ühtede sotsiaalkapitali dimensioonide positiivset mõju inno-
vatsioonile vähendab teiste dimensioonide negatiivne mõju, võib
juhtuda, et kui kasutada vaid üht üldist sotsiaalkapitali kirjeldavat
indeksit, siis alahindavad tulemused sotsiaalkapitali tegelikku mõju
innovatsioonile. Seepärast tuleks edaspidises uurimistöös kindlasti
analüüsida erinevate sotsiaalkapitali dimensioonide mõju eraldi.
Appendix A.
Indicators measuring innovation inputs
and outputs, human and social capital.
Construct
Indicator
The exact name of i
ndicator according t
o the sour
ce
Source
Patent applications
Patent applications to the EP
O by priority year, per million labour force
Eurostat
High-tech patent applications
High-tech patent applications to the EPO by priority year, per million labour
force
Eurostat
Innovation
Biotechnology patent applications
Biotechnology patent applications to the EPO by priority year, per million
labour for
ce
Eurostat
R&D expenditure in the busi
ness sector
Total intramural R&D expenditure (GERD), business enterprise sector,
percentage of GDP
Eurostat
R&D expenditure in the government sector
Total intramural R&D expenditure (GERD), government sector, percentage
of GDP
Eurostat
R&D per
sonnel in the business sector
Total R&D personnel, business enterprise sector, percentage of total
employment
Eurostat
R&D (innovation
inputs)
R&D per
sonnel in the gover
nment sector
Total R&D personnel, gove
rn
ment sector, percentage of t
otal employment
Eurostat
Labour force with tertiary education
Tertiary education – levels 5–6 (ISCE
D 1997), percentage of population aged
15 and over
Eurostat
Human capital
Years of education completed
Years of
full-time education completed, average
ESS
Frequency of meeti
ng socially
How often socially meet with friends, relatives or colleagues, percentage at
least once a week
ESS
Informal networks
Importance of friends
Important in lif
e: friends, aver
age on scale 0–10
ESS
Membership in voluntary or
ganisations
Various
11
voluntary organisations, last 12 months: member, average number
of memberships per person
ESS
Formal networks/
social participation
Importance of voluntary organisations
Important in
life: voluntary organisations, average on scale 0–10
ESS
11
Trade unions, business/professional/farmers’ organisations, po
litical parties, sports/outdoor
activity clubs, cultural/hobby a
ctivity
organisations, religious/church organisations, consumer/automobile
organisations, humanitarian organisations etc., environmenta
l/
peace/animal organisations, science/education/teacher organi
sations, social clubs etc., other voluntary organisations.

Construct
Indicator
The exact name of i
ndicator according t
o the sour
ce
Source
Civic participation
Voting
Voted last nationa
l election, percentage of eligible
ESS
General trust
Most people can be trusted or you can't be too car
eful, aver
age on scale 0–10
ESS
Trust in fairness
Most people try to take advantage of
you, or try to be fair, average on scale 0–10
ESS
General trust
Trust in helpfulness
Most of the time people hel
pful or mostly looking out for themselves, aver
age
on scale 0–10
ESS
Trust in the legal s
ystem
Trust in the legal s
ystem, average on s
cale 0–10
ESS
Trust in politicians
Trust in politicians, average on scale 0–10
ESS
Satisfaction with the government
How satisfied w
ith the national government, average on s
cale 0–10
ESS
Institutional trust
Satisfaction with the democr
acy
How satisfied with the wa
y democracy works in country
, average on scale 0–10
ESS
Norm of helping and care
Important to help people and care for ot
hers’ well-being, percentage very much
like me/like me
ESS
Norm of loyalty and devotion
Important to be loyal to friends and de
vote to people close, percentage very
much like me/like me
ESS
Norm of s
upporting
To be a good citizen: how important to support people worse off, average on
scale 0–10
ESS
Norm of following rules
Important to do what is told and follow
rules, percentage very much like me/like
me
ESS
Norm of behaving properly
Important to behave pr
operly, percentage very much like me/like me
ESS
Norm of obeying laws
To be a good citizen: how important to always obey laws/regulations, average
on scale 0–10
ESS
Norm of activity in organisations
Good citizen: how important to be active in voluntary organisations, average on
scale 0–10
ESS
Norms of civic
behaviour
Norm of duty to vote
To be a good citizen: how impor
tant to vote in elections, average on scale 0–10
ESS

Appendix B.
Correlations and numbers of observations
of indicators included in the analysis
12
1. 2. 3. 4.
5. 6. 7.
8.
9.
10. 11. 12.
13. 14. 15.
1. P
ate
nt
applic
atio
ns
1
0.78
0.53
0.77
0.
34
0.75
0.14
0.45
0.45
0.36
0.32 0.60
0.12 0.22 0.48
2.
H
ig
h-
tec
h pat
ent a
pplic
ati
on
s
0.78
1
0.55
0.
68
0.26
0.65
0.14
0.35
0.48
0.
27
0.21 0.53
0.02 0.17 0.37
3.
B
iote
chn
ology
pate
nt a
pplic
atio
ns
0.53
0.55
1
0.51
0.41
0.48
0.29
0.51
0.45
0.14
0.18 0.51
0.00 0.12 0.31
4.
R
&
D e
xpendi
tur
e in the
busi
nes
s se
ct
or
0.77
0.68
0.51
1
0.40
0.87
0.16
0.45
0.40
0.20
0.31
0.55
–0.0
2
0.13
0.43
5.
R
&
D e
xpendi
tur
e in the
g
ov
er
nm
ent se
ct
or
0.34
0.26
0.41
0.40
1
0.31
0.72
0.45
0.33
–0.0
3
0.12 0.17
–0.0
6
–0.0
4 0.13
6.
R
&
D pe
rs
onnel in
t
he
busi
ne
ss
sec
tor
0.75
0.65
0.48
0.87
0.31
1
0.26
0.55
0.49
0.30
0.39 0.59
0.05 0.13 0.51
7.
R
&
D pe
rs
onnel in
t
he g
ov
er
nm
ent
sec
tor
0.14
0.14
0.29
0.16
0.72
0.26
1
0.29
0.10
–0.1
9
0.04 0.03
0.03 0.08
–0.0
1
8.
L
abour
f
or
ce w
ith t
er
tia
ry
e
duca
tion
0.45
0.35
0.51
0.45
0.45
0.55
0.29
1
0.54
0.42
0.46 0.62
0.03 0.00 0.60
9.
Y
ear
s of
e
duca
tion c
om
plet
ed
0.45
0.48
0.45
0.
40
0.33
0.49
0.10
0.54
1
0.13
0.19 0.63
–0.3
1
–0.0
7 0.47
10.
M
eet
ing
socia
ll
y
0.36
0.27
0.14
0.20
–0.
03
0.30
–0.1
9
0.42
0.13
1
0.46 0.55
0.46 0.16 0.68
11. I
m
por
tanc
e
of
fr
ie
nds
0.32
0.21
0.18
0.31
0.12
0.39
0.04
0.46
0.19
0.
46
1 0.43
0.14 0.05 0.46
12.
M
em
ber
ship i
n v
ol
untary
or
ga
ni
sat
ions
0.60
0.53
0.51
0.55
0.17
0.59
0.03
0.62
0.
63
0.55
0.43 1
0.00
0.23
0.76
13.
Im
por
tanc
e of v
olu
nta
ry
org
anisa
tions
0.12
0.02
0.00
–0.0
2
–0.0
6
0.05
0.03
0.03
–0.
31
0.46
0.14 0.00
1 0.36 0.17
14. V
oting
0.22
0.17
0.12
0.13
–0.0
4
0.13
0.08
0.00
–0.0
7
0.16
0.05 0.23
0.36
1 0.17
15. G
ener
al
tr
ust
0.48
0.37
0.31
0.43
0.13
0.51
–0.0
1
0.60
0.47
0.68
0.46 0.76
0.17 0.17
1
16.
T
rust in fai
rne
ss
0.50
0.42
0.40
0.49
0.25
0.53
0.03
0.63
0.57
0.60
0.43 0.77
0.01 0.04 0.88
17.
T
rust in he
lp
ful
ness
0.53
0.46
0.30
0.46
0.
18
0.49
–0.0
6
0.58
0.54
0.60
0.44 0.82
0.02 0.17 0.88
18.
T
rust in the
le
ga
l s
yste
m
0.51
0.36
0.31
0.
46
0.09
0.52
0.20
0.23
0.07
0.
28
0.30 0.46
0.27 0.59 0.43
19.
T
rust in p
oli
tici
ans
0.48
0.37
0.47
0.41
0.
13
0.49
0.08
0.47
0.35
0.39
0.30 0.66
0.14 0.36 0.69
20.
S
ati
sf
ac
ti
on w
it
h the g
ov
er
nm
ent
0.27
0.14
0.12
0.22
–0.0
4
0.31
–0.0
8
0.34
0.04
0.31
0.28 0.34
0.13 0.15 0.50
21.
S
ati
sf
ac
ti
on w
it
h the
de
m
ocr
ac
y
0.44
0.33
0.41
0.43
0.07
0.54
0.14
0.39
0.10
0.34
0.40 0.50
0.25 0.43 0.48
22.
N
or
m
of
he
lpi
ng
a
nd ca
re
–0.2
2
–0.1
7
–0.1
2
–0.
17
–0.0
7
–0.0
9
0.13
–0.0
3
–0.3
9
–0.
02
0.04 –0.3
2
0.44
0.24 –0.3
3
23.
N
or
m
of
l
oy
alt
y a
nd dev
otion
–0.0
2
0.03
–0.0
2
0.
03
0.02
0.09
0.17
–0.1
2
–0.2
0
–0.2
2
–0.0
2 –0.2
1
0.21
0.20 –0.3
5
24.
N
or
m
of
s
upp
or
ting
0.02
–0.1
1
–0.0
6
–0.0
2
0.
03
0.10
0.14
–0.0
1
–0.4
0
0.17
0.19 –0.1
1
0.49
0.33
0.01
25.
N
or
m
of
f
ollow
ing
r
ules
–0.4
4
–0.4
2
–0.1
8
–0.2
8
–0.
19
–0.2
2
0.05
–0.3
5
–0.3
7
–0.4
0
–0.1
4 –0.4
9
–0.0
5 –0.1
7 –0.4
5
26.
N
or
m
of
be
hav
ing
pr
op
er
ly
–0.5
2
–0.4
7
–0.3
4
–0.
42
–0.2
5
–0.3
8
0.03
–0.4
0
–0.4
6
–0.3
9
–0.3
0 –0.6
3
0.05 –0.0
1 –0.5
6
27.
N
or
m
of
o
bey
ing
law
s
–0.1
5
–0.1
9
–0.0
4
–0.1
5
–0.
11
–0.1
3
–0.0
9
–0.3
0
–0.0
8
–0.3
2
–0.
26
–0.2
2
–0.1
8
0.00 –0.1
9
28.
N
or
m
of
a
ct
iv
it
y in or
ganisa
tion
s
–0.0
7
–0.1
0
–0.0
6
–0.1
0
–0.0
9
0.02
0.01
–0.1
4
–0.3
1
0.23
0.01 –0.1
2
0.69
0.19
0.01
29.
N
or
m
of
d
uty
t
o v
ot
e
0.28
0.16
0.18
0.20
0.08
0.23
0.03
0.01
0.11
–0.
03
0.10 0.16
0.02 0.42 0.11
N
um
be
r
of
ob
ser
vat
ions
147 132 118
137
141
123
132
159
161
160
159 154
162 162 161
12
Correlation coefficients with absolute values higher than or equal to 0.22 are significant at the 0.01 level; for
significance at the 0.05 level and at the 0.10 level the
border values are 0.17 and 0.14, respectively (two-tailed).

Appendix B (continued).
Correlations and numbers of obs
ervations
of indicators
included in the analysis
13
16. 17. 18. 19.
20.
21.
22.
23.
24.
25.
26.
27.
28.
29.
1.
Paten
t app
licatio
ns
0.
50 0.
53 0.
51 0.48
0.
27
0.
44
–0.
22
–0.
02
0.02
–0.
44
–0.
52
–0.
15
–0.07 0.28
2.
Hig
h-tech
paten
t applicatio
ns
0.
42 0.
46 0.
36 0.37
0.
14
0.
33
–0.
17
0.
03
–0.11
–0.
42
–0.
47
–0.
19
–0.10 0.16
3. Biote
chn
ology
pa
tent ap
plicatio
ns
0.
40 0.
30 0.
31 0.47
0.
12
0.
41
–0.
12
–0.
02
–0.06
–0.
18
–0.
34
–0.
04
–0.06 0.18
4.
R&
D
e
xpe
ndi
tu
re
in
th
e
busi
ne
ss
se
ct
or
0.
49 0.
46 0.
46 0.41
0.
22
0.
43
–0.
17
0.
03
–0.02
–0.
28
–0.
42
–0.
15
–0.10 0.20
5.
R&
D
e
xpe
ndi
tu
re
in
th
e g
ov
er
nm
ent
se
ct
or
0.
25 0.
18 0.
09 0.13
–0.
04
0.
07
–0.
07
0.
02
0.03
–0.
19
–0.
25
–0.
11
–0.09 0.08
6.
R&
D
pe
rs
onne
l i
n t
he
busi
ne
ss
se
ct
or
0.
53 0.
49 0.
52 0.49
0.
31
0.
54
–0.
09
0.
09
0.10
–0.
22
–0.
38
–0.
13
0.02 0.23
7.
R&
D
pe
rs
onne
l i
n t
he
g
ov
er
nm
ent
se
ct
or
0.
03
–0.
06 0.
20 0.08
–0.
08
0.
14
0.
13
0.
17
0.14
0.
05
0.
03
–0.
09
0.01 0.03
8. L
abour
f
or
ce
w
ith
tertiar
y ed
ucatio
n
0.
63 0.
58 0.
23 0.47
0.
34
0.
39
–0.
03
–0.
12
–0.01
–0.
35
–0.
40
–0.
30
–0.14 0.01
9.
Year
s of
ed
ucation
c
om
pleted
0.
57 0.
54 0.
07 0.35
0.
04
0.
10
–0.
39
–0.
20
–0.40
–0.
37
–0.
46
–0.
08
–0.31 0.11
10
.
Meetin
g s
ociall
y
0.
60 0.
60 0.
28 0.39
0.
31
0.
34
–0.
02
–0.
22
0.17
–0.
40
–0.
39
–0.
32
0.23 –0.03
11
. Im
po
rtan
ce
of
f
rien
ds
0.
43 0.
44 0.
30 0.30
0.
28
0.
40
0.
04
–0.
02
0.19
–0.
14
–0.
30
–0.
26
0.01 0.10
12
.
Mem
bersh
ip in v
olu
ntar
y o
rg
an
isatio
ns
0.
77 0.
82 0.
46 0.66
0.
34
0.
50
–0.
32
–0.
21
–0.11
–0.
49
–0.
63
–0.
22
–0.12 0.16
13.
Im
por
ta
nc
e of v
ol
unt
ar
y org
ani
sa
tions
0.
01 0.
02 0.
27 0.14
0.
13
0.
25
0.
44
0.
21
0.49
–0.
05
0.
05
–0.
18
0.69 0.02
14
. Vo
ting
0.
04 0.
17 0.
59 0.36
0.
15
0.
43
0.
24
0.
20
0.33
–0.
17
–0.
01
0.
00
0.19 0.42
15. G
ene
ra
l tr
ust
0.
88 0.
88 0.
43 0.69
0.
50
0.
48
–0.
33
–0.
35
0.01
–0.
45
–0.
56
–0.
19
0.01 0.11
16
.
Tr
us
t in f
airness
1 0.
89 0.
28 0.60
0.
32
0.
34
–0.
38
–0.
33
–0.11
–0.
54
–0.
70
–0.
21
–0.18 0.10
17
.
Tr
us
t in help
fu
ln
ess
0.
89
1 0.
41 0.63
0.
42
0.
40
–0.
34
–0.
38
–0.13
–0.
62
–0.
70
–0.
22
–0.17 0.10
18
.
Tr
us
t in the leg
al s
ystem
0.
28 0.
41
1 0.64
0.
42
0.
72
0.
05
0.
06
0.35
–0.
23
–0.
21
0.
05
0.16 0.44
19
.
Tr
us
t in p
olitician
s
0.
60 0.
63 0.
64
1
0.
69
0.
70
–0.
19
–0.
28
0.05
–0.
31
–0.
40
0.
09
0.00 0.30
20
.
Satisf
actio
n wit
h the g
ov
ernm
ent
0.
32 0.
42 0.
42 0.69
1
0.
61
–0.
16
–0.
26
–0.02
–0.
24
–0.
19
0.
06
0.01 0.16
21
.
Satisf
actio
n wit
h the
de
m
ocrac
y
0.
34 0.
40 0.
72 0.70
0.
61
1
0.
10
0.
05
0.22
–0.
17
–0.
13
–0.
06
0.09 0.21
22.
N
or
m
of helpi
ng
a
nd c
ar
e
–0.
38 –0.
34
0.
05 –0.19
–0.
16
0.
10
1
0.
68
0.47
0.
32
0.
51
–0.
10
0.34 –0.10
23.
N
or
m
of loy
alt
y a
nd de
vo
tion
–0.
33 –0.
38
0.
06 –0.28
–0.
26
0.
05
0.
68
1
0.
340
.4
00
.5
00
.0
2
0.
23
0
.0
7
24.
N
or
m
of su
pp
or
ting
–0.
11
–0.
13 0.
35 0.05
–0.
02
0.
22
0.
47
0.
34
1
0.
33
0.
21
0.
14
0.67 0.35
25
.
No
rm
of
f
ollowin
g rules
–0.
54 –0.
62 –0.
23 –0.31
–0.
24
–0.
17
0.
32
0.
40
0.33
1
0.
73
0.
47
0.32 –0.01
26.
N
or
m
of beha
vi
ng
pr
op
er
ly
–0.
70 –0.
70 –0.
21 –0.40
–0.
19
–0.
13
0.
51
0.
50
0.21
0.
73
1
0.
35
0.31 –0.11
27.
N
or
m
of o
be
ying
law
s
–0.
21
–0.
22 0.
05 0.09
0.
06
–0.
06
–0.
10
0.
02
0.14
0.
47
0.
35
1
0.12 0.51
28.
N
or
m
of a
ctiv
it
y in or
ganisa
tion
s
–0.
18
–0.
17 0.
16 0.00
0.
01
0.
09
0.
34
0.
23
0.67
0.
32
0.
31
0.
12
1 0.19
29.
N
or
m
of d
ut
y to v
ote
0.
10 0.
10 0.
44 0.30
0.
16
0.
21
–0.
10
0.
07
0.35
–0.
01
–0.
11
0.
51
0.19
1
Nu
m
ber
of
o
bservatio
ns
161 161 161 161
160
162
146
146
155
145
144
154
156 153
13
Correlation coefficients with absolute values higher than or equal to 0.22 are significant at the 0.01 level; for
significance at the 0.05 level and at the 0.10 level the
border values are 0.17 and 0.14, respectively (two-tailed).

Appendix C.
Correlations of variables incl
uded in the structural model
14
1.
2.
3.
4.
5.
6.
7.
8.
9.
10.
1. I
nnov
ati
on
2. R&
D
0.67 *
**
3.
Hum
an c
apita
l (
lat
ent constr
uct)
0.49
**
*
0.62
**
*
4.
Ye
ar
s of e
ducat
ion c
om
pl
et
ed
0.53
**
*
0.50
**
*
0.88
**
*
5.
L
abour f
or
ce
wi
th t
er
ti
ary
e
duc
at
ion
0.36
**
*
0.54
**
*
0.88
**
*
0.54
**
*
6.
G
ene
ra
l t
rust
a
nd ne
tw
or
ks
0.39
**
*
0.
40
**
*
0.
56
**
*
0.43
**
*
0.
54
**
*
7. I
nsti
tuti
onal
tr
ust
0.13
0.16
0.
18
**
0.01
0.
35
**
*
0.
02
8.
Nor
m
s of hel
pi
ng
a
nd
dec
enc
y
–0.0
6
0.01
–0.3
1
***
–0.3
5
***
–0.1
6
*
–0.0
7
–0.0
2
9.
N
or
m
s of a
ct
iv
e soc
ia
l pa
rt
ic
ip
at
io
n
–0.
14
–0.
08
–0.
14
–0.3
8
***
0.
13
0.
19
**
0.
09
0.
10
10.
N
or
m
s of or
de
rl
in
es
s
–0.
26
**
–0.
15
–0.
25
***
–0.1
3
–0.
26
***
–0.
09
0.
02
0.
01
–0.
07
11.
Ci
vi
c
pa
rt
ic
ip
at
io
n
0.37 *
**
0.
33
**
*
0.
14
0.24
**
*
0.
01
0.
10
0.
06
0.
01
–0.
34
***
–0.0
6
*** significant at the 0.01 level, ** si
gnificant at the 0.05 level, * signific
ant at the 0.10 level (two-tailed).
14
Although the principal component method
enables avoiding the multicorrelation
problem, the correlation coefficients
between the factors of social capital are different from
0, because the pair-wise deletion method w
as used when
performing principal components analysis.

Appendix D.
Estimation results of the structur
al model (standardis
ed regression co
efficients): initial and modified
15
models
Measure of human capital used:
L
atent construct
Tertiary education
School years
Model:
Initial Modified
Initial Modified
Initial Modified
Dependent variable
Influencing variable
General trust and networks
Human capital
0.57
***
0.58
***
0.55
***
0.56
***
0.43
***
0.42
***
Institutional trust
Human capital
0.17
*
0.18
**
0.37
***
0.36
***
–0.01
Norms of helping and decency
Human capital
–0.33
***
–0.17
*
–0.36
***
Norms of active social participation
Human capital
–0.13
0.15
*
–0.39
***
Norms of orderliness
Human capital
–0.22
***
–0.23
***
–0.25
***
–0.25
***
–0.10
Civic participation
Human capital
0.11
–0.02
0.23
***
0.24
***
R&D
Human
capital
0.54
***
0.64
***
0.59
*** 0.58
*** 0.40
***
0.43
***
R&D
General trust and networks
0.11
0.09
0.24
**
0.24
**
R&D
Institutional
trust
0.03
–0.11
0.14
R&D
Norms of helping and decency
0.06
–0.01
0.04
R&D
Norms of active social participation
0.00
–0.07
–0.01
R&D
Norms of orderliness
–0.07
–0.04
–0.16
*
–0.16
*
R&D
Civic
participation
0.15
*
0.26
*** 0.30
*** 0.07
Innovation
R&D
0.46
***
0.52
***
0.52
*** 0.50
*** 0.42
***
0.43
***
Innovation
Human
capital
0.07
–0.06
0.19 **
0.18
**
Innovation
General trust and networks
0.14
*
0.15
**
0.20
***
0.16
**
0.11
0.13
*
Innovation Institutional
trust
0.19
***
0.21
***
0.24
*** 0.20
*** 0.20
***
0.22
***
Innovation
Norms of helping and decency
–0.05
–0.06
–0.04
Innovation
Norms of active social participation
–0.03
–0.06
0.03
Innovation
Norms of orderliness
–0.30
***
–0.31
***
–0.30
***
–0.28
***
–0.32
***
–0.33
***
Innovation
Civic
participation
0.27
***
0.31
***
0.23
*** 0.28
*** 0.26
***
0.26
***
15
When using the backward method, if all the paths begi
nning from a particular factor
of social capital had been
deleted, a path from human capital to this particular factor was also deleted

Measure of human capital used:
L
atent construct
Tertiary education
School years
Model:
Initial Modified
Initial Modified
Initial Modified
Dependent variable
Influencing variable
Squared multiple correlations of innovation
0.73
0.72
0.72
0.71
0.74
0.74
Fit
measu
res:
Discrepancy
/ df
2.86
0.65
2.46
1.39
2.90
0.39
Normed
fit
index
0.83
0.96
0.85
0.93
0.82
0.98
Incremental
fit
index
0.88
1.02
0.90
0.98
0.87
1.03
Comparative
fit
index
0.86
1.00
0.89
0.98
0.85
1.00
RMSEA
0.10
0.00
0.09
0.05
0.10
0.00
***
01.
0
≤
p
, **
05.
0
≤
p
, *
1.
0
≤
p
Wyszukiwarka
Podobne podstrony:
Ebsco Cabbil The Effects of Social Context and Expressive Writing on Pain Related Catastrophizing
the opportunity cost of social relations on the effectiveness of small worlds
The effects of social network structure on enterprise system success
The Role of Social Capital in Mitigating
Effect of Kinesio taping on muscle strength in athletes
53 755 765 Effect of Microstructural Homogenity on Mechanical and Thermal Fatique
Effect of File Sharing on Record Sales March2004
Effects of the Great?pression on the U S and the World
1 Effect of Self Weight on a Cantilever Beam
Possible Effects of Strategy Instruction on L1 and L2 Reading
Effect of magnetic field on the performance of new refrigerant mixtures
76 1075 1088 The Effect of a Nitride Layer on the Texturability of Steels for Plastic Moulds
Effect of he Environment on Westward Expansion
Effect of heat treatment on microstructure and mechanical properties of cold rolled C Mn Si TRIP
Effects of kinesio taping on proprioception at the ankle
Effect of Kinesio taping on muscle strength in athletes
53 755 765 Effect of Microstructural Homogenity on Mechanical and Thermal Fatique
Inhibitory effect of tea flavonoids on the ability of cell to oxidaze LDL
więcej podobnych podstron