
Figure 1 Example on complex surfaces. Left: A
circular surface with a hole in the middle. Right:
A surface with concavities on the edges.
ODEON - A DESIGN TOOL FOR AUDITORIUM
ACOUSTICS, NOISE CONTROL AND LOUDSPEAKER
SYSTEMS
C. Lynge Chr. Acoustic Technology, Ørsted●DTU, Denmark. e-mail:clc@oersted.dtu.dk
1. INTRODUCTION
The ODEON software was originally developed for prediction of auditorium acoustics. However
current editions of the software are not limited to these fields, but also allow prediction in rooms
such as churches and mosques, interior noise control, design of room acoustics and sound
distribution systems in public rooms such as foyers, underground stations and airports. Some of the
features in ODEON 5.0 Combined are; two methods for global estimation of reverberation time,
various point response calculations providing decay curves, reflectograms, miscellaneous
parameter graphs, 3D maps, multi-source calculations including point, line and surface sources,
facilities for noise control calculations and multi-channel auralization using fully filtered BRIR’s.
2. MODELLING
2.1 Modelling
Rooms
Room geometries to be used in ODEON can be
modelled in two ways, either the geometries
can be modelled in a CAD program such as
AutoCAD and imported into ODEON in the
DXF format or the geometries can be
scripted in ODEON’s parametric modelling
language. No matter the method of
modelling, a surface is obtained by connecting
points on surface's edge. Defining a
sequence of points will automatically define
both sides of the surface so there is no
need to worry about drawing the sequence
of points clock or counter-clock wise, even
surfaces with concave shapes are allowed, see figure 1. ODEON being fairly insensitive as to how
the user entered the model data is in particular an advantage when the geometry is supplied as a
DXF file by third parties, who can not be assumed to be aware of any such rules.
2.2
Modelling In the Odeon Modelling Language
The modelling language available to the ODEON user for modelling geometries is a versatile
scripting format [8]. The format can be used for simply entering geometries point by point and
surface by surface. To support the advanced user however, it is also possible to use constants,
variables, coordinate transformations and even programmatically scripts in order to create flexible
room models at high speed.
ODEON - a design tool for auditorium acoustics, noise control and loudspeaker systems – C. L.
Christensen
2.3
Checking The Geometry Of A Room Model
Creating a suitable geometry for
room acoustics calculations can
be a lengthy process, which
doesn’t necessarily end when a
nice looking model has been
created. One of the common
problems is that geometries
should be watertight. Another
problem, which may be less
obvious, is that geometries should
be consistent. ODEON has
several tools for verification of
geometries. To help finding leaks
in geometries, ODEON can
highlight free edges, display a
rendered surface geometry of the
room and indeed the ray-tracing
process can be visualized in a 3D
display in order to reveal leaks in the room or inappropriate source positions. To reveal surfaces,
which are by accident duplicated, surfaces that are partly overlapping other surfaces or warped
surfaces, ODEON provides a built in utility.
3. CALCULATIONS
AND
ALGORITHMS
ODEON Combined allows simulation of point, line and surface sources. Point sources are intended
for simulation of musical instruments, speakers, loudspeakers, small noise sources in industrial
environments etc. Line and surface sources are intended for the simulation of large vibrating noise
sources such as machinery in industrial environments. However, extended sources can also be
useful for simulation of sound transmitted into the room through windows, ventilation noise etc. Any
of the three source types can be used in all types of calculations available in ODEON.
3.1
Quick Estimate, Statistical formulas
For initial calculations e.g. while selecting appropriate
surface materials, the reverberation time can be
estimated using the Quick Estimate method, which
provides prompt estimates of the reverberation times
using statistical formulas. In order to estimate the
volume, ODEON runs a small ray tracing calculation,
from which the mean free path and thus the volume is
obtained. Finally ODEON calculates the reverberation
times using the Sabine, Eyring and Arau-Pachades
formulas. The user may as an option provide the
volume manually, if not satisfied with the estimate
derived from the mean free path.
0.00
5.00
10.00
15.00
20.00 metres
1
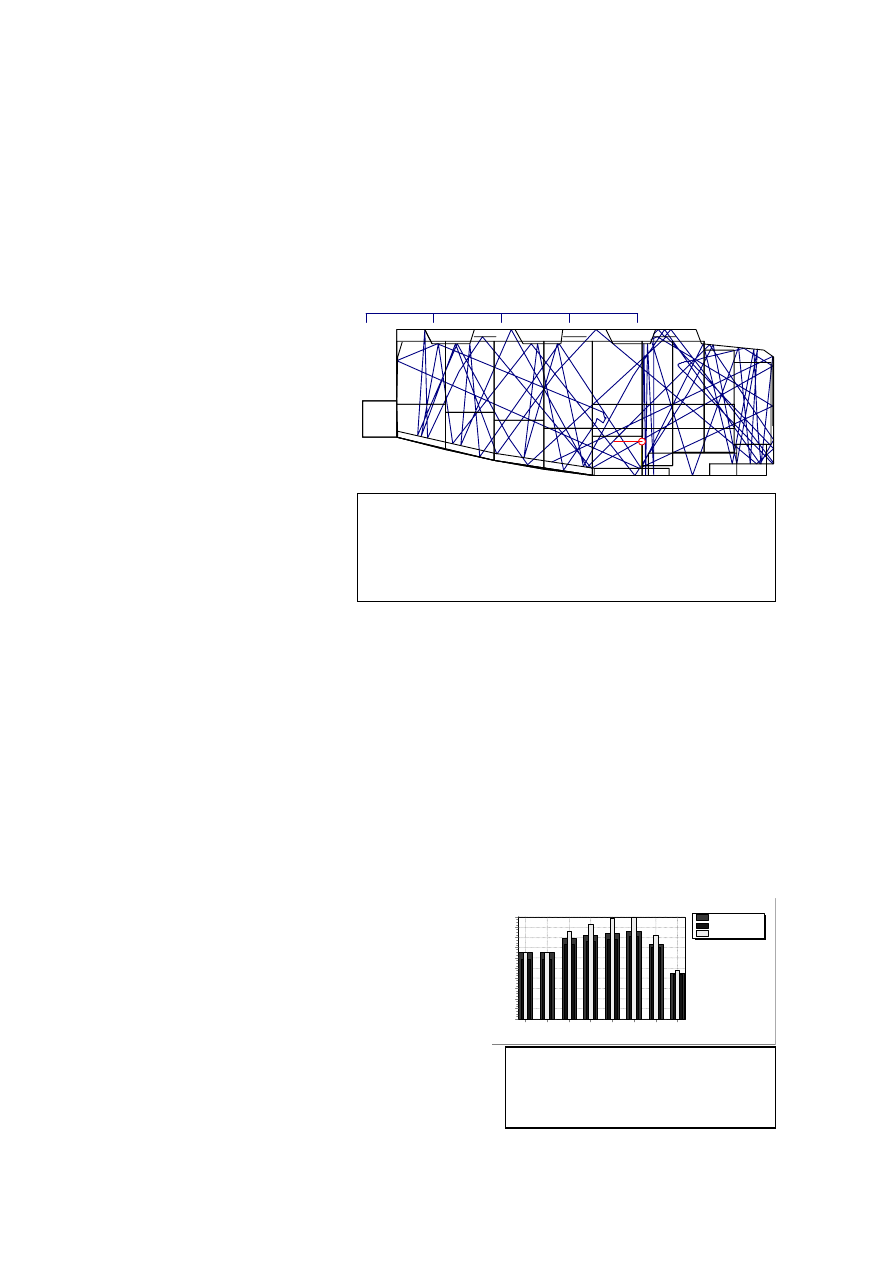
Figure 2 The 3DInvestigate Ray tracing display is one of
many tools that help the user to verify room geometries.
Following the interactive ray-tracing on screen makes it
easy so spot leaks in the geometry or inappropriate source
positions.
T Sabine
T Eyring
T Arau-Puchades
Quick estimated reverberation times (classic)
Frequency (Hz)
63
125
250
500
1000
2000
4000
8000
R
T
(
sec
onds
)
2
1,8
1,6
1,4
1,2
1
0,8
0,6
0,4
0,2
0
Figure 3 Quick Estimate provides
fast estimates of reverberation time
using different statistical formulas.
ODEON - a design tool for auditorium acoustics, noise control and loudspeaker systems – C. L.
Christensen
3.2 Global
Estimate
To get a global estimate of
reverberation time in a room, ODEON
also offers another method, which is
ray-tracing based. This method takes
into account the shape of the room,
location of the absorbing materials,
scattering properties of the materials
etc. To calculate the decay, ODEON
emits rays from a source, and then
calculates how the rays decay (on
average) due to absorption at surfaces
and due to air absorption. Unlike the
statistical methods this method also has
the advantage that it does not depend
on an estimated volume, which may or may not be correct. For rooms such as concert halls and
auditoria that are not dominated by strong decoupling, the reverberation time is a global measure
and in this case the global decay method provides a good estimate on the decay time in the room.
3.3 Point
Responses
3.3.1 Point Responses From Line And Surface Sources
To calculate the point response from a line or surface
source, ODEON applies a special ray tracing method [7].
Taking the surface source as the example this is how
the calculation method works; ODEON distributes a
number of secondary sources having a Lambert
directivity over (one of the sides) of a selected surface in
the room geometry, then a ray is radiated from each of
these secondary sources and reflected at the surfaces of
the room. The orientation of the reflected rays are
calculated as a weighted direction between a random
chosen direction (the random angles being distributed
according to the Lambert distribution [4]) and the
specular reflection direction, using the scattering
coefficient of the reflecting surface as the weighing
factor. Using the approach described each ray will
generate a number of secondary sources corresponding
to the number of times the ray was reflected plus one.
The last part of the calculation is related to a specific
receiver, at this point it is determined which of the
secondary sources are visible at the receiver point and the contribution of the visible secondary
sources are summed to the response of that receiver.
3.3.2 Point Responses From A Point Source
To calculate the point response from a point source, ODEON can either use a hybrid calculation
method (combining the image source method with special ray-tracing methods), which has been
proven to work well in rooms such as auditoria [5] that are not dominated by curved surfaces, or a
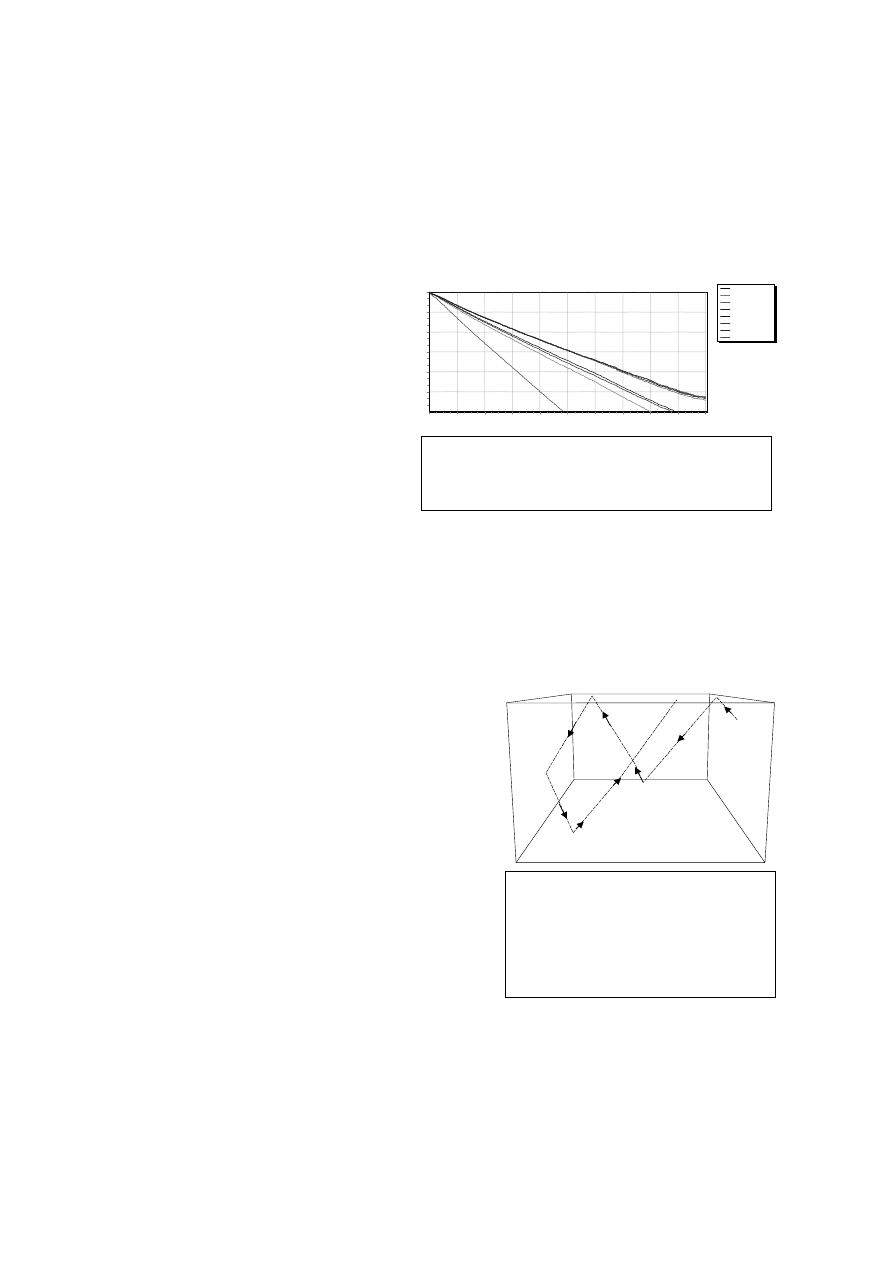
Surface
Source
Figure 3 Illustration of one out of
many rays radiated from a surface
source and the first reflections of that
ray. At each reflection point including
the start point, a secondary source is
generated.
T30,63=1.78 s
T30,125=1.58 s
T30,250=2.14 s
T30,500=2.14 s
T30,1000=2.16 s
T30,2000=2.14 s
T30,4000=1.69 s
T30,8000=0.95 s
Estimated global reverberation times (Source 1, 8934 rays used)
Estimated room volume:5626.58 m³
Time (seconds)
2
1,8
1,6
1,4
1,2
1
0,8
0,6
0,4
0,2
0
SPL
(
d
B)
0
-10
-20
-30
-40
-50
Figure 2 Global decay curves estimated using
the Global Estimate method takes into account
none diffuse conditions.

ODEON - a design tool for auditorium acoustics, noise control and loudspeaker systems – C. L.
Christensen
ray tracing method which yields better results in rooms such as churches or mosques [9], that are
dominated by curved surfaces. No matter which method is being used, a point source is described
by position, orientation, delay equalisation and a directivity pattern, allowing modelling of natural
sound sources, noise sources as well as loudspeaker systems with multiple active sources.
The ray-tracing method applied for point source calculations are similar to the method used for
surface and line sources except that the direct sound are emitted from one point (source) instead of
a number of secondary source points.
It is possible to select whether Odeon should use the hybrid calculation method or a pure ray-
tracing method, by adjusting a transition order, which determines the reflection order, at which the
calculation method changes from a hybrid calculation method that includes generation of image
sources to the pure ray-tracing method. The hybrid calculation method applied in ODEON is
described in by Rindel & Naylor [1,2] except that the current version of ODEON also includes
scattering for reflections below the transition order. In short the hybrid calculation method works as
follows, rays are emitted from the point source and for low order reflections, below the transition
order, rays are used indirectly in order to detect image sources while the program keeps track on
the image sources detected in order only to get one contribution from each image source. Above
the transition order the ray-tracing method, which is used for the line and surface sources, is used.
By nature the image source method does not include scattering so in order to include scattering in
the early reflections, the early reflection calculations is in fact a hybrid method on its own. In short;
Each time Odeon detects an image source, an inner loop of (scatter) rays are started, taking care of
the scattered sound which is reflected from this image source /surface.
Example: If all scattering coefficients in a room are 0.5, then the specular energy of a first order
image source is multiplied by (1-0.5) - and the specular energy of a second order IMS is multiplied
by (1-0.5)*(1-0.5). The scattering rays handle the rest of the energy. The early scatter rays are
handled in a way, which is indeed inspired by the way in which surface sources are simulated,
actually each time an image source is detected, ODEON will simulate a surface source, which will
emit a number of early scatter rays. The early scatter rays will be traced from the current reflection
order and up to the transition order. At each reflection point of the early scattering rays, including
the starting point, a secondary scattering source is created.
The last part of the point response calculation for a point source is, just as for the line and surface
sources, to examine which of the generated image and secondary sources are visible at the
receiver position. For the secondary sources generated by early scattering rays or by late rays, a
contribution is added to the point response, if the source is visible from the receiver. For the image
sources generated, a contribution is added to the point response if the entire reflection path from
the source to the receiver is unobstructed. The contributions added to the point response takes into
account:
• Directivity factor of the primary source in the relevant direction of radiation
• Reflection coefficients of the walls involved in generating the reflection (taking into account
the angle of incidence for the reflection)
• Air absorption due to the reflection path of the reflection
• Distance damping
• Diffraction damping due to limited size of the surfaces generating the reflection
Three different point responses are available in ODEON 5.0 Combined; Single Point, Multi Point
and Grid response. All three point response calculations share the calculation methods just
described and offer a number of calculated room acoustic parameters in receiver point(s) for a
given source configuration.
ODEON - a design tool for auditorium acoustics, noise control and loudspeaker systems – C. L.
Christensen
3.3.3 The Single Point Response Results
The Single Point response offers detailed results and auralization for a selected receiver point.
The Single Point Results are:
• Room acoustics parameters: EDT, T
30
, SPL, C
80
, D
50
, Ts, LF
80
, STI, A-Weighted Late
Lateral SPL(A), SPL(A), ST
early
, ST
late
and ST
total
.
• Decay curves.
• Reflectogram showing the early reflections, the strength per octave band, time of arrival,
azimuth and elevation angle. The reflectogram is directly coupled to the 3DReflection path
display.
• 3D Reflection paths display allows tracking down early reflections, which are calculated
using the image source method in a 3D display of the room geometry.
• A zoom able graph displaying the calculated BRIR (Binaural Room Impulse Response).
3.3.4 The Multi point response result
The Multi point response calculation calculates point responses for a number of discrete receivers.
Apart from offering room acoustic parameters for these receivers, the Multi point response also
provides a number of graphs and tools making it useful in particular for environmental acoustics:
• A noise control display, where the influence of the different active sources can be assessed
simultaneously at the different receiver positions.
• A graph showing the simulated spatial decay curves which are useful for evaluation of the
acoustics in workrooms [10].
• Graph showing parameter versus distance for a selected parameter.
• A graph showing a selected parameter for all receiver positions and frequency bands.
time (seconds rel. direct sound)
0,13
0,12
0,11
0,1
0,09
0,08
0,07
0,06
0,05
0,04
0,03
0,02
0,01
0
SP
L
(d
B)
-5
-10
-15
-20
-25
-30
-35
-40
-45
-50
-55
-60
Elevation
-20
-40
-60
-20
-40
-60
-50
-50
Azimuth
-20
-40
-60
-20
-40
-60
-50
-50
Frequency (Hz)
63
250
2000
-2,5
-3
-3,5
1
1
1
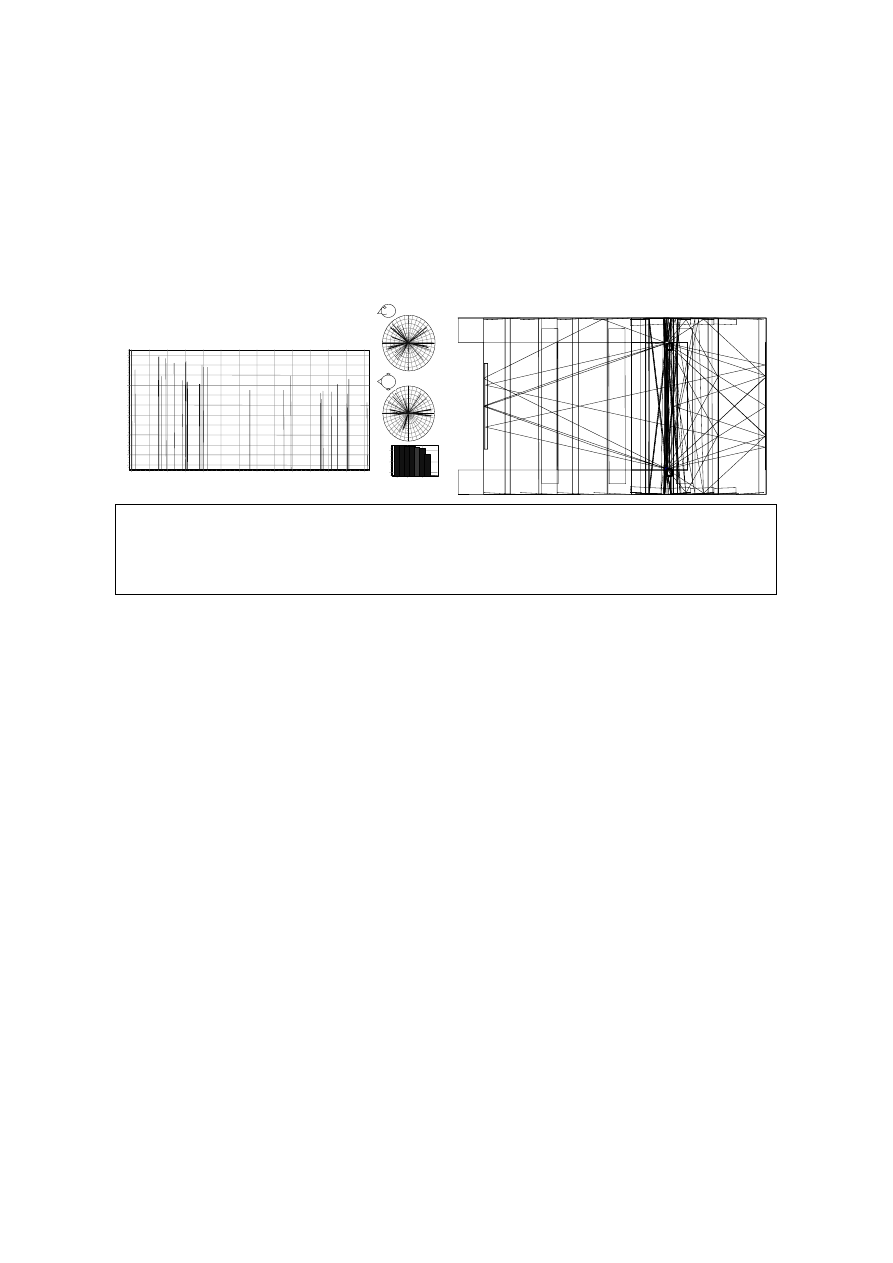
Figure 3 A few examples of the Single Point results. Early reflection paths displayed along with
its associated refectogram in a situation where a flutter echo is present. Individual reflections or
groups of refelctions can be examined in depth. ODEON is capable of predicting as well
auralizing echo problems even for high order reflections.
ODEON - a design tool for auditorium acoustics, noise control and loudspeaker systems – C. L.
Christensen
3.3.5 The Grid Response result
The Grid response is the calculated point responses for a grid of receivers. The receiver grid is
specified from a number of surfaces in the room geometry, a receiver distance and a receiver height
over the selected surfaces. A second graph, the cumulative distribution graph is also a result of the
Grid response calculation. The cumulative distribution graph gives the statistical overview of the
spatial variations over the receiver positions and often this will the graph to be used in the design
phase rather than the grid itself. The grid result contains all the calculated room acoustical
parameters and can be viewed in 3D from any view angle, with or without perspective etc. The user
may customize colour scales.
4. AURALIZATION
As a part of the point response calculations, ODEON is capable of creating BRIR’s (Binaural Room
Impulse Responses). The BRIR’s can be used for auralization either by listening directly to the
generated BRIR or by convolving an anechoic signal with the BRIR and listening to this result – as a
last option a number of such simulations can be combined together in order to form multi channel
auralization.
The typical point response calculated by
ODEON includes more than 100000
reflections per source. The calculation time
needed to create a BRIR (Binaural Room
Impulse Response), which is the key to the
auralization is typically less than 30 seconds
on a 600 MHz Pentium III. The calculation
carried out during the creation of the BRIR's
includes full filtering of each reflection in
nine octave bands (the 16 kHz band being
extrapolated) and applying a set of HRTF's
(Head Related Transfer Functions) for each
reflection. Using the complete filtering
scheme has several advantages apart from
sounding natural. Not only does the
auralization output allow evaluation of the reverberation time, level, speech intelligibility and clarity.
It also allows an evaluation of:
Cumulative distribution function
X(5,95) = (186, 731) X(10,90) = (411, 701) X(25,75) = (516, 652) X(50) = (579)
X(95)-X(5) = 545 X(90)-X(10) = 290 X(75)-X(25) = 136
Ts (ms) at 1000 Hz
800
750
700
650
600
550
500
450
400
Pe
rc
en
t
90
80
70
60
50
40
30
20
10
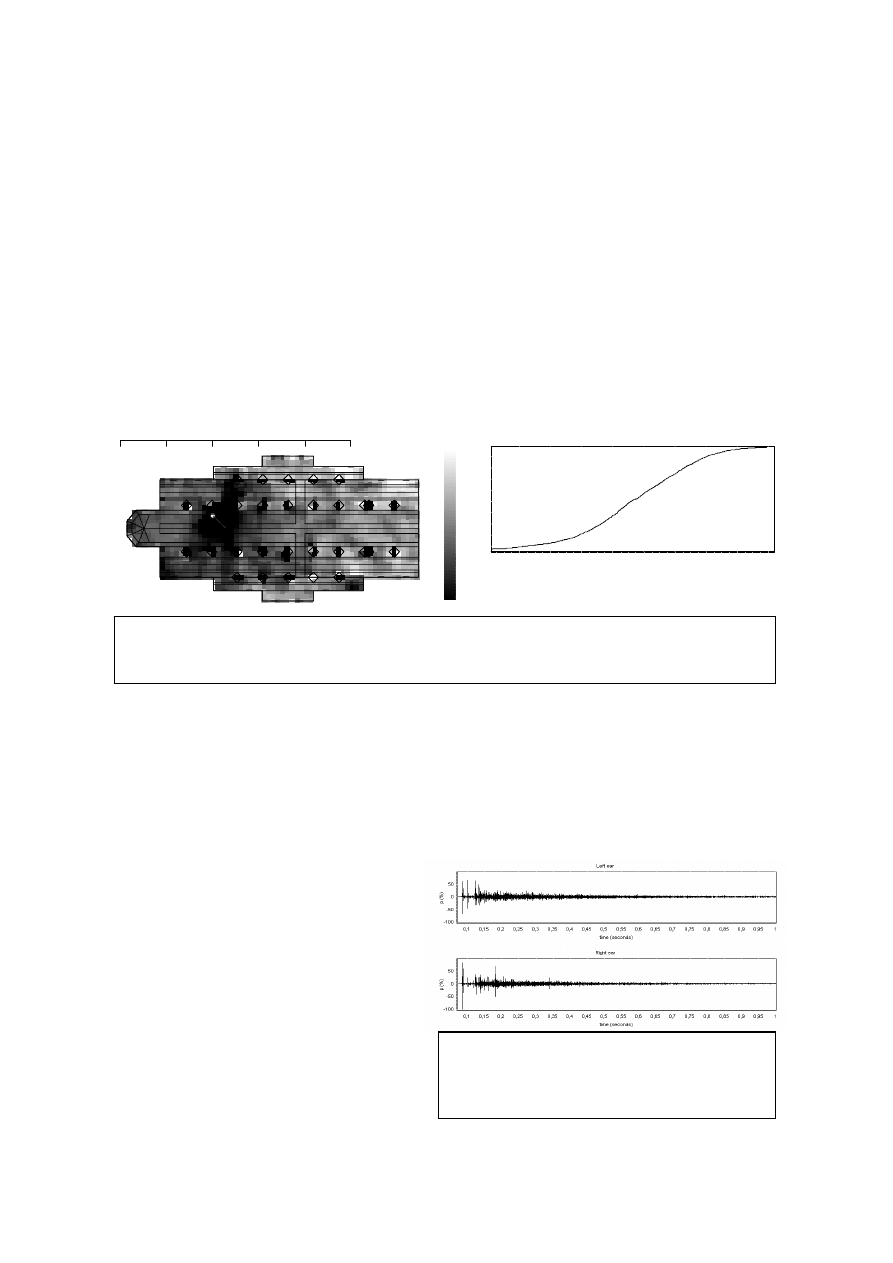
Figure 4 A Grid response result. The receiver grid and its corresponding cumulative distribution
graph for a selected parameter.
2
1
0.00
10.00
20.00
30.00
40.00
50.00 metres
708
664
620
576
532
488
444
Ts at 1000 Hz > 800
< 404
Figure 5 Example on a calculated BRIR. The
first 1.0 seconds of the BRIR at a receiver
position some 13 metres from the source in a
hall for chamber music are shown.
ODEON - a design tool for auditorium acoustics, noise control and loudspeaker systems – C. L.
Christensen
• High order echoes e.g. flutter echoes.
• Directivity and frequency response of sources.
• Envelopment (the experience of being surrounded by sound, very much relies on the lateral
reflections arriving later than 80 ms after the direct sound).
• Frequency dependent reverberation time. Frequency dependent reverberation is not a
question of a simple equalisation of the reverberation, the equalisation is time variant -
usually the sound will get darker as the sound decays - a very dominant feature of rooms
with extreme reverberation times (cathedrals, mosques etc.).
• Modulated decay. Long decays in rooms such as cathedrals often has ripples on the late
decay rather than a smooth decay.
4.1
Verifying the auralization filters
A question that appears when using an auralization system is whether the system is actually
capable of auralizing the acoustic properties, which has been predicted by the room acoustic
program. A simple way of testing this issue is to simply measure the room acoustics parameters on
the impulse response filters created by the room acoustics program, using a room acoustics
measuring program capable of analysing an impulse response in the Windows wave format and
then compare the room acoustic parameters predicted by the prediction program with those
measured on the auralization filters.
Below is a comparison of room acoustics parameters predicted by ODEON, and those measured on
the auralization filters
using the Dirac [11] measuring program. Models of two very different rooms
were used for the comparison; a model of the Elmia multi purpose, which were used in the 2
nd
Round Robin on Room Acoustical Computer Simulation [6] as well as a model of a very reverberant
church (the Grundtvigs church, Copenhagen, Denmark). For each of the rooms two receiver
positions are shown, one close and another far from the source. As can be seen from the results,
the predicted and measured parameters are very close; eventually the average error is far below
one subjective limen [6] even though the filters tested are for very different room acoustic
conditions. It should be remembered that the test is really a cross test of the ODEON auralization
filters as well as the measuring program.
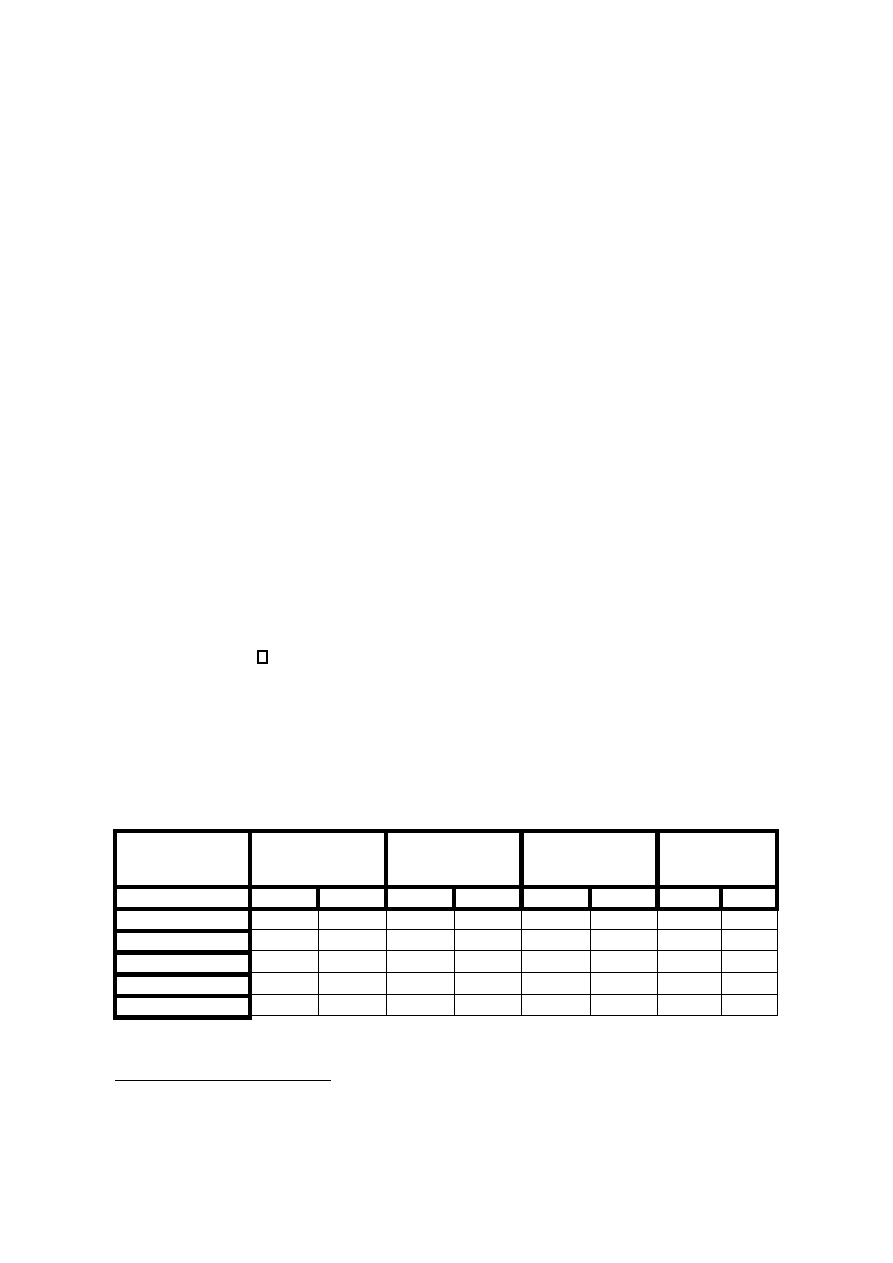
Parameter/room
Grundvigs church
d
s-r
= 5.6 metres
Grundvigs church
d
s-r
= 44 metres
Elmia
d
s-r
= 5.3 metres
Elmia
d
s-r
= 30.7
metres
Odeon Dirac Odeon Dirac Odeon Dirac Odeon
Dirac
EDT
6.20 7.68 9.06 9.59 1.43
1.44
1.85
1.74
T30 7.61 7.94 7.32 7.85 1.97
1.98
1.83
1.85
C80 -1.2 -0.66
-10.3 -10.3 3.3 4.65 -2.2 -2.18
D50
0.39 0.39 0.06 0.07 0.58 0.66 0.19 0.20
Ts
362 353 670 711.9 79
64.3 137
139
Table 1 Room acoustic parameters at 1000 Hz predicted by ODEON and measured from the
simulated impulse responses using the Dirac program.
1
A special set of head related transfer functions (HRTF’s) were used in order to simulate an omni
directional measuring probe rather than a dummy head. Also reflections were added to the impulse
response using random phase in order to simulate a simple DC filter. The DC filtering would
normally be included in the HRTF filters.

ODEON - a design tool for auditorium acoustics, noise control and loudspeaker systems – C. L.
Christensen
5. REFERENCES
[1] G.M. Naylor, Treatment of Early and Late Reflections in a Hybrid Computer Model for Room
Acoustics. 124th ASA Meeting, New Orleans 1992. Paper 3aAA2.
[2] J.H. Rindel & G.M. Naylor, Predicting Room Acoustical Behaviour with the ODEON Computer
Model. 124th ASA Meeting, New Orleans 1992. Paper 3aAA3.
[3] G.M. Naylor, ODEON - Another Hybrid Room Acoustical Model. Applied Acoustics Vol. 38, 1993,
p. 131-143.
[4] J.H. Rindel, Computer Simulation Techniques for Acoustical Design of Rooms. Acoustics
Australia 1995, Vol. 23 p. 81-86.
[5] M. Vorländer, "International Round Robin on Room Acoustical Computer Simulations" Proc. 15
th
International Congress on Acoustics, Trondheim, Norway (1995) vol.II pp. 689-692.
[6] Ingol Bork, A Comparison of Room Simulation Software – The 2
nd
Round Robin on Room
Acoustical Computer Simulation, Acta Acoustica, Vol. 86 (2000), p. 943-956.
[7] Claus Lynge Christensen, Hans Torben Foged, A room acoustical computer model for industrial
environments - the model and its verification. Euro-noise 98, München, Proceedings p.671-676,
1998.
[8] Claus Lynge, Odeon Room Acoustics Program, Version 5.0, User Manual, Industrial, Auditorium
and Combined Editions, Department of Acoustic Technology, Technical University of Denmark,
Lyngby, August 2001. (77 pages).
[9] Christoffer A. Weitze, Claus Lynge Christensen, Jens Holger Rindel and Anders Christian Gade,
Computer Simulation of the Acoustics of Mosques and Byzantine Churches. 17th ICA, Rome.
September 2 - 7, 2001. Proceedings /CD_ROM.
[10] ISO/ DIS 14257:1999, Acoustics - Measurement and modelling of spatial sound distribution
curves in workrooms for evaluation of their acoustical performance.
[11] The Dirac home page
http://www.acoustics-engineering.com
[12] The ODEON home page
Document Outline
Wyszukiwarka
Podobne podstrony:
dpf doctor diagnostic tool for diesel cars function list
how to use the flash tool for Xperia
Design Guide 03 Serviceability Design Considerations for Low Rise Buildings
dpf doctor diagnostic tool for diesel cars function list
Rindel MODELLING IN AUDITORIUM ACOUSTICS Sevilla 2002 Rindel 8p
PCB Layout Design Guide for Analog Applications
Solid phase microextraction as a tool for trace element spec
Wind Turbine Acoustic Noise
Eurocode 8 Part 4 1998 2006 Design of tructures for Earthquake Resistance Silos, Tanks and Pipe
Eurocode 8 Part 6 1998 2005 Design of Structures for Earthquake Resistance Towers, Masts and Ch
HS SPME a tool for new insights into the long term thermo
Noxon Auditorium Acoustics 104
TTAnalyze A Tool for Analyzing Malware
AES Information Document For Room Acoustics And Sound Reinforcement Systems Loudspeaker Modeling An
IEC 61400 11 (2002) [Wind turbine generator systems Acoustic noise measurement techniques] [WIND][5
więcej podobnych podstron