
CWB-2/2007
57
D. Damidot
1
, F. Bellmann
2
, B. Möser
2
, T. Sovoidnich
2
1
Civil and Environmental Engineering Department - Ecole des Mines de Douai
2
Finger Institute, Weimar, Germany
Obliczenie szybkości rozpuszczania krzemianu trójwapniowego
w roztworach elektrolitów o różnym składzie
Calculation of the dissolution rate of tricalcium silicate in several
electrolyte compositions
1. Introduction
The hydration of tricalcium silicate (C
3
S) proceeds through a the
dissolution-precipitation process as explained a long time ago by
H. Le Chatelier (1). The driving force of hydration is the difference
in solubility between C
3
S that dissolves and the hydrates, calcium
silicate hydrate (C-S-H) and portlandite (CH) that precipitate: the
solubility of C
3
S is higher than the one of the hydrates. Thus the
kinetics of the hydration of C
3
S, is the consequence of a compe-
tition between the dissolution of C
3
S and the precipitation of the
hydrates. As a consequence the different hypothesis developed in
order to explain the specifi c kinetics of C
3
S hydration that presents
two kinetic steps (2-3) have been focused either on dissolution or
on precipitation.
Hypothesis originated from observation of the C
3
S surface at
different ages with several techniques are based on the obser-
vation of the formation of an hydration product on the surface of
C
3
S (4-6). Thus some authors have considered that this primary
hydration product completely covers the surface of the C
3
S and
determines the continuation of the hydration by its permeability
that can be correlated to its later transformation or progressive
destruction (7-9).
Other authors have focused their work on precipitation that can
be described from nucleation and growth classical theories. The
1. Wprowadzenie
Hydratacja krzemianu trójwapniowego (C
3
S) przechodzi przez
proces rozpuszczania – wytrącania jak to wyjaśnił wiele lat temu
H. Le Chatelier (1). Siłą napędową hydratacji jest różnica roz-
puszczalności: C
3
S, który się rozpuszcza i hydratów: uwodniony
krzemian wapniowy (C-S-H) i portlandyt (CH), które się wytrącają.
Rozpuszczalność C
3
S jest większa od rozpuszczalności hydratów.
Z tego powodu szybkość rozpuszczania C
3
S jest wynikiem dyna-
micznej zależności pomiędzy rozpuszczalnością C
3
S i strącaniem
hydratów. Jako konsekwencja powstały różne hipotezy wyjaśnia-
jące dwa stadia w szybkości hydratacji C
3
S (2-3), które biorą pod
uwagę albo rozpuszczania albo wytrącanie.
Hipotezy wywodzące się z obserwacji powierzchni C
3
S w różnym
okresie i przy użyciu różnych metod i analizowania powstawania
produktu hydratacji na powierzchni C
3
S (4-6). Niektórzy autorzy
uważali, że ten pierwotny produkt hydratacji pokrywa całkowicie
powierzchnię C
3
S i umożliwia postęp hydratacji dzięki swojej
przepuszczalności, która może być skorelowana z jej późniejszą
przemianą lub sukcesywnym zniszczeniem (7-9).
Inni autorzy zwrócili uwagę w swoich pracach na wytrącanie,
które można opisać w oparciu o klasyczną teorię zarodnikowania
i wzrostu kryształów. Strącanie C-S-H było przedmiotem wielu
badań w porównaniu ze strącaniem CH. Skład roztworu wodnego,
MIĘDZYNARODOWE CZASOPISMO NAUKOWE
POŚWIĘCONE ZAGADNIENIOM CHEMII
I TECHNOLOGII MATERIAŁÓW WIĄŻĄCYCH I BETONU
ROK XII/LXXIV
MARZEC – KWIECIEŃ 2007 r.
Nr 2
Organ Stowarzyszenia Producentów Cementu

58
CWB-2/2007
który wywołuje natychmiastowe strącanie C-S-H w porównaniu
do roztworu wodnego, który występuje przed okresem strącania,
był wyznaczony doświadczalnie: granica pomiędzy tymi dwoma
obszarami została nazwana przez Barreta (10) krzywą maksy-
malnego przesycenia C-S-H. Na podstawie tych doświadczeń
Barret rozważał zależności kinetyczne w celu wyjaśnienia okresu
indukcji, którego koniec zależy od umownego autokatalitycznego
procesu spowodowanego efektem zarodkowania związanym
z powstawaniem coraz większej ilości zarodków (10-11). Opierając
się na tej hipotezie Gauffi net i Nonat (12-13) opracowali udany
model kinetyki hydratacji C
3
S w różnych warunkach stosując
tylko trzy parametry: pierwszym jest początkowa liczba zarodków
(utworzona na początku strącania C-S-H), a ostatnie dwa opisują
sposób wzrostu C-S-H, który jest różny dla każdego z dwóch eta-
pów kinetycznych. Te dwa procesy, które zostały wzięte pod uwagę
w celu modelowania wzrostu są następujące: pierwszy szybkość
wzrostu klastersów na powierzchni (nazwany wzrostem równole-
głym), a drugi szybkością wzrostu grubości klastersów (nazwany
wzrostem prostopadłym). Dobra zgodność krzywej modelowej
z doświadczalną wydaje się potwierdzać, że okres indukcji jest
spowodowany zarodkowaniem i wzrostem klastersów C-S-H na
powierzchni zharmonizowany z szybkością rozpuszczania.
Z drugiej strony mniej uwagi poświęcono rozpuszczaniu i nie
ma wyjaśnienia czy szybkość rozpuszczania może być powolna
w warunkach hydratacji (i stąd wynika mała szybkość strącania
C-S-H podczas okresu indukcji) czy też jest ona spowolniona innym
mechanizmem takim jak strącanie warstwy na powierzchni.
Przede wszystkim rozpuszczanie ciał stałych ma złożony mecha-
nizm, traktujący powierzchnię jako zdefektowany kryształ. Ponadto
w fazie ciekłej powierzchnia minerału jest poddawana protonacji
i adsorpcji bardziej lub mniej złożonych cząsteczek uwodnionych
co można obecnie wyznaczać opierając się na różnych teoriach
dotyczących mechanizmu sorpcji (14-16). Rozpuszczalność jest
często szybsza w pewnych zdefektowanych centrach oraz na
wierzchołkach iglastych kryształów (17-18). Na poziomie makro-
skopowym Barret opisuje proces rozpuszczania C
3
S jako reakcję
na granicy faz C
3
S – cząsteczki wody i nazywa ją powierzchniową
hydroksylacją (19-20): rozpuszczanie jest powtarzającymi się
sekwencjami etapów na granicy faz; jak w przypadku pewnych
innych minerałów, najpierw następuje nieodwracalna reakcja
centrów powierzchniowych z cząsteczkami wody, a następnie
odwracalny etap polegający na przejściu utworzonych cząsteczek
z powierzchni C
3
S do roztworu.
Inna trudność wynika z faktu, że rozpuszczalność C
3
S nie może
być wyznaczona doświadczalnie gdyż hydraty strącają się przed
jej osiągnięciem, jako że zakres ich maksymalnego przesycenia
zostaje osiągnięty. Jednak rozpuszczalność C
3
S można osza-
cować w oparciu o jego swobodną energię rozpuszczania i jest
ona bardzo duża: pomiędzy 1,4 a 2,9 mola/kg w zależności od
wykorzystanych danych swobodnej energii Gibbsa reakcji i za-
stosowanego modelu korekcji aktywności.
W związku z tymi trudnościami zaprojektowaliśmy specjalne
urządzenie do badania początkowej szybkości rozpuszczania C
3
S
precipitation of C-S-H has been largely investigated compared
to CH precipitation. Aqueous phase compositions that induce an
immediate precipitation of C-S-H compared to aqueous phase
that present an induction period before precipitation have been
determined experimentally: the boundary between these two
domains has been named by Barret, maximum supersaturation
curve of C-S-H (10). From these experiments, Barret just consi-
dered kinetic features in order to explain the induction period, the
end of which, depends on a conventional autocatalytic process
induced by a seeding effect of more and more numerous nuclei
formed (10-11). Using this hypothesis, Gauffi net and Nonat (12-13)
were able to simulate accurately the kinetics of C
3
S hydration in
different conditions by using just three parameters: the fi rst one is
the initial number of nuclei (formed during the early precipitation of
C-S-H) and the two last describe the growth mode of C-S-H which
is different for each of the two kinetic steps. The two processes that
were taken into account to simulate the growth are, fi rst, the rate
of growth of clusters on the surface (named parallel growth) and
second, the rate of the increase of the cluster thickness (named
perpendicular growth). The good agreement obtained between
simulated and experimental curves, seems to support an induction
period governed by the nucleation and growth of clusters of C-S-H
on the surface with a dissolution rate tuned accordingly.
On the other hand less attention has been devoted to the dissolu-
tion and it seems yet diffi cult to know if the rate of C
3
S dissolution
can be slow in the hydration conditions (and thus follows a slow
precipitation rate of C-S-H during the induction period) or if it slows
down by an alternative mechanism such as the precipitation of
a layer at its surface.
First of all, dissolution of solids is a complex mechanism that
deals with the surface that can be considered as a crystal with
defects. Moreover in aqueous phase, the surface of mineral is
subjected to protonation and adsorption or more or less complex
aqueous species that can now be approached by different the-
ories in relation with sorption mechanisms (14-16). Dissolution
is often more intense in some defects and sometimes some tips
can be observed (17-18). From a macroscopic approach, Barret
described the dissolution process of C
3
S as an interfacial reaction
of C
3
S with water molecules and called it superfi cial hydroxylation
(19-20): dissolution is a repeating sequence of interfacial steps as
it is the case for some other minerals; fi rst an irreversible attack of
superfi cial sites of C
3
S by water molecules, then a reversible step
resulting in the passage of the formed species from C
3
S surface
into solution.
Another diffi culty arises from the fact that C
3
S solubility cannot be
reached experimentally as the hydrates precipitates before its attain-
ment because their maximum supersaturation domains are reached.
However C
3
S solubility can be estimated from its Gibbs’ free enthalpy
of dissolution, and it appears to be very high: between 1.4 and 2.9
mol/kg depending on the data used to calculate the Gibbs’ free energy
of reaction and the model used for the activity correction.
As a consequence, we have designed a specifi c device to assess
the initial dissolution rate of C
3
S in specifi c aqueous phase. Indeed
CWB-2/2007
59
w różnych roztworach wodnych. W rzeczywistości bowiem skład
roztworu elektrolitu może mieć bardzo duży wpływ, taki jak na
przykład stwierdzono w przypadku rozpuszczania szkła (21).
2. Materiały i metody
Podstawowym pomysłem było stworzenie możliwości utrzymy-
wania na powierzchni C
3
S roztworu wodnego o stałym i znanym
składzie tak, jak to miało miejsce w doświadczeniach Lecoqa
(22) i Gaufi net (12). Po drugie celem było spowolnienie jak to
tylko możliwe powstawanie hydratów na powierzchni w wyniku
heterogenicznego zarodkowania w szczególności C-S-H przez
stworzenie szybkiego spłukiwania powierzchni ziaren szybkim
przepływem konwekcyjnym roztworu wodnego wykorzystując złoże
C
3
S na fi ltrze połączonym z próżnią tak jak w doświadczeniach
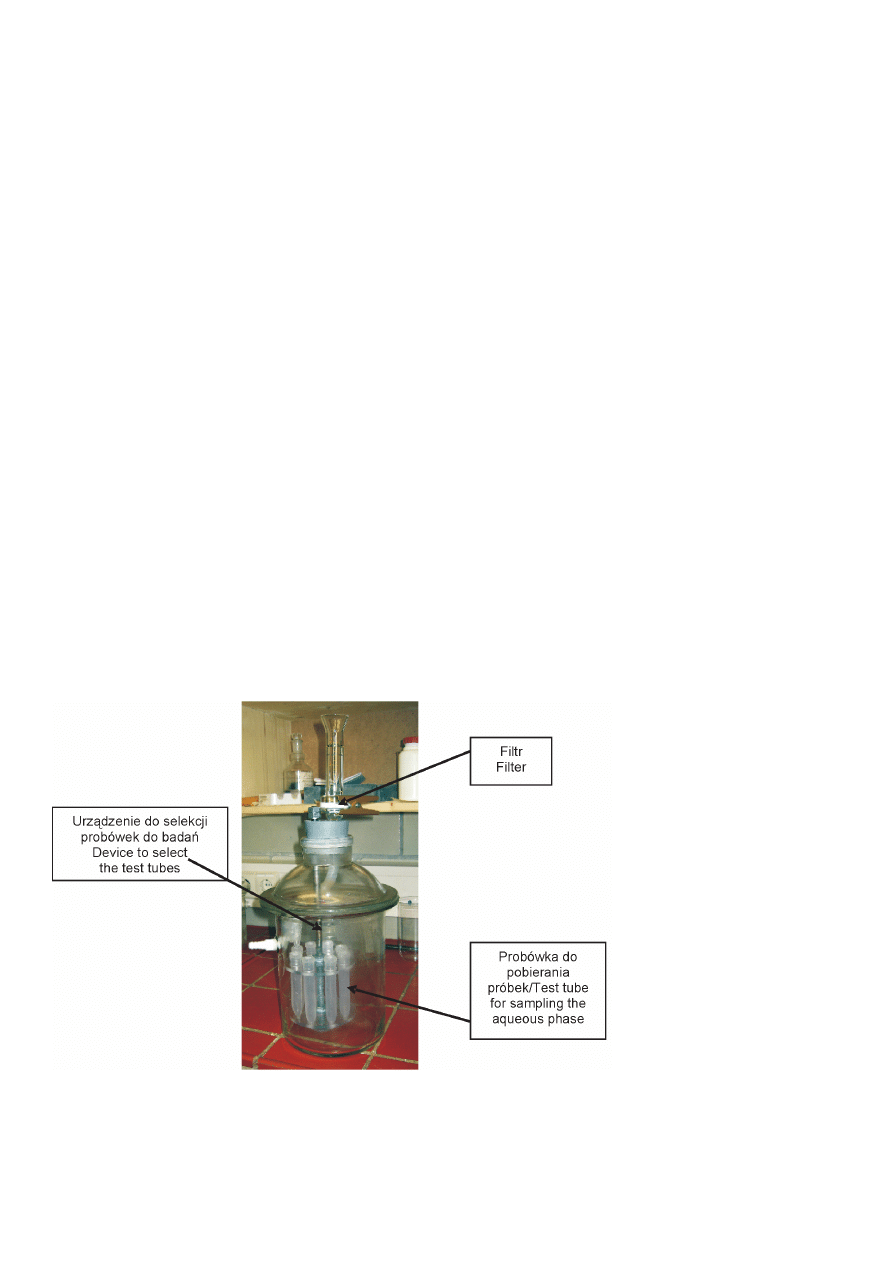
Ménétrier (23-24). Skonstruowano więc specjalne urządzenie
w celu prowadzenia hydratacji C
3
S w układzie otwartym: roztwór
wodny o założonym składzie przepływa przez warstwę C
3
S roz-
mieszczoną na fi ltrze (rysunek 1).
Wszystkie doświadczenia przeprowadzono stosując 0,5 g C
3
S
rozmieszczone na fi ltrze o promieniu posiadającym wymiar oczka
0,45 μm. C
3
S jest rozłożony na fi ltrze i lekko zagęszczony pod
wpływem próżni przed podaniem fazy ciekłej: wysokość warstwy
C
3
S na fi ltrze jest bliska 2 mm. Przepływ cieczy przez fi ltr wynosi
średnio 2,5 ml na sekundę co odpowiada 7,96 l s
-1
m
-2
zamiast
0,21 l s
-1
m
-2
w doświadczeniach Ménétrier. W związku z tym czas
kontaktu z cieczą przechodzącą przez 2 mm warstwę C
3
S wynosi
0,25 s co jest bardzo mało. Powoduje to szybkie wymywanie jonów
odszczepionych przez rozpuszczanie C
3
S.
the electrolyte composition can have a very intense effect such as
it had been observed for the dissolution of glass (21).
2. Materials and experimentation
The basic idea was fi rst to be able to maintain at the C
3
S surface
a constant and defi ned aqueous phase composition such as in
Lecoq (22) or Gauffi net (12) experiments. Second, the aim was
to slow down as far as possible the formation of hydrates on the
surface by heterogeneous nucleation, especially C-S-H, by adding
a rapid fl ushing of the surface of the grains by a fast convective
fl ow of the aqueous phase using a bed of C
3
S on a fi lter linked to
vacuum such as in Ménétrier’s experiments (23-24). Thus a specifi c
device has been designed to perform C
3
S hydration in an open
system: the aqueous phase of a given and known concentration
fl ows through a layer of C
3
S spread on a fi lter (Figure 1).
All the experiments were carried out with 0.5gr of C
3
S spread on
a fi lter of 1 cm of radius having a mesh size of 0.45
μm. C
3
S is
just laid on the fi lter and slightly compacted by the vacuum before
adding the aqueous phase: the height of C
3
S on the fi lter is close
to 2 mm.
The fl ow of aqueous phase through the fi lter is in average 2.5ml
per second that corresponds to 7.96 l.s
-1
.m
-2
instead of 0.21 l.s
-
1
.m
-2
in Ménétrier’s experiments. Thus the duration of the contact
between the aqueous phase passing through the 2 mm layer of
C
3
S is equal to 0.25 s which is extremely rapid. As a consequence
the device should enable a rapid fl ushing of the ions released by
the dissolution of C
3
S.
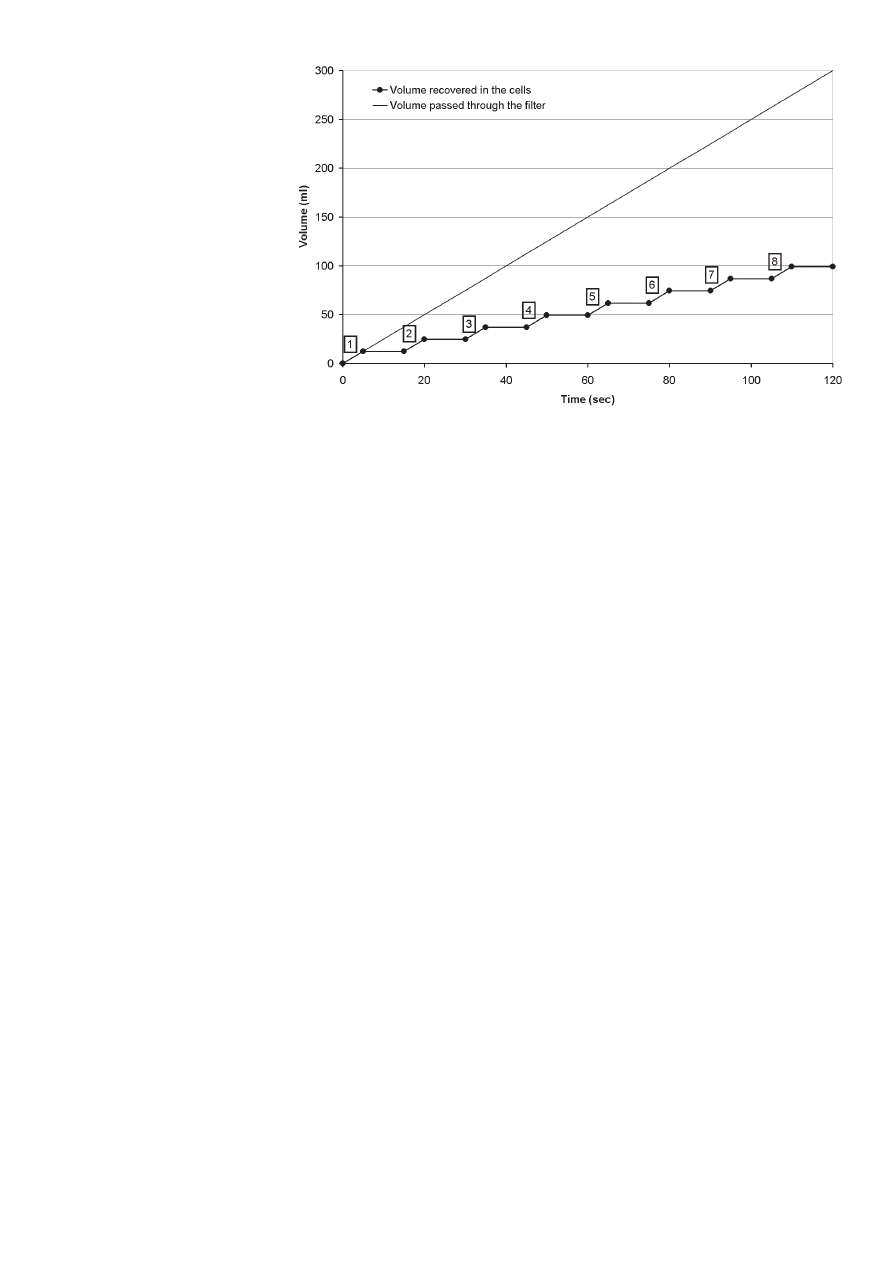
The more innovative part of the device is that it is possible to
sample the aqueous phase passing through at different times
instead of analyzing the bulk solution
at the end of the experiment. During
an experiment, 8 test tubes having a
volume of 15 ml can be selected and
fi lled each in less than 5 seconds (the
tube is fi lled with 12 ml of aqueous
phase). As the study was focused
on the very early hydration, the sam-
pling rate was equal to 1 sample per
15 seconds with a total duration of
the experiment less than 2 minutes
(fi gure 2). The fi rst sampling started
after 1 second. The reservoir on the
top of the fi lter is continuously fi lled
but always contains less than 10 ml
of aqueous phase in order to avoid
diffusion to the reservoir.
At the end of the experiment, a small
fraction of the remaining solid on the
fi lter is generally observed as quickly
as possible (less than 5 minutes), in
its wet state and thus without coating,
under an environmental scanning
Rys. 1. Urządzenie badawcze przeznaczone do przeprowadzania hydratacji C
3
S w otwartym układzie z
pobieraniem próbek fazy ciekłej
Fig. 1. Experimental device designed for performing C
3
S hydration in an open system with the sampling of
the aqueous phase
60
CWB-2/2007
Korzystnym rozwiązaniem zastoso-
wanym w urządzeniu jest możliwość
pobierania przepływającej cieczy po
różnych czasach zamiast analizowania
całego roztworu na końcu doświadcze-
nia. Podczas jednego doświadczenia
można wydzielić 8 probówek do ba-
dań o objętości 15 ml i każda może
być wypełniona w czasie krótszym od
5 sekund (objętość pełnej probówki
wynosi 12 ml). W związku z tym, że
doświadczenie obejmowało wczesny
okres hydratacji, pobieranie próbek na-
stępowało z częstotliwością 1 próbka
na 15 sekund, a czas całego ekspery-
mentu był krótszy od 2 minut (rysunek
2). Pobieranie pierwszej próbki rozpo-
czynano po jednej sekundzie. Zbiornik
w górnej części fi ltru był napełniany
w sposób ciągły lecz zawsze zawierał
mniej niż 10 ml fazy ciekłej w celu
uniknięcia dyfuzji do zbiornika.
Na końcu doświadczenia małą część pozostałej na fi ltrze fazy stałej
analizowano tak szybko jak to było możliwe (w okresie krótszym
od 5 minut), na mokro, a więc bez napylania, pod mikroskopem
skaningowym, pozwalającym na obserwacje w normalnych warun-
kach (Philips ESEM XL 30). Pozostałą fazę stałą suszono izopro-
panolem w celu dalszego analizowania, a fazę ciekłą analizowano
za pomocą ICP – OES (Optima 3000 Perkin Elmer).
3. Wyniki
W doświadczeniach badano wpływ kationów (H
+
, Na
+
, Ca
2+
)
i anionów (OH
-
, Cl
-
, H
2
SiO
4
2-
) na szybkość rozpuszczania C
3
S
w porównaniu do czystej wody i zastosowane roztwory miały
następujący skład:
– Ca(OH)
2
o stężeniu 6 [oznaczony Ca(OH)
2
(6)] i 22 mmol/l
[oznaczony Ca(OH)
2
(22)],
– CaCl
2
o stężeniu 20 mmol /l (oznaczony CaCl
2
),
– Na OH o stężeniu 30 mmol/l,
– HCl o stężeniu 32 mmol/l
– jony krzemianowe o stężeniu 1,5 mmol/l (oznaczony krzemion-
ka),
– roztwór otrzymany podczas wczesnej hydratacji C
3
S, który za-
wierał 2,65 mmol/l wapnia i 0,86 mmol/l jonów krzemianowych
(oznaczony C
3
S 1).
Znalezione sumaryczne ilości jonów wapniowych i krzemianowych
w funkcji czasu pokazano na rysunkach 3 i 4. Ilości te obliczono
przy założeniu, że skład roztworu uzyskanego w ciągu 15 sekund
pomiędzy kolejnym pobieraniem próbek jest taki sam jak skład
analizowanego roztworu w próbce (czas pobierania próbki 5
sekund).
microscope (Philips ESEM XL 30). The remaining solid is dried
with isopropanol for further analysis and the aqueous phase is
analyzed by ICP-OES (Optima 3000 Perkin Elmer).
3. Results
Experiments have been carried out in the following aqueous pha-
se compositions in order to check the infl uence cations (H
+
, Na
+
,
Ca
2+
) and anions (OH
-
, Cl
-
, H
2
SiO
4
2-
) on the rate of C
3
S dissolution
comparatively to pure water :
– Ca(OH)
2
at 6 (noted Ca(OH)
2
(6)) and 22 mmol/l (noted Ca(OH)
2
(22)),
–
CaCl
2
at 20 mmol/l (noted CaCl
2
),
–
NaOH at 30 mmol/l,
–
HCl at 32mmol/l,
–
Silicate ions at 1.5mmol/l (noted silicate),
–
Solution obtained during early hydration of C
3
S that contains
2.65 mmol/l of calcium and 0.86 mmol/l of silicate ions (noted
C
3
S 1).
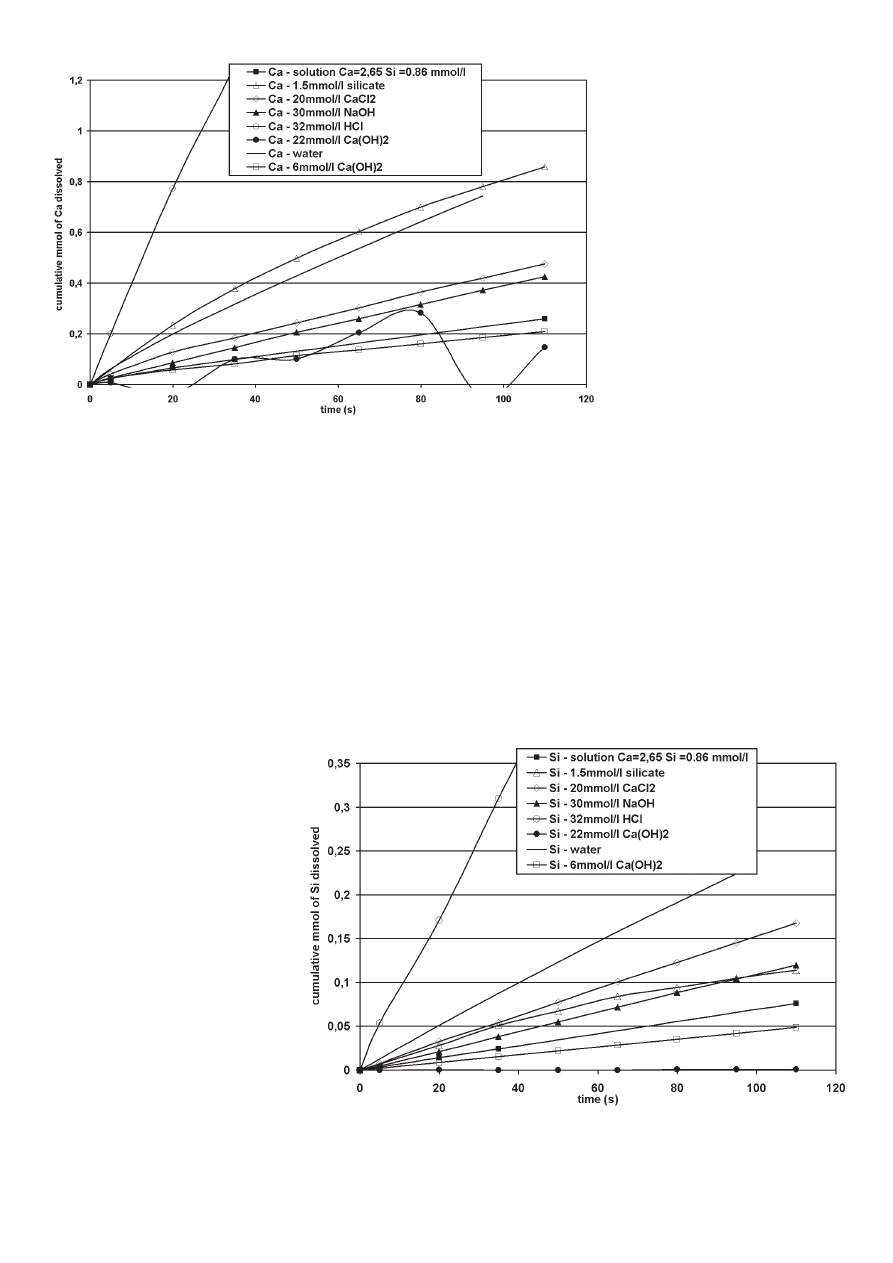
The cumulated amounts of calcium and silicate ions recovered
as a function of the time are reported on fi gures 3 and 4. These
amounts are calculated with the approximation that the aqueous
phase composition over the 15 seconds between each sampling
is equal to the aqueous phase composition analyzed in the sample
(5 seconds of sampling time).
For pure water, the cumulated amounts of both calcium and silicate
almost correspond to a straight line. Thus it exists a quasi steady
state between the dissolution rate and the fl ow of water through C
3
S
layer on the fi lter. In these conditions, the dissolution rate does not
appears to become restricted and more than 10% of C
3
S has been
dissolved during the experiment that lasts less than 2 minutes.
Rys. 2. Częstotliwość pobierania próbek w funkcji przepływającej objętości i pobranej objętości
Fig. 2. Sampling rate versus the volume passed through and the recovered volume
CWB-2/2007
61
W przypadku czystej wody sumaryczna ilość jonów wapniowych
i krzemianowych odpowiada prawie linii prostej. Tak więc wystę-
puje quasi stacjonarny stan pomiędzy szybkością rozpuszczania
i przepływu wody przez warstwę C
3
S na fi ltrze. W tych warunkach
szybkość rozpuszczania wydaje się nieograniczona, a więcej niż
10% C
3
S rozpuściło się podczas doświadczenia, które trwało
krócej niż 2 minuty.
Jeżeli weźmiemy pod uwagę sumaryczną ilość jonów krzemia-
nowych stwierdzimy podobną zależność w przypadku roztworów
wodnych o różnym składzie lecz nachylenie krzywych różni się
znacznie w zależności od ich składu. Wszystkie składy, z wyjątkiem
HCl, powodują spadek sumarycznej ilości
jonów krzemianowych w porównaniu
z wodą, w następującej kolejności:
Ca(OH)
2
(22) < Ca(OH)
2
(6) < C
3
S 1
< NaOH = krzemian < CaCl
2
< woda
< HCl. W przypadku sumarycznej zawar-
tości jonów wapniowych znaleziono po-
równywalny szereg, z wyjątkiem Ca(OH)
2
(22), który nie jest monotoniczny, a także
dla roztworu krzemianowego, który jest
większy niż dla wody: Ca(OH)
2
(6) < C
3
S
1 < NaOH < CaCl
2
< woda < krzemian
< HCl.
Jeżeli weźmiemy pod uwagę stosunek
c/s (lub
ΔC/ΔS jeżeli wyjściowy roztwór
nie był czystą wodą) dla każdej próbki
(rysunek 5) można stwierdzić, że ta war-
tość progresywnie maleje i stabilizuje się
dla wartości nieco większej od 3: wartość
średnia wynosi 3,37, jeżeli doświadcze-
nie z roztworem krzemianowym, który
If we consider the cumulated amounts
of silicate ions, a similar evolution is ob-
served with the different aqueous phase
compositions studied but the slope of the
curves differs signifi cantly depending on
the composition. All compositions, apart
HCl, lead to a decrease of the cumulated
amount of silicate ions compared to wa-
ter in the following order: Ca(OH)
2
(22)
< a(OH)
2
(6) < C
3
S 1 < NaOH = silicate
< CaCl
2
< water < HCl. For the cumula-
ted amounts of calcium ions, a compa-
rable order is found at the exception of
Ca(OH)
2
(22) that is not monotonous and
also for the silicate solution that is higher
than water: Ca(OH)
2
(6) < C
3
S 1 < NaOH
< CaCl
2
< water < silicate < HCl.
If the C/S ratio (or
ΔC/ΔS ratio if the
starting solution is not pure water) of
each sampling is considered (Figure 5),
it can be noted that the value progressi-
vely decreases and stabilizes to values
a little higher than 3 : average value equals 3.37 if the silicate
experiment that behaves very differently is not taken into account.
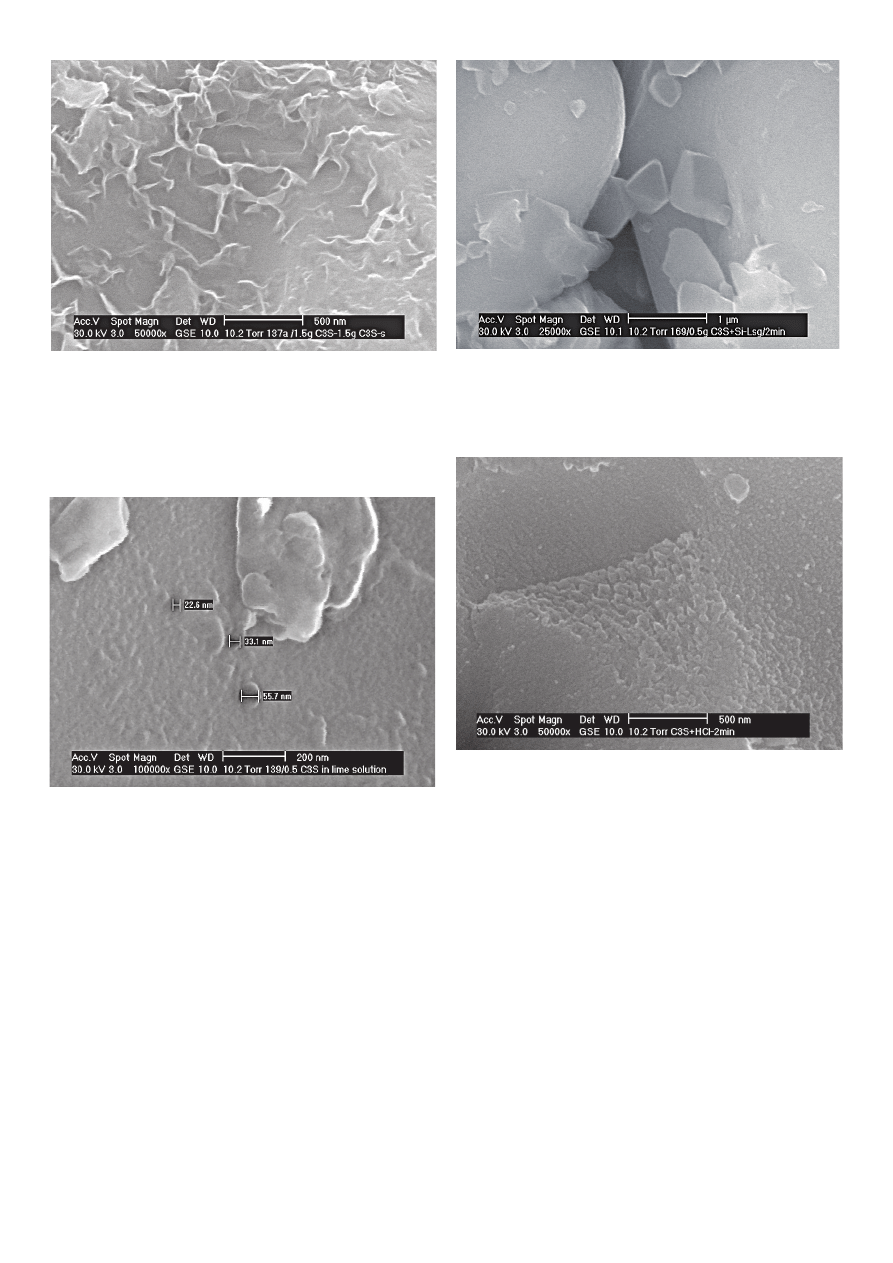
Similar results reported by Ménétrier (23) had been explained by
the fact that the local concentrations at the interfaces are higher
than those of the bulk aqueous phase and as a consequence,
some silicate ions are missing due to the precipitation of small
amount of C-S-H. However ESEM observations did not reveal
common pattern of C-S-H on the surface and no real observable
deposit of hydrate apart sometimes some pore fl uid precipitated
on the surface when the sample are slightly dried in the ESEM
Rys. 3. Sumaryczna zawartość jonów wapniowych w funkcji czasu
Fig. 3. Cumulated amount of calcium ions as a function of the time
Rys. 4. Sumaryczna ilość jonów krzemianowych jako funkcja czasu
Fig. 4. Cumulated amount of silicate ions as a function of the time
62
CWB-2/2007
zachowuje się zupełnie inaczej, nie jest brane pod uwagę. Podobne
wyniki uzyskane przez Menetrier (23) zostały wyjaśnione w ten
sposób, że lokalne stężenia na granicy faz są wyższe niż średnio
w roztworze i w konsekwencji brak jonów krzemianowych w wyniku
strącania się małych ilości C-S-H. Jednak obserwacje pod mikro-
skopem skaningowym nie pozwoliły na wykrycie znanych skupień
C-S-H na powierzchni i wykrywalnych wydzieleń hydratu z wyjątkiem
pewnych wytrąceń na powierzchni związanych z cieczą w porach
gdy próbka ulega nieznacznemu wysuszeniu w mikroskopie,
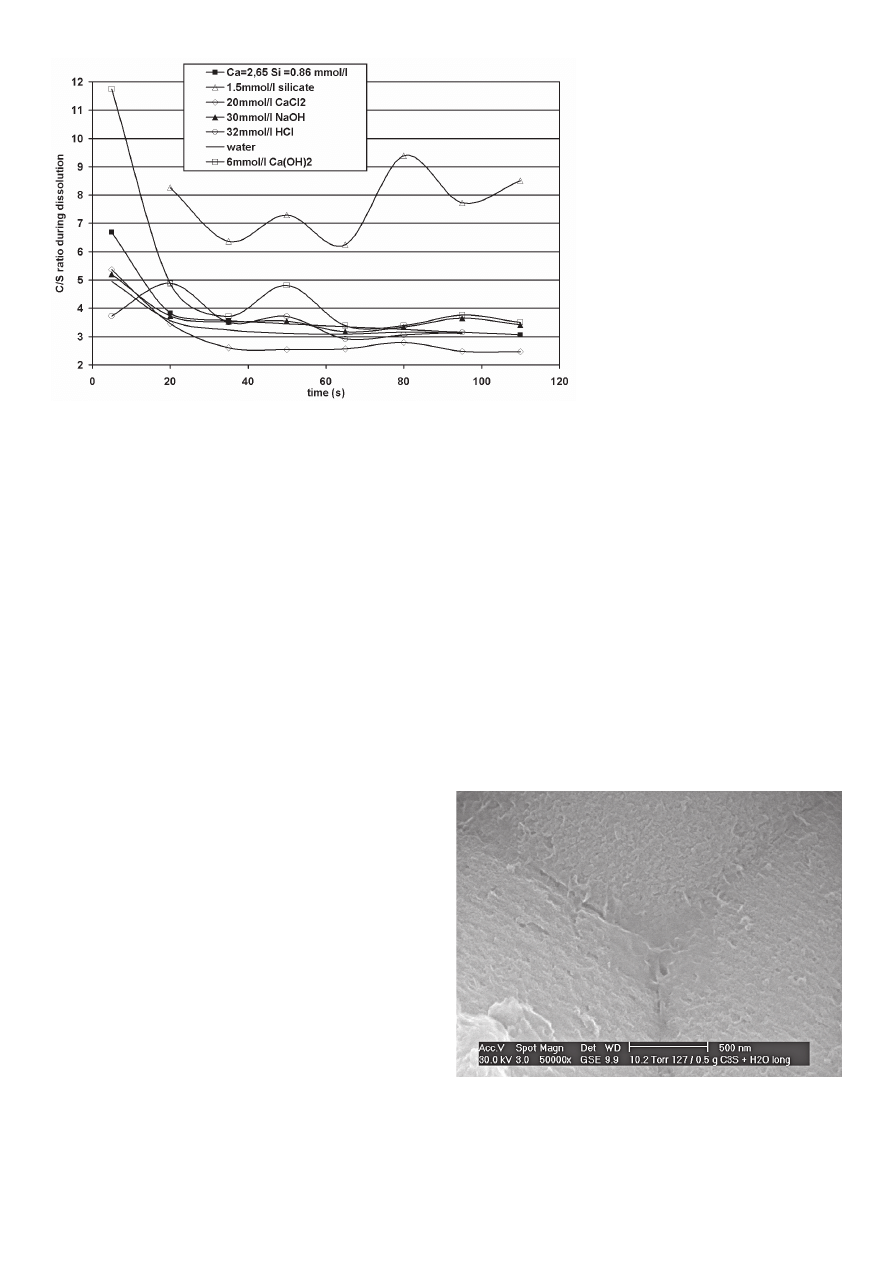
w trakcie analizy (25). Z drugiej strony pewne obszary świadczące
o intensywnej rozpuszczalności były często obserwowane, szcze-
gólnie zlokalizowane w miejscach zrostu kryształów tworzących
ziarna C
3
S (rysunek 6). Typowy C-S-H utworzony na początku
hydratacji, otrzymany w innych doświadczeniach niż ten opisywany,
pokazano na rysunku 7 w celu podkreślenia różnic. Tak więc można
podjąć inną próbę wyjaśnienia tego stosunku biorąc pod uwagę, że
szybkość przepływu jest znaczna co prowadzi do pozornego inkon-
gruentnego rozpuszczania C
3
S w związku z różnymi szybkościami
w dwóch stadiach powierzchniowego procesu hydroksylacji. Można
oczekiwać, że ślady wolnego wapna będą zwiększać stosunek C/S,
jednak głównie podczas dwóch początkowych pobranych próbek,
jak to stwierdzono.
Zachowanie roztworu krzemianowego jest zupełnie inne i stosunek
C/S pozostaje wysoki. Temu zachowaniu może towarzyszyć strąca-
nie fazy posiadającej stosunek C/S poniżej 3, takiej jak C-S-H. Lecz
również w tym przypadku nie powstała typowa morfologia plastra
pszczelego w obserwacjach pod elektronowym mikroskopem
skaningowym, nawet przy bardzo dużych powiększeniach. Jednak
obserwowano pewne nietypowe kryształy o pokroju trapezoidalnym
(rysunek 8). Początkowo przypuszczano, że jest to węglan wapnia,
jednak analiza EDS nie wykazała obecności węgla.
Bardzo zmienna zawartość wapnia, któremu towarzyszyła bardzo
mała zawartość krzemionki znaleziona podczas doświadczenia
for the observation (25). On the other hand
some strong dissolution patterns are often
observed especially at the localization of the
joints of the crystals that form C
3
S grains
(Figure 6). Typical C-S-H formed during early
hydration, obtained in other experiments than
those reported here are presented on fi gure
7 to stress the differences. Thus additional
explanation could be attempted in considering
that the velocity of the fl ow is quite high and
thus leads to an apparent incongruency of
C
3
S dissolution due to the difference of rate in
the two steps of the superfi cial hydroxylation
process. Traces of free lime are also expected
to increase the C/S ratio but mainly during the
two fi rst samplings as observed.
The behavior of the silicate solution is quite
different and the C/S ratio remains high. This
behavior could be associated to the precipi-
tation of a phase having a C/S ratio below
3 such as C-S-H. But also in this case, the
typical honeycomb morphology of C-S-H was not observed by
ESEM even at very high magnifi cation. However some uncommon
trapezoidal shape crystals can be observed (Figure 8). At fi rst it
was believed to be calcium carbonate, but EDS analysis did not
reported the present of carbon.
The very variable calcium amounts and the associated very low
silicate amounts recorded during the experiment using a Ca(OH)
2
so-
lution of 22 mmol/l (corresponding to the solubility of Portlandite) tend
to indicate a very low dissolution rate with some possible portlandite
and C-S-H precipitation. Nevertheless in this case also, no typical
morphologies of known hydrates were observed (Figure 9).
On the other hand, the faster experiment, carried out in HCl, le-
ads to a very corroded surface resulting from the high quantity of
Rys. 5. Zmiany stosunku C/S każdej próbki pobranej w trakcie doświadczenia
Fig. 5. Evolution of the C/S ratio of each sampling during the experiment
Rys. 6. Powierzchnia ziarn C
3
S po doświadczeniu rozpuszczania wodą
Fig. 6. Surface of C
3
S grains after dissolution experiment performed in
water
CWB-2/2007
63
z roztworem Ca(OH)
2
o stężeniu 22 mmol/l (odpowiadającej roz-
puszczalności portlandytu) wydaje się wskazywać na bardzo małą
szybkość rozpuszczania i prawdopodobne strącanie portlandytu
i C-S-H. Niemniej jednak także w tym przypadku nie stwierdzono
typowego pokroju znanych hydratów (rysunek 9). Z drugiej strony
szybsze rozpuszczanie w roztworze HCl powoduje powstawanie
bardzo skorodowanej powierzchni spowodowanej dużą ilością
rozpuszczonego C
3
S, szczególnie w miejscach zrostów kryszta-
łów C
3
S zawartych w ziarnach (rysunek 10). Analogiczne obrazy
rozpuszczania znaleziono także w przypadku roztworów CaCl
2
i NaOH (odpowiednio rysunki 11 i 12).
C
3
S dissolved but with higher intensities at the joint between the
crystals of C
3
S that are contained in the grains (fi gure 10). Similar
dissolution patterns are also found with CaCl
2
and NaOH solutions
(fi gures 11 and 12 respectively).
4. Discussion
The cumulated amounts of ions in the aqueous phase show
a different behavior during the very initial dissolution of C
3
S as
a function of the aqueous phase composition. If we want to estimate
the dissolution rate of C
3
S from these data, we have to estimate
if only dissolution of C
3
S occurs or if some hydrates were also
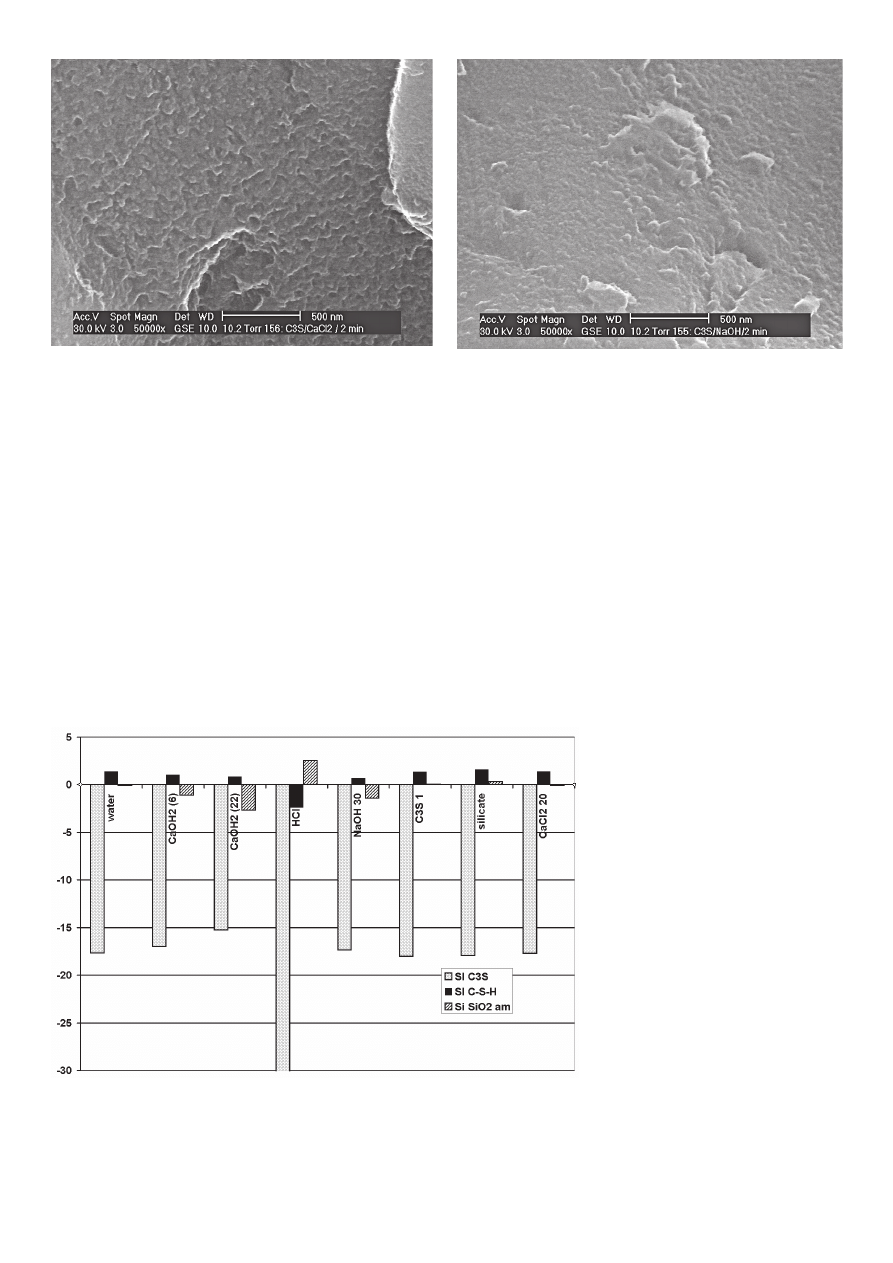
precipitated. A fi rst approach can be made thanks to the calcula-
tion of the saturation index (SI) of the phases that may precipitate
(amorphous silica, C-S-H and CH). In order to restrict as far as
Rys. 7. Typowy C-S-H utworzony na powierzchni ziarn C
3
S po 2 minutach
hydratacji przy zastosowaniu większej warstwy na fi ltrze (1,5 g zamiast 0,5
g) i użyciu przesyconego roztworu w stosunku do C-S-H
Fig. 7. Typical C-S-H formed on the surface of C
3
S grains after 2 minutes
of hydration using higher C
3
S contents on the fi lter (1.5g instead of 0.5g)
and a supersaturated solution with respect to C-S-H
Rys. 8. Powierzchnia ziaren C
3
S po doświadczeniu rozpuszczania
w roztworze krzemianowym
Fig. 8. Surface of C
3
S grains after dissolution experiment performed in
silicate solution
Rys. 9. Powierzchnia ziarn C
3
S po doświadczeniach rozpuszczania w
nasyconym roztworze portlandytu (Ca(OH)
2
(22))
Fig. 9. Surface of C
3
S grains after dissolution experiment performed in a
saturated solution with respect to portlandite (Ca(OH)
2
(22))
Rys. 10. Powierzchnia ziarn C
3
S po doświadczeniu rozpuszczania
w roztworze HCl
Fig. 10. Surface of C
3
S grains after dissolution experiment performed in
HCl solution
64
CWB-2/2007
4. Dyskusja
Sumaryczna zawartość jonów w roztworze okazała się bardzo
różna na samym początku rozpuszczania C
3
S w zależności od
składu fazy ciekłej. Jeżeli chcemy oszacować szybkość rozpusz-
czania C
3
S w oparciu o te dane musimy stwierdzić, czy zachodzi
tylko rozpuszczanie C
3
S lub czy pewne hydraty także się strącają.
Pierwszej oceny możemy dokonać obliczając iloczyn rozpusz-
czalności (SI) faz, które mogą ulegać strącaniu (bezpostaciowa
krzemionka, C-S-H i CH). W celu maksymalnego ograniczenia
jakiegokolwiek strącania tylko pierwsze pobrane próbki (5 sekund
hydratacji) wykorzystano do obliczeń iloczynu rozpuszczalności
(rysunek 13). Jednak pobrana faza ciekła jest zawsze przesycona
possible any precipitation, only the fi rst sampling (5 seconds of
hydration) has been used for the calculation of the saturation index
(Fig. 13). Nevertheless the recovered aqueous phase is always
supersaturated with respect to C-S-H at the exception of the HCl
solution that remains undersaturated with respect to C-S-H.
As the reaction time is very short, C-S-H as a chance to be formed
only if the maximum supersaturation of C-S-H is attained otherwise
the induction period before C-S-H precipitation would be too long.
Considering the values of SI C-S-H, maximum supersaturation
may be reached during some experiments but the quantity of C-
S-H formed is expected to be very low compared to the amount
of dissolved C
3
S after 5 seconds. A similar approximation can
be made for small amounts of amorphous
silica that could also form in HCl and silicate
solutions.
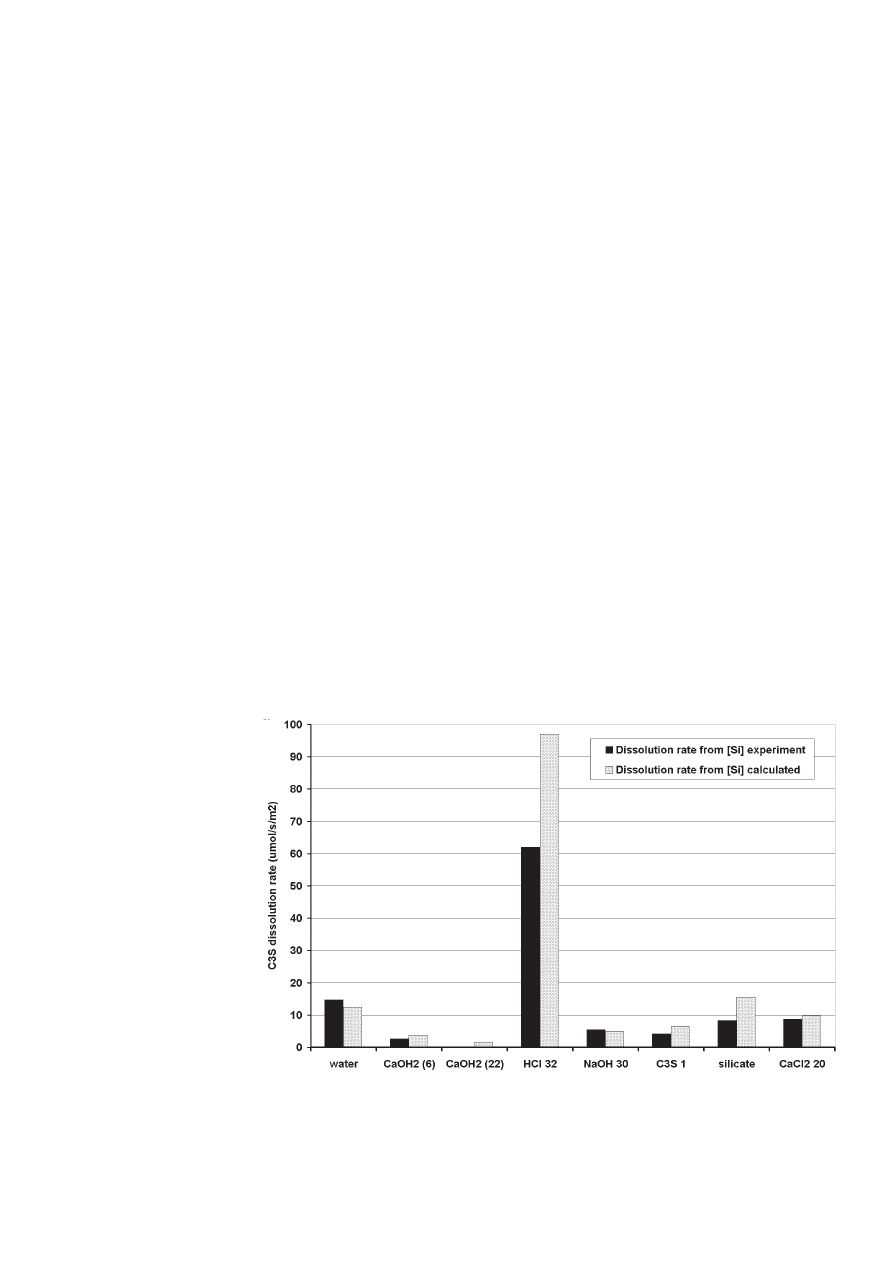
As a consequence, precipitation can be ne-
glected in order to calculate C
3
S initial dis-
solution rate from the cumulated amounts
of silicate ions (Fig 14). The dissolution rate
calculated after 5 seconds follows the order
found for the cumulated amounts of silicate
obtained after 120 s, except that silicate is
closer to CaCl
2
than to NaOH: Ca(OH)
2
(22)
< Ca(OH)
2
(6) < C
3
S 1 < NaOH < silicate =
CaCl
2
< water < HCl.
The dissolution rate calculated from the fi lter
experiment can be compared to the rates
obtained from calorimetric experiments
(25). In this latter case, the dissolution rate
obtained on stirred suspension (at low rate
of stirring) ranges from 0.015 to 0.15
μmol/s/
m
2
for 6 and 22 mmol/l Ca(OH)
2
solutions
respectively. These rates are about 18 times
Rys. 11. Powierzchnia ziarn C
3
S po doświadczeniu rozpuszczania w
roztworze CaCl
2
Fig. 11. Surface of C
3
S grains after dissolution experiment performed in
CaCl
2
solution
Rys. 12. Powierzchnia ziarn C
3
S po doświadczeniu rozpuszczania
w roztworze NaOH
Fig. 12. Surface of C
3
S grains after dissolution experiment performed in
NaOH solution
Rys. 13. Iloczyny rozpuszczalności C
3
S, C-S-H i bezpostaciowej krzemionki obliczone ze składu fazy
ciekłej odpowiadającej pierwszej pobranej próbce w każdym doświadczeniu
Fig. 13. Saturation index for C
3
S, C-S-H and amorphous silica calculated from the aqueous phase
composition corresponding to the fi rst sampling of each experiment
CWB-2/2007
65
lower than the corresponding rates measured during the fi lter ex-
periments using similar aqueous phase. This could be explained
by the very rapid fl ushing in the case of the fi lter experiments com-
pared to the stirred experiments and fi lter experiments maintain
higher undersaturation levels. Nevertheless it is very interesting to
show that the ratio between the rates in 6 and 22 mmol/l Ca(OH)
2
solutions remains the same (close to 10).
The mechanisms involved in kinetic dissolution are generally
complex but can be macroscopically related to several parameters
such as the saturation index: the higher the undersaturation of a
mineral the faster its dissolution. The saturation index of C
3
S do
not vary much in the experiments apart for the experiment carried
out in HCl that has a higher undersaturation and is clearly the
faster experiment (Fig. 14). Thus additional parameters, different
from the specifi c surface area that is almost constant during the
fi rst seconds in our experiments, have to be considered in order
to simulate the infl uence of the aqueous phase composition on the
dissolution rate. It is known that the kinetics is very often strongly
affected by the presence of ions or complex species in the aqueous
phase that may be not directly involved in the reaction. They can
have a catalyzing effect when the reaction rate increases, or an
inhibiting effect when it is slowed down. For example H
+
and thus
pH has a great infl uence on glass dissolution (21). If the pH of the
aqueous phase is taken into account and sorted accordingly to the
dissolution rate of C
3
S, the following sequence is found; 12.53 <
12.11 < 11.83 < 12.45 < 11.79 < 11.63 < 11.89 < 8.76. It seems
that as a general trend, the dissolution rate is increased with a
decrease of pH but nevertheless calcium ions appears to have an
additional inhibiting effect if we compare NaOH and Ca(OH)
2
.
Experiments enabled us to defi ne a simplifi ed equation to simulate
the kinetics of C
3
S dissolution that takes into account the effects
w stosunku do C-S-H z wyjątkiem roztworu HCl, który pozostaje
nienasycony w stosunku do C-S-H.
Ponieważ czas reakcji jest bardzo krótki C-S-H może się utwo-
rzyć tylko wówczas gdy maksimum przesycenia tej fazy zostanie
osiągnięte w przeciwnym przypadku okres indukcji przed strące-
niem C-S-H będzie zbyt długi. Oceniając wartości SI dla C-S-H
maksimum przesycenia może być osiągnięte podczas niektórych
doświadczeń, jednak ilość C-S-H, która mogłaby się utworzyć by-
łaby bardzo mała w porównaniu z ilością rozpuszczonego C
3
S po
5 sekundach. Podobnego przybliżenia można dokonać dla małej
ilości bezpostaciowej krzemionki, która może także powstawać
w roztworach HCl i krzemianowym.
W konsekwencji, strącanie można pominąć w celu obliczenia
początkowej szybkości rozpuszczania C
3
S na podstawie suma-
rycznej zawartości jonów krzemianowych (rysunek 14). Szybkość
rozpuszczania obliczona po 5 sekundach zachowuje kolejność
znalezioną w przypadku sumarycznej zawartości krzemianowych
jonów otrzymaną po 120 s, z tym że zawartość tych jonów jest
bliższa CaCl
2
niż NaOH:
Ca(OH)
2
(22) < Ca (OH)
2
(6) < C
3
S 1 < NaOH < krzemian = CaCl
2
< woda < HCl.
Szybkość rozpuszczania obliczoną na podstawie przeprowadzo-
nych doświadczeń można porównać z szybkością stwierdzoną
w pomiarach kalorymetrycznych (25). W tym ostatnim przypadku
szybkość rozpuszczania otrzymana dla mieszanych zawiesin
(przy małej szybkości mieszania) leży w przedziale 0,015 do 0,15
μmol/s
⋅m
2
odpowiednio dla roztworów o stężeniu 6 i 22 mmol
Ca(OH)
2
. Te szybkości są około 18 razy mniejsze niż odpowiada-
jące im szybkości zmierzone podczas doświadczeń z fi ltracją przy
stosowaniu podobnego roztworu.
Może to być wytłumaczone bar-
dzo szybkim zmywaniem w przy-
padku doświadczeń z filtracją
w porównaniu z doświadczeniami
z mieszaniem oraz doświadcze-
nia z fi ltracją utrzymują większy
poziom nienasycenia. Jednak
interesujące jest wykazanie, że
stosunek szybkości dla roztworów
o stężeniu 6 i 22 mmol/l Ca(OH)
2
pozostaje taki sam (bliski 10).
Mechanizmy związane z kine-
tyką rozpuszczania są z reguły
złożone, jednak mogą być ma-
kroskopowo powiązane z różnymi
parametrami takimi jak iloczyn
rozpuszczalności: im większe
nienasycenie minerału tym szyb-
sza rozpuszczalność. Iloczyn roz-
puszczalności C
3
S nie zmieniał
się znacznie w doświadczeniach
z wyjątkiem doświadczenia z roz-
Rys. 14. Początkowa szybkość rozpuszczania C
3
S w roztworach o różnym składzie obliczona w oparciu o
stężenie Si uzyskane doświadczalnie lub wynikające z modelu
Fig. 14. Initial C
3
S dissolution rate in different aqueous phase compositions calculated using [Si] given by
experiment or simulation

66
CWB-2/2007
tworem HCl, w którym występowało większe nienasycenie i który
był wyraźnie najszybszym doświadczeniem (rysunek 14). Także
inne parametry, oprócz powierzchni właściwej, która była prawie
stała podczas pierwszych sekund w naszych doświadczeniach,
trzeba także brać pod uwagę w celu modelowania wpływu składu
roztworu na szybkość rozpuszczania. Wiadomo, że na kinetykę
bardzo często silnie wpływa obecność jonów lub kompleksów
cząsteczek w fazie ciekłej, które nie muszą uczestniczyć w reakcji.
Mogą one mieć wpływ katalityczny gdy szybkość reakcji wzrasta,
lub odgrywać rolę inhibitora gdy ulega ona zmniejszeniu. Na
przykład H
+
, a więc pH ma bardzo duży wpływ na rozpuszczal-
ność szkła (21). Jeżeli uwzględni się pH roztworu i uszereguje
zgodnie z szybkością rozpuszczania C
3
S znajduje się następującą
kolejność:
12,53 < 12,11 < 11,83 < 12,45 < 11,79 < 11,63 < 11,89 < 8,79.
Wydaje się, że ogólnym kierunkiem jest wzrost szybkości roz-
puszczania ze spadkiem pH, jednak jony wapniowe wydają się
wykazywać dodatkowe działanie inhibitora jeżeli porównamy
NaOH i Ca(OH)
2
.
Na podstawie doświadczalnych wyników zaproponowaliśmy
uproszczone równanie stanowiące model kinetyki rozpuszczania
C
3
S, które bierze pod uwagę wpływ nienasycenia (SI – 1) i działania
inhibitującego pH oraz jonów wapniowych:
27
.
0
29
.
0
0
2
3
]
[
]
).[
1
.(
.
)
/
/
(
−
+
+
−
=
C aO H
H
S I
K
A
m
s
m ol
dt
S
dC
µ
Stałą szybkość reakcji oznaczono K
o
i oszacowano, że wynosi ona
40 μmol/s
⋅m
2
. A (m
2
/m
3
) przedstawia objętościową powierzchnię
właściwą C
3
S: początkowo 0,5 g C
3
S ma powierzchnię właściwą
równą 0,35 m
2
/g. Wykładniki potęgowe przy [H
+
] i [CaOH
+
] zostały
przyjęte na podstawie doświadczenia z wodą. Obliczenia dotyczą
czasu 5 sekund, przy założeniu że 0,5 g C
3
S rozpuszcza się w 12,5
ml roztworu. Szybkość reakcji obliczono na podstawie stężenia
jonów krzemianowych w roztworze, w związku z tym, że nie zało-
żono strącania w tej symulacji. Obliczone szybkości rozpuszczania
układają się analogicznie do wyników doświadczalnych, z całkiem
dobrą zgodnością. Główne różnice wystąpiły w przypadku HCl i
roztworu krzemianu, w którym może powstawać bezpostaciowa
krzemionka w ten sposób zmniejszając ilość jonów krzemianowych
w roztworze. Także obliczona szybkość rozpuszczania w roztworze
nasyconym w stosunku do portlandytu (Ca(OH)
2
(22)) jest większa
od wyniku doświadczenia. Wiadomo, że w tych warunkach bardzo
mała ilość jonów krzemianowych wystarczy do natychmiastowego
utworzenia C-S-H (12) i może to wyjaśniać bardzo małe stężenie
jonów krzemianowych, lecz także nie monotoniczną zawartość
sumaryczną wapnia. Jeżeli obliczenia przeprowadzi się bez czło-
nu związanego z pH i wpływu wapnia jako inhibitora, szybkość
rozpuszczania będzie taka sama dla wszystkich doświadczeń i
jej wartość będzie około 80 razy większa w porównaniu do szyb-
kości znalezionej dla wody gdy efekt inhibitora zostanie wzięty
pod uwagę.
of undersaturation (SI-1) and of the inhibition of pH and calcium
ions:
27
.
0
29
.
0
0
2
3
]
[
]
).[
1
.(
.
)
/
/
(
−
+
+
−
=
C aO H
H
S I
K
A
m
s
m ol
dt
S
dC
µ
The rate constant of the reaction is denoted by K
0
and estimated
to be 40
μmol/s/m
2
. A (m
2
/m
3
) represents the volumic surface area
of the C
3
S : initially 0.5g of C
3
S having a specifi c surface area of
0.35 m
2
/g. The power constants applied to [H
+
] and [CaOH
+
] have
been set using the experiment in water as a reference. Calculations
were made for a duration of 5 seconds considering that 0.5g of
C
3
S dissolves in 12.5 ml of solution. The reaction rate has been
calculated from the silicate concentration of the aqueous phase
as precipitation is not allowed in the simulation.
The calculated dissolution rates follow the same trends than the
experimental ones with a quite good estimation. The main differen-
ces are reported for HCl and silicate solutions where amorphous
silica may form and thus lower the amounts of silicate in the
aqueous phase. Also the calculated dissolution rate in the solu-
tion saturated with respect to portlandite (Ca(OH)
2
(22)) is higher
than the experimental one. It is known that in these conditions,
a very small amount of silicate ions is suffi cient to immediately
form C-S-H (12) and thus this could explain the very low silicate
concentration but also the non monotonous cumulated amounts
of calcium. If the calculation is made without the term related to
the pH and calcium inhibiting effects, the dissolution rate is found
to be the same for all experiments and its value is about 80 times
higher compared to the rate found in water when the inhibiting
effect are taken into account.
5. Conclusion
A specifi c device has been developed in order to assess the initial
dissolution rate of C
3
S, and if needed other minerals, on different
aqueous phase compositions.
This enables us to give for the fi rst time ever, a good approximation
of C
3
S dissolution rate but also proves that pH and calcium ions
have an inhibiting effect whereas Na
+
, Cl
-
and silicate ions have a
less marked effects. A simplifi ed equation can be defi ned in order
to estimate the dissolution rate. The proposed method could also
be used for other ions such as sulfate but also organic molecules
coming from admixtures.
If we consider a paste of C
3
S having quasi instantaneously a high
pH, the dissolution rate become about 50 times lower than in
pure water but is still quite high relatively to other minerals. The
question now raised is to know if this effect is enough to induce
an induction period governed by nucleation and growth of the C-
S-H or if an additional mechanism, such a surface layer of C-S-H
in temporarily in equilibrium with the aqueous phase, governs the
dissolution rate (27-28).

CWB-2/2007
67
5. Wniosek
Skonstruowano specjalne urządzenie w celu badania początkowej
szybkości rozpuszczania fazy C
3
S, lub w razie potrzeby innych faz
przy zastosowaniu wodnego roztworu o różnym składzie.
Pozwoliło to nam po raz pierwszy podać dobre przybliżenie szyb-
kości rozpuszczania C
3
S, lecz także potwierdziło, że pH i jony
wapniowe wywierają efekt inhibitora, podczas gdy Na
+
, Cl
-
i jony
krzemianowe mają słabiej zaznaczony wpływ. Zaproponowano
uproszczone równanie modelowe dla oszacowania szybkości
rozpuszczania. Zaproponowana metoda może być także zastoso-
wana do badań innych jonów, na przykład siarczanowych, a także
cząsteczek organicznych wprowadzanych z domieszkami.
Jeżeli weźmiemy pod uwagę zaczyn C
3
S posiadający quasi na-
tychmiast wysokie pH, szybkość rozpuszczania będzie około 50
razy mniejsza niż w czystej wodzie, jednak pozostanie w dalszym
ciągu stosunkowo duża w porównaniu z innymi substancjami.
Powstaje pytanie czy ten wpływ wystarczy do wywołania okresu
indukcji zależnego od zarodnikowania i wzrostu C-S-H, lub czy
dodatkowy mechanizm taki jak warstwa powierzchniowa C
3
S
chwilowo w równowadze z fazą ciekłą decyduje o szybkości roz-
puszczania (27-28).
Literatura / References
1. H. Le Chatelier, Recherches expérimentales sur la constitution des
mortiers hydrauliques – Second Edition, Dunod Ed., 1904.
2. D. Damidot, A. Nonat, C
3
S hydration in diluted and stirred suspensions:
(I) study of the two kinetic steps, Advances in Cement Research, 6, pp.
27-35 (1994).
3. D. Damidot, A. Nonat, C
3
S hydration in diluted and stirred suspension:
(II) properties of C-S-H precipitated during the two kinetic steps - Advances
in Cement Research, 6, pp. 83-91 (1994).
4. H. M. Jennings, B. J. Dalgleish, P. L. Pratt, Morphological development
of hydrating tricalcium silicate as examined by electron microscopy tech-
niques, Jour. Amer. Ceram. Soc., 64, pp. 567-572 (1981).
5. D. Ménétrier, I. Jawed, T. S. Sun, J. Skalny, ESCA and SEM studies on
early C
3
S hydration - Cem. Conc. Res., 9, pp. 473-482 (1979).
6. R. Trettin, Reactivity and mechanism of hydration of cement phases,
in Justness (Ed.) Proc of 10
th
Int. Symposium on the chemistry of cement,
2ii050, Goteborg 2003.
7. H. N. Stein, Thermodynamic Considerations on the Hydration Me-
chanisms of Ca
3
SiO
5
and Ca
3
Al
2
O
6
- Cem. Conc. Res., 2, pp. 167-177
(1972).
8. H. N. Stein, The Initial Stages of the Hydration of C
3
S”, Il Cemento, 74,
pp. 3-13 (1977).
9. R. Trettin, G. Oliew, C. Stadelmann, W. Wieker, Very Early Hydration
of Dicalcium Silicate-polymorphs, Cem. Conc. Res., 21, pp. 757-764
(1991).
10. P. Barret, Hydration mechanism of calcium silicates (C
3
S, ß-C
2
S) ce-
ment compounds, through the general concepts of the reactivity of solids,
Proc. of 8th Symposium on the chemistry of cement, Rio de Janeiro, vol.
III, pp. 86-92 (1986).
11. P. Barret , D. Bertrandie, Fundamental Hydration Kinetic Features of
the Major Cement Constituents Ca
3
SiO
5
and Ca
2
SiO
4
, J. Chim. Phys.,
Phys.-Chim. Biol., 83 pp. 765-75 (1986).
12. S. Gauffi net, Etude expérimentale et par simulation numérique de la
cinétique de croissance et de la structure des hydrosilicates de calcium,
produits d’hydratation des silicates tricalciques et dicalciques - PhD Thesis,
University of Burgundy, 1998.
13. S. Garrault, A. Nonat, Hydrated Layer Formation on Tricalcium and
Dicalcium Silicate Surfaces: Experimental Study and Numerical Simula-
tions, Langmuir, 17, pp. 8131-8138 (2001).
14. M. A. Henderson, The interaction of water with solid surfaces: funda-
mental aspects revisited, Surface Science Reports 46, 1-308 (2002).
15. S. V. Dorozhkin, Surface reactions of apatite dissolution, Journal of
Colloids and Interface Science, 191, pp. 489-497 (1997).
16. R. Rahnemaie, T. Hiemstra, W. H. van Riemsdijk, A new surface struc-
tural approach to ion adsorption: Tracing the location of electrolyte ions,
Journal of Colloid and Interface Science 293, pp. 312–321 (2006).
17. K. Dum, E. Daniel, P. J. Shuler, H. J. Chen, Y. Tang, T. F. Yen, Mecha-
nisms of surface precipitation and dissolution of Barite: a morphology
approach, Journal of Colloids and Interface Science, 214, pp. 427-437
(1999).
18. K. S. Wang, R. Ressch, B. E. Koel, P. J. Shuler, Y. Tang, H. J. Chen,
T. F. Yen, Study of the dissolution of the barium sulfate (001) surface with
hydrochloric acid by atomic force microscopy, Journal of Colloids and
Interface Science, 219, pp. 212-215 (1999).
19. H. F. W. Taylor et al., The hydration of tricalcium silicate - RILEM
Committee 68-MMH, Task Group 3, Materials and Structures, Research
and Testing, 102, pp. 457-468 (1984).
20. P. Barret, D. Ménétrier, D. Bertrandie, Mechanism of C
3
S Dissolution
and Problem of the Congruency in the Very Initial Period and Later On,
Cem. Conc. Res., 13, pp. 728-38 (1983).
21. I. Techer, T. Advocat, J. Lancelot, J. M. Liotard, Dissolution kinetics of
basaltic glasses: control by solution chemistry and protective effect of the
alteration fi lm, Chemical Geology, 176, pp. 235-263 (2001).
22. X. Lecoq, Etude de l’hydratation ŕ concentration contrôlée du silicate
tricalcique Ca
3
SiO
5
et des caractéristiques des produits formés - PhD
Thesis, University of Burgundy (France) 1993.
23. D. Ménétrier, Contribution ŕ l’étude cinétique de la periode initiale
d’hydratation du silicate tricalcique 3CaO.SiO
2
, constituent principal du
ciment Portland, Doctor es Sciences Thesis, University of Burgundy,
1977.
24. P. Barret, D. Ménétrier, Filter dissolution of C
3
S as a function of the
lime concentration in a limited amount of lime water, Cem. Conc. Res.,
10, pp. 521-34 (1980).
25. D. Damidot, F. P. Sorrentino, Observation of the hydration of cement
paste by ESEM: care needed to study the early hydration, 18th Proc. Int.
Cement Microscopy, Houston, 21-25 Avril, pp. 342-355 (1996).
26. D. Damidot, Etude de l’hydratation du silicate tricalcique en suspen-
sions diluées par microcalorimétrie isotherme, PhD Thesis, University of
Burgundy (France) 1990.
27. H. M. Jennings, C. M. Neubauer, K. D. Breneman, B. J. Christensen,
Phase diagrams relevant to hydration of C
3
S. Part I: a case for metastable
equilibrium - in Justness (Ed.), Proc of 10
th
Int. Symposium on the chemistry
of cement, 2ii057, Goteborg 1997.
28. C. M. Neubauer, J. J. Thomas, M. C. Garci, K. D. Breneman, G. B.
Olson, H. M. Jennings, Phase diagrams relevant to the hydration of C
3
S.
Part II: a phase diagram for the CaO-SiO2-H2O, Proc of 10th Int. Sympo-
sium on the chemistry of cement, 2ii058, Goteborg 1997.
Wyszukiwarka
Podobne podstrony:
10 ROZTWORY ELEKTROLITW 09
Równowaga w roztworach elektrolitów, NAUKA, chemia, lab
13 Równowagi w roztworach elektrolitów słabych
1 Równowagi w roztworach elektrolitów Kwasy i zasady
6 pHelek ul, Temat: Równowaga w roztworach elektrolitów
12.ROZTWORY ELEKTROLITÓW, ROZTWORY ELEKTROLITÓW
,podstawy chemii nieorganicznej L,Równowagi w roztworach elektrolitów
16 PRZEWODNICTWO ROZTWORÓW ELEKTROLITÓW
Obliczenie szybkość korozji
Roztwory elektrolitów
Pomiary elementów RLC Oblicz, AiR Politechnika Krakowska, II ELET - Elektrotechnika
PROCESY TRANSPORTU W ROZTWORACH ELEKTROLITÓW 3
więcej podobnych podstron