
Laboratory
3
Switched LANs
A Set of Local Area Networks Interconnected by Switches
Objective
This lab is designed to demonstrate the implementation of switched local area networks.
The simulation in this lab will help you examine the performance of different
implementations of local area networks connected by switches and hubs.
Overview
There is a limit to how many hosts can be attached to a single network and to the size of a
geographic area that a single network can serve. Computer networks use switches to
enable the communication between one host and another, even when no direct
connection exists between those hosts. A switch is a device with several inputs and
outputs leading to and from the hosts that the switch interconnects. The core job of a
switch is to take packets that arrive on an input and forward (or switch) them to the right
output so that they will reach their appropriate destination.
A key problem that a switch must deal with is the finite bandwidth of its outputs. If packets
destined for a certain output arrive at a switch and their arrival rate exceeds the capacity of
that output, then we have a problem of contention. In this case, the switch will queue, or
buffer, packets until the contention subsides. If it lasts too long, however, the switch will
run out of buffer space and be forced to discard packets. When packets are discarded too
frequently, the switch is said to be congested.
In this lab you will set up switched LANs using two different switching devices: hubs and
switches. A hub forwards the packet that arrives on any of its inputs on all the outputs
regardless of the destination of the packet. On the other hand, a switch forwards incoming
packets to one or more outputs depending on the destination(s) of the packets. You will
study how the throughput and collision of packets in a switched network are affected by
the configuration of the network and the types of switching devices that are used.
2
Procedure
Create a New Project
1. Start
the
OPNET IT Guru Academic Edition
⇒ Choose New from the File
menu.
2. Select
Project and click OK
⇒ Name the project
<your initials>_SwitchedLAN, and the scenario OnlyHub
⇒ Click OK.
3. In
the
Startup Wizard: Initial Topology dialog box, make sure that Create Empty
Scenario is selected
⇒ Click Next ⇒ Choose Office from the Network Scale list
⇒ Click Next three times ⇒ Click OK.
4. Close the Object Palette dialog box.
Create the Network
To create our switched LAN:
1. Select
Topology
⇒ Rapid Configuration. From the drop-down menu choose
Star and click OK.
2. Click
the
Select Models button in the Rapid Configuration dialog box. From the
Model List drop-down menu choose ethernet and click OK.
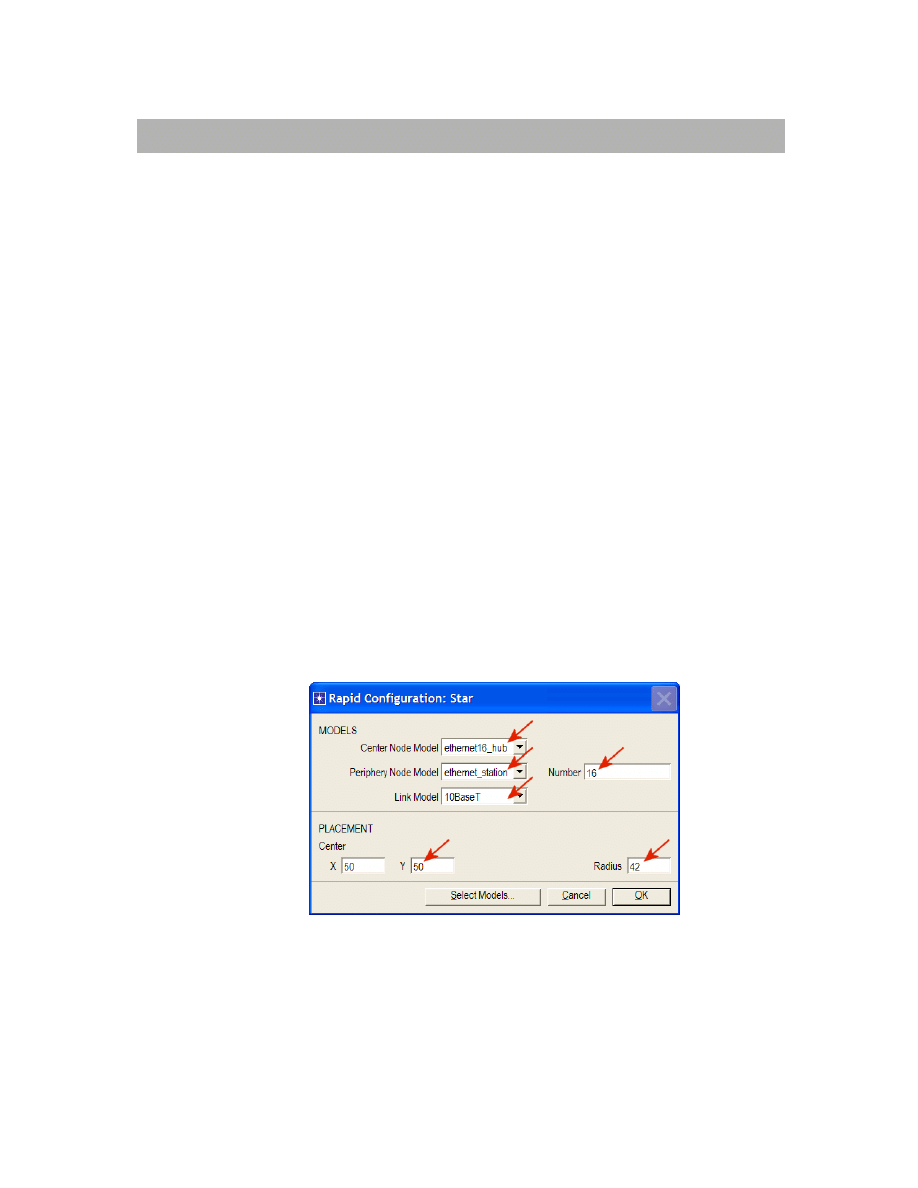
3. In
the
Rapid Configuration dialog box, set the following five values: Center Node
Model = ethernet16_hub, Periphery Node Model = ethernet_station, Link
Model = 10BaseT, Number=16, Y=50, and Radius = 42
⇒ Click OK.
4. Right-click
on
node_16, which is the hub
⇒ Edit Attributes ⇒ Change the name
attribute to Hub1 and click OK.
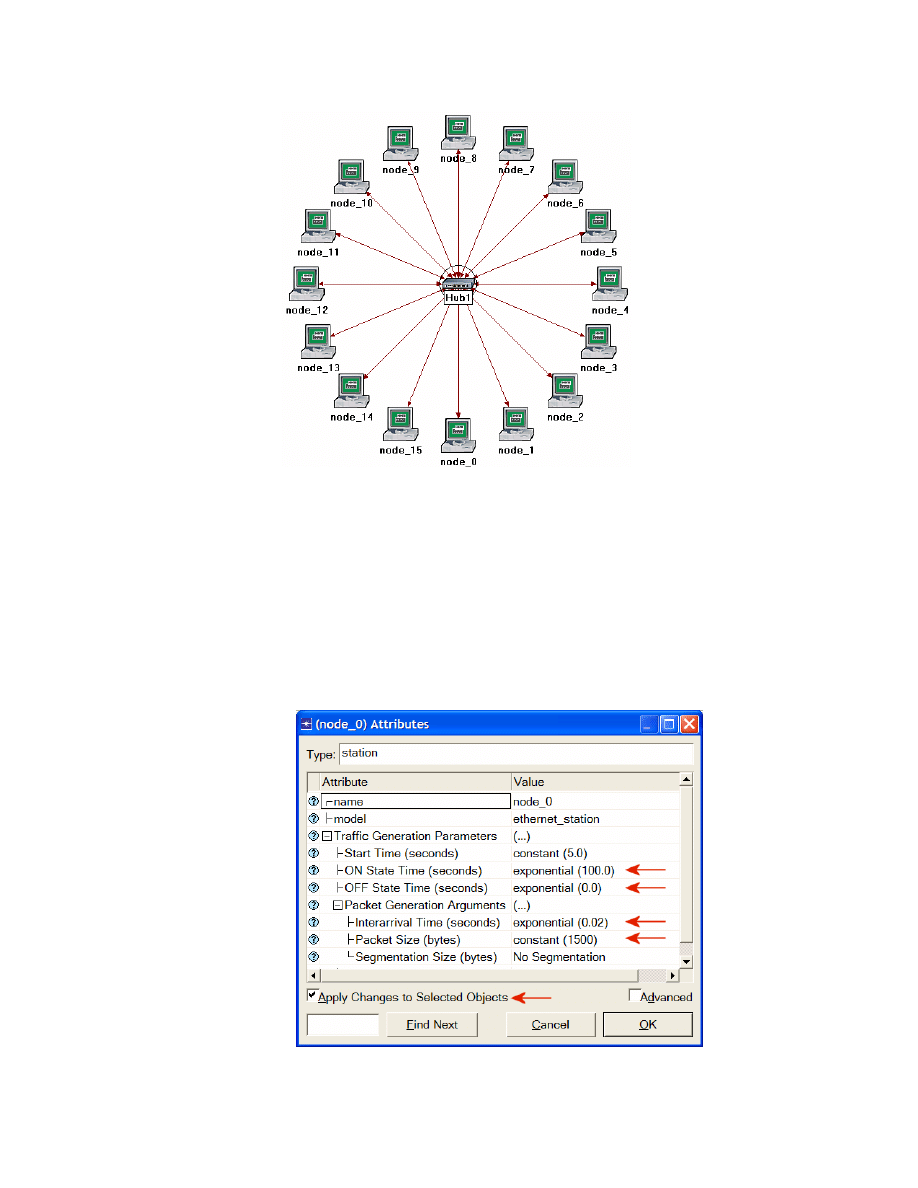
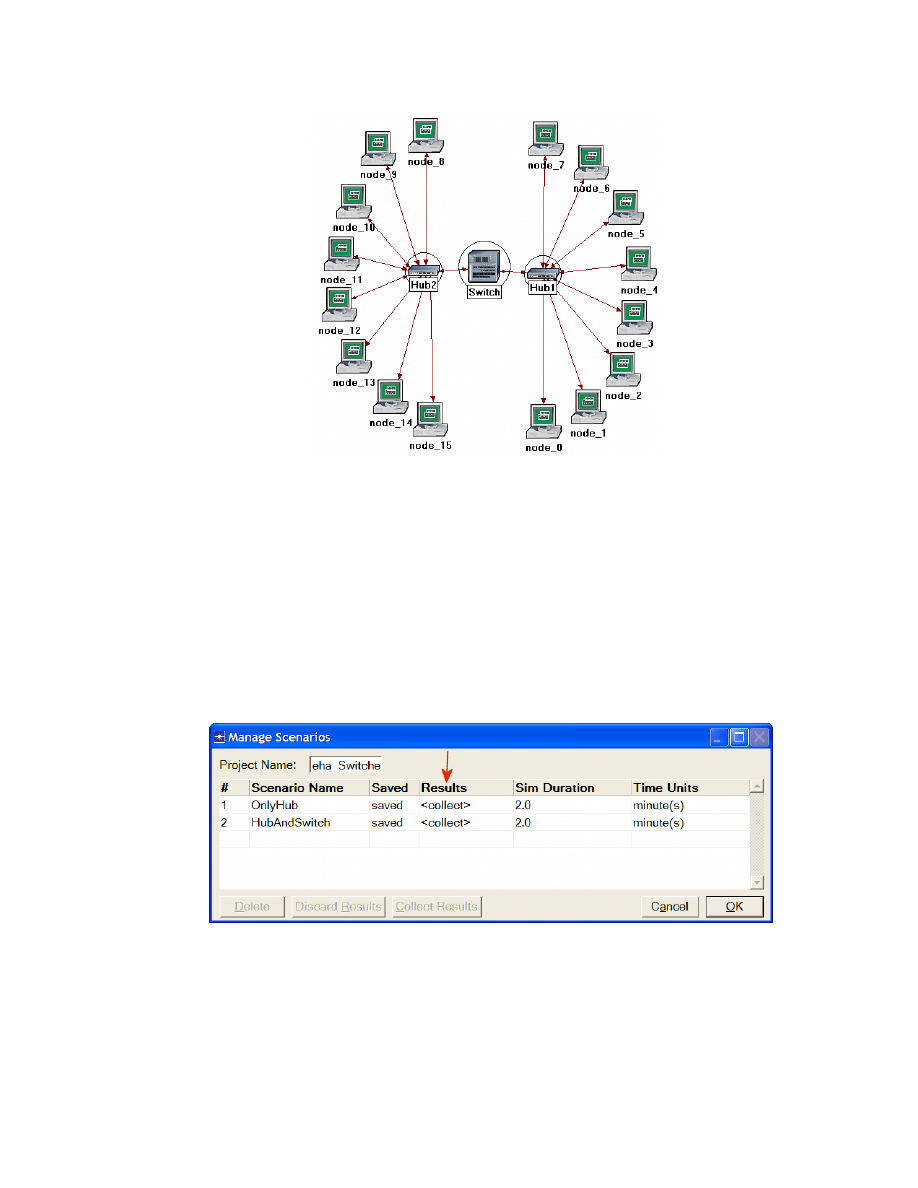
5. Now that you have created the network, it should look like the following one.
6. Make sure to save your project.
The 10BaseT link
represents an Ethernet
connection operating at
10 Mbps.
The prefix ethernet16_
indicates that the device
supports up to 16
Ethernet connections.
3
Configure the Network Nodes
Here you will configure the traffic generated by the stations.
1. Right-click on any of the 16 stations (node_0 to node_15)
⇒ Select Similar
Nodes. Now all stations in the network are selected.
2. Right-click on any of the 16 stations
⇒ Edit Attributes.
a. Check the Apply Changes to Selected Objects check box. This is
important to avoid reconfiguring each node individually.
3. Expand the hierarchies of the Traffic Generation Parameters attribute and the
Packet Generation Arguments attribute
⇒ Set the following four values:
4. Click OK to close the attribute editing window(s). Save your project.
4
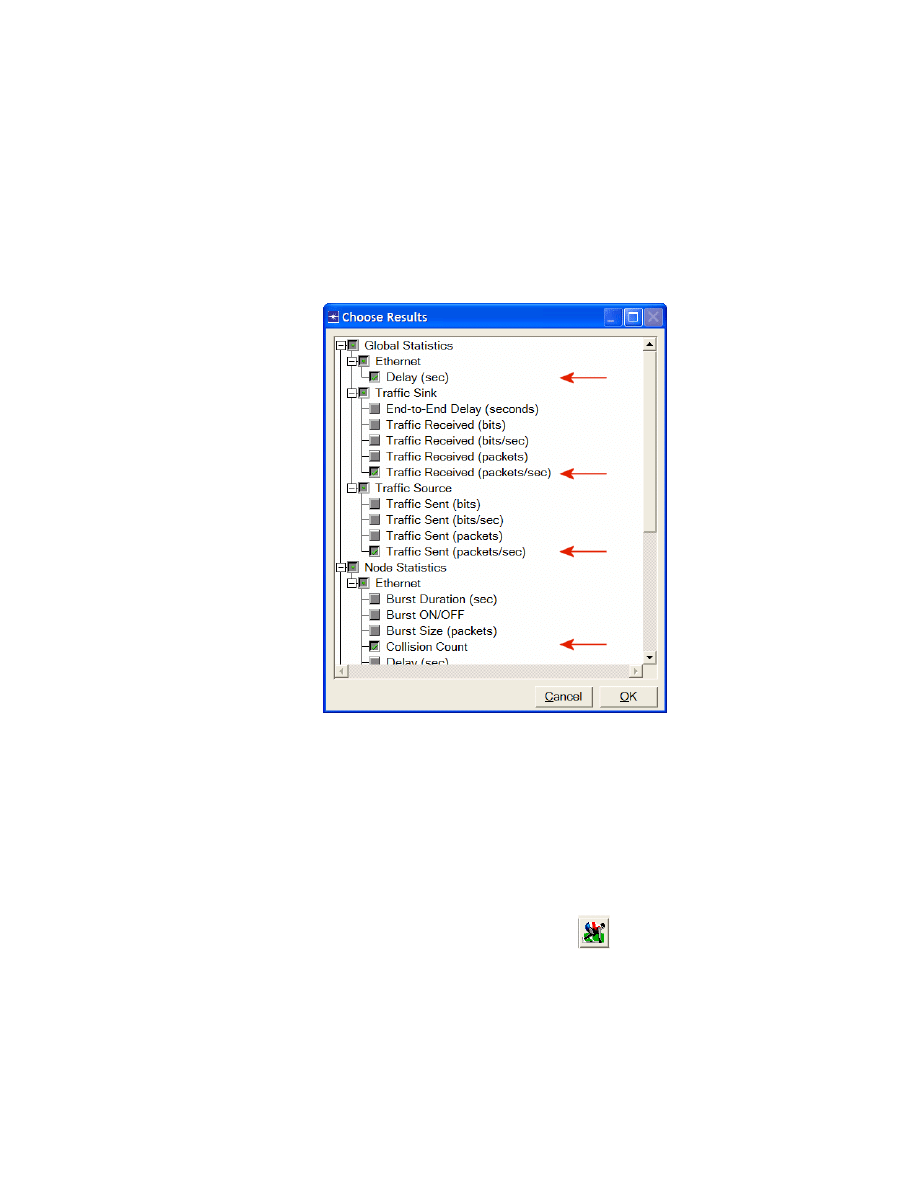
Choose Statistics
To choose the statistics to be collected during the simulation:
1. Right-click anywhere in the project workspace and select Choose Individual
Statistics from the pop-up menu.
2. In
the
Choose Results dialog box, choose the following four statistics:
3. Click
OK.
Configure the Simulation
Here we need to configure the duration of the simulation:
1. Click on the Configure/Run Simulation button:
2. Set the duration to be 2.0 minutes.
3. Click
OK.
Traffic Received (in
packets/sec) by the
traffic sinks across all
nodes.
Traffic Sent (in
packets/sec) by the
traffic sources across all
nodes.
Collision Count is the
total number of
collisions encountered
by the hub during packet
transmissions.
The Ethernet Delay
represents the end to
end delay of all packets
received by all the
stations.
5
Duplicate the Scenario
The network we just created utilizes only one hub to connect the 16 stations. We need to
create another network that utilizes a switch and see how this will affect the performance
of the network. To do that we will create a duplicate of the current network:
1. Select
Duplicate Scenario from the Scenarios menu and give it the name
HubAndSwitch
⇒ Click OK.
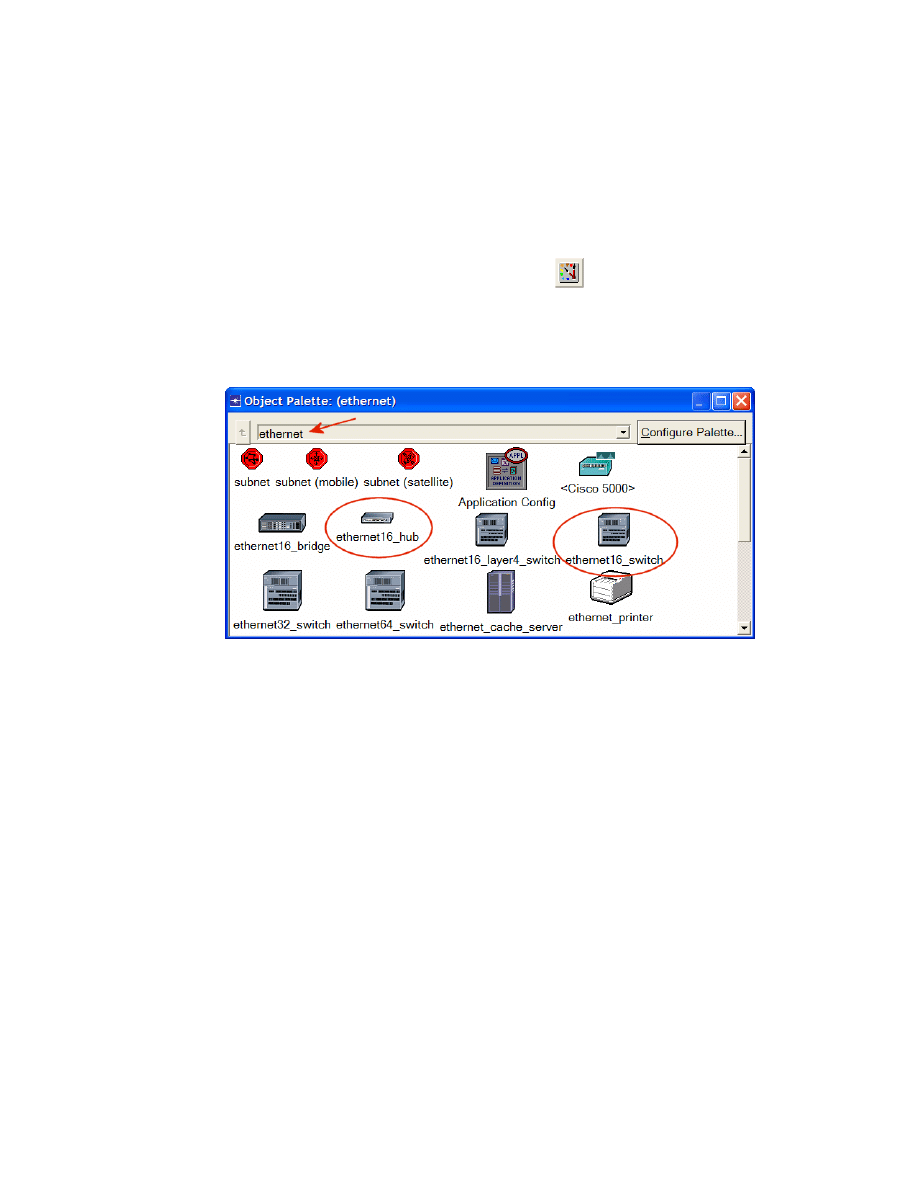
2. Open the Object Palette by clicking on
. Make sure that Ethernet is
selected in the pull-down menu on the object palette.
3. We need to place a hub and a switch in the new scenario. (They are circled in
the following figure.)
4. To
add
the
Hub, click its icon in the object palette
⇒ Move your mouse to the
workspace
⇒ Click to drop the hub at a location you select. Right-click to indicate
you are done deploying hub objects.
5. Similarly,
add
the
Switch
6. Close
the
Object Palette.
7. Right-click on the new hub
⇒ Edit Attributes ⇒ Change the name attribute to
Hub2 and click OK.
8. Right-click on the switch
⇒ Edit Attributes ⇒ Change the name attribute to
Switch and click OK.
9. Reconfigure the network of the HubAndSwitch scenario so that it looks like the
following one.
Hints:
a. To remove a link, select it and choose Cut from the Edit menu (or simply hit
the Delete key). You can select multiple links and delete all of them at once.
b. To add a new link, use the 10BaseT link available in the Object Palette.
6
10. Save your project.
Run the Simulation
To run the simulation for both scenarios simultaneously:
1. Select
Manage Scenarios from the Scenarios menu.
2. Change the values under the Results column to <collect> (or <recollect>)
for both scenarios. Compare to the following figure.
3. Click
OK to run the two simulations. Depending on the speed of your processor,
this may take several minutes to complete.
4. After the two simulation runs complete, one for each scenario, click Close.
5. Save your project.
7
View the Results
To view and analyze the results:
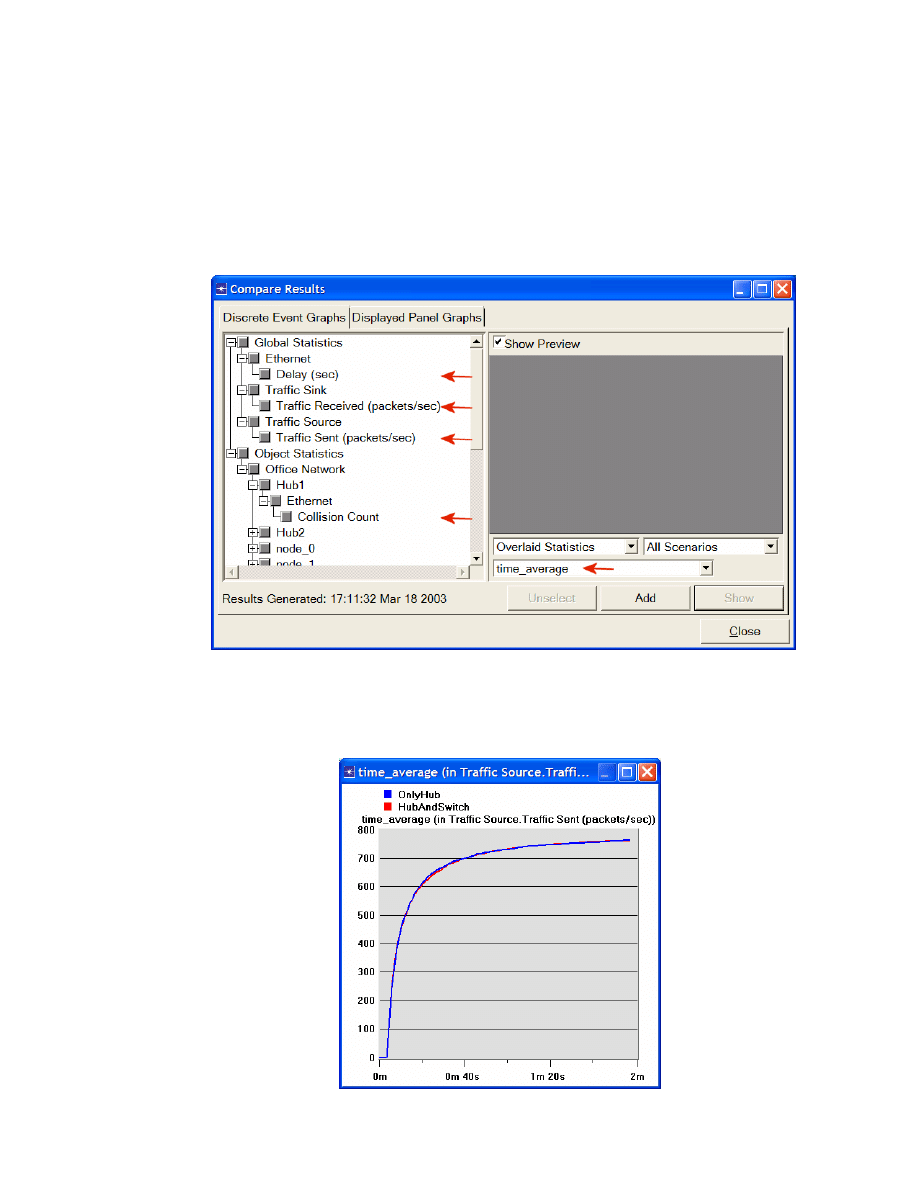
1. Select
Compare Results from the Results menu.
2. Change the drop-down menu in the lower-right part of the Compare Results
dialog box from As Is to time_average, as shown.
3. Select
the
Traffic Sent (packets/sec) statistic and click Show. The resulting
graph should resemble the one below. As you can see, the traffic sent in both
scenarios is almost identical.
time_average is the
average value over time
of the values generated
during the collection
window. This average is
performed assuming a
“sample-and-hold”
behavior of the data set
(i.e., each value is
weighted by the amount
of time separating it
from the following
update and the sum of
all the weighted values is
divided by the width of
the collection window).
For example, suppose
you have a 1-second
bucket in which 10
values have been
generated. The first 7
values were generated
between 0 and 0.3
seconds, the 8th value at
0.4 seconds, the 9th
value at 0.6 seconds ,
and the 10th at 0.99
seconds. Because the last
3 values have higher
durations, they are
weighted more heavily in
calculating the time
average.
8
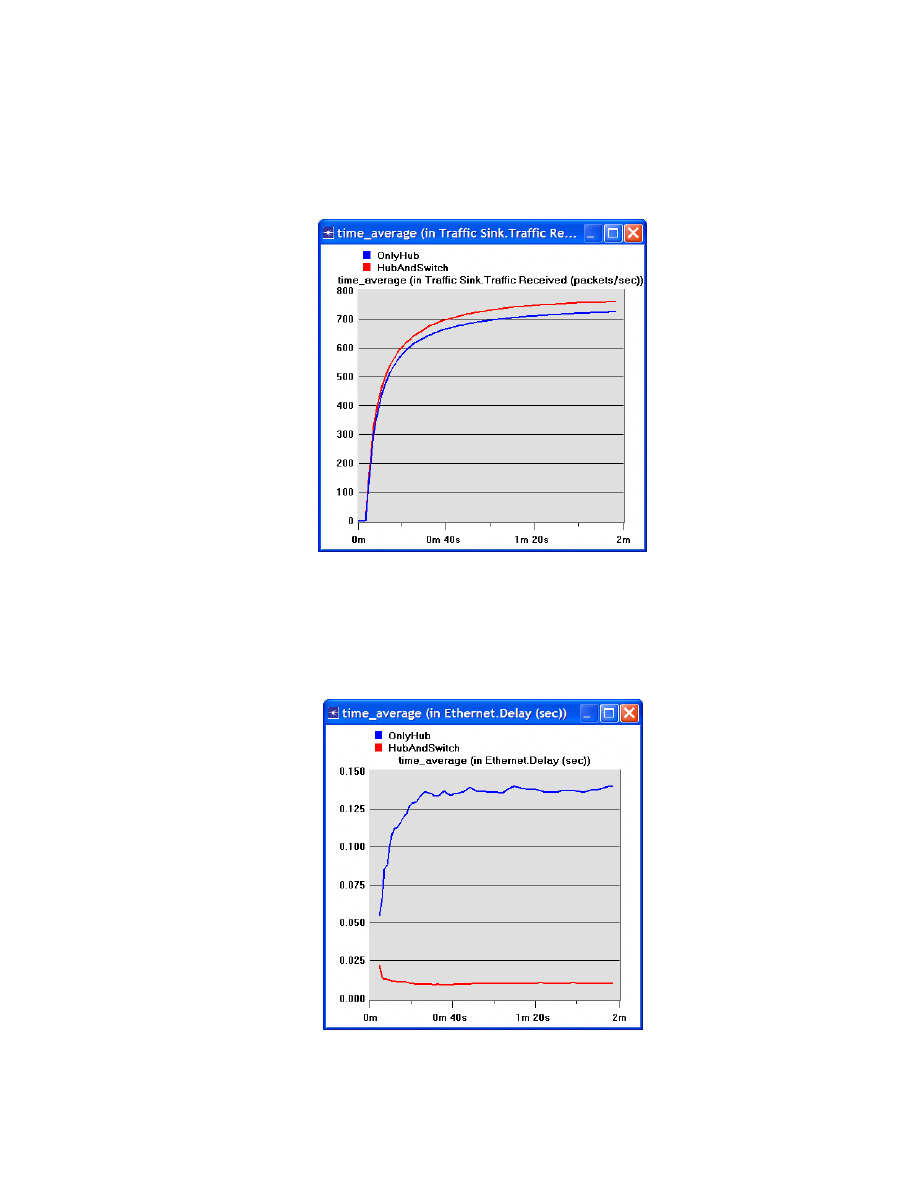
4. Select
the
Traffic Received (packets/sec) statistic and click Show. The resulting
graph should resemble the one below. As you see, the traffic received with the
second scenario, HubAndSwitch, is higher than that of the OnlyHub scenario.
5. Select the Delay (sec) statistic and click Show. The resulting graph should
resemble the one below. (Note: Result may vary slightly due to different node
placement.)
9
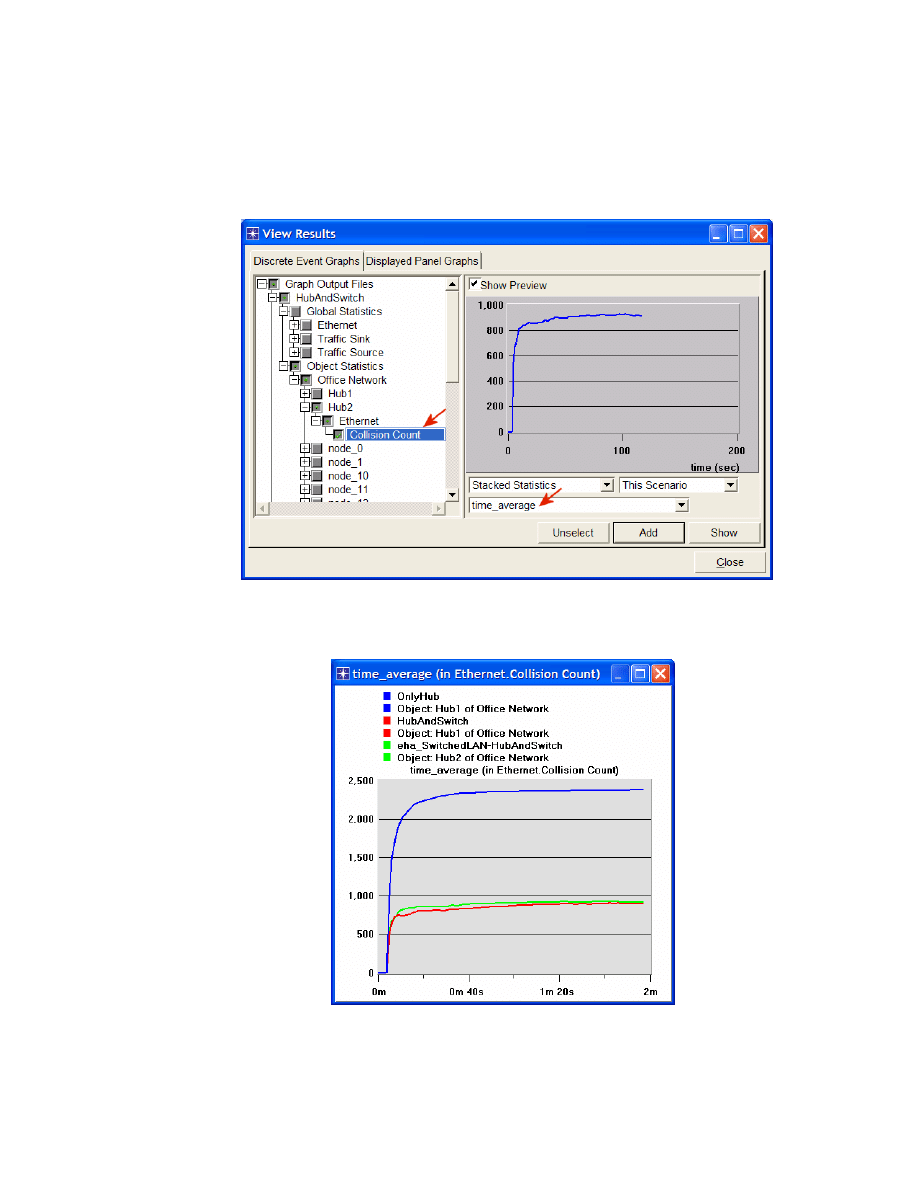
6. Select
the
Collision Count statistic for Hub1 and click Show.
7. On the resulting graph right-click anywhere on the graph area
⇒ Choose Add
Statistic
⇒ Expand the hierarchies as shown below ⇒ Select the Collision
Count statistic for Hub2
⇒ Change As Is to time_average ⇒ Click Add.
8. The resulting graph should resemble the one below.
9. Save your project.

10
Further Readings
− OPNET Building Networks: From the Protocols menu, select Methodologies ⇒
Building Network Topologies.
Questions
1)
Explain why adding a switch makes the network perform better in terms of
throughput and delay.
2)
We analyzed the collision counts of the hubs. Can you analyze the collision count
of the “Switch”? Explain your answer.
3)
Create two new scenarios. The first one is the same as the OnlyHub scenario
but replace the hub with a switch. The second new scenario is the same as the
HubAndSwitch scenario but replace both hubs with two switches, remove the
old switch, and connect the two switches you just added together with a 10BaseT
link. Compare the performance of the four scenarios in terms of delay,
throughput, and collision count. Analyze the results.
Note: To replace a hub with a switch, right-click on the hub and assign
ethernet16_switch to its model attribute.
Lab Report
Prepare a report that follows the guidelines explained in Lab 0. The report should include
the answers to the above questions as well as the graphs you generated from the
simulation scenarios. Discuss the results you obtained and compare these results with
your expectations. Mention any anomalies or unexplained behaviors.
Wyszukiwarka
Podobne podstrony:
eksploracja lab03, Lista sprawozdaniowych bazy danych
Page153 Model 2491 2492 2493 Digital Switchboard meter c
Baumer Inductive proximity switch IFFM 08P17A6 KS35L
BODY SWITCH
5 3 3 5 Packet Tracer Configure Layer 3 Switches Instructions
easy500 Year time switch HLP EN
LAB03
1830 switch datasheet
BO Lab03
MikroTik jako zarządzany switch
lab03
Instrukcja SWITCH
Lab03
61 STEERING COLUMN SWITCHES
0 0 0 1 Lab Initializing and Reloading a Router and Switch
Cisco 1900 Catalyst Switch Commands
Inventor2011 Classic UI Switch
[2006] Application of Magnetic Energy Recovery Switch (MERS) to Improve Output Power of Wind Turbine
więcej podobnych podstron