
A new method to develop typical weather years in different climates for building
energy use studies
Liu Yang
, Kevin K.W. Wan
, Danny H.W. Li
, Joseph C. Lam
,
a
School of Architecture, Xi
’an University of Architecture and Technology, Shaanxi 710055, China
b
Building Energy Research Group, Department of Civil and Architectural Engineering, City University of Hong Kong, Tat Chee Avenue, Kowloon, Hong Kong SAR, China
a r t i c l e i n f o
Article history:
Received 12 April 2011
Received in revised form
25 July 2011
Accepted 29 July 2011
Available online 1 September 2011
Keywords:
Principal component analysis
Typical weather years
Building energy use
Climate change
General circulation models
China
a b s t r a c t
Principal component analysis of 30-year long-term meteorological variables was conducted. Typical
principal component years (TPCYs) were determined for Harbin, Beijing, Shanghai, Kunming and Hong
Kong representing the
five major architectural climates across China: severe cold, cold, hot summer and
cold winter, mild, and hot summer and warm winter. In each climate zone, the TPCY was compared with
the 30 individual years and the widely used typical meteorological year (TMY). The monthly principal
component and the predicted total building energy consumption based on the TPCY and TMY were very
close to the 30-year long-term mean estimation. TPCY for the 21st century in each of the
five cities was
also identi
fied using predictions from general climate models. The TPCY approach is a good alternative to
the TMY method. Firstly, predicted building energy use from TPCY is closer to the long-term estimation
than that from the TMY in different climates. Secondly, because only monthly data are considered, the
development of TPCY is much simpler and less time-consuming. This would have important applications
in the regular updating of typical weather years for building energy studies and in the assessment of the
impact of climate change on energy use in the built environment.
Ó 2011 Elsevier Ltd. All rights reserved.
1. Introduction
Recent reports by the Inter-governmental Panel on Climate Change
(IPCC) had raised public awareness of energy use and the environ-
mental implications
. Carbon emissions from the use of energy in
buildings were one of the major components in the overall emissions
scenarios. It was estimated that in 2002, buildings accounted for 33% of
the global greenhouse gas emissions
. There has been a steady
increase in energy use in China since the adoption of the Policy of
Reforming and Opening in the 1980s. Building stocks accounted for
about 24.1% of total national energy use in 1996, rising to about 27.5%
in 2001, and was projected to increase to about 35% in 2020
Although carbon emissions per capita in China are low, its total
emissions in 2005 accounted for 19% of the global emissions and were
only second to the US
. In 2007, with 6.1 Gt (10
9
tonnes) of energy-
related CO
2
emissions China overtook the US
. In 2009, the total
energy consumption reached 3.1 billion tons of standard coal equiv-
alent, accounting for about 14.3% of the world total
. When the life-
cycle energy use and emissions footprint are considered, buildings
account for a signi
ficant proportion of the energy-related emissions.
One way to alleviate the ever-growing demand for energy is to have
more energy-ef
ficient building designs and proper building energy
conservation programmes
.
Building designs and energy use in the built environment are
directly related to the prevailing climates. Studies on the long-term
climatic variations in China had found changes in the local climates
and the heat/cold stresses in the different climate zones especially
during the last two decades of the 20th century
e12]
. Buildings
typically have a long life span, lasting for 50 years or more. It is,
therefore, important to be able to investigate how buildings will
respond to climate change in the future and assess the likely changes in
energy use. Building energy simulation is an acceptable technique for
assessing the dynamic interactions between the external climates, the
building envelope and the heating, ventilation and air-conditioning
(HVAC) system and the corresponding energy consumption. It has
played an important role in the development of simple design tools
and building energy ef
ficiency codes
. A key element in
building energy simulation is the 8760 hourly records of weather data,
representative of the prevailing weather conditions. All energy simu-
lation computer programs require weather data input to drive the
thermal models within the simulation tools.
The purpose and end-use of the building energy simulation
must be considered when choosing the weather data. Broadly
speaking, there are three types of hourly weather data for building
* Corresponding author. Tel.: þ86 852 3442 7606; fax: þ86 852 3442 0427.
E-mail address:
(J.C. Lam).
Contents lists available at
Energy
j o u r n a l h o m e p a g e : w w w . e l s e v i e r . c o m / l o c a t e / e n e r g y
0360-5442/$
e see front matter Ó 2011 Elsevier Ltd. All rights reserved.
doi:

energy simulation, namely multi-year data sets, typical weather
years and representative days. Adopting a multi-year data set is
sometimes not feasible and economical for the common building
design and analysis, whereas representative days are often too
limited and not detailed enough for a speci
fic design and analysis
problem. Therefore, for detailed building energy analysis, typical
years are the most commonly used. The typical weather year
approach can reduce the computational efforts in simulation and
weather data handling by using one year instead of multiple years.
Besides, a consistent form of weather data is ensured so that results
from different studies can be compared. The development of
a typical weather year from a multi-year database, however, can be
time-consuming or even not practicable. For instance, the devel-
opment of a typical meteorological year (TMY) in climate change
studies for the 21st century for a particular location would involve
downloading 100 years of hourly/daily predictions from general
circulation models (GCMs). There would also be an enormous
amount of statistical analysis of the long-term frequency distribu-
tions of the different meteorological variables such as temperature,
humidity and solar radiation. Though not insurmountable, a simple
approach using only monthly data to select the 12 typical months to
form a typical weather year would certainly be more desirable.
Earlier work on long-term trends of energy consumption in
buildings involving principal component analysis of key monthly
meteorological variables indicated good correlation between the
long-term weather conditions and the corresponding sector-wide
energy consumption
as well as building energy simulation
results
. The objective of the present work was, therefore, to
investigate the feasibility of using principal component analysis
technique to develop an alternative approach to select a typical
weather year within each of the major climate zones across China
and assess its suitability for building energy estimation.
2. Methodology
First of all, major climates relevant to building energy studies
were identi
fied from existing climate classifications. A city within
each climate zone was then selected for this study. For each city the
12 typical meteorological months (TMMs) were determined and
the corresponding TMY was developed accordingly. Likewise,
principal component analysis of major meteorological variables
was conducted so that the 12 typical principal component months
(TPCMs) could be developed to form the typical principal compo-
nent year (TPCY). Multi-year building energy simulation was then
conducted using the hourly weather data from each of the 30 years,
the TMY and the TPCY. The suitability of the TPCY for building
energy studies was assessed in terms of its ability to produce
predictions close to the 30-year long-term mean energy estimation
through statistical analysis. Attempts were also made to develop
the 12 TPCMs in the 21st century in each of the major climate zones
identi
fied using predictions from general circulation models.
3. Major climate zones and cities
China is a large country with an area of about 9.6 million square
kilometres. Approximately 98% of the land area stretches between
a latitude of 20
N and 50
N, from the subtropical zones in the south
to the temperate zones (including warm-temperate and cool-
temperate) in the north
. The maximum solar altitudes vary
a great deal and there is a large diversity of climates, especially the
temperature distributions during winter. Characteristics associated
with continental climates can be identi
fied, with warmer summers,
cooler winters and a larger annual temperature range than other
parts of the world at similar latitudes. China also has a complex
topography ranging from mountainous regions to
flat plains. This
diversity and complexity have led to many different regions with
distinct climatic features
. There are various ways to classify
climate types or zones according to different criteria using different
climatic variables and indices. In China, the most commonly used
one is for the thermal design of buildings, concerning mainly
conduction heat gain/loss and the corresponding thermal insulation
issues. It has
five climate types: severe cold, cold, hot summer and
cold winter, mild, and hot summer and warm winter
. The
zoning criteria are mainly based on the average temperatures in the
coldest and hottest months of the year. The number of days that
daily average temperature is below 5
C or above 25
C is counted as
the complementary indices for determining the zones.
shows
an overall layout of the
five major architectural climates. Because of
the varying topology and elevations, there are nine regions
e both
the severe cold and cold climates have three regions. A city was
selected within each of the
five major climate zones: Harbin (severe
cold, 45
45
0
N/126
46
’E), Beijing (cold, 39
48
’N/116
28
’E), Shanghai
(hot summer and cold winter, 31
10
’N/121
26
’E), Kunming (Mild,
25
01
’N/102
41
’E) and Hong Kong (hot summer and warm winter,
22
18
’N/114
10
’E).
4. Development of typical meteorological years (TMYs)
A TMY was developed for each of the
five cities within the major
climate zones. Details of the TMY concept and development work
can be found in Lam et al.
, Ecevit et al.
and Yang et al.
.
Brie
fly, the TMY method developed by the Sandia National Labo-
ratories in the United States is one of the most widely adopted for
determining typical weather years
. A TMY consists of 12
typical meteorological months (TMMs) selected from various
calendar months in a multi-year weather database. For example,
the January of 1980 may be selected as the
first TMM, the February
of 1989 as the second TMM, and so on. The 12 months selected will
then be combined to form the TMY. Smoothing of data for
discontinuities is usually required to avoid abrupt changes at the
boundary between two adjacent months selected from different
years. Selection of a TMM is based on the statistical analysis and
evaluation of four climatic variables: dry-bulb temperature (DBT),
dew-point temperature (DPT), wind speed (WSP) and global solar
radiation (GSR). In general, nine indices are considered including
the daily maxima, minima and means of DBT and DPT, the daily
maximum and mean values of WSP and the daily total GSR.
Hot summer &
cold winter
70
75
80
85
90
95
100
105
110
115
120
125
130
135
50
45
40
35
30
25
20
45
40
35
30
25
20
85
90
95
100
105
110
115
120
125
Severe cold
Cold
Severe cold
Cold
Cold
Beijing
Severe cold
Hot summer &
warm winter
Mild
Shanghai
Harbin
Hong Kong
Kunming
Fig. 1. Major architectural climates across China and geographical distribution of the
five cities.
L. Yang et al. / Energy 36 (2011) 6121
e6129
6122

A summary of the nine daily indices and their respective weightings
is shown in
. It can be seen that version 2 of TMY (i.e. TMY2)
also includes direct radiation in the selection of TMM
.
The TMM selection involves minimising the difference between
the cumulative distribution function (CDF) of the month being
considered and the long-term CDF using a nonparametric method
known as Finkelstein-Schafer (FS) statistics
. An empirical CDF,
which is a monotonic increasing function, is de
fined as follows:
S
n
x
¼
8
<
:
0
for x
< x
ð1Þ
ðk 0:5Þ=n for x
ðkÞ
x x
ðkþ1Þ
1
for x
x
ðnÞ
(1)
where
S
n
(x)
¼ value of the cumulative distribution function at x
n
¼ total number of elements
k
¼ rank order number ¼ 1, .., n 1
Values of the FS statistics are calculated for each of the daily
indices (see
) using the following equation:
FS
¼
1
N
X
N
i
¼ 1
d
i
(2)
where
FS
¼ value of FS test statistics
d
i
¼ absolute difference between the long-term CDF and the
yearly CDF at x(i) value
N
¼ the number of daily readings for that month (e.g. for
January, N
¼ 31)
The procedure assumes that a TMY consisting of the 12 TMMs
would have weather patterns and system performance characteristics
close to the long-term climatic conditions. It is generally believed that
the longer the period of record used, the more representative of the
prevailing long-term climate patterns of a particular location the
results would be. Selection of a comparatively short historical period
of record would not re
flect the long-term climatic conditions. For
building energy calculations, it was found that a 30-year record would
produce conservatively stable temperature patterns
. Weather
data measured during the 30-year period (1971
e2000 for the four
mainland cities and 1979
e2008 for Hong Kong) were gathered and
analysed. The basic process on frequency distributions was performed
to determine the values of the nonparametric statistics for each of the
seven indices shown in
. The year closest to the long-term mean
distribution (i.e. with the lowest weighted-sum average of the FS test
statistics) was selected as the TMM.
shows a summary of the
12 TMMs selected for each of the
five cities.
5. Development of typical principal component years (TPCYs)
In the analysis of long-term meteorological variables, it is often
advantageous to group key weather variables directly affecting
building energy performance. Principal component analysis (PCA)
is a multivariate statistical technique for analysis of the depen-
dencies existing among a set of inter-correlated variables
.
Due to its ability to categorise the complex and highly inter-
correlated set of meteorological variables as one or more cohesive
indices, PCA tends to give a better understanding of the cause/effect
relationship. PCA is conducted on centred data or anomalies, and is
used to identify patterns of simultaneous variations. Its purpose is
to reduce a data set containing a large number of inter-correlated
variables to a data set containing fewer hypothetical and uncorre-
lated components, which nevertheless represents a large fraction of
the variability contained in the original data. These components are
simply linear combinations of the original variables with coef
fi-
cients given by the eigenvector.
Initially,
five climatic variables were considered: dry-bulb
temperature (DBT, in
C), wet-bulb temperature (WBT, in
C),
global solar radiation (GSR, in MJ/m
2
), clearness index and wind
speed. DBT affects the thermal response of a building and the
amount of heat gain/loss through the building envelope and energy
use for the corresponding sensible cooling/heating requirements.
WBT dictates the amount of humidi
fication required during the dry
winter days and the latent cooling under humid summer condi-
tions. Information on solar radiation is crucial to cooling load
determination and the corresponding design and analysis of air-
conditioning systems. In the tropical and subtropical climates, solar
heat gain through the fenestrations is often the largest component
of the building envelope cooling load
. For colder climates,
solar heat could be a key design factor in both passive and active
Table 1
Weighting factors for the Finkelstein-Schafer statistics.
Index
Sandia method
TMY
NSRDB
TMY2
Present
study
Temperature
Max dry-bulb temp
1/24
1/20
1/24
Min dry-bulb temp
1/24
1/20
1/24
Mean dry-bulb temp
2/24
2/20
2/24
Humidity
Max dew-point temp
1/24
1/20
e
Min dew-point temp
1/24
1/20
e
Mean dew-point temp
2/24
2/20
4/24
Wind
Max wind speed
2/24
1/20
2/24
Mean wind speed
2/24
1/20
2/24
Solar
radiation
Global radiation
12/24
5/20
12/24
Direct radiation
e
5/20
e
Table 2
Summary of the 12 typical meteorological months (TMMs) and typical principal component months (TPCMs) selected for the
five cities.
Harbin
Beijing
Shanghai
Kunming
Hong Kong
TMM
TPCM
TMM
TPCM
TMM
TPCM
TMM
TPCM
TMM
TPCM
Jan
1982
1974
1988
1974
1982
1978
1989
1990
1995
2006
Feb
1982
1975
1981
1996
1981
1994
1989
1991
1988
1998
Mar
1982
1978
1983
1996
1979
1979
1971
1978
2003
2006
Apr
1984
1991
1985
1995
1990
1993
1986
1987
1980
1987
May
1986
1971
1984
1992
1976
1980
1993
1973
1997
2005
Jun
1986
1972
1984
1974
1973
1972
1984
1998
1990
1990
Jul
1990
1977
1991
1977
1986
1983
1989
1979
2000
1985
Aug
1980
1999
1983
1990
1986
1991
1977
1972
2003
1982
Sep
1981
1989
1984
1976
1982
1984
1990
1971
1982
1982
Oct
1987
1989
1984
1994
1980
1975
1992
1985
1984
1984
Nov
1982
1993
1984
1984
1989
1996
1982
1985
1989
1990
Dec
1983
1983
1994
1972
1972
1995
1993
1976
2001
2001
L. Yang et al. / Energy 36 (2011) 6121
e6129
6123

solar designs for buildings with substantial space heating require-
ments
. Clearness index indicates the prevailing sky conditions
while wind speed affects natural ventilation and the external
surface resistance and hence the U-values of the building envelope.
Contributions to the principal components from the clearness
index and wind speed, however, were found to be small compared
with the DBT, WBT and GSR [
]. These 2 climatic variables were,
therefore, not considered.
The 30-year monthly data for the three meteorological variables
were gathered and analysed. Altogether 30
12 3 data were
considered in the PCA for each city.
shows the coef
ficients of
the three principal components and the relevant statistics from the
PCA for Harbin. The eigenvalue is a measure of the variance
accounted for by the corresponding principal component. The
first
and largest eigenvalue accounts for most of the variance, the
second accounts for the second largest amounts of variance, and so
on. A common approach is to select only those with eigenvalues
equal to or greater than one (eigenvalues greater than one imply
that the new principal components contain at least as much
information as any one of the original climatic variables
) or
with at least 80% cumulative explained variance
. These criteria
were adopted for this study. From
, it can be seen that the
first principal component had an eigenvalue greater than one with
a cumulative explained variance exceeding 90% (i.e. a one-
component solution would account for more than 90% of the
variance in the original climatic variables). Similar features were
observed for the other four cities. The
first principal component
was, therefore, retained and a new set of monthly variable, Z,
determined as a linear combination of the original three climatic
variables as follows:
Z
¼ A DBT þ B WBT þ C GSR
(3)
shows a summary of the coef
ficients A, B and C for the five
cities. Measured data for the three climatic variables were analysed
and the monthly values of Z determined for the 30-year period. As
mentioned earlier, there was a close correlation between energy use
in buildings and the principal component Z. It was, therefore, argued
that for a particular calendar month, the year with a monthly Z closest
to the 30-year long-term average would possess weather character-
istics similar to the long-term situation. The year with the Z closest to
the long-term average was thus selected as the typical principal
component month (TPCM).
shows a summary of the 12
TPCMs determined for the
five cities. It can be seen that the number of
months that have the same year selected for both the TMM and TPCM
was small, ranging from none in Kunming (mild climates) to four in
Hong Kong (hot summer and warm winter). To have a better
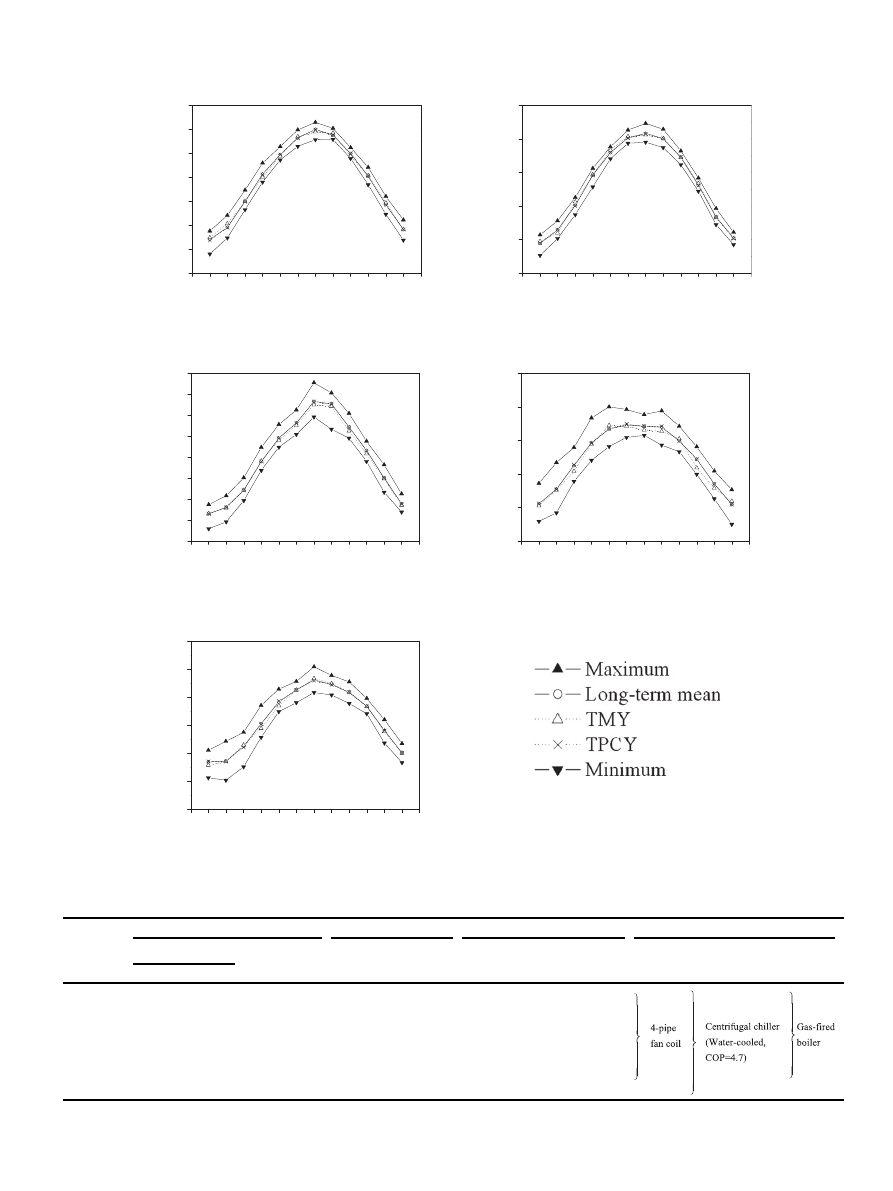
understanding of the differences, pro
files of the monthly Z for the
TMY and TPCY were compared with those from the 30 individual
years. For each city,
five profiles were considered e the range of
maximum and minimum monthly Z from the 30 individual years,
long-term mean (i.e. the 30-year average), TMY and TPCY. A summary
is shown in
. In general, TMY and TPCY fell within the minimum
and maximum ranges and tended to follow the long-term means
quite closely. It is interesting to see that although the years selected
for the TMMs and TPCMs were mostly different, the monthly Z for all
the 12 calendar months were rather close to each other in all
five
cities. In Harbin, the annual principal component Z for the long-term
mean, TMY and TPCY was 17.45, 17.59 and 17.39, respectively; Beijing
32.83, 32.14 and 32.77; Shanghai 39.54, 38.74 and 39.47; Kunming
34.74, 34.15, and 34.79; and Hong Kong 52.15, 51.86 and 52.09. This
suggests that although the selection methods and the actual typical
months selected were different, TMY and TPCY exhibited similar
weather characteristics at least in terms of the principal component Z
and followed the long-term mean quite closely.
6. Comparisons of building energy use estimations from
different weather years
Apart from ensuring that key climatic variables of the TMY and
TPCY closely follow their long-term values and statistically represent
the prevailing weather conditions, it is also important to ascertain
whether these typical weather years do produce simulation results
that are close to the long-term means. Hour-by-hour energy simu-
lations were conducted for each of the 30 years using the simulation
tool VisualDOE4.1
. Two major inputs were considered for the
simulation: (i) 8760 hourly records of weather data (DBT, WBT, GSR,
wind speed and wind direction), and (ii) a generic of
fice building for
each city, details of which can be found in Wan et al.
. Brie
fly, it
was a 35 m
35 m, 40-storey building with curtain walling design,
3.4 m
floor-to-floor height and 40% window-to-wall ratio. The total
gross
floor area (GFA) was 49000 m
2
(41160 m
2
air-conditioned and
7840 m
2
non-air-conditioned). The air-conditioned space had
five
zones - four at the perimeter and one interior. Obviously, each city
would in reality have rather different building envelope designs to
suit the local climates. Generic building envelopes and HVAC designs
were developed based on the prevailing architectural and engi-
neering practices and the local design/energy codes in the four cities
on the mainland
and in Hong Kong
shows
a summary of the key design parameters.
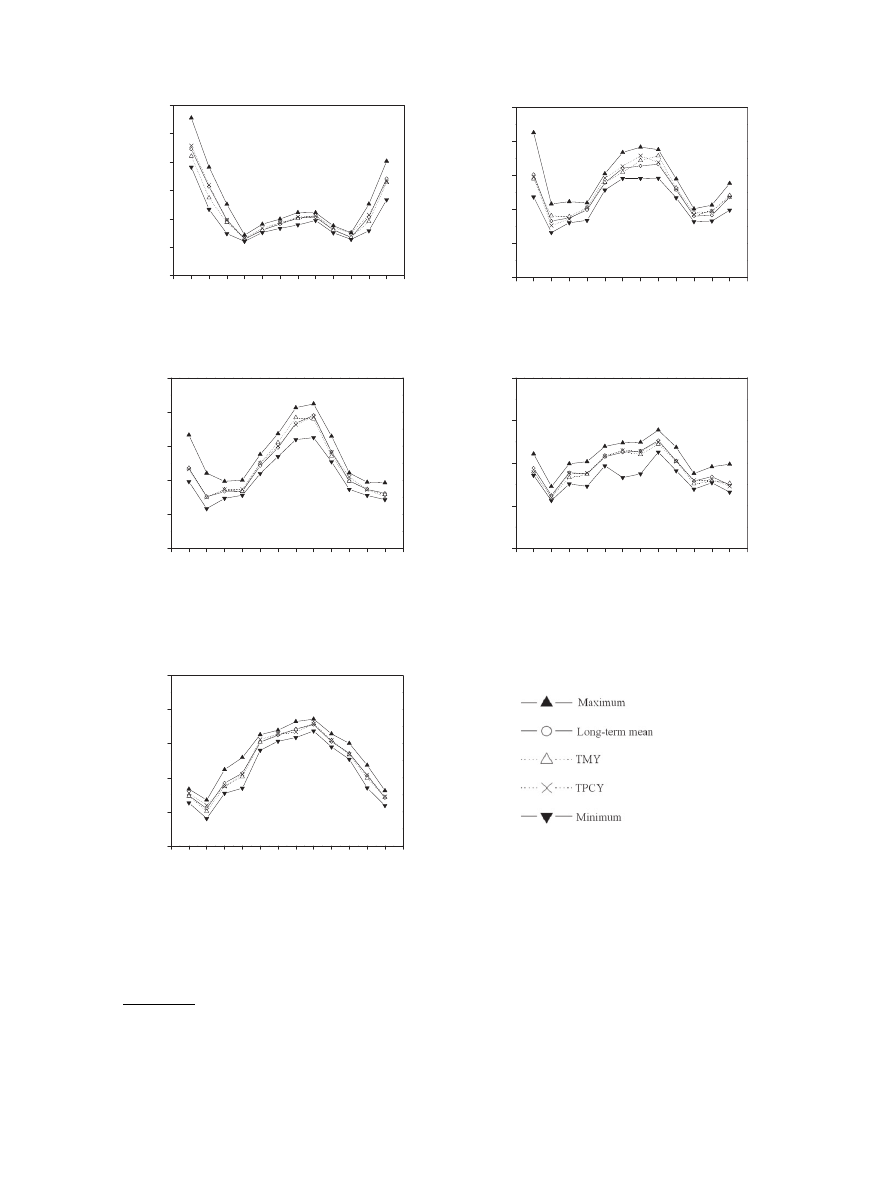
For each city, the total building energy consumption predicted
from the 32 simulation runs (i.e. 30 individual years plus TMY and
TPCY) were analysed. Monthly energy use from the TMY and TPCY
was compared with those from the 30 individual years, and
a summary for the
five cities is shown in
. Again, it can be seen
that both the TMY and TPCY predictions were within the maximum
and minimum ranges and tended to follow the long-term means
rather closely. To get an idea about variations of the predicted
monthly energy consumption from different years, mean bias error
(MBE) and root mean square error (RMSE) were determined for
each of the 32 simulated results as follows:
MBE
j
¼
X
12
i
¼ 1
ðx
i
y
i
Þ
12
(4)
where
x
ij
¼ monthly total building energy use for each year (j ¼ 1e32)
y
i
¼ monthly total building energy use for the 30-year long-term
mean
Table 3
Summary of principal component analysis of dry-bulb temperature (DBT), wet-bulb
temperature (WBT) and global solar radiation (GSR) for Harbin.
Principal
component
Eigenvalue
Cumulative explained
variance (%)
Coef
ficient
DBT
WBT
GSR
1st
2.898
96.58
0.992
0.990
0.966
2nd
0.100
99.91
0.121
0.133
0.260
3rd
0.003
100
0.038
0.037
0.001
Table 4
Summary of the coef
ficients for the principal component.
City
A
B
C
Harbin
0.992
0.990
0.966
Beijing
0.983
0.967
0.883
Shanghai
0.980
0.974
0.883
Kunming
0.997
0.967
0.304
Hong Kong
0.977
0.940
0.628
L. Yang et al. / Energy 36 (2011) 6121
e6129
6124
J
F
M
A
M
J
J
A
S
O
N
D
-60
-40
-20
0
20
40
60
80
Monthly
principa
l co
mpon
ent Z
Month
Harbin
J
F
M
A
M
J
J
A
S
O
N
D
-20
0
20
40
60
80
Monthly
principa
l co
mpon
ent Z
Month
Beijing
J
F
M
A
M
J
J
A
S
O
N
D
0
10
20
30
40
50
60
70
80
Monthly principa
l
co
mpon
ent
Z
Month
Shanghai
J
F
M
A
M
J
J
A
S
O
N
D
10
20
30
40
50
60
Monthly principa
l
co
mpon
ent
Z
Month
Kunming
J
F
M
A
M
J
J
A
S
O
N
D
20
30
40
50
60
70
80
M
onthly pr
inc
ip
al com
p
onen
t Z
Month
Hong Kong
Fig. 2. Comparison of monthly Z between TMY, TPCY and 30-year long-term mean for the
five cities.
Table 5
Summary of the key building envelope and HVAC design data for the
five cities (Ref.
City
Building envelope
Indoor design condition
Internal load density
HVAC
U-value (W/m
2
K)
Window shading
coef
ficient
Summer (
C)
Winter (
C)
Occupancy
(m
2
/person)
Lighting
(W/m
2
)
Equipment
(W/m
2
)
AHU
Cooling
Heating
Wall
Window
Roof
Harbin
0.44
2.50
0.35
0.64
25
20
8
18
13
Beijing
0.60
2.60
0.55
0.70
25
20
8
18
13
Shanghai
1.00
3.00
0.70
0.55
25
20
8
18
13
Kunming
1.47
3.50
0.89
0.50
25
20
8
18
13
Hong Kong
2.01
5.60
0.54
0.40
24
21
13
15
10
VAV
Electric
Notes: HVAC
¼ Heating, ventilation and air-conditioning; AHU ¼ Air-handling unit; VAV ¼ Variable-air volume.
L. Yang et al. / Energy 36 (2011) 6121
e6129
6125
RMSE
j
¼
ffiffiffiffiffiffiffiffiffiffiffiffiffiffiffiffiffiffiffiffiffiffiffiffiffiffiffi
X
12
i
¼ 1
ðx
i
y
i
Þ
2
12
v
u
u
u
u
t
(5)
To put the inter-year variations in perspective, MBE and RMSE
were normalised by the respective 30-year long-term monthly
mean value in each city, and the
findings are shown in
. In
Harbin, MBE ranged from
6.6% (under-estimation) in 1995 to 5.6%
(over-estimation) in 1977, and RMSE from 3.3% in 1984 to 11.8% in
1977. These suggest that the estimated annual building energy use
in 1977 could be 5.6% different from the 30-year long-term mean
and the individual months could differ by 11.8%. The MBE and RMSE
for TMY were
2.4% and 4.7%, respectively, and for TPCY 1.5% and
2.5%. Both were near the lower ends of the variations indicating
that simulated results from TMY and TPCY tended to follow the
long-term mean more closely than the individual years. Similar
characteristics can be observed from the other four cities. It is
interesting to see that Harbin appeared to have larger MBE and
RMSE than the other cities, indicating larger variations (in terms of
climatic in
fluence on building energy use) from one year to another
in the severe cold climates. There also seemed to be a tendency for
J
F
M
A
M
J
J
A
S
O
N
D
200
400
600
800
1000
1200
1400
Bui
dl
in
g energy u
se (MWh)
Month
Harbin
J
F
M
A
M
J
J
A
S
O
N
D
300
400
500
600
700
800
Buidlin
g
ener
gy
use (MWh)
Month
Beijing
J
F
M
A
M
J
J
A
S
O
N
D
300
400
500
600
700
800
Buidl
in
g energy
use (MWh)
Month
Shanghai
J
F
M
A
M
J
J
A
S
O
N
D
300
400
500
600
700
Buidlin
g energy
use (MWh)
Month
Kunming
J
F
M
A
M
J
J
A
S
O
N
D
300
400
500
600
700
800
B
uidling energy use (
M
Wh)
Month
Hong Kong
Fig. 3. Comparison of total building energy use between TMY, TPCY and 30-year long-term mean for the
five cities.
L. Yang et al. / Energy 36 (2011) 6121
e6129
6126
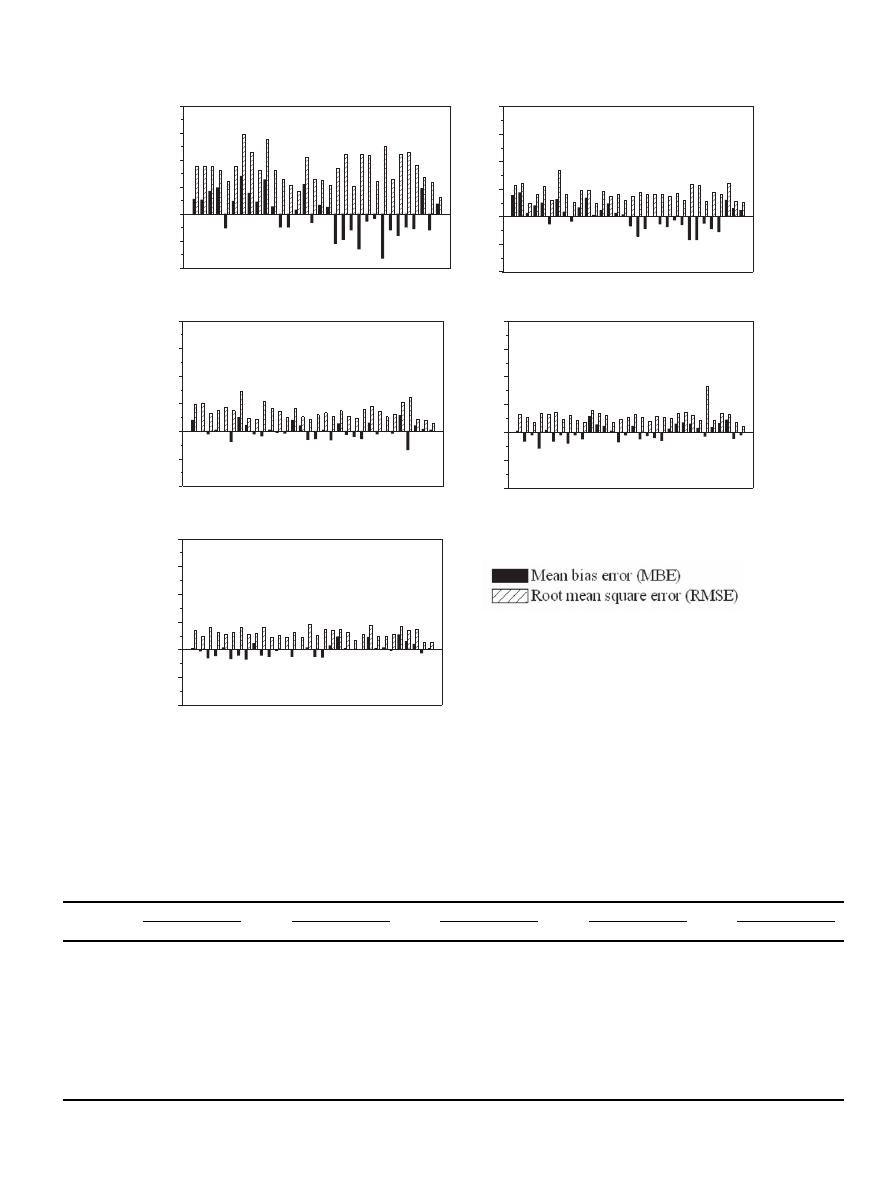
the MBE and RMSE to decrease (i.e. less inter-year variations) as we
moved from colder climates in the north to warmer climates in the
south. The most important
finding was that TPCY had the smallest
MBE (Harbin 1.5%, Beijing 0.9%, Shanghai 0.2%, Kunming
0.4% and
Hong Kong 0.2%) and RMSE (Harbin 2.5%, Beijing 2.1%, Shanghai
1.2%, Kunming 0.9% and Hong Kong 1.1%). In terms of the ability to
follow the long-term monthly and annual building energy use
estimation, TPCY outperformed TMY in all
five cities. This has
-8
-4
0
4
8
12
16
TP
CY
E
rro
rs
(in
%
)
Year
71
75
80
85
90
95
00
TM
Y
Harbin
-8
-4
0
4
8
12
16
TP
C
Y
E
rro
rs
(in
%
)
Year
71
75
80
85
90
95
00
TMY
Beijing
-8
-4
0
4
8
12
16
TPC
Y
E
rro
rs
(in
%
)
Year
71
75
80
85
90
95
00
TM
Y
Shanghai
-8
-4
0
4
8
12
16
TP
C
Y
E
rro
rs
(in
%
)
Year
71
75
80
85
90
95
00
TM
Y
Kunming
-8
-4
0
4
8
12
16
TP
C
Y
Er
ro
rs
(i
n
%
)
Year
79
85
90
95
00
05
08
TM
Y
Hong Kong
Fig. 4. Summary of the mean bias error (MBE) and root mean square error (RMSE) for the
five cities.
Table 6
A summary of the 12 typical principal component months (TPCMs) for the
five cities in the 21st century (2001e2100) for low and medium forcing.
Harbin
Beijing
Shanghai
Kunming
Hong Kong
B1
A1B
B1
A1B
B1
A1B
B1
A1B
B1
A1B
Jan
2066
2023
2100
2013
2078
2040
2097
2065
2045
2061
Feb
2054
2043
2046
2047
2015
2078
2006
2055
2010
2022
Mar
2088
2058
2021
2042
2092
2064
2050
2080
2033
2058
Apr
2082
2035
2062
2050
2049
2043
2031
2027
2045
2017
May
2044
2050
2033
2061
2025
2042
2022
2027
2044
2039
Jun
2043
2021
2012
2037
2012
2042
2032
2047
2036
2034
Jul
2060
2054
2088
2051
2010
2078
2023
2040
2061
2055
Aug
2035
2043
2052
2057
2037
2076
2058
2044
2034
2045
Sep
2072
2055
2049
2057
2032
2036
2075
2045
2079
2082
Oct
2033
2056
2046
2032
2080
2077
2003
2082
2040
2086
Nov
2014
2048
2062
2058
2026
2017
2021
2050
2052
2061
Dec
2078
2092
2089
2059
2063
2038
2062
2030
2050
2057
Note: B1
¼ low forcing, A1B ¼ medium forcing.
L. Yang et al. / Energy 36 (2011) 6121
e6129
6127

demonstrated the difference between the present work and the
conventional TMY method.
7. Identifying TPCMs for the 21st century
To illustrate the application of the principal component
approach, an attempt was made to identify the 12 TPCMs for each of
the
five cities in the 21st century using predictions from general
circulation models (GCMs). Future weather conditions were
obtained from the World Climate Research Programme
’s (WCRP)
Coupled Model Intercomparison Project Phase 3 (CMIP3) multi-
model data set
. Details of data gathering and model selection
can be found in
. Brie
fly, there were five GCMs that had
archived monthly mean DBT, moisture content, and GSR. Predictions
from these
five GCMs were downloaded and analysed. These GCMs
included the BCCR-BCM2.0 (Norway), GISS-AOM (USA), INM-CM3.0
(Russia), MIROC3.2-H (Japan) and NCAR-CCSM3.0 (USA). They
covered predictions for the past 10 decades (1900
e1999) based on
known emissions and future years (2000
e2099 for NCAR-CCSM3.0
and BCCR-BCM2.0; and 2001
e2100 for GISS-AOM, INM-CM3.0 and
MIROC3.2-H) based on different emissions scenarios
. It was
found that MIROC3.2-H tended to perform well in temperature and
humidity but only average in solar radiation among the
five models
. In this study, MIROC3.2-H was selected for two reasons. Firstly,
temperature and humidity greatly affect the air-conditioning load,
particularly latent cooling in subtropical climates. Secondly, our
recent work on human bioclimate had found that MIROC3.2-H
tended to show the best agreement between measured data and
model predictions
Predictions from the MIROC3.2-H GCM were used in the PCA for
the 21st century (2001
e2100) for two scenarios
e SRES B1
(low forcing, rapid change towards a service and information
economy, peak global population in mid-21st century and decline
thereafter, introduction of clean and resource-ef
ficient technologies
(e.g. daylighting applications
), and emphasis on global solutions
to economic social and environmental sustainability), and SRES A1B
(medium forcing, very rapid economic growth, same population
trends as B1, convergence among regions with increased cultural
and social interactions, and technological emphasis on a balanced
mix of fossil and non-fossil energy resources (e.g. photovoltaic
)). Wet-bulb temperatures were determined from the corre-
sponding DBT and moisture content.
shows a summary of
the TPCMs in the 21st century in the
five cities for the low and
medium forcing scenarios. It is interesting to observe that different
cities tend to have different years for the TPCMs. There are only two
exceptions among the 120 TPCMs
e Harbin and Hong Kong have the
same TPCMs, the year 2044 in May for low forcing and the year 2058
in March for medium forcing. This suggests that what is considered
typical (in terms of resembling the 100-year long-term average)
within one climate zone may not be typical in another. For low
forcing, most of the TPCMs occur only once or twice except 2033 and
2062 which appear three times. To have an idea about the distri-
bution of TPCMs among the 100 years, the frequency of occurrence
of TPCMs within each decade during the 21st century was deter-
mined. A summary is shown in
. Both the low and medium
forcing show
“normal” distributions with peaks centred around
2031
e2060. Medium forcing has larger peaks and tends to shift
towards the right (i.e. 2nd half of the 21st century).
8. Conclusions
Principal component analysis of 30-year long-term meteoro-
logical variables (dry-bulb temperature, wet-bulb temperature and
global solar radiation) was conducted. A typical weather year called
the typical principal component year (TPCY) was determined for
each of the
five major architectural climates e severe cold, cold, hot
summer and cold winter, mild, and hot summer and warm winter.
These were compared with the 30 individual years as well as the
widely used typical meteorological years (TMYs). In terms of the
monthly principal component Z and the monthly total building
energy consumption, both the TMY and TPCY followed the 30-year
long-term means quite closely. TPCY had the smallest mean bias
error (MBE) and root mean square error (RMSE) indicating its
ability to represent the long-term building energy use estimation.
The MBE was 1.5%, 0.9%, 0.2%,
0.4% and 0.2% in Harbin, Beijing,
Shanghai, Kunming and Hong Kong, respectively. This suggests that
predictions from the TPCY could be within 0.2%
e1.5% of the 30-year
long-term mean energy use estimation. To illustrate the application
of the principal component approach, an attempt was made to
identify the 12 TPCMs for each of the
five cities in the 21st century
using predictions from general circulation models (GCMs). We
believe the principal component analysis approach is a good
alternative to the conventional TMY and could have important
applications. The TPCY method would be useful in the regular (e.g.
every
five or 10 years) updating of existing typical weather years. It
can also be applied to studies on the impact of climate change on
energy use in the built environment in the 21st century involving
detailed hour-by-hour simulation. For instance, one can access the
archived monthly data for the three key meteorological variables
from general circulation models, analyse them and download the
required hourly weather data of the 12 typical months instead of
the total 1200 months in the 21st century. Although this study only
focused on the major climates within China, it is envisaged that the
approach and analysis could be applied to other locations with
similar or different climatic conditions.
Acknowledgements
The work described in this paper was fully supported by a Public
Policy Research Exercise grant from the Research Grants Council of
the Hong Kong Special Administrative Region, China [Project no.
9056002 (CityU 1011-PPR-10)]. K.K.W. Wan was supported by a City
University of Hong Kong Studentship. Measured weather data were
obtained from the China National Meteorological Centre in Beijing
and the Hong Kong Observatory of the Hong Kong SAR. We
acknowledge the modelling groups, the Program for Climate Model
Diagnosis and Intercomparison (PCMDI) and the WCRP
’s Working
Group on Coupled Modelling (WGCM) for their roles in making
20
01
-20
10
20
11
-20
20
20
21
-20
30
20
31
-20
40
20
41
-20
50
20
51
-20
60
20
61
-20
70
20
71
-20
80
20
81
-20
90
20
91
-21
00
0
5
10
15
20
25
30
35
Frequency of occurence (%)
Periods
B1 low forcing
A1B medium forcing
Fig. 5. Frequency of occurrence of typical principal component months within the ten
10-year periods in the 21st century.
L. Yang et al. / Energy 36 (2011) 6121
e6129
6128

available the WCRP CMIP3 multi-model data set. Support of this data
set is provided by the Of
fice of Science, U.S. Department of Energy.
References
[1] Solomon S, Qin D, Manning M, Chen Z, Marquis M, Averyt KB, et al., editors.
Climate change 2007: the physical science basis. Contribution of the working
group I to the fourth assessment report of the intergovernmental panel on
climate change. Cambridge: Cambridge University Press; 2007.
[2] Levine M, Urge-Vorsatz D, Blok K, Geng L, Harvey D, Lang S, et al. Residential
and commercial buildings. In: Metz B, Davidson OR, Bosch PR, Dave R,
Meyer LA, editors. Climate change 2007: Mitigation. contribution of working
group III to the fourth assessment report of the intergovernmental panel on
climate change. Cambridge: Cambridge University Press; 2007. p. 387
e446.
[3] Levermore GJ. A review of the IPCC assessment report four, part 1: the IPCC
process and greenhouse gas emission trends from buildings worldwide. Build
Serv Eng Res Technol 2008;29:349
e61.
[4] Lang S. Current situation and progress of energy ef
ficiency design standards in
buildings in China. Refrig Air Cond Electr Power Mach 2002;23:1
e6. in Chinese.
[5] Yao R, Li B, Steemers K. Energy policy and standard for built environment in
China. Renew Energy 2005;30:1973
e88.
[6] He J, Deng J, Su M. CO
2
emission from China
’s energy sector and strategy for its
control. Energy 2010;35:4494
e8.
[7] Ma L, Liu P, Fu F, Li Z, Ni W. Integrated energy strategy for the sustainable
development of China. Energy 2011;36:1143
e54.
[8] Zhang N, Lior N, Jin H. The energy situation and its sustainable development
strategy in China. Energy 2011;36:3639
e49.
[9] Lam JC, Wan KKW, Yang L. Sensitivity analysis and energy conservation
measures implications. Energy Convers Manage 2008;49:3170
e7.
[10] Wang Z, Ding Y, He J, Yu J. An updating analysis of the climate change in China
in recent 50 years. ACTA Meteorol Sinica 2004;62:228
e36. in Chinese.
[11] Wan KKW, Wong SL, Yang L, Lam JC. An analysis of the bioclimates in different
climates and implications for the built environment in China. Build Environ
2010;45:1312
e8.
[12] Wan KKW, Li DHW, Yang L, Lam JC. Climate classi
fications and building
energy use implications in China. Energy Build 2010;42:1463
e71.
[13] Lam JC, Li DHW. Daylighting and energy analysis for air-conditioned of
fice
buildings. Energy 1998;23:79
e89.
[14] Li DHW, Lam JC, Wong SL. Daylighting and its implications to overall thermal
transfer value determination. Energy 2002;27:991
e1008.
[15] Lam JC, Wan KKW, Liu D, Tsang CL. Multiple regression models for energy use
in air-conditioned of
fice buildings in different climates. Energy Convers
Manage 2010;51:2692
e7.
[16] Lam JC, Tang HL, Li DHW. Seasonal variations in residential and commercial
sector electricity consumption in Hong Kong. Energy 2008;33:513
e23.
[17] Lam JC, Wan KKW, Lam TNT, Wong SL. An analysis of future building energy
use in subtropical Hong Kong. Energy 2010;35:1482
e90.
[18] Wan KKW, Li DHW, Lam JC. Assessment of climate change impact on building
energy use and mitigation measures in subtropical climates. Energy 2011;36:
1404
e14.
[19] Zhao S. Physical geography of China. New York: Van Nostrand Reinhold; 1986.
[20] Zhang J, Lin Z. Climate of China. New York: John Wiley & Sons; 1992.
[21] Ministry of Construction of P.R.C. Thermal design code for civil building (GB
50176-93). Beijing: China Planning Press; 1993. in Chinese.
[22] Lam JC, Hui SCM, Chan ALS. A statistical approach to the development of
a typical meteorological year for Hong Kong. Architect Sci Rev 1996;39:
201
e9.
[23] Ecevit A, Akinoglu BG, Aksoy B. Generation of a typical meteorological year
using sunshine duration data. Energy 2002;27:947
e54.
[24] Yang L, Lam JC, Liu J. An analysis of the typical meteorological years in
different climates in China. Energy Convers Manage 2007;48:654
e68.
[25] Hall IJ, Prairie RR, Anderson HE, Boes EC. Generation of typical meteorological
years for 26 SOLMET stations. SAND 78
e1601. Albuquerque, New Mexico:
Sandia National Laboratories; 1978.
[26] Marion W, Urban K. User manual for TMY2. Colorado: National Renewable
Energy Laboratory; 1995.
[27] Finkelstein JM, Schafer RE. Improved goodness-of-
fit tests. Biometrika 1971;
58:641
e5.
[28] Crow LW. Development of hourly data for weather year for energy calcula-
tions (WYEC), including solar data, at 21 stations throughout the U.S. ASHRAE
Trans 1981;87:896
e906.
[29] Wilks DS. Statistical method in the atmospheric sciences: an introduction. San
Diego: Academic Press; 1995.
[30] Storch HV, Zwiers FW. Statistical analysis in climate research. Cambridge:
Cambridge University Press; 1999.
[31] Lam JC. Energy analysis of commercial buildings in subtropical climates. Build
Environ 2000;35:19
e26.
[32] Bojic M, Yik F, Leung W. Thermal insulation of cooled spaces in high rise
residential buildings in Hong Kong. Energy Convers Manage 2002;43:
165
e83.
[33] Wan KKW, Cheung KL, Yang L, Lam JC. A new variable for climate change
study and implications for the built environment. Renew Energy 2009;34:
916
e9.
[34] Kalkstein LS, Tan G, Skindlov JA. An evaluation of three clustering procedures
for use in synoptic climatological classi
fication. J Clim Appl Meteorol 1987;26:
717
e30.
[35] Ladd JW, Driscoll DM. A comparison of objective and subjective means of
weather typing: an example from West Texas. J Appl Meteorol 1980;19:
691
e704.
[36] DOE-2 Supplement, Version 2.1E, LBL-34947. Lawrence Berkeley National
Laboratory, University of California; 1993.
[37] Code for Design of Heating Ventilation and Air-conditioning (GB 50019-2003).
Beijing: China Planning Press; 2003. in Chinese.
[38] Design Standard for Energy Ef
ficiency of Public Buildings (GB 50189-2005).
Beijing: China Architecture and Building Press; 2005. in Chinese.
[39] Amendments to the Code of Practice for Overall Thermal Transfer Value in
Buildings. Hong Kong: Buildings Department; 2000.
[40] Performance-based Building Energy Code. Hong Kong: Electrical and
mechanical Services Department; 2007.
[41] Meehl GA, Covey C, Delworth T, Latif M, McAvaney B, Mitchell JFB, et al. The
WCRP CMIP3 multi-model dataset: a new era in climate change research. Bull
Am Meteorol Soc 2007;88:1383
e94.
[42] IPCC Working Group III. In: Nakicenovic N, Swart S, editors. Special report on
emissions scenarios. Cambridge: Cambridge University Press; 2000.
[43] Chel A, Tiwari GN, Singh HN. A modi
fied model for estimation of daylight
factor for skylight integrated with dome roof structure of mud-house in New
Delhi (India). Appl Energy 2010;87:3030
e50.
[44] Chel A, Tiwari GN. A case study of a typical 2.32 kWp stand-alone photovoltaic
(SAPV) in composite climate of New Delhi (India). Appl Energy 2011;88:
1415
e26.
L. Yang et al. / Energy 36 (2011) 6121
e6129
6129
Document Outline
- A new method to develop typical weather years in different climates for building energy use studies
- 1 Introduction
- 2 Methodology
- 3 Major climate zones and cities
- 4 Development of typical meteorological years (TMYs)
- 5 Development of typical principal component years (TPCYs)
- 6 Comparisons of building energy use estimations from different weather years
- 7 Identifying TPCMs for the 21st century
- 8 Conclusions
- Acknowledgements
- References
Wyszukiwarka
Podobne podstrony:
Wpływ warunków klimatycznych na przyrosty roczne
rosiek, wentylacja i pożary, Wpływ trudnych warunków klimatycznych na organizm ludzki
Badanie wpływu rozruchu bezoporowego i hamowania rekuperacyjnego na zużycie energii
Wpływ warunków wysokogórskich na układ oddechowy Agi
Wpływ warunków ogrzewania na jakość tłuszczów smażalniczych 15
Wpływ zmian klimatycznych na życie człowieka, TECHNIK BHP
wpływ warunków wysokogórskich na układ oddechowy
Wpływ warunków atmosferycznych na kaktusy mrozoodporne
11 Wpływ warunków eksploatacji na stan techniczny pojazdu
prezentacja zużycie energii w budynku
Zużycie energii w budynkach
Wpływ warunków przechowywania na
wpływ warunków środowiskowych na zwierzęta
Badanie wpływu rozruchu bezoporowego i hamowania rekuperacyjnego na zużycie energii
Wpływ zmian klimatu, na infrastrukturę budowlaną – jej wrażliwość i możliwości adaptacji
więcej podobnych podstron