
Open Life Sci. 2015; 10: 19–29
1 Introduction
Genetic diversity of a species is defined as the sum of genetic
variability within a gene pool. Therefore, characterization
of natural species must include intra- and inter-
population genetic variability and the characteristics of
dynamic relations, such as gene flow, balancing selection
or mate limitation [1]. SSRs (simple sequence repeats or
microsatellites) have been widely used in plant genetic
research due to their high reproducibility, polymorphism,
co-dominant character and abundance in plant genomes
[2–5]. SSR markers have been isolated from European
pear [6–8] as well as from Asian pear species [9,10].
Additionally, a large number of SSRs isolated from apple
have revealed transferability to pear [11,12]. These markers
have been used for Pyrus genome mapping [7,12–15], as
well as for genetic resource characterization [16–21].
The pear (Pyrus spp.) genus is variously said to
consist of from 20 to over 70 wild or domesticated species
[22–25]. It is relatively difficult to give an accurate number
of pear species, because they easily cross-pollinate and
the obtained crosses have ambiguous taxonomic status.
The existence of a very large number of cultivars, species,
subspecies, hybrids and clones reinforces the need for
genetic characterization and verification. Wild pear (Pyrus
pyraster = P. commusis ssp. pyraster L.) is a woody plant
and closely related to the European pear (P. communis).
This species comes from the western Black Sea region and
the distribution of the species extends from the British
Isles to Latvia [26–29]. The wild pear is the only species of
pears that grows naturally in the region of Central Europe.
However, its taxonomic definitions appear inadequate
and conflicting because of the extensive morphological
heterogeneity of individual plants identified as P. pyraster
[27,28].
In Poland wild pear trees are widespread components
of human-made and natural habitats: mid-field shrub
communities, rural landscapes and forest ecosystems [30].
Wild pear shows high morphological heterogeneity, which
may have resulted from many centuries of growing in
proximity to pear orchards that prompted various stages of
Abstract: In order to provide molecular characteristics
of wild pear (P. pyraster) resources, six populations
(192 accessions) from different regions of Poland were
investigated with 17 SSR loci. Each of the SSR loci used
was polymorphic, with a mean of 19.5 alleles per locus
and a mean PIC of 0.806. Both the high heterozygosity (Ho
= 0.751) and low Fis (0.007) indicated that the wild pear
populations maintain a relatively high level of diversity,
while the mean F
index
of 0.039 and the number of migrants
per generation (Nm = 6.996) revealed a high gene flow and
weak inter-population differentiation. AMOVA analysis
located polymorphisms mainly within populations (96%).
Genetic relations between populations did not show
correlations with geographical distances. The dispersal
influence of gene flow could be the reason of the disrupted
relationship within populations and the low inter-
population differentiation. We did not find any evidence
to support the hypothesis about influence of interspecies
hybridization with pear cultivars on the level of wild pear
population diversity.
Keywords: microsatellite, SSR, Pyrus pyraster, wild pear,
genetic diversity, population structure
DOI 10.1515/biol-2015-0003
Received November 12, 2013; accepted May 11, 2014
Research Article
Open Access
© 2015 Łukasz Wolko, et al., licensee De Gruyter Open.
This work is licensed under the Creative Commons Attribution-NonCommercial-NoDerivs 3.0 License.
Łukasz Wolko*, Jan Bocianowski, Wojciech Antkowiak, Ryszard Słomski
Genetic diversity and population structure of wild
pear (Pyrus pyraster (L.) Burgsd.) in Poland
*Corresponding author: Łukasz Wolko: Department of Biochemistry
and Biotechnology, Poznan University of Life Sciences, 60-637
Poznan, Poland, E-mail: wolko@o2.pl
Ryszard Słomski: Department of Biochemistry and Biotechnology,
Poznan University of Life Sciences, 60-637 Poznan, Poland
Jan Bocianowski: Department of Mathematical and Statistical
Methods, Poznan University of Life Sciences, 60-637 Poznan, Poland
Wojciech Antkowiak: Department of Botany, Poznan University of
Life Sciences, 60-625 Poznan, Poland
Ryszard Słomski: Institute of Human Genetics, Polish Academy of
Sciences, 60-493 Poznań, Poland
Unauthenticated
Download Date | 6/2/17 11:42 AM

20
Ł. Wolko et al.
hybridization between native P. pyraster and P. communis
[31–34]. These hypothetical hybrids presenting various
traits typical of P. pyraster in combination with traits typical
of P. communis are classified as Pyrus ×amphigenea Domin
ex Dostálek [31]. Alternatively, the high morphological
heterogeneity of wild pear may be the effect of balancing
selection caused by a self-incompatibility mechanism.
Studies of polymorphism within the S-locus (genes that
limit compatibility of mating partners) have revealed high
variability even in small P. pyraster populations [35–38].
Developing genetic characterization of natural wild
pear populations should make a contribution to the
debate on potential effects on wild pear introgressive
hybridization and provide information concerning the
ecological condition of P. pyraster. Genetic characterization
of natural wild pear resources could be helpful in an
effective conservation effort of the species, which could
be applicable to exchange traits with cultivated varieties
in breeding programs. Therefore the aims of this study
were to assess the microsatellite loci polymorphism in the
P. pyraster species and to estimate the genetic variation on
the inter- and intra-population levels.
2 Experimental Procedures
2.1 Plant material sampling and DNA
extraction
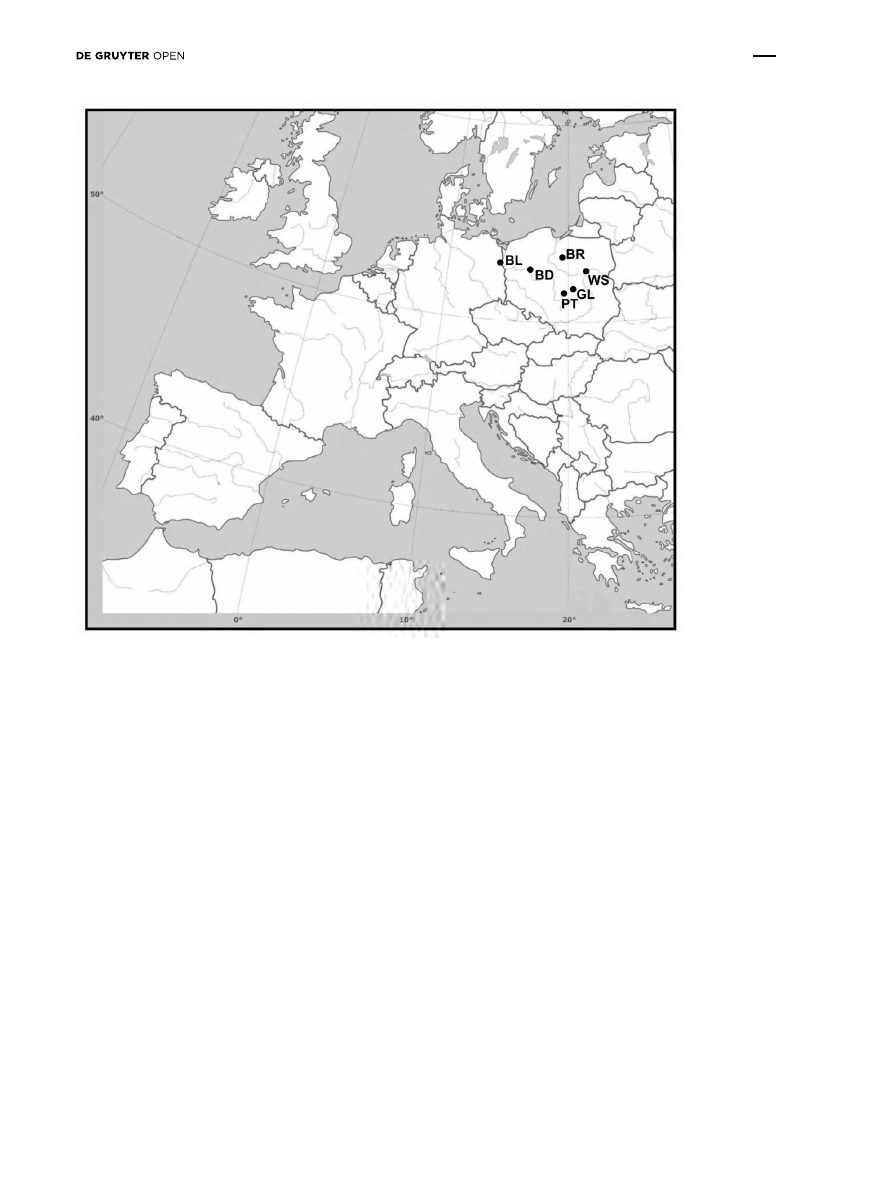
Wild pear (P. pyraster) from six populations in northern
and central Poland were used in this study: the Bielinek
Reserve (BL), Biedrusko (BD), Brodnica (BR), Głuchów
(GL), Piotrków Trybunalski (PT) and Wyszków (WS)
(Table 1 and Figure 1). We limited number of samples
depending on population size. For small populations
samples were collected from all trees and from larger
populations around 30 samples were collected at random
from different locations of the populations. Overall, 192
trees were tested. The populations were not situated in
the immediate vicinity of horticultural centres; however
we could not exclude possibility of gen flow from pears
growing in rural gardens.
The young leaves collected were immediately placed
in plastic bags containing moist filter paper. Genomic
DNA was extracted from 2 g of fresh leaf material following
a modified cetyltrimethylammonium bromide (CTAB)
protocol [39].
2.2 PCR amplification and electrophoresis
A total of 17 SSR primer pairs were obtained from
Fernandez-Fernandez et al. [8] and Yamamoto et al. [6,10]
(Table 2). Microsatellite amplification was conducted
using 2 x PCR Master Mix (Fermentas Life Sciences,
Canada) [Components: Taq DNA polymerase 0.5 units/µl,
MgCl
2
4 mM and dNTP 0.4 mM]. 50 ng of genomic DNA
was mixed with 10 ng of each primer (the forward primer
labeled with a fluorescent chemical FAM, TET or HEX),
1 x PCR Master Mix and distilled water to make up the
final volume of 20 µl. Amplification was performed with
35 cycles at 94°C for 1 min, 42–55°C for 1 min and 72°C
for 2 minutes, for denaturation, annealing and primer
extension, respectively. The PCR products were separated
and detected using a MegaBACE 1000 (GE Healthcare
Table 1: Characteristics of six wild pear populations.
Abbr – Abbreviation; Cs – approximate census size; Ss – sample size; Gp – geographical parameters.
Abbr
Cs/Ss
Gp
Population characteristics
BL
150/36
14°08’ E
52°56’ N
Large natural population of moderate density; it originated from natural colonization by wild pear
trees of xerothermic grasslands, the driest and sunniest slopes of the Bielinek reserve.
BD
1500/30
16°55’ E
52°33’ N
The largest population of P. pyraster in Poland located in the Biedrusko army training ground, esta-
blished in the early 20th century and it has been in use by the Polish military since then. The wild
pear population has probably grown there since the end of agricultural usage; the large population
consists of dispersed trees and small groups of trees growing close together.
BR
29/29
19°23’ E
53°19’ N
Medium-sized population; trees growing near dirt roads within several meters of each other.
GL
50/30
20°04’ E
51°46’ N
Medium-sized population; trees scattered along agricultural fields, growing several hundred meters
from each other.
PT
50/32
19°39’ E
51°27’ N
Medium-sized population; trees scattered along agricultural fields, growing several hundred meters
from each other.
WS
50/35
21°27’ E
52°35’ N
Medium-sized population; trees scattered along agricultural fields, growing a at a distance of 100
- 200 m from each other.
Unauthenticated
Download Date | 6/2/17 11:42 AM
Genetic diversity and population structure of wild pear (Pyrus pyraster (L.) Burgsd.) in Poland
21
Life Sciences, USA) sequencer. The size of the amplified
bands was determined based on internal standard DNA
(MegaBACE ET550-R Size Standard) with the MegaBACE
Fragment Profiler Version 1.2 (GE Healthcare).
2.3 Data analysis
We estimated the genetic information for 17 SSR loci in
six P. pyraster populations: the number of individual
alleles (N), frequency of the most prevalent allele (p),
number of private alleles unique to a single population
(Np), inbreeding coefficient for an individual relative to
the subpopulation (Fis), fixation index (F
index
) and the
number of migrants per generation (Nm). [40,41]. The
fixation index is a measure of population differentiation
due to genetic structure. It is frequently estimated from
genetic polymorphism data. Developed as a special case
of Wright’s F-statistics, it is one of the most commonly
used statistics in population genetics. This comparison
of genetic variability within and between populations is
frequently used in applied population genetics. The values
range from 0 to 1. A zero value implies complete panmixis;
that is, that the two populations are interbreeding
freely. A value of one implies that all genetic variation is
explained by the population structure, and that the two
populations do not share any genetic diversity. Variability
for each locus was measured using the polymorphism
information content (PIC) [42]
,
1
2
∑
−
=
n
i
i
p
PIC
where pi is the frequency of the ith allele (Table 3).
The following analyses were performed using the
GenAlEx version 6.41: the number of different alleles across
20 SSR loci in populations (Na), the number of private
alleles unique to a single population (Np), the percentage
of private alleles (Np%), Shannon’s information index (I),
observed heterozygosity (Ho), expected heterozygosity
(He), and inbreeding coefficient (Fis) [43]. Shannon’s
information index is an index of biodiversity. Tests for
Figure 1: Distribution of the six studied populations across Poland (for population abbreviation see 2.1).
Unauthenticated
Download Date | 6/2/17 11:42 AM

22
Ł. Wolko et al.
deviations from the Hardy-Weinberg equilibrium (HWE)
according to Falconer and Mackay [44] and possible
deviations of genotype frequencies from their expected
values were analyzed using the chi-square test (c
2
).
The analysis of molecular variance (AMOVA) was
used to compute the distribution of genetic variability
among and within populations. The GenAlEx version 6.41
allows for the calculation of AMOVA. Significance levels
for estimated variance components were computed using
1000 permutations [45]. The data for microsatellite allele
frequency were applied to calculate the unbiased genetic
distance and genetic identity estimates by employing
Nei’s genetic distance [46]. Pairwise, genetic distances
between individuals as well as between populations were
Table 2: Characteristics of 17 microsatellite primer pairs including SSR repeat motif. 1-9 Fernandez-Fernandez et al. 2006 [8]; 11- Yamamoto
et al. 2002 ; 12-17 Yamamoto et al. 2002 [10].
No.
Marker
Repeat motif
Primer sequences (5′−3′)
Size range (bp) Most prevalent allele (bp)
1.
EMPc10
AC
F: TTAAGCAAGTGGGCAAGTAGG
R: TTCCGTATCGCTTGTGTCTAC
150-196
160
2.
EMPc102
CT
F: CGATGATCCATCATTAAGTCCC
R: TCAAGTTCTGCTTCATTTCCAG
142-193
178
3.
EMPc105
AG
F: TCAAGATGGACCAAAAAGGTTC
R: AGAGGTGCAAAGATATTCCAGG
122-198
180
4.
EMPc106
AG
F: CGATTCAAATCAGCCTATTCTGT
R: CACTTATCGACATCTGTCAGCC
104-224
204
5.
EMPc110
CT
F: ACTAACATTAAAAAATCTTTAC
R: ATCTTAAAACTTAAACTAAATAA
96-150
160
6.
EMPc111
AG
F: CAAACCTTCCAACCTCAACAAT
R: CCGATCAGAAAGAGCTGTGAGT
82-122
100
7.
EMPc114
AG
F: ACCCACAATTCCCCATAT
R: AGCCTTATGCGCCTTCTA
132-186
139
8.
EMPc115
GT
F: AGAAGCGAGGAAGCAGTGTAT
R: CATGTAGACCAGTTTCATTTGC
161-196
183
9.
EMPc117
CT
F: GTTCTATCTACCAAGCCACGCT
R: CGTTTGTGTGTTTTACGTGTTG
92-138
103
10.
KA14
(CA)G(AC)G(CA) F: TCATTGTAGCATTTTTATTTTT
R: ATGGCAAGGGAGATTATTAG
171-199
187
11.
BGT23b
TC
F: CACATTCAAAGATTAAGAT
R: ACTCAGCCTTTTTTTCCCAC
164-239
210
12.
NB109a
AG
F: ATGCTCTATAAAACCCACCTACC
R: AGAGGGACCATTGTGTTATTGTAT
135-194
160
13.
NB113a
AG
F: ATGAAATATGTCGTGTTGCCCTTAG
R: CCCTTCCTCAGCATGTTTCCTAGAC
135-167
155
14.
NH025a
AG
F: CTGGACACAAACATTCAAGAGGG
R: CACACCAGAAACTCCAAAACAGG
50-106
70
15.
NH026a
AG
F: CGTAATACTCGTAGTGCATGATG
R:GCTTCTGGACTATCACTATTTCTTC
123-158
139
16.
NH027a
AG
F: TAATGTGTTGGGGAGAGAGAG
R: GCTCTTGTTCCTTGCTCCTAA
112-172
131
17.
NB141b
AG
F: TTCCTCCACTTGAGGGACAC
R: GTTGAAGGCATCGGATTGAT
82-121
93
Unauthenticated
Download Date | 6/2/17 11:42 AM

Genetic diversity and population structure of wild pear (Pyrus pyraster (L.) Burgsd.) in Poland
23
estimated using the proportion of shared allele approach
[47]. On the basis of calculated coefficients, individuals
as well as populations were grouped hierarchically, using
the unweighted pair group method of arithmetic means
(UPGMA). The relationships between individuals as well
as among populations were presented in the form of
dendrograms (Figures 2 and 3). Genetic differentiation
between pairs of populations across all loci was analyzed
based on estimates of t
st
values and N
m
.
The longitude and latitude coordinates were used
to construct the geographical distance matrix between
the studied populations. A Mantel test was computed
between genetic and geographical distances. In addition,
we used the Bayesian clustering method to elucidate the
genetic structure among populations of wild pear, and
to infer the most appropriate number of subpopulations
(K). Simulations were run 10 times with 200000 Markov
chain Monte Carlo sampling runs after a burn-in period
of 1000000 iterations, using the admixture model under
the assumption of correlated allele frequencies. The most
appropriate cluster number (K) was selected using the
criterion of [48].
3 Results
3.1 Characteristic of SSR markers and
genetic diversity
The transferability of SSR markers from P. communis
to P. pyraster has previously been tested [18]. Based on
these results, we selected the 17 SSR markers for the wild
pear natural population diversity analysis due to high
polymorphism (Table 2). Each of the 17 loci analysed
was polymorphic and a total of 332 putative alleles were
obtained, which gave a mean value of 19.5 alleles per locus.
Of the 17 microsatellite loci, only one (EMPc105) deviated
from the Hardy-Weinberg equilibrium (P = 0.023), due to
heterozygote deficiency.
The highest number of the alleles per locus were
obtained for EMPc106 (N = 35) and the lowest were for
NB113a (N = 11) (Table 3). The discrimination power of SSR
markers was described by: the polymorphism information
content (PIC), Shannon’s information index (I) and the
frequency of the most prevalent allele (p) (Table 3).
The highest discrimination power (PIC > 0.9, I > 2.3 and
Table 3: Genetic information for 17 SSR loci in six P. pyraster populations: N – number of alleles; Np – number of private alleles unique to a
single population; p – frequency of the most prevalent allele; I – Shannon’s information index; Fis – inbreeding coefficient for an individual
relative to the subpopulation; F
index
– Fixation index, Nm - number of migrants per generation; PIC – polymorphism information content.
Locus
N
Np
p
I
Fis
F
index
Nm
PIC
EMPc10
12
3
0.456
1.407
-0.108
0.038
6.341
0.695
EMPc102
21
5
0.391
2.000
0.022
0.040
6.018
0.811
EMPc105
24
7
0.177
2.386
0.266
0.046
5.194
0.916
EMPc106
35
10
0.297
2.303
0.001
0.042
5.721
0.876
EMPc110
18
3
0.719
1.114
0.059
0.031
7.715
0.474
EMPc111
15
2
0.357
1.738
-0.163
0.078
2.961
0.791
EMPc114
21
1
0.234
2.256
0.148
0.038
6.404
0.887
EMPc115
14
1
0.604
1.624
-0.014
0.017
14.055
0.730
EMPc117
21
3
0.151
2.362
0.075
0.039
6.178
0.911
KA14
12
2
0.495
1.458
-0.151
0.026
9.272
0.700
BGT23b
23
9
0.341
2.026
0.111
0.036
6.675
0.830
NB109a
28
5
0.229
2.427
-0.021
0.030
8.026
0.902
NB113a
11
4
0.492
1.452
-0.190
0.029
8.322
0.698
NH025a
21
3
0.169
2.368
0.027
0.048
4.926
0.918
NH026
15
0
0.279
2.224
-0.006
0.033
7.277
0.882
NH027a
25
4
0.179
2.329
0.216
0.036
6.661
0.907
NB141b
16
5
0.383
1.750
0.038
0.051
4.612
0.788
Mean
19.5
3.9
0.350
1.954
0.018
0.039
6.845
0.806
Unauthenticated
Download Date | 6/2/17 11:42 AM
24
Ł. Wolko et al.
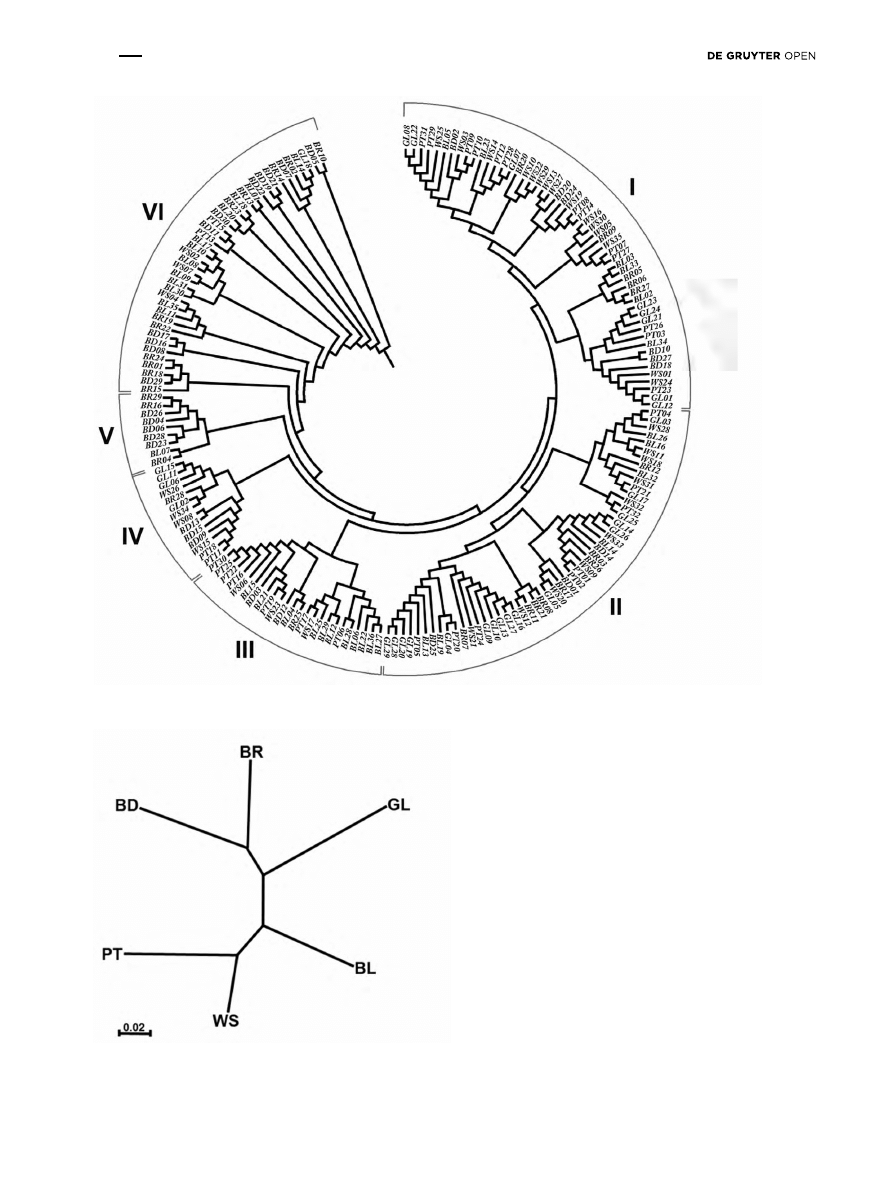
Figure 2: Dendrogram of relationships among 192 wild pear trees based on UPGMA method according the data of SSR analysis
Figure 3: Dendrogram of genetic differentiation between six wild pear populations. The dendrogram based on Nei’s unbiased genetic dis-
tance using the UPGMA method, according to data from all SSR loci.
Unauthenticated
Download Date | 6/2/17 11:42 AM

Genetic diversity and population structure of wild pear (Pyrus pyraster (L.) Burgsd.) in Poland
25
p < 0.2) was estimated in the case of four loci: EMPc 105,
EMPc117, NH025a and NH027a. The lowest discrimination
power parameters were obtained for EMPc110 (PIC = 0.47,
I = 1.1, p = 0.72). The Fis mean value calculated for all SSR
loci was 0.018. Fis was highest for EMPc105 (Fis = 0.266)
and the lowest for NB113a (Fis = -0.19) (Table 3).
Private alleles unique to a single wild pear population
(Np) measure the genetic distinctiveness of the marker
for the tested populations and are useful for estimating
migration rates. The genetic diversity of the markers
does not demonstrate any correlation with the Np value.
The highest number of such alleles (10) was found for
the EMPc106, while no unique allele was detected for the
NH026 (Table 3).
3.2 Population variation
A mean of 11.75 alleles per population per locus were
detected. The BR with the highest number of alleles across
loci (mean Na = 12.52) and the BD with the highest number
of private alleles (Np = 17) seem to offer the most diversified
populations. The lowest number of alleles was observed
for the BL population (Na = 10.76) and the lowest number
of private alleles was recorded in BR (Np = 8) (Table 4).
The low mean value of fixation index (F
index
= 0.039)
indicated negligible population genetic differentiation
and low genetic divergence within the populations.
The number of migrants per generation (Nm) for loci
ranged between 2.961 and 14.274 with an average value of
6.845 (Table 3).
The high level of intra-population genetic diversity
was supported by the results for the Shannon information
index (mean value I = 1.954), as well as high observed and
expected heterozygosity (mean Ho = 0.751 and He = 0.762)
(Table 4). The population-wise inbreeding coefficient
(Fis) values were around zero (from -0.035 to 0.041) with
an average value of 0.018. This result suggested random
mating, no population subdivisions and a state close to
the Hardy-Weinberg equilibrium (Table 4).
Significant differentiation (F = 3.451; P < 0.001)
among the six populations was further supported by the
results from analysis of molecular variance (AMOVA)
using microsatellites, where both the intra- and the inter-
population variability were found to be highly significant,
with 4.0% of the genetic variance attributed to the
differentiation among the six populations, whereas 96.0%
was the result of intra- population variability (Table 5).
The analysis of genetic differentiation between pairs
of populations confirms that differentiation was modest
(Table 6). The value of population differentiation (t
st
) was
the highest between PT and BD (0.033) and the lowest
between the BD and BR (0.016). The gene flow (N
m
) was the
highest between PT and WS (15.491) and lowest between
PT and BD (7.425) (Table 6).
Table 5: Summary of analysis of molecular variance (AMOVA) of microsatellite loci for comparison among and within all six populations. df
– degree of freedom (ratio statistic Rst = 0.037, P ≤ 0.01). Probability of obtaining a large component estimate; number of permutations =
1000.
Source of variation
Df
Sum of squares
Mean squares
Estimated variance
Percentage of variation
Among Pops
5
43456.618
8691.324
96.577
4
Within Pops
378
952118.048
2518.831
2518.831
96
Total
383
995574.667
2615.408
100
Table 4: Genetic diversity of wild pear populations. N – total number of alleles; Na – average number of different alleles per locus; Np –
number of private alleles unique to single population; Ne – number of effective alleles; I – Shannon’s information index; Ho – observed
heterozygosity; He – expected heterozygosity; Fis – inbreeding coefficient.
Population
N
Na
Np
Ne
I
Ho
He
Fis
BL
183
10.76
9
5.247
1.780
0.724
0.731
0.008
BD
207
12.17
17
6.245
1.984
0.763
0.781
0.013
BR
213
12.52
8
6.634
1.997
0.745
0.781
0.035
GL
196
11.53
11
5.194
1.891
0.735
0.771
0.041
PT
204
12.00
15
5.235
1.860
0.764
0.750
-0.029
WS
195
11.47
11
5.377
1.865
0.774
0.757
-0.035
Mean
199.7
11.75
11.8
5.655
1.954
0.751
0.762
0.018
Unauthenticated
Download Date | 6/2/17 11:42 AM

26
Ł. Wolko et al.
3.3 Genetic distances among individuals
and populations
UPGMA cluster analyses were conducted for single trees as
well as the six populations. The phylogenetic tree of single
individuals (Figure 2) shows a weak correlation between
the source population and genetic relationships inferred
from polymorphism of SSR loci. The pear trees could
be classified into six main groups, but all of the groups
consist of individuals from at least two populations. The
phylogenetic analysis of relationships between individual
trees may confirm the potential gene flow.
Nei’s unbiased genetic distance and identity were
estimated for each pair of populations (supplementary
materials). The distances ranged between 0.11 (PT – WS)
and 0.249 (PT – BD), while identity varied between 0.779
(BD – GL and PT – BD) and 0.896 (PT – WS). To elucidate
the relationships between populations, a dendrogram
was constructed on the basis of genetic distances
(Figure 3). Estimation of correlation coefficients between
genetic and geographical distances did not show any
correlation of these parameters (r = 0.0241, P = 0.9320).
Bayesian clustering analysis indicated the same grouping
as UPGMA cluster analyses.
4 Discussion
4.1 Characteristics and diversity of SSR
markers
The SSR markers used in the study demonstrated a high
degree of polymorphism. In total, the 17 SSR markers
allowed identification of 332 alleles in the 192 examined
P. pyraster genotypes. The resultant mean of 19.5 alleles
per locus (Table 3) was higher than the 14.8 reported
previously for wild pear by Kimura et al. [9], 17.3 by Volk
et al. [16] and 13 by Yakovin et al. [19]. The differences may
be a result of the loci examined and the large number of
individuals for geographically remote populations.
The length of the fragments obtained for the SSR loci
was described previously for P. communis [8,17,19,37];
however, allele lengths obtained for P. communis and
P. pyraster were often different [8,17] (Table 2). The most
often observed alleles were mostly (10 markers) of the
same length as previously described for P. communis [18].
4.2 Population variation
A heterozygosity level was recorded in the examined
populations proving their high genetic variation (mean
Ho=0.75). Similar ranges of Ho and He values have been
described for P. communis [8,17–19]. The differences in values
of Ho and He did not exceed 0.04 per population and were
generally not different in a statistically significant manner
(Table 4). Similar values of He and Ho, as well as a very low
mean inbreeding coefficient (Fis = 0.018) indicated that
the examined populations were near the Hardy-Weinberg
equilibrium state (Tables 3 and 4). This could be the effect
of a gametophytic self-incompatibility mechanism, which
prevents inbreeding in pear species [35–38].
Populations BD and BR seemed to be genetically
diversified to the highest degree because of the highest
values of alleles per locus (Na), effective alleles (Ne)
and Shannon’s information index (I) (Table 5). However,
the BR population had the lowest number of private
alleles (Np = 8) and the highest inbreeding coefficient
(Fis = 0.035), which could be the result of the small
size of this population. The population of BL showed
the weakest separation and genetic differentiation.
It is interesting that only this population was reported in
the wildlife reserve and this protection excluded human
interference, so this should have accelerated the natural
process of plant succession [30]. Two of the six studied
populations, BL and BD, could be described as natural
populations, whereas the BR, GL, PT and WS populations
Table 6: Analysis of genetic differentiation between pairs of populations across all loci based on estimates of t
st
values (below diagonal) and
N
m
(above diagonal). t
st
and N
m
values were negatively significantly correlated (r = -0.9641, p < 0.00001).
Populations
BL
BD
BR
GL
PT
WS
BL
***
9.852
9.997
7.894
10.055
11.573
BD
0.025
***
14.938
10.098
7.425
9.169
BR
0.024
0.016
***
10.622
8.166
10.490
GL
0.031
0.024
0.023
***
9.090
10.172
PT
0.024
0.033
0.030
0.027
***
15.491
WS
0.021
0.027
0.023
0.024
0.016
***
Unauthenticated
Download Date | 6/2/17 11:42 AM

Genetic diversity and population structure of wild pear (Pyrus pyraster (L.) Burgsd.) in Poland
27
had anthropogenic sources. We conclude that our study
did not show significant differences in the level of
genetic variation between natural and human-created
populations.
Analysis of genetic distances and differentiation proved
that the highest genetic similarity was observed between two
pairs of populations: the PT – WS and BD – BR populations
(Tables 6). However, the genetic relations illustrated on
the dendrogram (Figure 3) did not show correlations with
geographical distances between populations (Figure 1).
The weak correlation between genetic and geographical
distances is difficult to explain. We could suspect an
accidental human impact during the process of plantation
of wild pear trees along mid-field and rural roads, but the
strength of this impact seems to be difficult to assess.
4.3 Population gene flow
Our study demonstrates that the high level of gene flow
appeared to be one of the most important elements
determining the genetic structure of wild pear populations.
Gene flow causes restriction of divergence between
populations, whereas genetic drift and directional selection
induce intra-population diversity [49,50]. In the case of
trees, gene flow is the result of pollen and seed spreading.
Long lifetime of trees may cause formation of multi-
generation populations when the gene flow and panmix
change the family structure and reduce inbreeding [49].
In the presented study the mean value of Fis was
below 0.05, which proved no population subdivision
and a lack of barriers in mutual pollination, while the
high level of gene flow and genetic homogeneity across
the examined populations were supported by F
index
and
Nm values (Table 3). The results of AMOVA localized
majority variation on the intra-population level (Table 5)
and the analysis of genetic differentiation between pairs
of populations also demonstrated a low inter-population
differentiation and high gene flow (Table 6).
The results allow us to conclude that the wild pear
species in Poland maintains a relatively high level of
genetic diversity. The high heterogeneity of the examined
populations may be the effect of pollination by insects or
seed spreading by animals [51–54], but the influence of
human activities could be suspected as well. The process
of genetic pool mixing via gene flow may have resulted
in relatively low relationships among the individuals
in multi-generation habitats, which is illustrated on the
dendrogram of individual accession (Figure 2). However,
further studies of the spatial population genetic structure
need to be conducted in order to characterize these
phenomena in detail.
Regular crossbreeding with cultivated pear varieties
could have led to inter-species hybridization and a decline
in natural characters of P. pytaster [31–34]. Meanwhile,
gametophytic type self-incompatibility, regulating
pollination in Pyrus should induce pressure on genetic
variability maintenance [16,18,34,37]. The strong influence
of gene flow from cultivations to the natural wild pear
populations should lead to genetic unification of the wild
population. Meanwhile, in a large study, populations
were detected with genetic diversity and gene flow, which
may give evidence against the influence of interspecific
hybridization
Acknowledgements: This study was funded from
resources allocated to research from 2009 to 2013, as
research project No. N N304 141337
References
[1] Toro M., Caballero A., Characterization and conservation of
genetic diversity in subdivided populations, Philos. Trans. R.
Soc. B Biol. Sci., 2005, 360, 1367–1378
[2] Ellis J.R., Burke J.M., EST-SSRs as a resource for population
genetic analyses, Heredity, 2007, 99, 125–132
[3] Lazrek F., Roussel V., Ronfort J., Cardinet G., Chardon F.,
Aouani M.E., et al., 2009. The use of neutral and non-neutral
SSRs to analyse the genetic structure of a Tunisian collection
of Medicago truncatula lines and to reveal associations with
eco-environmental variables, Genetica, 2009, 135, 391–402
[4] Tian-Ming H., Xue-Sen C., Zheng X., Jiang-Sheng G., Pei-Jun
L., Wen L., et al., 2007. Using SSR markers to determine the
population genetic structure of wild apricot (Prunus armeniaca
L.) in the Ily Valley of West China, Genet. Resour. Crop Evol.,
2007, 54, 563–572
[5] Xie W.G., Lu X.F., Zhang X.Q., Huang L.K., Cheng L., Genetic
variation and comparison of orchardgrass (Dactylis glomerata
L.) cultivars and wild accessions as revealed by SSR markers,
Genet. Mol. Res. GMR, 2012, 11, 425–433
[6] Yamamoto T., Kimura T., Sawamura Y., Manabe T., Kotobuki K.,
Hayashi T., et al., Simple sequence repeats for genetic analysis
in pear, Euphytica, 2002, 124, 129–137
[7] Yamamoto T., Kimura T., Shoda M., Imai T., Saito T., Sawamura
Y., et al., Genetic linkage maps constructed by using an
interspecific cross between Japanese and European pears,
Theor. Appl. Genet., 2002, 106, 9–18
[8] Fernández-Fernández F., Harvey N.G., James C.M., Isolation and
characterization of polymorphic microsatellite markers from
European pear (Pyrus communis L.), Mol. Ecol. Notes, 2006, 6,
1039–1041
[9] Kimura T., Shi Y.Z., Shoda M, Kotobuki K, Matsuta N, Hayashi
T., et al., Identification of Asian Pear Varieties by SSR Analysis,
Breed. Sci., 2002, 52, 115–121
[10] Yamamoto T., Kimura T., Shoda M., Ban Y., Hayashi T., Matsuta
N., Development of microsatellite markers in the Japanese pear
(Pyrus pyrifolia Nakai). Mol. Ecol. Notes, 2002, 2, 14–16
Unauthenticated
Download Date | 6/2/17 11:42 AM

28
Ł. Wolko et al.
[11] Yamamoto T., Kimura T., Sawamura Y., Kotobuki K., Ban
Y., Hayashi T., et al. SSRs isolated from apple can identify
polymorphism and genetic diversity in pear, Theor. Appl.
Genet., 2001, 102, 865–870
[12] Pierantoni L., Cho K-H., Shin I-S., Chiodini R., Tartarini S.,
Dondini L., et al., Characterisation and transferability of apple
SSRs to two European pear F1 populations, Theor. Appl. Genet.,
2004, 109, 1519–1524
[13] Pierantoni L., Dondini L., Cho K.H., Shin I.S., Gennari F.,
Chiodini R., et al., Pear scab resistance QTLs via a European
pear (Pyrus communis) linkage map, Tree Genet. Genomes,
2007, 3, 311–317
[14] Terakami S., Adachi Y., Iketani H., Sato Y., Sawamura Y., Takada
N., et al., Genetic mapping of genes for susceptibility to black
spot disease in Japanese pears, Genome, 2007, 50, 735–741
[15] Evans K.M., Govan C.L., Fernández-Fernández F., 2008. A
new gene for resistance to Dysaphis pyri in pear and identi-
fication of flanking microsatellite markers, Genome, 2008, 51,
1026–1031
[16] Volk G.M., Richards Ch.M., Henk A.D., Reilley A.A., Diversity of
Wild Pyrus communis Based on Microsatellite Analyses, J. Am.
Soc. Hortic. Sci., 2006, 131, 408–417
[17] Bao L., Chen K., Zhang D., Cao Y., Yamamoto T., Teng Y. Genetic
diversity and similarity of pear (Pyrus L.) cultivars native to East
Asia revealed by SSR (simple sequence repeat) markers, Genet.
Resour. Crop Evol., 2007, 54, 959–971
[18] Wolko Ł., Antkowiak W., Lenartowicz E., Bocianowski J., Genetic
diversity of European pear cultivars (Pyrus communis L.) and
wild pear (Pyrus pyraster (L.) Burgsd.) inferred from microsa-
tellite markers analysis. Genet. Resour. Crop Evol., 2010, 57,
801–806
[19] Yakovin N.A., Fesenko I.A., Isachkin A.V., Karlov G.I.,
Polymorphism of microsatellite loci in cultivars and species of
pear (Pyrus L.), Russ. J. Genet., 2011, 47, 564–570
[20] Cao Y., Tian L., Gao Y., Liu F., Genetic diversity of cultivated
and wild Ussurian Pear (Pyrus ussuriensis Maxim.) in China
evaluated with M13-tailed SSR markers. Genet. Resour. Crop
Evol., 2012, 59, 9–17
[21] Sehic J., Garkava-Gustavsson L., Fernández-Fernández F.,
Nybom H., Genetic diversity in a collection of European pear
(Pyrus communis) cultivars determined with SSR markers
chosen by ECPGR, Sci. Hortic., 2012, 145, 39–45
[22] Terpo A., Studies on taxonomy jand grouping of Pyrus species,
Feddes Repert., 1985, 96, 73–87.
[23] Oliveira C.M., Mota M., Monte-Corvo L., Goulao L., Silva D.M.,
Molecular typing of Pyrus based on RAPD markers, Sci. Hortic.,
1999, 79, 163–174
[24] Potter D., Eriksson T., Evans R.C., Oh S., Smedmark J.E.E., et
al., Phylogeny and classification of Rosaceae, Plant Syst. Evol.,
2007, 266, 5–43
[25] Zheng, X., Hu, C., Spooner, D., Liu, J., Cao J., Teng Y., Molecular
evolution of Adh and LEAFY and the phylogenetic utility of their
introns in Pyrus (Rosaceae), BMC Evol. Biol., 2011, 11, 255
[26] Paganová V., The evaluation of height growth of wild pear
(Pyrus pyraster) progenies from different regions of Slovak
republic, J. For. Sci. - UZPI Czech Repub., 2001, 47, 464–472
[27] Paganová V., Taxonomic reliability of leaf and fruit morpho-
logical characteristics of the Pyrus L. taxa in Slovakia, Horticul
Sci Prague, 2003, 30, 98–107
[28] Paganová V., Wild pear Pyrus pyraster L. Burgsd. requirements
on environmental conditions, Hortic. Sci., 2003, 22, 225–241
[29] Paganová V., The occurrence and morphological characteristics
of the wild pear lower taxa in Slovakia, Hortic. Sci., 2009, 36,
1–13.
[30] Antkowiak W., Cedro A., Prajs B., Wolko Ł., Michalak M.,
Success of wild pear Pyrus pyraster (L.) Burgsd. in colonization
of steep sunny slopes : an interdisciplinary study in the
Bielinek Reserve (NW Poland), Pol. J. Ecol., 2012, 60, 57–78
[31] Hoffmann H., Zur Verbreitung und Ökologie der Wildbirne
(Pyrus communis L.) in Süd-Niedersachsen und Nordhessen
sowie ihrer Abgrenzung von verwilderten Kulturbirnen (Pyrus
domestica Med.), Mitt Dtsch. Dendrol Ges, 1993, 81, 71–94
[32] Wagner I., Zusammenstellung morphologischer Merkmale
und ihrer Ausprägungen zur Unterscheidung von Wild- und
Kulturformen des Apfel - (Malus) und des Birnbaumes (Pyrus),
Mitt Dtsch. Dendrol Ges, 1996, 82, 87–108
[33] Dostálek I., Pyrus x amphigenea, seine Taxonomie und
Nomenklatur. Folia Geobot Phytotaxon, 1989, 24, 103–108
[34] Dolatowski J.N.J., Podyma W., Szymanska M., Zych M.,
Molecular studies on the variability of Polish semi-wild pears
Pyrus using AFLP, J. Fruit Ornam. Plant Res., 2004, 12, 331–337
[35] Halász J., Hegedûs A., Pedryc A., Review of the molecular
background of self-incompatibility in rosaceous fruit trees, J.
Hortic. Sci., 2006, 12, 7–18
[36] Holderegger R., Häner R., Csencsics D., Angelone S., Hoebee
S.E., S-allele diversity suggests no mate limitation in small
populations of a self-incompatible plant, Evol. Int. J. Org. Evol.,
2008, 62, 2922–2928
[37] Wolko Ł., Antkowiak W., Sips M., Słomski R., Self-incompa-
tibility alleles in Polish wild pear (Pyrus pyraster (L.) Burgsd.): a
preliminary analysis, J. Appl. Genet., 2010, 51, 33–35
[38] Hoebee S.E., Angelone S., Csencsics D., Määttänen K.,
Holderegger R., Diversity of S-Alleles and Mate Availability in 3
Populations of Self-Incompatible Wild Pear (Pyrus pyraster), J.
Hered., 2012, 103, 260–267
[39] Torres A.M., Weeden N.F., Martín A., Linkage among isozyme,
RFLP and RAPD markers in Vicia faba, Theor. Appl. Genet.,
1993, 85, 937–945
[40] Nei M., Chesser R.K., Estimation of fixation indices and gene
diversities. Ann. Hum. Genet., 1983, 47, 253–259
[41] Weir B.S., Cockerham C.C., Estimating F-Statistics for the
Analysis of Population Structure, Evolution, 1984, 38, 1358
[42] Anderson J.A., Churchill G.A., Autrique J.E., Tanksley S.D.,
Sorrells M.E., Optimizing parental selection for genetic linkage
maps, Genome Natl. Res. Counc. Can., 1993, 36, 181–186
[43] Peakall R., Smouse P.E., GenAlEx 6: genetic analysis in Excel.
Population genetic software for teaching and research, Mol.
Ecol. Notes, 2006, 6, 288–295
[44] Falconer D.S., Mackay T.F.C., Introduction to quantitative
genetics, Longman, Essex, England. 1996
[45] Irzykowska L., Weber Z., Bocianowski J., Comparison of
Claviceps purpurea populations originated from experimental
plots or fields of rye, Cent. Eur. J. Biol., 2012, 7, 839–849
[46] Nei M., Tajima F., Tateno Y., Accuracy of estimated phylogenetic
trees from molecular data, J. Mol. Evol., 1983, 19, 153–170
[47] Bowcock A.M., Ruiz-Linares A., Tomfohrde J., Minch E., Kidd
J.R., et al., High resolution of human evolutionary trees with
polymorphic microsatellites, Nature, 1994, 368, 455–457
Unauthenticated
Download Date | 6/2/17 11:42 AM

Genetic diversity and population structure of wild pear (Pyrus pyraster (L.) Burgsd.) in Poland
29
[53] Hardesty B.D., Dick C.W., Kremer A., Hubbell S., Bermingham
E., Spatial genetic structure of Simarouba amara Aubl.
(Simaroubaceae), a dioecious, animal-dispersed Neotropical
tree, on Barro Colorado Island, Panama, Heredity, 2005, 95,
290–297
[54] López-Bao J.V., González-Varo J.P., Frugivory and Spatial
Patterns of Seed Deposition by Carnivorous Mammals in
Anthropogenic Landscapes: A Multi-Scale Approach. PLoS ONE,
2011, 6, e14569
Supplemental Material: The online version of this article
(DOI: 10.1515/biol-2015-0003) offers supplementary material.
[48] Evanno G., Regnaut S., Goudet J., Detecting the number of
clusters of individuals using the software STRUCTURE: a
simulation study, Mol. Ecol., 2005, 14, 2611–2620
[49] Lenormand T., Gene flow and the limits to natural selection,
Trends Ecol. Evol., 2002, 17, 183–189
[50] Burczyk J., DiFazio S.P., Adams W.T., Gene flow in forest trees:
how far do genes really travel, For. Genet., 2004, 11, 179–192
[51] Konuma A., Tsumura Y., Lee C.T., Lee S.L., Okuda T., Estimation
of gene flow in the tropical-rainforest tree Neobalanocarpus
heimii (Dipterocarpaceae), inferred from paternity analysis,
Mol. Ecol., 2000, 9, 1843–1852
[52] Godoy J.A., Jordano P., Seed dispersal by animals: exact identi-
fication of source trees with endocarp DNA microsatellites, Mol.
Ecol., 2001, 10, 2275–2283
Unauthenticated
Download Date | 6/2/17 11:42 AM
Document Outline
Wyszukiwarka
Podobne podstrony:
[Open Life Sciences] Antifungal activity of some botanical extracts onFusarium oxysporum
[Open Life Sciences] Biological activity of new flavonoid from Hieracium pilosella L
Syntactic doubling and the structure of wh chains
Britain and the Origin of the Vietnam War UK Policy in Indo China, 1943 50
Rajkumar Revathi Genetic Structure of Four Socio culturally Diversified Caste Populations of Southw
A Semantic Approach to the Structure of Population Genetics
McGrath; Has Science Eliminated God; Richard Dawkins and the Meaning of Life
1 high and popular culture
Attribution of Hand Bones to Sex and Population Groups
Syntheses, structural and antimicrobial studies of a new N allylamide
Programming Survey Of Genetic Algorithms And Genetic Programming
SCI03 Model Making Workshop Structure of Tall Buildings and Towers
Becker The quantity and quality of life and the evolution of world inequality
open inflation, the four form and the cosmological constant
A Comparison between Genetic Algorithms and Evolutionary Programming based on Cutting Stock Problem
Childhood Experience and the Expression of Genetic Potential
Fibrillar Structure and Mechanical Properties of Collagen
alesinassrn Ethnic diversity and economic performance
materialy z alkoholi Nomenclature and Structure of Alcohols
więcej podobnych podstron