
Email networks and the spread of computer viruses
M. E. J. Newman,
1
Stephanie Forrest,
1, 2
and Justin Balthrop
2
1
Santa Fe Institute, 1399 Hyde Park Road, Santa Fe, NM 87501
2
Department of Computer Science, University of New Mexico, Albuquerque, NM 87131–1386
Many computer viruses spread via electronic mail, making use of computer users’ email address
books as a source for email addresses of new victims. These address books form a directed social
network of connections between individuals over which the virus spreads.
Here we investigate
empirically the structure of this network using data drawn from a large computer installation and
discuss the implications of this structure for the understanding and prevention of computer virus
epidemics.
The structure of various networks, including social and
computer networks, has been a subject of considerable re-
cent interest in the physics literature [1, 2]. The spread of
infection is an area of special interest [3–6], including the
spread of human diseases and also computer viruses [7, 8],
which are the topic of this paper. We present an empiri-
cal analysis of the networks over which computer viruses
spread and study some possible control strategies for pre-
venting virus infections.
Currently, the primary vehicle for transmission of com-
puter viruses is electronic mail. Viruses typically arrive
on a computer as an attachment to an email message
which, when activated by the user, sends further copies
of itself to other recipients. The email addresses of these
other recipients are usually obtained by examining an
email “address book,” a file in which the user for con-
venience stores the email addresses of his or her regular
correspondents. As pointed out by Lloyd and May [5],
these address books create a network of computer users
over which the virus spreads. One can visualize this net-
work as a set of nodes representing computer users, with
a link running from user A to user B if B’s email ad-
dress appears in A’s address book. This network is en-
tirely distinct from the physical network of optical fibers
and other connections over which data are transferred be-
tween computers [21]. The network over which an email
virus spreads is a social network of personal connections
between computer users. If we are to understand the
mechanisms by which viruses spread, we need to under-
stand first the structure of this social network.
We have analyzed address book data in 20 common
formats, gathered from a large university computer sys-
tem serving 27 841 users, and thereby reconstructed the
corresponding network of computer users. Because email
viruses can only be transmitted if computer users actu-
ally read their email, all data were discarded for users
who had not read their email in the previous 90 days,
leaving a total of 16 881 in the network.
The network necessarily omits any connections from
the outside world to users inside the network, since there
is no way to find out about such connections other than
by collecting data from external users. A similar issue
arises in studies of the structure of the World-Wide Web,
in which hyperlinks to a website from other sites cannot
easily be discovered. Connections to users from outside
the observed network are important because it is presum-
ably along these connections that viral infection initially
arrives. Thus our data can tell us about the spread of
viruses within a community, but not about how those
viruses arrive in the first place. From a practical stand-
point, however, there is little that computer system ad-
ministrators can do to control the spread of a virus in
the world at large. Consequently, their efforts are usu-
ally focussed on minimizing damage once the infection
enters the computer system for which they have respon-
sibility. For this reason, we have also eliminated from our
network all connections to users outside the network, of
which there are many, leaving a network composed only
of those connections that fall within the set of users stud-
ied.
An important property of our email network is that
it is directed. That is, each edge (i.e., line) joining two
vertices in the network has a direction. Just because
B’s email address appears in A’s address book does not
necessarily mean that the reverse is also true, although,
as we will see, it often is. The directed nature of the
network makes the spread of email viruses qualitatively
different from the spread of human diseases, for which
most types of disease-causing contact are undirected. As
we will see, there are a variety of interesting phenomena
that are peculiar to the spread of infection on a directed
network.
Table I provides a summary of the statistical proper-
ties of our email network. In the remainder of this paper
we discuss in detail the network structure and its impli-
cations for virus spread.
The first thing we notice about our network is that
quite a small fraction of the sixteen thousand vertices
actually have address books—around a quarter [22].
However, a majority of the vertices in the network are
nonetheless connected to one another, by edges leading
either in or out of the vertex, or both. About ten thou-
sand vertices, or 59%, are connected to others and there-
fore are at risk of either receiving or passing on virus
infections.
The mean degree
z of a vertex is 3.38. (Recall that
the degree of a vertex is the number of edges to which
it is connected.) In a directed network such as this one,
vertices have both an in-degree and an out-degree. The
means of these numbers are the same, since every edge
2
number of vertices
16881
number with address books
4581
number with non-zero in- or out-degree
10110
mean number of entries per address book
12
.45
mean degree
z (either in or out)
3
.38
correlation coeff. of in- and out-degree
0
.529
clustering coefficient
0
.168
expected clustering on random graph
0
.017
total number of edges
57029
number of edges that point both ways
13176
fraction pointing both ways (reciprocity)
0
.231
expected reciprocity on random graph
0
.00095
TABLE I: Summary of statistical properties of the email net-
work.
that begins at a vertex must end at some other vertex.
Thus
z is both the mean in- and out-degree. As a rough
rule of thumb, viruses spread when the mean out-degree
of a vertex is greater than 1, since in this regime each
infection received by a computer is on average passed on
to more than one other. Thus it appears that our net-
work of computer users is easily dense enough to spread
infection.
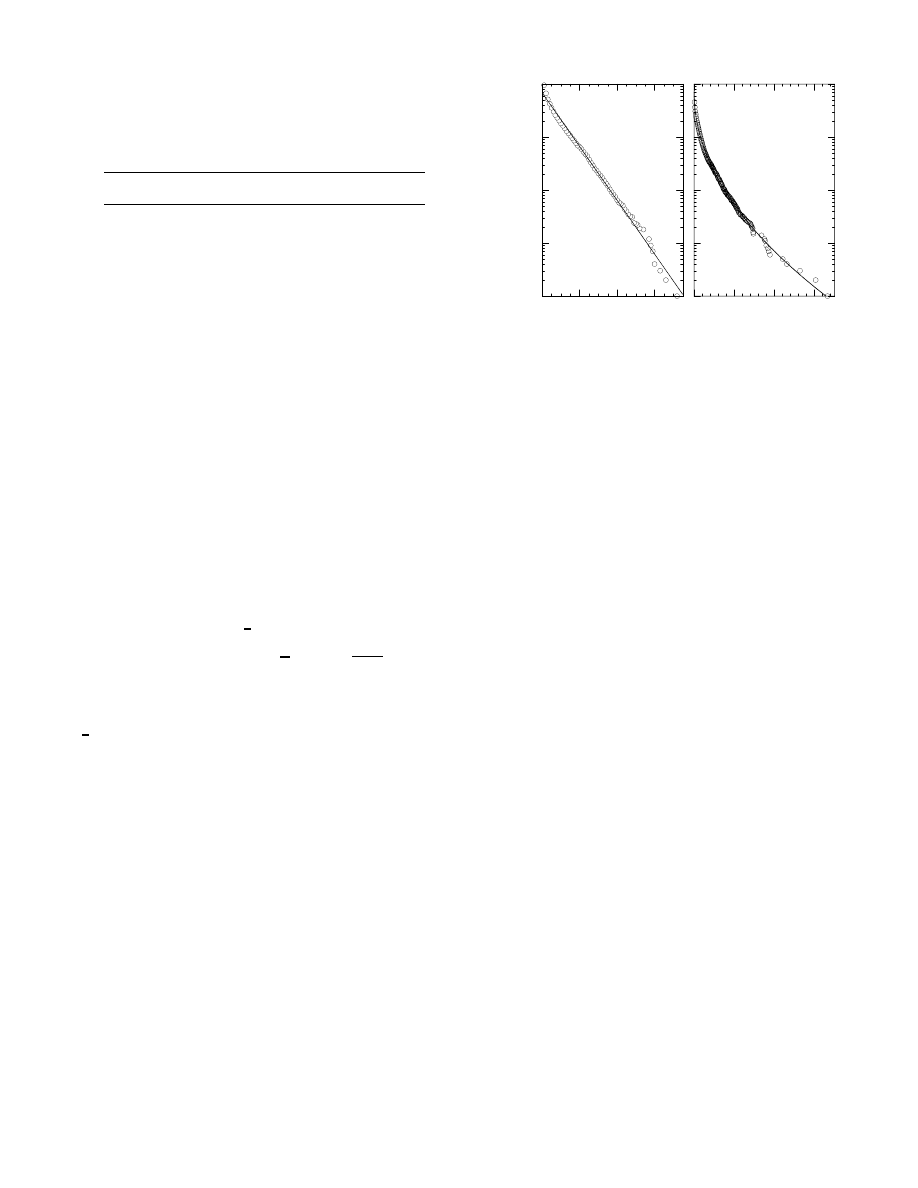
Also of interest is the distribution of vertex degrees.
In Fig. 1 we show cumulative histograms of in- and out-
degree for our network. Both distributions are markedly
faster decaying than the power-law degree distributions
seen in other technological networks such as the Inter-
net [9] and the World-Wide Web [10, 11]. In fact, as the
figure shows, the cumulative distributions are well fit by
a simple exponential for the in-degree and a stretched ex-
ponential with exponent
1
2
for the out-degree. These cor-
respond to non-cumulative distributions
p
j
∼ exp(−j/j
0
)
for in-degree and
p
k
∼
1
/
√
k
exp
−
√
k/k
0
for out-
degree with
j
0
= 8
.57(9) and k
0
= 4
.18(3). (Free fits to
stretched exponential forms give values of 1
.034 and 0.493
for the two exponents, very close to the values of 1 and
1
2
assumed here.) Interestingly, both these degree distri-
butions are known to occur in certain models of growing
networks—the pure exponential in models with random
edge assignment [12] and the stretched exponential in
models with sublinear preferential attachment [13]. Thus
the observed distributions would probably be well fit by
a growth model in which the source of added edges was
chosen according to a sublinear preferential attachment
and the destination at random. This seems reasonable:
it is natural to suppose that individuals who already have
large address books would be more likely to add to them
than individuals who do not, but it is not clear that there
is any mechanism that would favor making new connec-
tions to individuals with high in-degree.
Regardless of the precise degree distribution, however,
it is clear that there are a few vertices in the network that
have very high degree. This has important implications
for the spread of infection on the network [4, 14, 15], a
point which we discuss further below.
The in- and out-degrees of a vertex are not necessarily
independent, but may be correlated (or anticorrelated),
0
20
40
60
in−degree
1
10
100
1000
10000
cumulative distribution
0
100
200
300
out−degree
FIG. 1: In- and out-degree distributions for our network. The
solid lines represent fits to the exponential and stretched ex-
ponential forms discussed in the text.
and one should therefore really consider a joint distribu-
tion
p
jk
of in-degree
j and out-degree k [16]. Although
this quantity is difficult to represent visually, one can
get an idea of the level of correlation between in- and
out-degrees by calculating a correlation coefficient for the
two, given by
r =
jk
jkp
jk
− z
2
/
σ
in
σ
out
, where
σ
in
and
σ
out
are the corresponding standard deviations. This
quantity takes values in the range
−1 ≤ r ≤ 1, depend-
ing on the level of correlation. For our network, we find
its value to be
r = 0.53, indicating that the two degrees
are strongly correlated—the email addresses of individu-
als who have large address books tend to appear in the
address books of many others.
Another important statistical property peculiar to di-
rected networks is the “reciprocity” [17].
Reciprocity
measures the fraction of edges between vertices that point
both ways. In the network studied here, the reciprocity is
about 0
.23, i.e., if there is an edge pointing from vertex A
to vertex B, then there is a 23% probability that there
will also be an edge from B to A. As before we can also
calculate the reciprocity on a random graph, and in terms
of the joint degree distribution
p
jk
defined above we find
that the expected value is (
nz)
−1
jk
jkp
jk
, which gives
9
.49×10
−4
for the present network, several orders of mag-
nitude smaller than the observed value. This strongly
suggests that the observed value is not the result of pure
chance association of vertices. Very likely we are ob-
serving social phenomena at work—there is a heightened
chance that you will have a person in your address book
if they have you in theirs, presumably because the pres-
ence of a person’s address in an address book implies
some kind of social connection between the two people in
question, which in many cases goes both ways.
Bidirectional edges can be thought of as undirected,
and the email network can be thought of as a “semi-
directed network,” a graph in which some edges are di-

3
links out
links in
strongly
connected
component
(20%)
(34%)
tendrils
(3%)
(2%)
other
components
(41%)
FIG. 2: The structure and relative sizes of the components of
our email network.
rected and others are undirected. (Technically one might
define a semi-directed network as one in which the reci-
procity does not tend to zero as
n becomes large, but in-
stead tends to a non-zero constant value.) It seems likely
that many other real-world networks that are formally
directed networks are in fact really semi-directed. For
example, we have calculated the reciprocity for a 269 504
vertex subset of the World-Wide Web [10], which is a di-
rected network of web pages and hyperlinks, and found
a value of 0
.57, where the expected value on the corre-
sponding random graph would be 1
.2 × 10
−4
, indicating
that the Web is probably also a semi-directed graph.
We turn now to the specific issue of the spread of com-
puter virus infections over email networks. A virtue of
the approach taken here is that, since we have the en-
tire network available, we can study infection dynamics
directly without relying on approximate techniques such
as differential equation models, statistical deduction, or
computer simulation, as in most studies of human dis-
eases. Here we make the most pessimistic assumption
about email viruses, that they spread with essentially
100% efficiency. That is, we assume that they ruthlessly
send copies of themselves to everyone listed in an address
book, and that no recipients are immune to viruses be-
cause of antivirus software or other precautions. (The
real-world situation is unlikely to be this bad; our calcu-
lations give a worst-case scenario.)
Consider then an email network of the type studied
here. Since the network is directed, there does not nec-
essarily exist a path that could carry a virus from ver-
tex A to vertex B, even if A and B are connected by
edges in the network, since the virus can in general only
pass one way along each edge. The large-scale structure
of a directed network can be represented by the “bow-
tie diagram” of Broder et al. [11] depicted in Fig. 2. A
strongly connected component of the network is defined
to be any subset of vertices in which every vertex can
be reached from every other. Typically the network has
one giant strongly connected component (GSCC) which
contains a significant fraction of the entire network, as
well as a number of smaller strongly connected compo-
nents. The GSCC is represented by the circular middle
part of the bow-tie in the figure. Then there is a gi-
ant in-component, which comprises the GSCC plus those
vertices from which the GSCC can be reached but which
cannot themselves be reached from the GSCC. We can
think of the latter set as being the vertices “upstream” of
the GSCC. They are represented by the left part of the
bow-tie. There is also a giant out-component consisting
of the GSCC plus “downstream” vertices (the right part
of the bow-tie). In addition, there may be small groups
of vertices that are connected to the giant components
but not part of them (sometimes called “tendrils”) or
that are not connected to the giant components at all.
For our email network, the sizes of these various por-
tions are given in Fig. 2. As we can see, the bow-tie is
in this case quite asymmetric, with many more vertices
downstream of the GSCC than upstream of it. Most of
the downstream vertices are vertices that have zero out-
degree themselves (i.e., no address book) but which are
pointed to by members of the GSCC.
We can apply these insights to the spread of email
viruses as follows. We concentrate on the giant compo-
nents; infections in the small components will not spread
to the population at large—it is the giant component that
is responsible for large-scale virus epidemics.
A virus
outbreak that starts with a single vertex will become an
epidemic if and only if that vertex falls in the giant in-
component. The number of vertices infected in such an
epidemic (making the pessimistic assumptions above) is
equal at least to the size of the giant out-component. It
may be slightly larger than this if the epidemic starts in
the region upstream of the GSCC and thus affects some
vertices there also. For the particular case of our net-
work, we find that epidemics have a minimum size of
9108 vertices and a maximum size of 9132, which means
that about 54% of the network is at risk from epidemic
outbreaks.
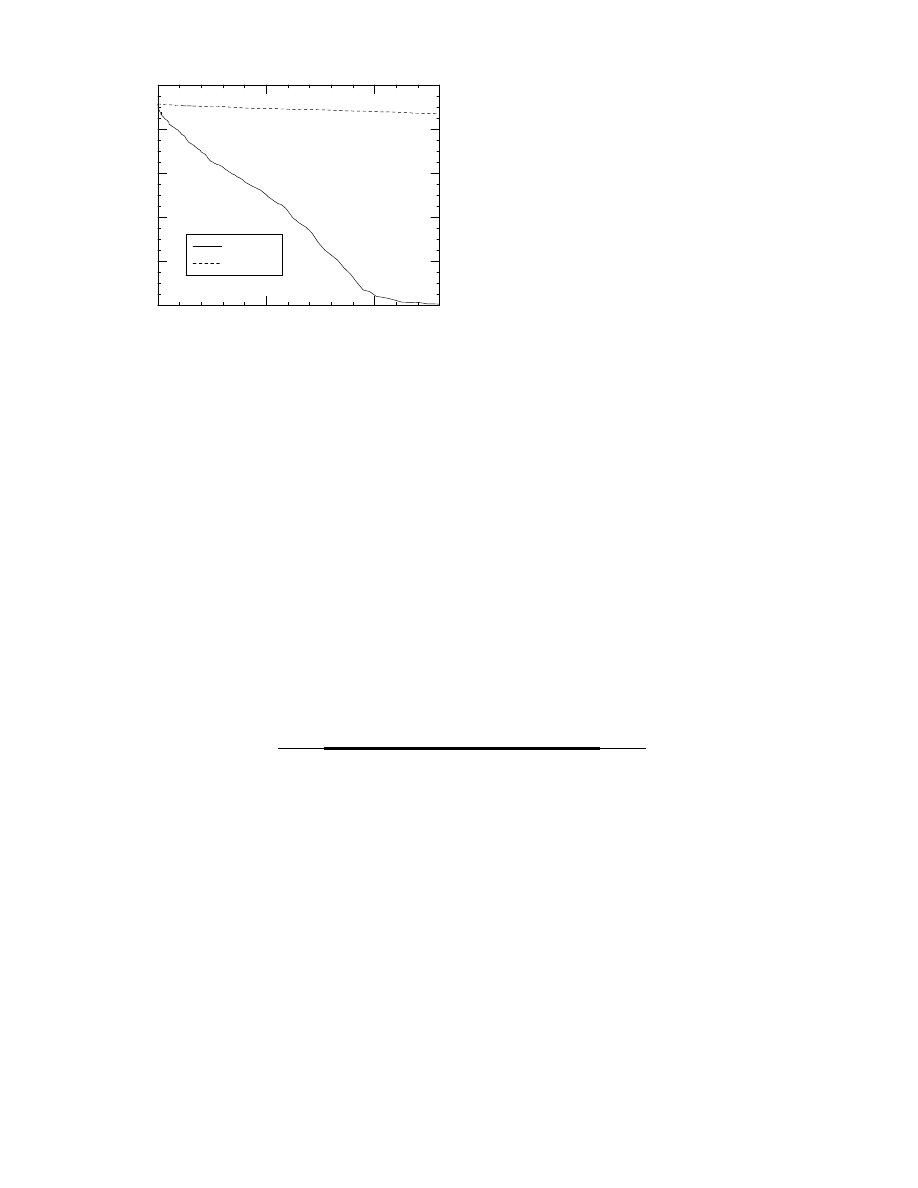
So how can we prevent these epidemics or reduce their
size? Current virus prevention strategies correspond es-
sentially to random “vaccination” of computers using
anti-virus software [23]. Our network data however sug-
gest that this is an ineffective way of combating infection.
In Fig. 3 we show (dotted line) the maximum possible
outbreak size in our network as vertices are removed at
random from the network. As the figure shows, the out-
break size drops only very slowly as vertices are removed,
a result similar to that seen in other networks [14, 18, 19].
On the other hand, previous work on other networks
has shown that often a very effective strategy is targeted
removal of vertices, i.e., identification and removal of the
vertices most responsible for the spread of infection. For
undirected networks, simply removing the vertices with
highest degree often works well [11, 18, 19]. A similar but
slightly more sophisticated strategy looks promising in
the present case. In Fig. 3 (solid line), we show the result
of removing vertices from the giant in-component of our
4
0
0.05
0.1
fraction of vertices removed
0
2000
4000
6000
8000
10000
outbreak size
targeted
random
FIG. 3: The maximum outbreak size on our network as ver-
tices in the giant in-component are progressively removed ei-
ther at random (dotted line) or in decreasing order of their
out-degree (solid line).
network in decreasing order of out-degree (i.e., of address
book size). As the figure shows, the maximum size of
the epidemic in this case declines sharply as vertices are
removed, until about the 10% mark, beyond which the
epidemic is negligibly small and further removal achieves
little. This suggests that if we can protect a suitably
selected 10% of the vertices in the network, almost all
vertices would become immune to an epidemic.
In this paper, we have analyzed data on the structure of
the network formed by the email address books of com-
puter users; it is over this network that email viruses
spread. We have simulated the effect on virus propaga-
tion of both random and targeted “vaccination” of ver-
tices and find that random vaccination, which is roughly
equivalent to current anti-virus precautions, is expected
to have little effect on virus spread. Targeted vaccina-
tion, on the other hand, looks much more promising.
This suggests that we should be developing virus con-
trol strategies that take network structure into account.
Similar concepts could also be used to identify high-risk
vertices in the network and determine priority orderings
for security upgrades. Because it is often infeasible to
upgrade all hosts in a network simultaneously (especially
if the upgrades require hardware modifications), and be-
cause upgrades are routine and continual, such a strat-
egy could yield a substantial benefit in terms of reduced
network vulnerabilities. For environments that use cen-
tralized and well-protected address books (e.g., to store
addresses of interest to an entire community), the kind
of analysis performed here could potentially be useful in
analyzing and managing the tradeoffs between local and
centralized address books. For example, how large can a
locally stored address book grow before it becomes worth-
while to accord it the same protections and restrictions
as centralized databases?
The ideas considered here may also be applicable to
other social networks that are exploitable by computer
viruses or worms. Email networks are the most obvious
example of such a network today, but other electronic ser-
vices give rise to social networks as well. The techniques
employed in our analysis of email network analysis could
readily be applied in some of these new settings, and more
speculatively, might be useful as a guide for engineering
new network services in the future.
The authors thank Jeff Gassaway and George Kelb-
ley for providing the data used for the analyses in this
paper. This work was supported in part by the Office
of Naval Research, the NSF, DARPA, and by the Intel
Corporation.
[1] R. Albert and A.-L. Barab´
asi, Statistical mechanics of
complex networks.
Rev. Mod. Phys. 74, 47–97 (2002).
[2] S. N. Dorogovtsev and J. F. F. Mendes, Evolution of
networks.
Advances in Physics 51, 1079–1187 (2002).
[3] C. Moore and M. E. J. Newman, Epidemics and perco-
lation in small-world networks.
Phys. Rev. E 61, 5678–
5682 (2000).
[4] R. Pastor-Satorras and A. Vespignani, Epidemic spread-
ing in scale-free networks.
Phys. Rev. Lett. 86, 3200–3203
(2001).
[5] A. L. Lloyd and R. M. May, How viruses spread among
computers and people.
Science 292, 1316–1317 (2001).
[6] D. J. Watts, A simple model of global cascades on ran-
dom networks.
Proc. Natl. Acad. Sci. USA 99, 5766–5771
(2002).
[7] W. H. Murray, The application of epidemiology to com-
puter viruses.
Computers and Security 7, 139–150 (1988).
[8] J. O. Kephart, S. R. White, and D. M. Chess, Computer
viruses and epidemiology.
IEEE Spectrum 30(5), 20–26
(1993).
[9] M. Faloutsos, P. Faloutsos, and C. Faloutsos, On power-
law relationships of the internet topology.
Computer
Communications Review 29, 251–262 (1999).
[10] R. Albert, H. Jeong, and A.-L. Barab´
asi, Diameter of the
world-wide web.
Nature 401, 130–131 (1999).
[11] A. Broder, R. Kumar, F. Maghoul, P. Raghavan, S. Ra-
jagopalan, R. Stata, A. Tomkins, and J. Wiener, Graph
structure in the web.
Computer Networks 33, 309–320
(2000).
[12] D. S. Callaway, J. E. Hopcroft, J. M. Kleinberg, M. E. J.
Newman, and S. H. Strogatz, Are randomly grown graphs
really random?
Phys. Rev. E 64, 041902 (2001).
[13] P. L. Krapivsky, S. Redner, and F. Leyvraz, Connectivity
of growing random networks.
Phys. Rev. Lett. 85, 4629–
4632 (2000).
[14] R. Cohen, K. Erez, D. ben-Avraham, and S. Havlin, Re-
silience of the Internet to random breakdowns.
Phys. Rev.
Lett. 85, 4626–4628 (2000).

5
[15] F. Liljeros, C. R. Edling, L. A. N. Amaral, H. E. Stanley,
and Y. ˚
Aberg, The web of human sexual contacts.
Nature
411, 907–908 (2001).
[16] M. E. J. Newman, S. H. Strogatz, and D. J. Watts, Ran-
dom graphs with arbitrary degree distributions and their
applications.
Phys. Rev. E 64, 026118 (2001).
[17] S. Wasserman and K. Faust,
Social Network Analysis.
Cambridge University Press, Cambridge (1994).
[18] R. Albert, H. Jeong, and A.-L. Barab´
asi, Attack and
error tolerance of complex networks.
Nature 406, 378–
382 (2000).
[19] D. S. Callaway, M. E. J. Newman, S. H. Strogatz, and
D. J. Watts, Network robustness and fragility: Percola-
tion on random graphs.
Phys. Rev. Lett. 85, 5468–5471
(2000).
[20] H. Ebel, L.-I. Mielsch, and S. Bornholdt, Scale-free
topology of e-mail networks. Preprint cond-mat/0201476
(2002).
[21] It is important also to distinguish between the network
described here and networks of actual email messages
passing between computer users, which have been stud-
ied previously by, for example, Ebel
et al. [20]. While
the latter network is certainly of use in understanding
patterns of communication between computer users, it is
only indirectly relevant to virus spread, since most email
messages do not carry viruses.
[22] This is a lower bound. Although data were collected for a
wide variety of address book formats, there are probably
still some that were missed.
[23] One should bear in mind that anti-virus software works
only on known viruses, not new or unknown strains.
Wyszukiwarka
Podobne podstrony:
The Impact of Countermeasure Spreading on the Prevalence of Computer Viruses
A software authentication system for the prevention of computer viruses
social networks and the performance of individualns and groups
The Legislative Response to the Evolution of Computer Viruses
The Impact of Countermeasure Propagation on the Prevalence of Computer Viruses
social networks and the performance of individuals and groups
The Social Psychology of Computer Viruses and Worms
network memory the influence of past and current networks on performance
Algebraic Specification of Computer Viruses and Their Environments
Lee Institutional embeddedness and the formation of allieance networks a longitudinal study
A Filter That Prevents the Spread of Mail Attachment Type Trojan Horse Computer Worms
On the Spread of Viruses on the Internet
On the Time Complexity of Computer Viruses
Reports of computer viruses on the increase
Harrison C White Status Differentiation and the Cohesion of Social Network(1)
On Computer Viral Infection and the Effect of Immunization
Infection, imitation and a hierarchy of computer viruses
Suppressing the spread of email malcode using short term message recall
więcej podobnych podstron