
Insect
Biochemistry
and
Molecular
Biology
Insect Biochemistry and Molecular Biology 36 (2006) 934–942
A comparison of Drosophila melanogaster detoxification gene induction
responses for six insecticides, caffeine and phenobarbital
$
Lee Willoughby
a
, Henry Chung
a
, Chris Lumb
a
, Charles Robin
b
,
Philip Batterham
a,
, Phillip J. Daborn
a
a
Centre for Environmental Stress and Adaptation Research (CESAR), Department of Genetics, Bio21 Molecular Science and Biotechnology Institute,
The University of Melbourne, Vic. 3010, Australia
b
Department of Genetics, The University of Melbourne, Vic. 3010, Australia
Received 21 August 2006; received in revised form 12 September 2006; accepted 12 September 2006
Abstract
Modifications of metabolic pathways are important in insecticide resistance evolution. Mutations leading to changes in expression
levels or substrate specificities of cytochrome P450 (P450), glutathione-S-transferase (GST) and esterase genes have been linked to many
cases of resistance with the responsible enzyme shown to utilize the insecticide as a substrate. Many studies show that the substrates of
enzymes are capable of inducing the expression of those enzymes. We investigated if this was the case for insecticides and the enzymes
responsible for their metabolism. The induction responses for P450s, GSTs and esterases to six different insecticides were investigated
using a custom designed microarray in Drosophila melanogaster. Even though these gene families can all contribute to insecticide
resistance, their induction responses when exposed to insecticides are minimal. The insecticides spinosad, diazinon, nitenpyram,
lufenuron and dicyclanil did not induce any P450, GST or esterase gene expression after a short exposure to high lethal concentrations of
insecticide. DDT elicited the low-level induction of one GST and one P450. These results are in contrast to induction responses we
observed for the natural plant compound caffeine and the barbituate drug phenobarbital, both of which highly induced a number of
P450 and GST genes under the same short exposure regime. Our results indicate that, under the insecticide exposure conditions we used,
constitutive over-expression of metabolic genes play more of a role in insect survival than induction of members of these gene families.
r
2006 Elsevier Ltd. All rights reserved.
Keywords: Cytochrome P450; Insecticide; Microarray; Glutathione-S-transferase; Gene expression; Insecticide resistance
1. Introduction
The ability of a substrate to increase the activity of
enzymes that are capable of metabolizing it is a key feature
of many different biological pathways. Rather than
constitutively expressing genes involved in metabolizing a
substrate, transcriptional induction in response to the
substrate is a means of activating gene expression only
when required. This presumably causes less of a general
metabolic burden than the constitutive expression of all
metabolic enzymes, and helps protect the organism from
the activities of promiscuous enzymes. The link between
exogenous compounds acting as induction agents and the
induced enzymes metabolizing them has been established in
mammalian detoxification systems, generally in drug–drug
interaction studies (
;
). The genes induced by drugs encode
enzymes involved in the metabolism of those drugs,
including members of the cytochrome P450 (P450) and
glutathione-S-transferase (GST) families (
;
;
Ellinger-Ziegelbauer et al., 2005
It is well established that members of the P450, GST and
esterase families are important in many instances of
insecticide resistance. Resistance results from genetic
changes leading to either altered expression, or altered
function, of genes in these families leading to increased
ARTICLE IN PRESS
0965-1748/$ - see front matter r 2006 Elsevier Ltd. All rights reserved.
doi:
$
Data deposition:
Corresponding author. Tel.: +61 38344 2363; fax: +61 39347 5352.
E-mail address:

metabolism or sequestration of insecticides before they can
reach their molecular target (
;
;
). The P450, GST and esterase gene families are large,
rapidly evolving gene families. Little is known about the
substrate specificity of most of the encoded enzymes,
making the ability to predict which genes have the potential
to be involved in insecticide resistance difficult.
If substrates can induce the expression of enzymes
involved in their metabolism, as has been suggested
specifically for P450s (
), and demonstrated
in mammalian detoxification systems (
;
Ellinger-Ziegelbauer et al., 2005
;
), then the gene induction responses of insect
P450s, GSTs and esterases to insecticides could be used to
identify those enzymes with the capacity to metabolize
insecticides. Insects exhibit induction responses to other
xenobiotics they come into contact with, such as toxic plant
compounds. For example, the black swallowtail butterfly
Papilio polyxenes induces the P450 genes Cyp6B1 and
Cyp6B3 in response to the toxic furanocoumarin com-
pound xanthotoxin produced by plant families such as
Apiaceae and Rutaceae (
). Both CYP6B1 and CYP6B3 are capable of
metabolizing xanthotoxin to varying degrees, enabling
P. polyxenes to use these plants as a food source (
). A similar response occurs in
the cotton bollworm, Helicoverpa zea, where Cyp6B8 and
Cyp321A1 are induced by and are capable of metabolizing
xanthotoxin (
;
). The
cactophilic Drosophila species D. mettleri feeds on the toxic
allelochemical-producing necrotic tissues of the columnar
cacti species, a substrate that is toxic to all but the normal
resident species. Toxic isoquinoline alkaloids of the cactus
highly induce the expression of the D. mettleri P450
Cyp4D10, which has been suggested to be involved in the
metabolism of isoquinoline alkaloids (
In this study, we investigated the capacity of insecticides
to induce the expression of P450, GST or esterase genes
potentially involved in their metabolism. In the absence of
a full genome sequence for any pest insect species we
conducted this study in D. melanogaster where a micro-
array containing all of the P450, GST and esterase genes
was constructed to assay the transcriptional response to
insecticide exposure. While D. melanogaster is not generally
considered to be a pest species, field resistance has been
observed for most of the major insecticides used in
agriculture (
;
;
). In this study insects were exposed to
six chemically distinct insecticides that have been widely
used in the field plus the natural plant compound caffeine,
and the known P450 inducer phenobarbital (PB). One or
more of the metabolic genes has been shown to have the
capacity to confer resistance to five of the six insecticides
(
;
) (Daborn et al.,
unpublished results). If insecticides induce the expression
of genes responsible for their metabolism, induction could
be used to identify genes with the capacity to be involved in
metabolic resistance. However, this study shows that there
is a minimal induction response to insecticide exposure.
2. Materials and methods
2.1. Fly strain
The y; cn bw sp strain of D. melanogaster (Bloomington
Drosophila Stock Center, Indiana University, IN) was used
for all of the induction experiments reported here. This
strain is isochromosomal for all chromosomes and its
genome has been sequenced (
).
2.2. Exposure to PB, caffeine and insecticides
DDT, spinosad, nitenpyram and diazinon are fast acting
insecticides that target the nervous system. Lufenuron and
dicyclanil are both insect growth regulators (IGRs),
causing larval lethality usually during life stage transitions.
Third instar larvae were exposed to the insecticides
lufenuron, dicyclanil, spinosad, nitenpyram and diazinon
via the food source for 4 h. For lufenuron and dicyclanil,
third instar larvae were exposed to concentrations sig-
nificantly higher than those required to arrest development
at a life stage transition (500 times and 1000 times,
respectively). For spinosad, nitenpyram and diazinon,
third instar larvae were exposed to a concentration that
exceeded LC99. However, in the 4-h exposure period there
was no significant mortality.
Four-day-old adult males were exposed to nitenpyram
and DDT via direct contact for 4 h, at a concentration that
would be lethal after 12 h of exposure. For adult exposures,
males of the y; cn bw sp strain were collected within a 24 h
window after emergence, sorted into groups of 50 males
and then stored at 25 1C for 4 days. Contact exposure was
conducted, whereby the relevant amount of each com-
pound was added to 150 ml of acetone and immediately
transferred to a 30 ml scintillation vial, which was then
rolled until the acetone had evaporated. A total of 1 M PB
(Sigma) solution (dissolved in dH
2
O), 10 ml for microarray
analysis or 2 ml for timecourse was used for each vial; the
dose used for microarray analysis was lethal over 24 h, so a
lower dose was used for time-course analysis. A total of
10 mg DDT (Sigma) (dissolved in acetone) and 10 ml 1 mM
Nitenpyram (Novartis) (dissolved in dH
2
O) were applied to
each vial. A total of 50 males were transferred into each
scintillation vial, which were then sealed with cotton wool
dampened with dH
2
O. After the appropriate time period
(1–24 h for the time-course experiment, or 4 h for all
microarray experiments), the flies were frozen in liquid
nitrogen and stored at 80 1C until RNA extraction.
ARTICLE IN PRESS
L. Willoughby et al. / Insect Biochemistry and Molecular Biology 36 (2006) 934–942
935

For larval exposures, adults of the y; cn bw sp strain were
allowed to lay eggs for a 6 h period on Petri dishes
containing standard fly food with 2 agar. Petri dishes
were then collected and incubated at 25 1C. Larvae were
allowed to develop on the original Petri dishes until they
were to be exposed, so that all larvae would be 4.5 days old
when frozen after exposure. Fresh Petri dishes containing
standard fly food with 2 agar were prepared for
exposure, containing either the compound or the appro-
priate control. A final concentration of 10 mM PB (Sigma)
for microarray analysis or 1 mM PB for timecourse
analysis was used; the dose used for microarray analysis
was lethal over 24 h, so a lower dose was used for time-
course analysis. Final concentrations of 6 ppm nitenpyram
(Novartis), 6.7 10
2
% dicyclanil (Novartis), 20 ppm
lufenruon (Novartis), 1.3 10
2
% diazinon (Coopers
Dijet), 6 10
5
% spinosad (Success—Dow Agrosciences)
and 1.5 mg/ml caffeine (Sigma) were also used. 50 larvae
were transferred to each Petri dish. After the appropriate
time period (1–24 h for the time-course experiment, or 4 h
for all microarray experiments), the larvae were frozen in
liquid nitrogen and stored at 80 1C until RNA extraction.
2.3. Isolation of RNA and real-time PCR
RNA was extracted from pooled fly samples using Trizol
reagent (Invitrogen). RQ1 DNase (Promega) treatment
was performed and then an additional round of Trizol
extraction was performed. Reverse transcription using 5 mg
of total RNA was conducted with the Superscipt first
strand synthesis kit (Invitrogen). Quantitative real-time
analysis was performed using SYBR green kit (QIAGEN)
on a Rotor Gene-3000 real-time PCR machine (Corbett).
Dilutions of the exposed cDNA sample (1 , 1/10 and
1/50 ) and 1 of the unexposed sample were set up.
Real-time PCR primers; Cyp6a2 AAACGGTGCTGGAG-
GAAC and TTATGACCTGTGTGCCCTTC; Cyp6a8
GGCTGAGGTGGAGGAGGT and CGATGACGAAG-
TTTGGATGA; Cyp6a9 CCCAGCATCAGGACATTCA
and GCTCCACACGGAATCAAAC; Cyp6a21 CATG-
GATTCGCACTGTATG and CGGGAGAACGGTGTA-
CAATC; Cyp12d1 AGGAACACAAGTAAAGGCCAC
and GTCCATTCAAGACCATGTTCC; GstD2 TGTC-
CACTGTCTCCACGTTC and GGAGTCACCTTCTT-
GGCATT; GstD7 TGGCTGATATCGTCATCCTG and
GCATTCTTAAGCCACCTCTCC; RpL11 CGATCCCT-
CCATCGGTATCT and AACCACTTCATGGCATCC-
TC. Real-time PCR validation of microarray results was
conducted on additional biological replicates.
2.4. Microarray generation
A cDNA microarray containing fragments of 186 D.
melanogaster genes was constructed, including 89 P450s, 37
GSTs and 32 esterases. Each cloned DNA fragment was
then amplified by PCR using the T7 and M13rev primers
using Amplitaq Gold (ABI). In addition to the control
genes, additional series of control spots were included;
PCR products from all of the control genes were pooled
and then a 9-point dilution series of this sample was printed
(250, 125, 60, 30, 15, 7, 4, 2, 1 ng/ml). Plasmids were
extracted from the LD cDNA library (BDGP;
) and digested using either AluI or BstUI
restriction enzymes (Promega). Digests were pooled and a
dilution series was printed in the same manner as described
for the pooled PCR products. The Lucidea Universal
scorecard (Amersham) was included to aid in evaluating
the quality of the experiments. Slides were printed by the
Australian Genome Research Facility (AGRF;
) on GAPS II (Corning) slides. Each unique feature
(not the control dilution series) was duplicated 4 times in a
four printing block arrangement. Full details of the slide
are available from the Gene Expression Omnibus (GEO):
GPL4239 (
).
2.5. Microarray procedure
Dye-swap microarrays were conducted for each experi-
mental condition, resulting in 16 individual data points for
each gene. Total RNA was extracted from pooled fly
samples (400 flies per condition) using Trizol reagent
(Invitrogen). RNA was purified using RNeasy minikit
(QIAGEN) and concentrated using NaOAc precipitation.
Lucidea Universal scorecard RNA (Amersham) was added
to 60 mg RNA and labeled with either Cy3-dCTP or Cy5-
dCTP (Amersham) using Superscript RT II (Invitrogen).
Hybridization mixture, including labeled cDNA, was
added to the microarray and hybridized for 20 h at 68 1C.
After hybridization, the slides were washed, and were then
imaged using a Genepix 4000B microarray scanner; image
analysis was conducted using the manufacturer’s software.
Data analysis was conducted with LimmaGUI (
), a graphical interface for
Limma (
). Data was normalized
with the print-tip loess method and genes were considered
differentially expressed if they had P-values
o0.05 after
multiple comparison correction (Holm correction) and
were greater than 2-fold up or down regulated. A more in
depth description of the experimental approaches used for
the microarray analyses presented in this paper is available
from GEO (
): GPL4239 and
GSE5713.
2.6. In situ hybridizations
Cyp12d1 (Primers: AAAAGGAGATCTATGAATA-
CATTGAGCAGTG and AAATGAGCGGCCGCTTA-
TTGTTCGTATCCGTGAATTTG) and GstD2 (Primers:
CAGGCGTAGTTCAGCACTCA and AGTGTGCTT-
CTCCCCTAACA) were amplified by PCR using Taq
DNA polymerase (Promega) and cloned into pGEM-T
Easy (Promega) in both orientations with respect to the
T7 polmerase annealing site. The sense and antisense
constructs were then linearised with SalI (Promega),
ARTICLE IN PRESS
L. Willoughby et al. / Insect Biochemistry and Molecular Biology 36 (2006) 934–942
936

transcribed with Megascript T7 polymerase (Ambion), and
labeled with digoxigenin-labeled dNTP mix (Roche). In
situ hybridizations were performed on dissected third-
instar larvae using standard techniques (
3. Results
3.1. Phenobarbital induction time course
To identify the best conditions under which to measure
gene induction, a PB exposure time course was conducted
in both third instar larvae and adult males of the y; cn bw
sp strain. PB is known to induce the expression of
numerous P450s in mammals (
;
),
is documented to induce the P450s Cyp6a2 and Cyp6a8 in
D. melanogaster (
;
),
and has recently been shown to induce several other P450s
in D. melanogaster (
). Third instar larvae and 4-day old
adult males, were exposed to PB via food source, and
contact exposure, respectively. For each time point over a
24 h period changes in mRNA levels of Cyp6a2 and
Cyp6a8 were quantified using real-time PCR. In both third
instar larvae and adult males, Cyp6a2 and Cyp6a8 showed
a biphasic PB induction response (
). The observation
of biphasic induction was replicated using Act42A as the
housekeeping control gene (data not shown). This type of
response has not been reported in previous studies of PB
induction in insects, possibly due to the sensitivity of
techniques or experimental design (
) but has been previously described for
Cyp1a6 and Cyp1a1 in response to 3-methylcholanthrene
in eels (
). It is possible that genes
responding to PB treatment metabolize, or sequester PB,
temporarily lowering the level of PB within the organism,
thus decreasing the fold induction. As an initial induction
peak for both Cyp6a2 and Cyp6a8 was detected after 4 h of
exposure to PB, 4 h exposure was used to characterize gene
induction for the entire P450, GST and esterase families in
the subsequent microarray experiments.
3.2. Phenobarbital microarray analysis
After a 4 h exposure to PB, changes in P450, GST and
esterase gene expression for both larvae and adults were
determined using microarray analysis. Larval treatment
with PB did not result in changes in the mRNA level of any
of the 32 esterase genes. In contrast, 9 of 37 GST genes and
21 of 89 P450 genes were induced by PB (
). Similar
results were obtained after PB exposure in adult males,
with no esterase genes, 6 GSTs and 10 P450 genes induced
(
). Considerable overlap in the PB induction
response between third instar larvae and adult males was
detected, with many of the same genes being induced; 10
P450 and 4 GST genes were induced in both adults and
larvae. Microarray results can be seen in full at GEO:
GSE5713 (
http://www.ncbi.nlm.nih.gov/geo
). Quantitative
real-time PCR on biological replicates for a selection of
ARTICLE IN PRESS
0
3
6
9
12
15
0
4
8
12
16
20
24
Cyp6a8 larvae
0
5
10
15
20
25
30
0
4
8
12
16
20
24
0
3
6
9
12
15
0
4
8
12
16
20
24
0
5
10
15
20
25
30
0
4
8
12
16
20
24
Time (hours)
Time (hours)
Time (hours)
Time (hours)
Fold Induction
Fold Induction
Cyp6a2 adult
Cyp6a8 adult
Cyp6a2 larvae
(A)
(B)
(C)
(D)
Fig. 1. Fold induction over time in response to PB exposure. Transcriptional response when larvae are exposed to PB, for Cyp6a2 (A) and for Cyp6a8 (B)
and response when adult males are exposed to PB, for Cyp6a2 (C) and for Cyp6a8 (D), measured at 1 h after commencement of exposure, every hour until
20 h and then again at 24 h. Expression levels determined with quantitative real-time PCR. The fold change at each time point is relative to a similarly
handled unexposed sample.
L. Willoughby et al. / Insect Biochemistry and Molecular Biology 36 (2006) 934–942
937

differentially expressed genes was successful in confirming
the microarray results (
).
3.3. Caffeine microarray analysis
Third instar larvae were exposed to caffeine via the food
source, with changes in P450, GST and esterase gene
expression then determined using microarray analysis.
Larval treatment with caffeine did not result in the changes
in mRNA level of any of the 32 esterase genes. However, 5
of 37 GST and 11 of 89 P450 genes were induced by
caffeine, microarray results can be seen in full at GEO:
GSE5713 (
http://www.ncbi.nlm.nih.gov/geo
), with results
confirmed by quantitative real-time PCR on biological
replicates (
). The genes induced in response to
caffeine consist of a similar gene set to those induced
by PB.
3.4. Tissue specificity of induction
The tissue specificity of the PB induction response for
Cyp12d1 and GSTD2 was investigated in third instar larvae
using in situ hybridization. Microarray experiments in
whole larvae show Cyp12d1 and GstD2 to be induced 29
fold and 21 fold, respectively, in response to PB, and 10
fold and 1 fold, respectively, in response to caffeine.
Expression of Cyp12d1 is visible throughout the midgut, in
the Malpighian tubules, the fat body and gastric caecae in
unexposed controls (
). After exposure to both
caffeine and PB expression is clearly increased in these
same tissues (
, respectively). Expression of
GstD2 is visible in regions of the midgut, the gastric caecae,
Malpighian tubules, ureters and hindgut in unexposed
ARTICLE IN PRESS
Table 1
Genes differentially expressed in larvae after exposure for 4 h to 10 mM
phenobarbital, with correction for multiple comparisons
Gene
Fold
P-value
Real time
Cytochrome P450
Cyp12d1
30.9
4.39 10
8
31.7
Cyp4ae1
19.0
2.12 10
5
Cyp6a21
18.6
5.23 10
6
15.7
Cyp4d14
17.4
5.28 10
6
Cyp6w1
15.7
1.75 10
5
Cyp6a9
14.8
5.25 10
7
13.1
Cyp6a2
13.5
3.73 10
4
28.3
Cyp6d5
11.9
3.74 10
4
Cyp28a5
11.5
7.94 10
8
Cyp12c1
9.4
1.66 10
4
Cyp6d4
9.2
1.69 10
5
Cyp4e2
7.4
1.33 10
5
Cyp4p1
6.7
1.20 10
5
Cyp6a8
5.7
4.08 10
2
9.5
Cyp9b1
5.2
4.24 10
4
Cyp12b2
4.9
1.19 10
4
Cyp4e3
4.9
6.12 10
4
Cyp6g1
4.6
3.23 10
2
Cyp9b2
3.6
2.96 10
2
Cyp6a23
3.4
3.44 10
4
Cyp12a5
3.0
3.84 10
4
Glutathione-S-transferase
GstD2
21.7
3.63 10
8
32.3
GstD7
15.7
2.35 10
4
25.7
CG17524
10.3
1.36 10-
5
GstD5
7.5
2.03 10
5
CG6776
4.6
7.44 10
5
CG1681
3.8
2.61 10
3
GstD6
3.6
2.72 10
5
GstD4
3.5
2.55 10
4
GstD10
2.3
2.94 10
3
Table 2
Genes differentially expressed in adult males after contact exposure for 4 h
to 10 ml 1 M phenobarbital, with correction for multiple comparisons
Gene
Fold
P-value
Real time
Cytochrome P450
Cyp4ae1
21.8
1.04 10
2
Cyp6a8
21.5
3.97 10
3
21.2
Cyp12d1
16.2
2.89 10
2
15.4
Cyp6a2
15.6
8.68 10
3
21.6
Cyp6a21
12.4
3.92 10
2
17.3
Cyp6w1
9.8
2.94 10
2
Cyp6d5
8.1
7.89 10
2
Cyp4e2
3.9
4.84 10
2
Cyp4p1
3.2
1.95 10
2
Cyp6g1
2.6
1.16 10
2
Glutathione-S-transferase
GstD2
16.9
2.60 10
2
20.8
CG17524
8.6
7.13 10
2
GstD1
3.7
1.76 10
2
GstD5
3.4
4.36 10
4
GstE1
2.6
1.72 10
2
GstE8
2.0
4.19 10
2
Table 3
Genes differentially expressed in larvae after exposure for 4 h to 1.5 mg/ml
caffeine, with correction for multiple comparisons
Gene
Fold
P-value
Real time
Cytochrome P450
Cyp6w1
12.6
1.09 10
6
Cyp12d1
11.4
5.11 10
4
15.7
Cyp6a8
10.9
2.57 10
5
14.6
Cyp6d5
10.6
8.27 10
4
Cyp6a21
4.4
1.20 10
4
6.3
Cyp4e2
3.8
1.88 10
4
Cyp4ae1
3.3
4.08 10
4
Cyp6a2
2.9
1.46 10
2
Cyp6g1
2.5
1.73 10
2
2.5
Cyp6d4
2.5
3.59 10
5
Cyp4d14
2.3
7.28 10
3
Glutathione-S-transferase
CG17524
6.3
3.33 10
5
CG6662
3.3
8.72 10
4
GstE1
2.9
2.71 10
4
GstD7
2.1
4.27 10
4
1.9
GstD2
2.1
3.54 10
3
2.2
L. Willoughby et al. / Insect Biochemistry and Molecular Biology 36 (2006) 934–942
938
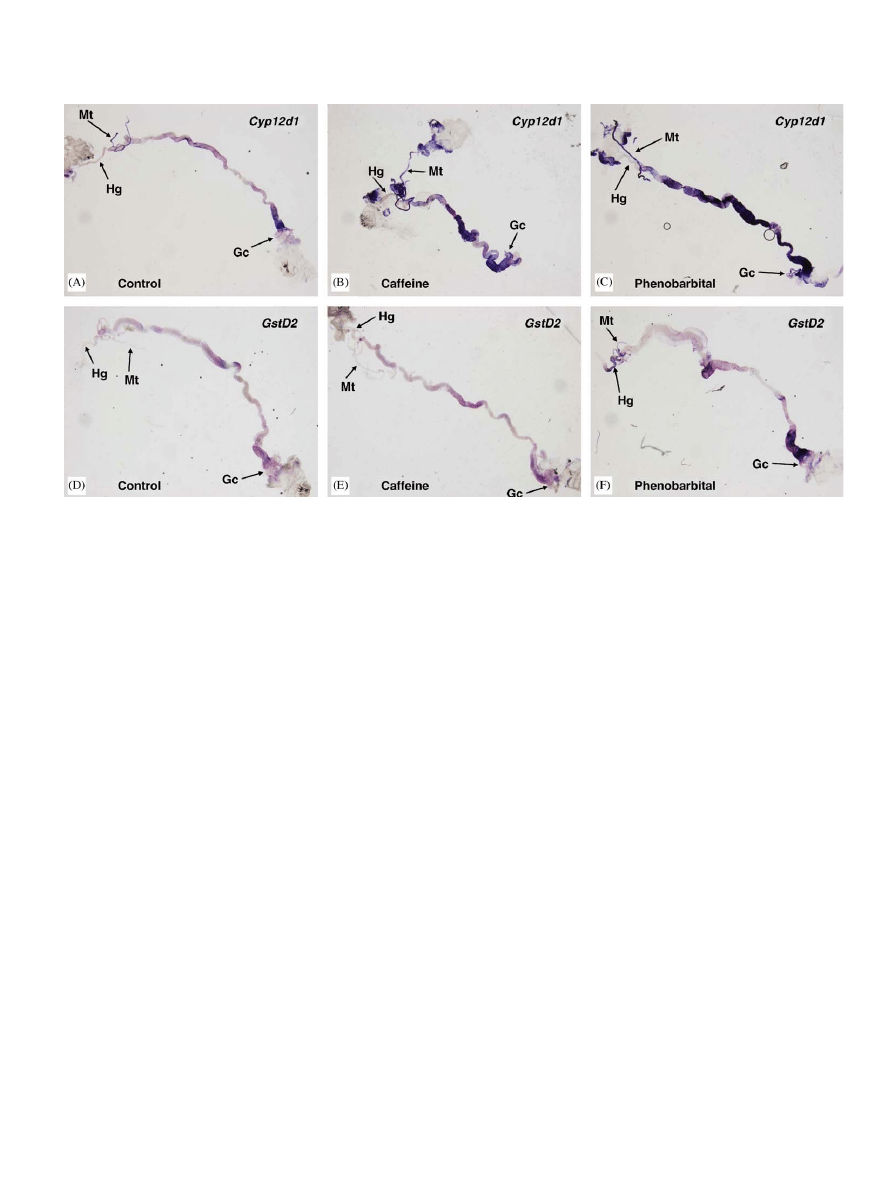
larvae (
). After exposure to caffeine expression is
not noticeably increased (
). However, after PB
exposure expression is clearly increased in these tissues
(
). Induction by both PB and caffeine appears to be
restricted to the tissues in which Cyp12d1 and GstD2 are
normally expressed.
3.5. Induction response to insecticides
The induction response to six different insecticides was
investigated. Gene induction responses to lufenuron,
dicyclanil, spinosad, nitenpyram and diazinon were in-
vestigated in 3rd instar larvae, while induction responses to
DDT and nitenpyram were investigated in adults. Of the
six insecticides tested, the only one to exhibit a gene
induction response was DDT. All other insecticides did not
induce the expression of any P450s, GSTs or esterases.
Exposure to DDT induced 1 of 37 GST genes (GstD2 at 2
fold, P ¼ 1:6 10
4
) and 1 of 89 P450 genes (Cyp12d1 at 3
fold, P ¼ 1:2 10
4
). No members of the esterase gene
family were induced in response to DDT exposure. The
two genes induced in response to DDT are also induced by
PB and caffeine, and at a much higher level. Microarray
results can be seen in full at GEO: GSE5713 (
).
4. Discussion
Detoxification pathways have evolved to aid in the
metabolism of potentially toxic chemical compounds an
organism may encounter in its environment. In many
biological systems, substrates of these pathways induce the
expression of the metabolic enzymes involved in their
metabolism (
;
). We investigated
the response of D. melanogaster to six chemically distinct
insecticides to determine if insecticides induce detoxifica-
tion enzymes, as it is known that detoxification enzymes
are capable of metabolizing insecticides.
Our results demonstrate that, with the exception of
DDT, the insecticides tested using our exposure regime do
not induce the expression of P450, GST or esterase genes,
even though members of these gene families have
important roles in insecticide resistance and metabolism
in D. melanogaster. The overexpression of Cyp12a4 results
in lufenuron resistance (
), and the
overexpression of Cyp6g1 confers lufenuron, nitenpyram,
DDT and dicyclanil resistance (
(Daborn
et
al.,
unpublished
results).
Additionally,
CYP6A2 and GSTD1 are capable of metabolizing DDT
(
;
) when expressed
in heterologous systems.
The one insecticide to which we observed an induction
response was DDT, with the induction of a single P450
(Cyp12d1, 3 fold) and a single GST (GstD2, 2 fold). This
induction is very weak compared with the response to PB
and caffeine in terms of the number of genes and fold
induction. Again, here there is no significant relationship
between
induction,
metabolism
and
resistance.
The
ARTICLE IN PRESS
Fig. 2. In situ hybridization of dissected third instar Drosophila melanogaster larvae. Untreated larvae, probed for Cyp12d1 expression pattern (A) and
GstD2 expression pattern (D). Caffeine treated larvae, probed for Cyp12d1 (B) and GstD2 (E). PB treated larvae, probed for Cyp12d1 (C) and GstD2 (F).
The hindgut (Hg), Malpighian tubules (Mt) and gastric caecae (Gc) are labeled. The ureters are is located at the point where the Malpighian tubules
converge. The midgut is located between the ureter and the gastric caecae.
L. Willoughby et al. / Insect Biochemistry and Molecular Biology 36 (2006) 934–942
939

Cyp6g1, Cyp6a2 and GstD1 genes that have been
implicated in DDT resistance or metabolism (
;
) are not
inducible by DDT in our experiments. Of the genes that are
induced by DDT, in vivo assays show that purified GstD2
has no detectable DDT-dehydrochlorinase activity (
), whilst the involvement of Cyp12d1 in DDT
resistance is uncertain. Cyp12d1 is found to be over-
expressed in one DDT resistant strain that also over-
expresses Cyp6g1 (
;
In summary, our results suggest that induction is not a
valid approach for determining which P450 and GST gene
family members are capable of insecticide detoxification,
since in the vast majority of cases no induction responses
are observed. When induction responses are observed, the
genes induced are different to the genes involved in
insecticide detoxification. This study has focused on a
single species, D. melanogaster, where the availability of a
whole genome sequence has allowed all of the P450, GST
and esterase genes to be analysed. There is no reason to
suspect that we are observing a strain or species-specific
phenomenon, however this possibility remains. It has been
observed that induction responses can be lower in
insecticide resistant strains, for example PB induction of
Cyp6a2 is lower in a DDT resistant strain in comparison to
a wildtype strain (
This could reflect the nature of the mutation causing
constitutive over-expression of Cyp6a2 in the DDT-
resistant strain.
In stark contrast to the lack of induction observed in
response to insecticides, 16 genes were induced in larvae
responding to caffeine (
). Fourteen of these genes
were also induced in response to PB. Cyp12d1 stands out as
a gene that is induced by a broad spectrum of compounds
including PB (
; this study), caffeine (this study), DDT (this
study), pyrethrum and piperamides (
and the herbicide atrazine (
). Gene
induction after exposure to both PB and caffeine has also
been investigated in human cell culture where both
compounds induce detoxification gene family members
(
). Most signifi-
cantly, the induction responses to caffeine and PB are
regulated by separate receptors. PB mediated induction
occurs through the PXR/CAR xenobiotic responsive
nuclear receptors (
). The induction
response to caffeine occurs through a completely distinct
xenobiotic detecting receptor, a member of the bHLH-PAS
receptor superfamily, the AhR (
Using our data we are unable to reach any solid
conclusions on what is occurring in Drosophila. However,
our results suggest that in insects either two distinct
receptors have evolved the ability to regulate a very similar
set of genes, or that compounds binding to two receptors in
mammals only bind to one receptor in D. melanogaster. If
more than one receptor pathway exists to regulate similar
sets of genes, then these genes may be highly important for
the interaction between D. melanogaster and its environ-
ment. Recently, DHR96, the Drosophila orthologue of the
mammalian PXR and CAR xenobiotic receptors, has been
shown to play a role in the induction response to PB (
). The role of DHR96 in P450 induction
by caffeine has not been investigated.
The tissue specificity of the caffeine and PB induction
responses were investigated for two induced genes,
Cyp12d1 and GstD2. Basal expression and induction was
detected in the key metabolic tissues, namely sections of the
midgut, and the Malpighian tubules (
). Notably there
were differences in the basal expression patterns of these
two genes but in each case induction was limited to the
tissues where basal expression was observed. Therefore, PB
and caffeine both induced Cyp12d1 with the same tissue
specificity and they both induced GstD2 with the same
tissue specificity, however, these induction patterns differed
between GstD2 and Cyp12d1. In this instance, the cis-
regulatory elements controlling the expression of these two
genes may not be acting independently; the induction
module may be acting solely to increase the transcriptional
output of the tissue-specific modules.
Our data highlight the unpredictability of detoxification
gene induction. The mammalian receptors regulating
detoxification gene induction have very diverse ligand
structures, so it is difficult to define similarities between
inducers. However, large steroid molecules or small
lipophilic molecules or molecules containing aromatic rings
have been shown to be strong inducers (
;
). While the insecticides tested here are
not inducers at biologically relevant concentrations it is
possible that insecticides that have not been tested may be
strong inducers.
It is tempting to contrast the lack of induction observed
in response to the insecticides we tested, to other toxins
that do induce insect metabolic genes. In particular, a
range of insecticidal plant secondary metabolites induce the
transcription of P450 genes in a variety of insect species
(
;
). These induction responses have
possibly evolved to cope with the challenge posed by these
metabolites. At present, however, we are far from under-
standing exactly what it is that triggers an induction
response, making such comparisons between compounds
premature. In terms of insecticides, constitutive changes in
the transcription of metabolic genes have been the
predominant evolutionary response to insecticide exposure
(
;
;
;
). In managing field
resistance to insecticides this constitutive transcriptional
regulation needs to be understood. Induction by insecti-
cides will not provide a fast track to identify the metabolic
genes with the capacity to confer resistance. A better
understanding of the substrate specificity of the individual
detoxification enzymes is required.
ARTICLE IN PRESS
L. Willoughby et al. / Insect Biochemistry and Molecular Biology 36 (2006) 934–942
940

Acknowledgments
We thank Rene´ Feyereisen for providing cytochrome
P450 clones for the microarray. This work is supported by
grants from The Australian Research Council (ARC)
through its funding of the Special Research Centre CESAR
(Centre for Environmental Stress and Adaptation Re-
search), and an ARC APD-CSIRO linkage fellowship
to PJD.
References
Adams, M.D., Celniker, S.E., Holt, R.A., Evans, C.A., Gocayne, J.D.,
Amanatides, P.G., Scherer, S.E., Li, P.W., Hoskins, R.A., Galle, R.F.,
George, R.A., 2000. The genome sequence of Drosophila melanogaster.
Science 287, 2185–2195.
Amichot, M., Brun, A., Cuany, A., De Souza, G., Le Mouel, T., Bride,
J.M., Babault, M., Salaun, J.P., Rahmani, R., Berge, J.B., 1998.
Induction of cytochrome P450 activities in Drosophila melanogaster
strains susceptible or resistant to insecticides. Comp. Biochem. Physiol.
C—Pharmacol. Toxicol. Endocrinol. 121 (1–3), 311–319.
Amichot, A., Tares, S., Brun-Barale, A., Arthaud, L., Bride, J.M., Berge,
J.B., 2004. Point mutations associated with insecticide resistance in the
Drosophila cytochrome P450 Cyp6a2 enable DDT metabolism. Eur. J.
Biochem. 271, 1250–1257.
Berge, J.B., Feyereisen, R., Amichot, M., 1998. Cytochrome P450
monooxygenases and insecticide resistance in insects. Philos. Trans.
R. Soc. London B 353, 1701–1705.
Bogwitz, M.R., Chung, H., Magoc, L., Rigby, S., Wong, W., O’Keefe, M.,
McKenzie, J.A., Batterham, P., Daborn, P.J., 2005. Cyp12a4 confers
lufenuron resistance in a natural population of Drosophila melanoga-
ster. PNAS 102 (36), 12807–12812.
Brandt, A., Scharf, M.E., Pedra, J.H.F., Holmes, G., Dean, A., Kreitman,
M., Pittendrigh, B.R., 2002. Differential expression and induction of
two Drosophila cytochrome P450 genes near the Rst(2)DDT locus.
Insect Mol. Biol. 11, 337–341.
Brun, A., Cuany, A., Le Mouel, T., Berge, J., Amichot, M., 1996.
Inducibility of the Drosophila melanogaster cytochrome P450 gene,
CYP6A2, by phenobarbital in insecticide susceptible or resistant
strains. Insect Biochem. Mol. Biol. 26 (7), 697–703.
Carino, F.A., Koener, J.F., Plapp, F.W.J., Feyereisen, R., 1992.
Expression of the cytochrome P450 gene Cyp6A1 in the house fly,
Musca domestica. ACS Symp. Ser. 505, 31–40.
Chen, J., Raymond, K., 2006. Roles of rifampicin in drug–drug
interactions: underlying molecular mechanisms involved the nuclear
pregnane X receptor. Ann. Clin. Microbiol. Antimicrob. 15, 3.
Cohen, M.B., Schuler, M.A., Berenbaum, M.R., 1992. A host-inducible
cytochrome P450 from a host-specific caterpillar: molecular cloning
and evolution. PNAS 89, 10920–10924.
Coleman, M., Vontas, J.G., Hemingway, J., 2002. Molecular character-
ization of the amplified aldehyde oxidase from insecticide resistant
Culex quinquefasciatus. Eur. J. Biochem. 269, 768–779.
Daborn, P.J., Yen, J.L., Bogwitz, M.R., Le Goff, G., Feil, E., Jeffers, S.,
Tijet, N., Perry, T., Heckel, D., Batterham, P., Feyereisen, R., Wilson,
T.G., ffrench-Constant, R.H., 2002. A single P450 allele associated
with insecticide resistance in Drosophila. Science 297, 2253–2256.
Danielson, P.B., MacIntyre, R.J., Fogleman, J.C., 1997. Molecular
cloning of a family of xenobiotic-inducible drosophilid cytochrome
P450s: evidence for involvement in host–plant allelochemical resis-
tance. PNAS 94, 10797–10802.
Denison, M.S., Nagy, S.R., 2003. Activation of the aryl hydrocarbon
receptor by structurally diverse exogenous and endogenous chemicals.
Annu. Rev. Pharmacol. Toxicol. 43, 309–334.
Dunkov, B.C., Guzov, V.M., Mocelin, G., Shotkoski, F., Brun, A.,
Amichot, M., ffrench-Constant, R.H., Feyereisen, R., 1997. The
Drosophila cytochrome P450 gene Cyp6a2: structure, localization,
heterologous expression, and induction by phenobarbital. DNA Cell
Biol. 16 (11), 1345–1356.
Ellinger-Ziegelbauer, H., Stuart, B., Wahle, B., Bomann, W., Ahr, H.J.,
2005. Comparison of the expression profiles induced by genotoxic and
nongenotoxic carcinogens in the rat liver. Mutat. Res. 575, 61–84.
Field, L.M., Devonshire, A.L., Forde, B.G., 1988. Molecular evidence
that insecticide resistance in peach–potato aphids (Myzus persicae
Sulz.) results from amplification of an esterase gene. Biochem. J. 251,
309–312.
Field, L.M., Blackman, R.L., Tyler-Smith, C., Devonshire, A.L., 1999.
Relationship between amount of esterase and gene copy number in
insecticide-resistant Myzus persicae (Sulzer). Biochem. J. 339, 737–742.
Goadstuff, T., Dreano, Y., Guillos, B., Menez, J.-F., Berthou, F., 1996.
Induction of liver and kidney CYP1A1/CYP1A2 by caffeine in rat.
Biochem. Pharmcol. 52, 1915–1919.
Goodwin, B., Redinbo, M.R., Kliewer, S.A., 2002. Regulation of CYP3A
gene transcription by the pregnane X receptor. Annu. Rev. Pharm.
Toxicol. 42, 1–23.
Honkakoski, P., Zelko, I., Sueyoshi, T., Negishi, M., 1998. The nuclear
orphan receptor CAR-retinoid X receptor heterodimer activates the
phenobarbital-responsive enhancer module of the CYP2B gene. Mol.
Cell Biol. 18, 5652–5658.
Hung, C.-F., Harrison, T.L., Berenbaum, M.R., Schuler, M.A., 1995.
CYP6B3: a second furanocoumarin-inducible cytochrome P450
expressed in Papilio polyxenes. Insect Mol. Biol. 4, 149–160.
Jensen, H.R., Scott, I.M., Sims, S., Trudeau, V.L., Arnason, J.T., 2006.
Gene expression profiles of Drosophila melanogaster exposed to an
insecticidal extract of Piper nigrum. J. Agric. Food Chem. 54,
1289–1295.
King-Jones, K., Horner, M.A., Lam, G., Thummel, C.S., 2006. The
DHR96 nuclear receptor regulates xenobiotic responses in Drosophila.
Cell Metab. 4 (1), 37–48.
Kodama, S., Negishi, M., 2006. Phenobarbital confers its diverse effects
by activating the orphan nuclear receptor car. Drug Metab. Rev. 38
(1–2), 75–87.
Le Goff, G., Boundy, S., Daborn, P.J., Yen, J.L., Sofer, L., Lind, R.,
Sabourault, C., Madi-Ravazzi, L., ffrench-Constant, R.H., 2003.
Microarray analysis of cytochrome P450 mediated insecticide resis-
tance in Drosophila. Insect Biochem. Mol. Biol. 33 (7), 701–708.
Le Goff, G., Hilliou, F., Siegfried, B.D., Boundy, S., Wajnberg, E., Sofer,
L., Audant, P., ffrench-Constant, R.H., Feyereisen, R., 2006.
Xenobiotic response in Drosophila melanogaster: sex dependence of
P450 and GST gene induction. Insect Biochem. Mol. Biol. 36 (8),
674–682.
Li, X., Baudry, J., Berenbaum, M.R., Schuler, M.A., 2003. Structural and
functional divergence of insect CYP6B proteins: from specialist to
generalist cytochrome P450. PNAS 101, 2939–2944.
Luo, G., Guenthner, T., Gan, L.S., Humphreys, W.G., 2004. CYP3A4
induction by xenobiotics: biochemistry, experimental methods and
impact on drug discovery and development. Curr. Drug Metab. 5,
483–505.
Maitra, S., Dombrowski, S.M., Waters, L.C., Ganguly, R., 1996. Three
second chromosome-linked clustered Cyp6 genes show differential
constitutive and barbital-induced expression in DDT-resistant and
susceptible strains of Drosophila melanogaster. Gene 180 (1–2),
165–171.
Meyer, U.A., Hoffmann, K., 1999. Phenobarbital-mediated changes in
gene expression in the liver. Drug Metab. Rev. 31 (2), 365–373.
Newcomb, R.D., Campbell, P.M., Ollis, D.L., Cheah, E., Russell, R.J.,
Oakeshott, J.G., 1997. A single amino acid substitution converts a
carboxylesterase to an organophosphorous hydrolase and confers
insecticide resistance on a blowfly. Proc. Natl. Acad. Sci. USA 94,
7464–7468.
Ogino, Y., Itakura, T., Mitsuo, R., Sato, M., 1998. Induction of two forms
of eel cytochrome P450 1A genes by 3-methylcholanthrene. Mar.
Biotechnol. 1, 342–345.
Ortelli, F., Rossiter, L.C., Vontas, J., Ranson, H., Hemingway, J., 2003.
Heterologous expression of four glutathione transferase genes
ARTICLE IN PRESS
L. Willoughby et al. / Insect Biochemistry and Molecular Biology 36 (2006) 934–942
941

genetically linked to a major insecticide-resistance locus from the
malaria vector Anopheles gambiae. Biochem. J. 373, 957–963.
Petersen, R.A., Zangerl, A.R., Berenbaum, M.R., Schuler, M.A., 2001.
Expression of CYP6B1 and CYP6B3 cytochrome P450 monoxy-
genases and furanocoumarin metabolism in different tissues of Papiloi
polyxenes (Lepidoptera: Papilionidae). Insect Biochem. Mol. Biol. 31,
679–690.
Ranson, H., Rossiter, L.C., Ortelli, F., Jensen, B., Wang, X., Roth, C.W.,
Collins, F.H., Hemingway, J., 2001. Identification of a novel class of
insect glutathione S-transferases involved in resistance to DDT in the
malaria vector Anopheles gambiae. Biochem. J. 359, 295–304.
Sasabe, M., Wen, Z., Berenbaum, M.R., Schuler, M.A., 2004. Molecular
analysis of Cyp312a1, a novel cytochrome P450 involved in
metabolism of plant allelochemicals (furanocoumarins) and insecti-
cides (cypermethrin) in Helicoverpa zea. Gene 338, 163–175.
Smyth, G.K., Speed, T.P., 2003. Normalization of cDNA microarray
data. Methods 31, 265–273.
Sun, W., Margam, V.M., Sun, L., Buczkowski, G., Bennett, G.W.,
Schemerhorn, B., Muir, W.M., Pittendrigh, B.R., 2006. Genome-wide
analysis of phenobarbital-inducible genes in Drosophila melanogaster.
Insect Mol. Biol. 15 (4), 455–464.
Tang, A.H., Tu, C.D., 1994. Biochemical characterization of Drosophila
glutathione-S-transferases D1 and D21. J. Biol. Chem. 269, 27876–27884.
Tautz, D., Pfeifle, C., 1989. A non-radioactive in situ hybridization
method for the localization of specific RNAs in Drosophila embryos
reveals translational control of the segmentation gene hunchback.
Chromosoma 98, 81–85.
Vontas, J.G., Small, G.J., Nikou, D.C., Ranson, H., Hemingway, J., 2002.
Purification, molecular cloning and heterologous expression of a
glutathione-S-transferase involved in insecticide resistance from the
rice brown planthopper, Nilaparvata lugens. Biochem. J. 362, 329–337.
Waxman, D.J., 1999. P450s gene induction by structurally diverse
xenochemicals: central role of nuclear receptors Car, PXR and PPAR.
Arch. Biochem. Biophys. 369, 11–23.
Wen, Z., Pan, L., Berenbaum, M.R., Schuler, M.A., 2003. Metabolism of
linear and angular furanocoumarins by Papilio polyxenex CYP6B1 co-
expressed with NADPH cytochrome P450 reductase. Insect Biochem.
Mol. Biol. 33, 937–947.
Whitlock Jr., J.P., 1986. The regulation of cytochrome P-450 gene
expression. Annu. Rev. Pharmacol. Toxicol. 26, 333–369.
Whitlock Jr., J.P., 1999. Induction of cytochrome P4501A1. Annu. Rev.
Pharmacol. Toxicol. 39, 103–125.
Wilson, T.G., 2001. Resistance of Drosophila to Toxins. Annu. Rev.
Entomol. 46, 545–571.
Wilson, T.G., 2005. Drosophila: sentinel of environmental toxins. Integr.
Comp. Biol. 45, 127–136.
ARTICLE IN PRESS
L. Willoughby et al. / Insect Biochemistry and Molecular Biology 36 (2006) 934–942
942
Document Outline
- A comparison of Drosophila melanogaster detoxification gene induction responses for six insecticides, caffeine and phenobarbital
Wyszukiwarka
Podobne podstrony:
Induction of two cytochrome P450 genes, Cyp6a2 and Cyp6a8 of Drosophila melanogaster by caffeine
The effects of plant flavonoids on mammalian cells implication for inflammation, heart disease, and
Eurocode 3 Part 1 3 2006 UK NA Design of steel structures General rules Supplementary rules for
Correlates of Sleep and Waking in Drosophila melanogaster
Mapowanie genów na przykładzie Drosophila melanogaster(1)
comparison of PRINCE2 against PMBOK
Comparison of Human Language and Animal Communication
A Comparison of two Poems?out Soldiers Leaving Britain
A Comparison of the Fight Scene in?t 3 of Shakespeare's Pl (2)
Drosophila melanogaster evg
Comparison of the Russians and Bosnians
43 597 609 Comparison of Thermal Fatique Behaviour of Plasma Nitriding
Comparision of vp;atile composition of cooperage oak wood
1 3 16 Comparison of Different Characteristics of Modern Hot Work Tool Steels
Instrukcja do hodowlii Drosophila melanogaster, UG, SEM3, GENETYKA
więcej podobnych podstron