
Replicated triangle and duo–trio tests: Discrimination capacity of assessors
evaluated by Bayes’ rule
S. Bayarri, I. Carbonell, L. Izquierdo
*
, A. Tárrega
Instituto de Agroquímica y Tecnología de Alimentos, CSIC, P.O. Box 73, 46100 Burjassot (Valencia), Spain
a r t i c l e
i n f o
Article history:
Received 5 September 2007
Received in revised form 21 February 2008
Accepted 23 February 2008
Available online 4 March 2008
Keywords:
Replicated difference tests
Bayesian inference
a b s t r a c t
Discrimination rates of panellists performing replicated difference tests are estimated in the present
paper according to Bayes’ rule by considering the successive replications as different steps and using
the posterior distribution obtained in each step as prior distribution of the following step. Data are also
successively obtained in real situations and, thus, this approach imitates what happens in practice and
differs from other published approaches which consider all replications as if they were simultaneously
observed. Before performing the first step, a non informative prior distribution is used as density function
of the discrimination rate but after the first step has been completed each prior distribution (posterior
distribution obtained in the previous step) is informative. The density functions of the discrimination
rates are not proper beta distributions but the sections of beta distributions corresponding to the interval
of the independent variable from 1/3 to 1 in triangle tests and from 1/2 to 1 in duo–trio tests.
Ó 2008 Published by Elsevier Ltd.
1. Introduction
Difference tests are widely used in food analysis and the statis-
tical approaches used to interpret their results have been object of
many papers. We recommend the book from
as an excel-
lent review in this area. The purpose of this paper is to study a very
specific aspect related with discrimination rates of panellists and
with independency among trials performed by a panellist. Thus,
only literature related with these points will be commented. We
refer to the above mentioned book for details that do not directly
affect our objectives.
Under the null hypothesis of no differences between the two
tested products each particular answer to a difference test follows
a Bernoulli distribution with parameter p (probability of success
p
= 1/3 for triangle tests, p = 1/2 for duo–trio tests). Thus, the
results from n trials follow a binomial distribution with parameter
p
. This holds whatever the number of trials a panellist can perform.
But if differences between the tested products exist the interpreta-
tion is not so simple. A way (see comments from
) is to
consider that the probability of success in each answer is a value
higher than p but constant for all answers. This implies the
assumption that all panellists and all replications from a panellist
are interchangeable. Nevertheless, when differences exist between
the products it is not logical to accept that the capability of notic-
ing them is exactly the same for all panellists. It seems more rea-
sonable to accept discrimination rates, h, different among
panellists, ranging in the interval from 0 to 1. Thus, the probability
conditioned to h of success in a single response of a panellist is
h
+ (1 h)p.
A simple approach (see
Meilgaard, Civille, & Carr, 1999
) is to as-
sume that panellists are divided in two groups, one formed by indi-
viduals who distinguish and always succeed in their answers and
another one by non-discriminators that only succeed by chance.
In terms of discrimination rates, h = 1 for all panellists of the first
group and h = 0 for all panellists of the second group. This assump-
tion may be reasonable when the panellists perform a unique test
and the only available result from each panellist is either a single
success or a single failure.
Carbonell, Carbonell, and Izquierdo
applied this criterion to estimate the number of true dis-
criminators according to Bayes’ rule. But when replications from
a panellist are available and successes and failures are observed,
a panellist cannot be classified either as a complete discriminator
or a non-discriminator. It is more rational to accept that the dis-
crimination rate is an unknown value between 0 and 1 to be esti-
mated according with the observed number of successes and
failures.
considered h a constant parameter for each
panellist whereas
considered h a random variable
with a beta distribution.
also assumed a beta distribution
for h and used a Bayesian approach to estimate the probability of
success.
applied a hierarchical
Bayesian approach for the same purpose.
When analysing replicated data from a panellist it is common to
treat the observed results, s successes out of n trials, as if they were
simultaneously obtained, but it is obvious that the results were
obtained step by step and in a given order, for instance a success
0950-3293/$ - see front matter Ó 2008 Published by Elsevier Ltd.
doi:10.1016/j.foodqual.2008.02.008
*
Corresponding author. Tel.: +34 96 3900022; fax: +34 96 3636301.
E-mail address:
(L. Izquierdo).
Food Quality and Preference 19 (2008) 519–523
Contents lists available at
Food Quality and Preference
j o u r n a l h o m e p a g e : w w w . e l s e v i e r . c o m / l o c a t e / f o o d q u a l

after a failure after a success. Bayesian inference performs in a sim-
ilar way, since a prior probability is combined with data obtained
in each step to infer the posterior probability, which, in its turn,
will be used as prior probability for the next step.
The purpose of this paper is to apply this criterion to estimate
the discrimination rate of individual panellists according to the
successive observed successes and failures in a series of difference
tests. The overall discrimination power of the whole panel is then
determined as a function of the individual discrimination rates.
2. Assumptions
2.1. Conditional probabilities of success and of failure
Conditioned to a given discrimination capacity (h) of the panel-
list the probability of success in a trial is, as mentioned above
pðs=hÞ ¼ h þ ð1 hÞp ¼ p þ ð1 pÞh
ð1Þ
where h is the discrimination capacity, considered continuously dis-
tributed in the range from 0 to 1, and p is the probability of success
just by chance, 1/3 for triangle tests and 1/2 for duo–trio tests.
The probability of failure, also conditioned to a given discrimi-
nation capacity of the panellist, is
pðf =hÞ ¼ 1 pðs=hÞ ¼ ð1 pÞð1 hÞ
ð2Þ
The probability of success conditioned to h is always given by
Expression
and, thus,
pðs
1
=
h
Þ ¼ pððs
2
=
s
1
Þ=hÞ ¼ pððs
2
=
f
1
Þ=hÞ ¼ ¼ pðs=hÞ ¼ p þ ð1 pÞh
ð3Þ
where s
1
means success in the first trial, s
2
/s
1
success in the second
trial given success in the first one and so on. In the same way
pðf
1
=
h
Þ ¼ pððf
2
=
s
1
Þ=hÞ ¼ pððf
2
=
f
1
Þ=hÞ ¼ ¼ pðf =hÞ
¼ 1 pðs=hÞ ¼ ð1 pÞð1 hÞ
ð4Þ
2.2. Marginal probabilities of success and of failure
The total probability of success of a panellist in a trial is ob-
tained by integration over all possible values of h from 0 to 1
pðsÞ ¼
Z
1
0
pðs; hÞdh ¼
Z
1
0
pðs=hÞpðhÞdh
ð5Þ
The probability of failure can also be obtained by integration
pðf Þ ¼
Z
1
0
pðf ; hÞdh ¼
Z
1
0
pðf =hÞpðhÞdh ¼
Z
1
0
ð1 pðs=hÞÞpðhÞdh
ð6Þ
or just as
pðf Þ ¼ 1 pðsÞ
ð7Þ
2.3. Tested samples
The discrimination rate of a panellist depends on her/his capa-
bility but also on the real differences between the samples tested.
If both are identical h is obviously 0 and if they are completely dif-
ferent h is 1 or very close to 1. In the theory discussed in this paper
the real differences between the two tested samples is not taken
into account but it is assumed that all panellists test the same sam-
ples in all repeated trials.
3. First trial
3.1. Marginal probabilities of success and of failure
Before the panellist performs the first trial, and if no previous
knowledge about the discrimination rate exists, it is reasonable
to accept a uniform prior distribution of h from 0 to 1 or, in other
words, a constant value for the density function p(h) of the distri-
bution of h.
In these conditions Expression
applied to the first trial
becomes
pðs
1
Þ ¼
Z
1
0
pðs
1
=
h
ÞpðhÞdh ¼ ct
Z
1
0
pðs=hÞdh ¼ ct
Z
1
0
ðp þ ð1 pÞhÞdh
¼ ct
1 þ p
2
since p(h) is a constant value and p(s
1
/h)=p(s/h)=p + (1-p)h (Expres-
sion
In the same way, Expression
becomes
pðf
1
Þ ¼ ct
Z
1
0
ð1 pÞð1 hÞdh ¼ ct
1 p
2
Table 1
Probabilities of success and failure in three successive triangle tests performed by a panellist
First test
Second test
Third test
Success
2/3
Given success in the first test
Success
39/54
Given two previous successes
Success
0.769
Failure
0.231
Failure
15/54
Given a previous success and a previous failure
Success
0.600
Failure
1/3
Given failure in the first test
Success
30/54
Failure
0.400
Failure
24/54
Given two previous failures
Success
0.500
Failure
0.500
a
Assuming a uniform prior distribution of the discrimination capacity of the panellist.
Table 2
Probabilities of success and failure in three successive duo–trio tests performed by a panellist
First test
Second test
Third test
Success
3/4
Given success in the first test
Success
7/9
Given two previous successes
Success
0.804
Failure
0.196
Failure
2/9
Given a previous success and a previous failure
Success
0.687
Failure
1/4
Given failure in the first test
Success
6/9
Failure
0.313
Failure
3/9
Given two previous failures
Success
0.625
Failure
0.375
a
Assuming a uniform prior distribution of the discrimination capacity of the panellist.
520
S. Bayarri et al. / Food Quality and Preference 19 (2008) 519–523

The value of the constant must be 1 to satisfy p(s
1
) + p(f
1
)=1. Thus,
p(s
1
)=(1 + p)/2 and p(f
1
)=(1 p)/2.
lists these probabilities of success and failure for trian-
gle tests and
for duo–trio tests.
3.2. Posterior distributions of the discrimination rate
According to Bayes’ rule the posterior density function of h gi-
ven a success in the first trial is
pðh=s
1
Þ ¼
pðs
1
=
h
ÞpðhÞ
pðs
1
Þ
¼
pðs=hÞ
pðs
1
Þ
¼
p
þ ð1 pÞh
1þp
2
ð8Þ
This is a linear function of h that in triangle tests (p = 1/3) sim-
plifies to 1/2 + h and in duo–trio tests to 2/3(1 + h).
In the same way, given a failure in the first test the posterior
density function of h is
pðh=f
1
Þ ¼
pðf
1
=
h
ÞpðhÞ
pðf
1
Þ
¼
pðf =hÞ
pðf
1
Þ
¼
ð1 pÞð1 hÞ
1p
2
¼ 2ð1 hÞ
ð9Þ
4. Second trial
4.1. Marginal probabilities of success and of failure
In the second test the posterior distribution of h obtained from
the first test, p(h/s
1
) in case of success, p(h/f
1
) in case of failure, is
used as prior distribution. In both cases, success and failure can
be observed. The possibilities are, thus, success after success (s
2
/
s
1
), success after failure (s
2
/f
1
), failure after success(f
2
/s
1
) and fail-
ure after failure (f
2
/f
1
). Adapting Expression
to these cases
pðs
2
=
s
1
Þ ¼
Z
1
0
pððs
2
=
s
1
Þ=hÞpðh=s
1
Þdh
pðs
2
=
f
1
Þ ¼
Z
1
0
pððs
2
=
f
1
Þ=hÞpðh=f
1
Þdh
pðf
2
=
s
1
Þ ¼
Z
1
0
pððf
2
=
s
1
Þ=hÞpðh=s
1
Þdh
pðf
2
=
f
1
Þ ¼
Z
1
0
pððf
2
=
f
1
Þ=hÞpðh=f
1
Þdh
Taking into account that all probabilities of success or failure condi-
tioned to h are, respectively, p(s/h) and 1 p(s/h) and substituting
the posterior density functions of h according to Expressions
pðs
2
=
s
1
Þ ¼
Z
1
0
pðs=hÞ
pðs=hÞ
pðs
1
Þ
dh ¼
1
pðs
1
Þ
Z
1
0
ðpðs=hÞÞ
2
dh
ð10Þ
pðs
2
=
f
1
Þ ¼
Z
1
0
pðs=hÞ
pðf =hÞ
pðf
1
Þ
dh ¼
1
1 pðs
1
Þ
Z
1
0
pðs=hÞð1 pðs=hÞÞdh
pðf
2
=
s
1
Þ ¼
Z
1
0
pðf =hÞ
pðs=hÞ
pðs
1
Þ
dh ¼
1
pðs
1
Þ
Z
1
0
ð1 pðs=hÞÞpðs=hÞdh
pðf
2
=
f
1
Þ ¼
Z
1
0
pðf =hÞ
pðf =hÞ
pðf
1
Þ
dh ¼
1
1 pðs
1
Þ
Z
1
0
ð1 pðs=hÞÞ
2
dh
Substituting p(s
1
) by (1 + p)/2, p(f
1
) by (1 p)/2 and p(s/h) or p(f/h)
according to Expressions
the probabilities obtained are
those shown in
for triangle and duo–trio tests
respectively.
For instance, the probability of success after success is obtained
by
pðs
2
=
s
1
Þ ¼
2
1 þ p
Z
1
0
ðp þ ð1 pÞhÞ
2
dh ¼
2
1 þ p
1 þ p þ p
2
3
As shown in
a success is more probable after a suc-
cess than after a failure (39/54 and 30/54 for triangle,
; 7/9
and 6/9 for duo–trio,
). In the same way a failure is more
probable after a failure than after a success.
4.2. Posterior distributions of the discrimination rate
Applying Expression
, the posterior density function of h gi-
ven a success preceded by a success is
pðh=ðs
2
=
s
1
ÞÞ ¼
pððs
2
=
s
1
Þ=hÞpðh=s
1
Þ
pðs
2
=
s
1
Þ
¼
pðs=hÞpðh=s
1
Þ
pðs
2
=
s
1
Þ
and substituting p(h/s
1
) according to Expression
and p(s
2
/s
1
)
according to
pðh=ðs
2
=
s
1
ÞÞ ¼
pðs=hÞ
1
pðs
1
Þ
pðs=hÞ
1
pðs
1
Þ
R
1
0
ðpðs=hÞÞ
2
dh
¼
ðpðs=hÞÞ
2
R
1
0
ðpðs=hÞÞ
2
dh
In the same way
pðh=ðf
2
=
f
1
ÞÞ ¼
ð1 pðs=hÞÞ
2
R
1
0
ð1 pðs=hÞÞ
2
dh
‘
and
pðh=ðs
2
=
f
1
ÞÞ ¼ pðh=ðf
2
=
s
1
Þ ¼
ð1 pðs=hÞÞpðh=sÞ
R
1
0
ð1 pðs=hÞÞpðh=sÞdh
5. Further trials
For each combination of successes and failures in previous trials
performed by a panellist, success or failure can be observed in the
next trial. In general, 2
n
different series of events (i.e., success, fail-
ure, failure, success. . .) are possible being n the total number of tri-
als and considering different series those that, even when
constituted by the same number of successes (y) and failures
(n y), are present in different orders. Nevertheless, different ser-
ies can have the same probability if the same prior distribution of h
is used to compute them.
5.1. Posterior distribution of the discrimination rate
Generalising what was exposed above for the second test, the
posterior distributions of h after n trials are used as prior distribu-
tions to compute probabilities for the (n + 1)th trial. The number of
different posterior distributions of h after n trials is n + 1. Each one
of these distributions corresponds to one of the n + 1 possible val-
ues of y from 0 to n and will be used to compute the probability of
success in
n
y
series, all of them having the same probability but
differing due to the order in which previous successes and failures
were observed. The same distribution of h is also used to compute
the probabilities of other
n
y
series, all of them failures corre-
sponding one-to-one to successes. Alternatively, the probabilities
of failures can be obtained by p(f) = 1 p(s). In general, the density
functions of the posterior distribution of h after n tests given that y
successes and n y failures have been observed is
ðpðs=hÞÞ
y
ð1 pðs=hÞÞ
ny
R
1
0
ðpðs=hÞÞ
y
ð1 pðs=hÞÞ
ny
dh
ð11Þ
with y ranging from 0 to n.
shows the posterior density functions of h for panellists
who performed 4 (n) triangle trials and succeeded in 0, 1, 2, 3, or
4 (y) of
them. Considering beta
a
,b
distributions (a = y + 1,
b
= n y + 1) the density functions in
are the sections of
these beta distributions corresponding to the interval of the inde-
pendent variable, p(s/h), from 1/3 (h = 0) to 1 (h = 1). The proportion
S. Bayarri et al. / Food Quality and Preference 19 (2008) 519–523
521
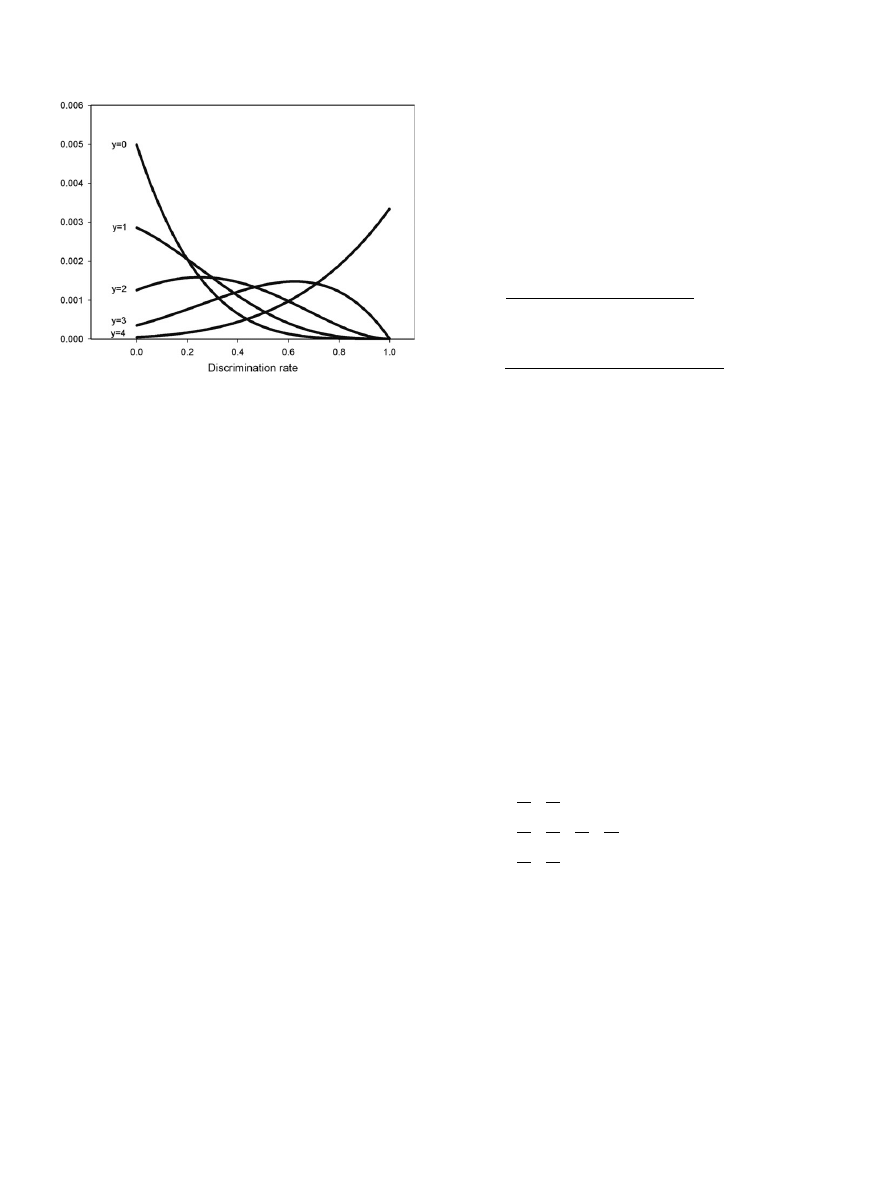
of the area under the curve inside this interval (in relation to the
total area of the complete beta distribution) increases as y, the
number of successes, does. It is respectively 13%, 47%, 79%, 96%
and 99.6% for the values of y from 0 to 4 in the density functions
represented in
. The area outside the interval is not negligible
even for relatively large values of n if the proportion of successes is
not too high. For instance, if the number of tests is 30 and the
number of successes is 10, 13, or 15, the area outside the interval
is 45%, 11% and 3%, respectively. These hypothetical results
can easily arise in practical applications of replicated triangle
tests such as in the estimation of the detection threshold of a
substance.
5.2. Comparison with other approaches
As mentioned above, published studies usually consider all rep-
lications as simultaneously obtained. In these conditions, and
when a Bayesian approach is applied, a prior (informative or non
informative) distribution for all replications must be selected.
showed that different prior distributions produced clearly
different results and
indicated that
the hyper prior distribution (these authors applied a hierarchical
Bayesian approach) affected the individual discrimination rates.
With our approach it is out of question to consider this aspect.
The posterior distributions are obtained step (replication) by step,
considering the posterior distribution from each step as prior dis-
tribution for the next one. According to this, only the prior distribu-
tion of the first step is not also a posterior distribution, since no
previous steps exist. We selected as prior distribution for this first
step a non informative distribution (beta
1,1
, the uniform distribu-
tion, since it is assumed that previous information does not exist
and, consequently, y = n = 0). Observe that the prior distribution
for the first step of our approach must necessarily be non informa-
tive, since, if previous information exists, this information would
imply knowledge about successes or failures of the panellist in pre-
vious tests, what simply means that this panellist is not in the first
step but in a posterior one.
In the aspect of considering a sequence of steps, the procedure
proposed in this paper remembers Walds’s and Rao’s sequential
analyses used for panel selection (
). Panellists succes-
sive perform difference tests and in each step the ratio between to-
tal (from the first test to the last one) correct answers and total
number of tests is compared with critical values previously estab-
lished. The decision concerning a panellist may be, according to the
result of the comparison, selection, rejection or performance of a
new test. As the number of selected and rejected panellists in-
creases, the number of necessary further tests decreases. In these
methods only the number of correct answers is considered, but
not the discrimination rate (h) of the panellist, object of most re-
cent papers referred above.
5.3. Marginal probabilities of success and of failure
Expression
gives the posterior density function of the dis-
crimination rate of a panellist after n trials. Applying this expression,
the probability of success of this panellist in the (n + 1)th trial is
pðs
nþ1
Þ ¼
R
1
0
ðpðs=hÞÞ
y
ð1 pðs=hÞÞ
ny
pðs=hÞdh
R
1
0
ðpðs=hÞÞ
y
ð1 pðs=hÞÞ
ny
dh
ð12Þ
and the probability of failure
pðf
nþ1
Þ ¼
R
1
0
ðpðs=hÞÞ
y
ð1 pðs=hÞÞ
ny
ð1 pðs=hÞÞdh
R
1
0
ðpðs=hÞÞ
y
ð1 pðs=hÞÞ
ny
dh
show these probabilities for the third test in triangle
and duo–trio tests.
6. Performance of the whole panel
From a panellist, i, the basic aspect of interest is to estimate her/
his marginal probability of success in the next test (n
i
+ 1) that is
estimated according to the number of successes, y
i
, observed in
n
i
previous tests. Obviously, a unique observation is possible, a sin-
gle success or a single failure. From a panel formed by h panellists,
what interests is to estimate the probabilities of the possible num-
ber of successes, x, ranging from 0 to h. If the null hypothesis of no
differences between samples is true these probabilities obey the
binomial law with parameter p. But in case of real differences be-
tween the two samples the discrimination rates, h
i
, vary among
panellists and the probability of each possible value of x cannot
be computed according to the binomial formula. For instance, let
us suppose that two panellists perform a triangle test and that in
a previous test one panellist succeeded and the other one failed.
The probabilities of success and failure in the second test of each
one of these panellists are given in
. Three possible number
of successes (x) exist, 0 (when both panellists failed), 1 (when only
one panellists succeeded), and 2 (when both succeeded). The cor-
responding probabilities are
Pðx ¼ 0Þ ¼
39
54
30
54
¼ 0:401
Pðx ¼ 1Þ ¼
39
54
24
54
þ
15
54
30
54
¼ 0:476
Pðx ¼ 2Þ ¼
15
54
24
54
¼ 0:123
The number of addends in each case is, as in the binomial for-
mula,
h
x
but with different probabilities in each addend which
does not allow to combine them. Nevertheless, these probabilities
(such as all discussed in this paper) can be easily calculated using
standard computer facilities. As a slightly more complicated exam-
ple let us suppose that four panellists are going to perform a trian-
gle test and that their backgrounds are 1, 4, 7, and 8 successes in 2,
5, 10, and 14 previous trials. Applying Expression
with the cor-
responding values of y and n, the respective probabilities of suc-
ceeding in the new trial are 0.60, 0.72, 0.67, and 0.57
respectively for each one of these four panellists. Thus, applying
the same procedure discussed for two panellists the probabilities
of 0, 1, 2, 3, and 4 successes in the hypothetical test that will be
performed by these four panellists are 0.02, 0.12, 0.32, 0.38, and
0.16, respectively.
Fig. 1. Posterior density functions of discriminations rates of panellists performing
four triangle trials according to the number of observed successes.
522
S. Bayarri et al. / Food Quality and Preference 19 (2008) 519–523
7. The order of successes and failures. Experience, fatigue or
lack of motivation
As exposed above, the discrimination rate of a panellist depend
on the total number of previous successes but not on the order
they occurred. Nevertheless, it seems that this order must be re-
lated in some extent with the behaviour of a panellist. Let us sup-
pose that in n successive tests failures accumulate in the first trials
and successes in the last ones. Intuitively, this suggests that the
panellist is getting experience. Although not the same, this situa-
tion resembles what in sensory profile occurs when panellists are
trained to reduce the residual variance. The opposite situation, suc-
cesses cumulated in the first trials and failures in the last ones, can
suggest fatigue or lack of motivation. It would be interesting to de-
velop an index to evaluate ‘‘experience” or ‘‘fatigue” according to
the ‘‘history” of the series of successive successes and failures ob-
served from a panellist. In this section some aspects related with
this idea are discussed with exploratory purposes.
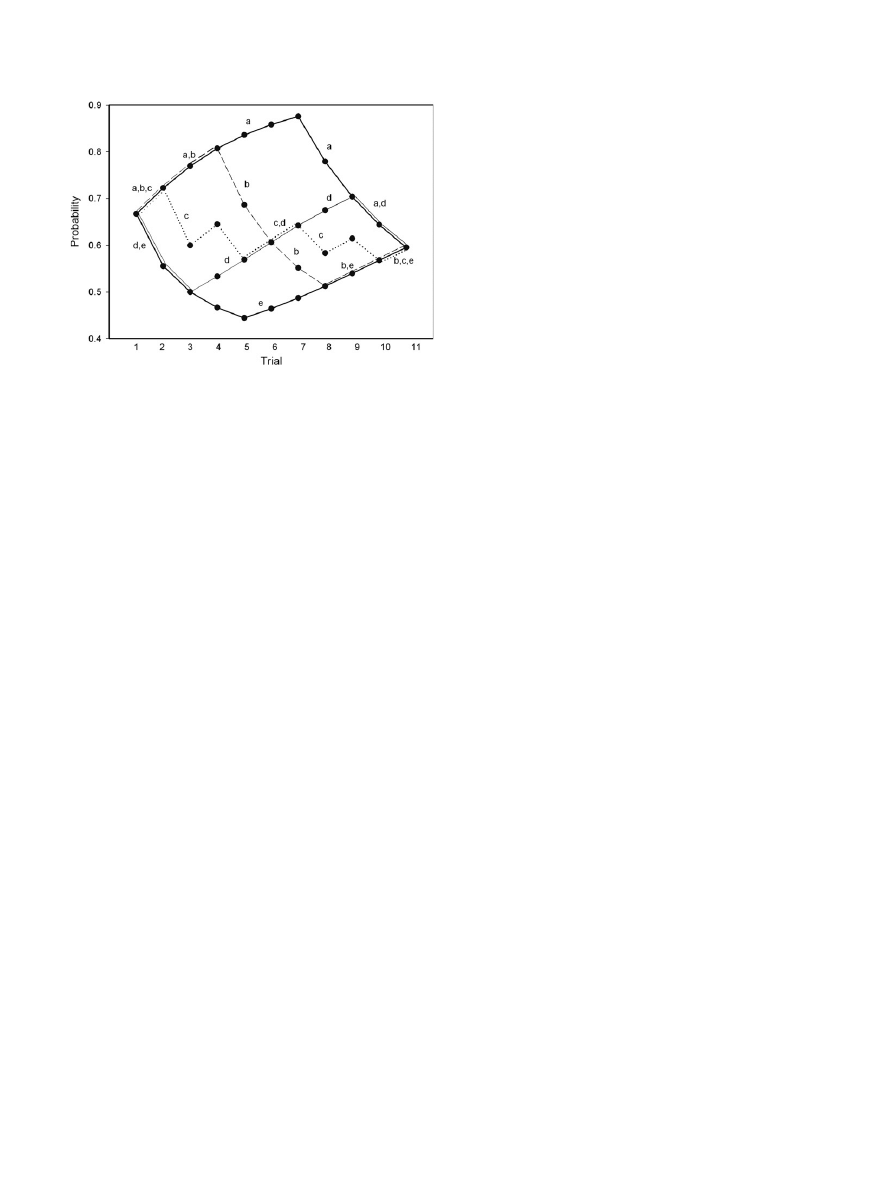
Let us suppose that 10 triangle trials have been performed by
some panellists, all of them succeeding in six and failing in four tri-
als. The probability of success in the 11th trial should be 0.595
according to Expression
for all panellists independently of
the order in which successes and failures happened. The number
of possible different orders is
10
6
= 210, from which 5, corre-
sponding to five hypothetical panellists, a to e, have been selected
and shown in
. This figure represents the successive probabil-
ities of success of these five panellists in the 1st, 2nd, . . ., 11th trial
according to the order in which successes and failures were ob-
served (for the first three trials these probabilities of success have
been already shown in
). Although the final probability of
success in the 11th trial is the same for all panellists, the paths
are completely different. Panellist a had six successes in the first
six trials what suggests a good discrimination capacity but failed
in the last trials what can be interpreted as lack of motivation or
as fatigue. Panellist e behaved in the opposite way what could sug-
gest low initial capacity of discrimination but improved as experi-
ence increased. When the objective of discrimination tests is to
detect subtle differences between samples, the ideal panellist is
somebody with total experience and completely motivated. Since
either experience or lack of motivation can increase as the number
of trials do, it is logical to give more positive importance to suc-
cesses and more negative importance to failures at the end of the
series of trials than at the beginning. Thus, a rough index to mea-
sure how a panellist is affected by the combination of experience
and fatigue could be obtained by assigning rank order numbers
to the performed trials, changing the signs of these numbers corre-
sponding to failures and adding up the obtained results. This index
is 13 (1 + 2 + 3 + 4 + 5 + 6 7 8 9 10) for panellist a and 35
for panellist e. Panellists b, c, and d, with successes and failures in
the beginning and at the end, have a common index of 11.
The indices so obtained can be of some usefulness to compare
the behaviours of panellists who performed the same number of
trials and had the same number of successes. It would be also use-
ful to develop indices to compare, according to the order in which
successes and failures were observed, panellists who performed
different number of tests.
8. Conclusion
By considering replicated difference tests as a succession of
steps (one per replication) the discrimination rate of a panellist
can be estimated by Bayes’ rule using as prior distribution in each
step the posterior distribution obtained in the previous step. The
overall rate of a test panel is evaluated as a function of the individ-
ual discrimination rates of each panellist. Standard computer facil-
ities are suitable to perform all these calculations.
Acknowledgements
This research was supported by the Spanish Government (Min-
isterio de Educación y Ciencia, project AGL2006-05809ALI) and
FEDER founds and by AGROALIMED (Conselleria d’Agricultura, Pes-
ca i Alimentació, Generalitat Valenciana, Spain). Authors also thank
Fondo Social Europeo for author Bayarri’s contract in the program
I3P from CSIC.
References
Bi, J. (2003). Difficulties and a way out: a Bayesian approach for sensory difference
and preference tests. Journal of Sensory Studies, 18, 1–18.
Bi, J. (2006). Sensory discrimination tests and measurements: Statistical principles,
procedures and tables. Oxford: Blackwell Publishing.
Bi, J. (2007). Bayesian analysis for proportions with an independent background
effect. British Journal of Mathematical and Statistical Psychology, 60, 71–83.
Bradley, R. (1953). Some statistical methods in taste testing and quality evaluation.
Biometrics, 9, 22–38.
Brockhoff, P. B. (2003). The statistical power of replications in difference tests. Food
Quality and Preference, 14, 405–417.
Carbonell, L., Carbonell, I., & Izquierdo, L. (2007). Triangle tests. Number of
discriminators estimated by Bayes’ rule. Food Quality and Preference, 18,
117–120.
Duineveld, K., & Meyners, M. (2008). Hierarchical Bayesian analysis of true
discrimination rates in replicated triangle tests. Food Quality and Preference,
19, 292–305.
Kunert, J. (2001). On repeated difference testing. Food Quality and Preference, 12,
385–391.
Meilgaard, M., Civille, G. V., & Carr, B. T. (1999). Sensory evaluation techniques (3rd
ed.). Boca Raton: CRC Press.
Fig. 2. Probability of success in 10 successive triangle trials as affected by success or
failure in previous trials.
S. Bayarri et al. / Food Quality and Preference 19 (2008) 519–523
523
Document Outline
- Replicated triangle and duo-trio tests: Discrimination capacity of assessors evaluated by Bayes " rule
Wyszukiwarka
Podobne podstrony:
[Folia Horticulturae] Phenolic compounds bioactive content and antioxidant capacity of the fruits of
Psychology and Cognitive Science A H Maslow A Theory of Human Motivation
Politicians and Rhetoric The Persuasive Power of Metaphor
Induction of two cytochrome P450 genes, Cyp6a2 and Cyp6a8 of Drosophila melanogaster by caffeine
bearing capacity of spatially random c f soils
USŁUGI, World exports of commercial services by region and selected economy, 1994-04
Monetary and Fiscal Policy Quick Overview of the U S ?on
Can Women Have and Do They Need a Literature of Their Own
HUME AND?SCARTES ON THE THEORY OF IDEAS
ASSUMPTIONS AND PRINCIPLES UNDERLYING STANDARDS FOR?RE OF T
methylone and mCPP two new drugs of abuse addiction biology 10 321 323 2005
Student Roles and Responsibilities for the Masters of Counsel
Guidance for ambulance personnel on decisions and situations related to out of hospital CPR
Guidance for ambulance personnel on decisions and situations related to out-of-hospital CPR, MEDYCYN
E-Inclusion and the Hopes for Humanisation of e-Society, Media w edukacji, media w edukacji 2
więcej podobnych podstron