
On the functional validity of the worm-killing worm
Hyogon Kim* and Inhye Kang
*Korea University
University of Seoul
Abstract — The notion of worm-killing worm has been in the folklore for some time . However the
obvious fear of the killer worm itself being compromised, or of any self-propagating code set loose
(possibly over administrative boundaries), has barred serious exploration on the practical aspects of
the idea. In this paper, we suspend such concerns momentarily, and investigate its functional validity.
This effort is motivated by recent fast worm epidemics exemplified by that of SQL Slammer, which
was overwhelmingly faster than traditional human-intervened response. Specifically, this paper
evaluates the killer worm in terms of the prevention effect and the incurred traffic cost. Above and
beyond, we consider supplementary techniques that could boost the performance and mitigate the
harmful side -effects of the worm-killing worm.
Keywords— worm, epidemic, prevention, speed, bandwidth
I.
I
NTRODUCTION
The outbreak in Jan. 2003 of the SQL Slammer (a.k.a. Sapphire) worm grew into its full- fledged state in
just 10 minutes [1]. In contrast, substantial response to the epidemic came in 2 to 3 hours worldwide [2].
Not only this incident serves as an existence proof to the reality of fast worms predicted a year earlier [3],
but more importantly it heralds the beginning of a new era – where traditional human- intervened response is
no longer adequate to preempt the epidemic. In other words, we entered a realm where not only the attack is
automated (as it has been) but also the defense mechanism should be spontaneously triggered in order to
counter the attack in time.
At the extreme of the spectrum of automatic responses is the elusive killer-worm. The notion of worm-
killing worm has been in the folklore for some time [4,5,6]. Although there is no formal definition of killer
worm, its most characteristic (and controversial) aspect is that it spawns exactly as worms do. In fact, it is a
worm, except that it cures the infected and preventively patches vulnerable nodes. The gist of the idea is that

through and only through worm- like spawning, it can par with fast worms
1
in speed. However, the very
idea of unleashing a self-propagating code possibly over administrative boundaries, however “good-willed”
[4] it might be, can be threatening. What if the killer worm itself is compromised? How complicated is it to
set up the trust association among normally mutually distrustful administrative domains?
Despite these concerns, there was a report [5] that two separate killer-worm mobile codes, dubbed Code
Green [6] and CRclean, were actually released to the Internet to fight the Code Red (obviously without
consent from the “victims”) . And recently, Toyoizumi and Kara [4] attempted a theoretical modeling of the
killer worm based on the Lotka-Volterra equations in order to optimize its behavior. In this paper, too, the
ethics and other non-technical ramifications are put aside. This is because we believe that judging its
functiona l validity should come first before starting any such discussions, especially in the light of recent
fast worm epidemics such as that of SQL Slammer. So in this paper we attempt to quantify the following
aspects of the killer worm:
l effectiveness (i.e., if a killer worm can indeed preempt a worm epidemic, and if so, how fast)
l efficiency (i.e., at what costs)
This paper is organized as follows. Section II discusses our model of the killer worm, and the worm
epidemic. In Section III, we attempt to shed light on various performance aspects of the killer worm through
simulation experiments based on the model established in Section II. Section IV concludes the paper.
II.
K
ILLER WORM AND EPIDEMIC MODEL
In our system model, there are a finite number of susceptible nodes. In reality, these are computers with an
exploitable vulnerability. For instance, they could be Web servers running Microsoft IIS software (as in
Code Red II) or SQL server software (as in SQL Slammer). Usually, the number of susceptible nodes is
much smaller than the size of the entire population, which is the number of hosts attached to the Internet in
reality. When a susceptible node is compromised by the worm released by the attacker, it becomes infected.
On the other hand, when a previously infected node is cured, we say it is removed – of the worm. This
model closely resembles that used in epidemiology, and we can use a differential equation to mathematically
describe the dynamics. In Staniford et al. [3], a logistic equation is used to model the number of infected
nodes after a given time since the outbreak began. Namely,
1
Henceforth we will refer to the worm-killing worm as “the killer worm” or “the killer,” as opposed to
its malicious counterpart, which we refer to as simply “the worm.”

(Eq. 1)
When the killer worm is injected into the system, the dynamics becomes more complex. In [4], the Lotka-
Volterra equations are employed to model the prey-predator dynamics between the worm and the killer
worm. Unlike in [3], however, the environmental capacity K, i.e., the number of susceptible population that
the worm can prey upon, is not included in the model.
When the system starts, a single worm begins to spawn. It scans the entire population (since it does not
know a priori which node is vulnerable) to find a susceptible node
2
. When the worm finds one, it infects it,
which involves self- replicating and planting a replica there. The replica at the infected node also starts
spreading. The dynamics of the epidemic is affected by many parameters: the total population (T), the
number of initial susceptible population (S), the scanning rate (v), and the time for the infected node to
become active (d). In particular, if d=0, the infection rate of a worm under random scanning is
T
S
v
r
⋅
=
(Eq. 2)
When the killer worm is used, we must also consider the reaction time (a) and the killer’s scanning rate (k).
The reaction time is what takes to detect the onset of the epidemic and take a counter-action (e.g.,
unleashing the killer worm). It is well known that reducing the reaction time is critical [10] to contain the
epidemic to the minimum. In this paper, we assume that once the killer is unleashed, it replicates itself on
both susceptible and infected nodes. Other mode of operation may be replicating only on the previously
infected nodes. We will revisit this issue in Section III.
The shortcoming of the prey-predator model of [4] is that it does not explicitly take account of these
parameters, above and beyond the environmental capacity. Therefore, in this paper we mostly resort to the
simulation experiments to investigate their affects.
III.
S
IMULATION EXPERIMENTS
In this section, we will quantify the dynamics of the killer worm based on the model set forth in Section II.
2
An exception is the “hit-list” worm, which accumulates the list of susceptibles through scanning before
it starts spreading [3]. So far, in no major worm epidemic the worm body contained a hit list (For instance,
see [2]).
rt
e
x
K
K
t
x
−
−
+
=
1
1
)
(
0

We will use the following values for the system parameters:
TABLE I. D
EFAULT PARAMETER VALUES
Parameter
Meaning
Default value
T
Total population
2
32
S
Susceptible population
100,000
v, k
Scanning rate
10,000/s
d
Worm activation delay
0s
a
Reaction time
10s
W
Number of starters
1
As for T, note that it does not have to represent the real population in the system. Real- life worms usually
probe the entire IP address space in a blind manner [1,7], not knowing which address is in real use and
vulnerable. Therefore, it is natural to model the worm as well as the killer worm to “think” that total
population is 2
32
(entire IP space size ). The number of susceptible nodes S is set roughly to the order of SQL
Slammer infection – which was at least 75,000 [1]. Also for v and k, the SQL Slammer epidemic is used as a
reference. In SQL Slammer, the average scanning rate from the infected node was 4,000/s where the
observed maximum was 26,000/s [2]. Since our focus in this paper is on the effectiveness of the killer worm
in fast epidemics, we set the average scanning rates higher. We do not set k > v since in a fast epidemic, the
worm scanning rate is likely to be at the maximum that the infected node’s processing and bandwidth
capacity can offer [1]. So the killer worm can at best par with it, but not exceed. As for d and a, we set the
default to 0 and 10 seconds, respectively. But we will see the impact of changing these values below. By
default we assume that both the worm and the killer start from a single entity as mentioned in the previous
section. So the number of progenitors W is 1 unless otherwise mentioned. In reality, however, this may not
be true. Both the attacker and the killer worm defense system may each want to start from as many locations
to boost the initial spawning speed. We will discuss this aspect later on.
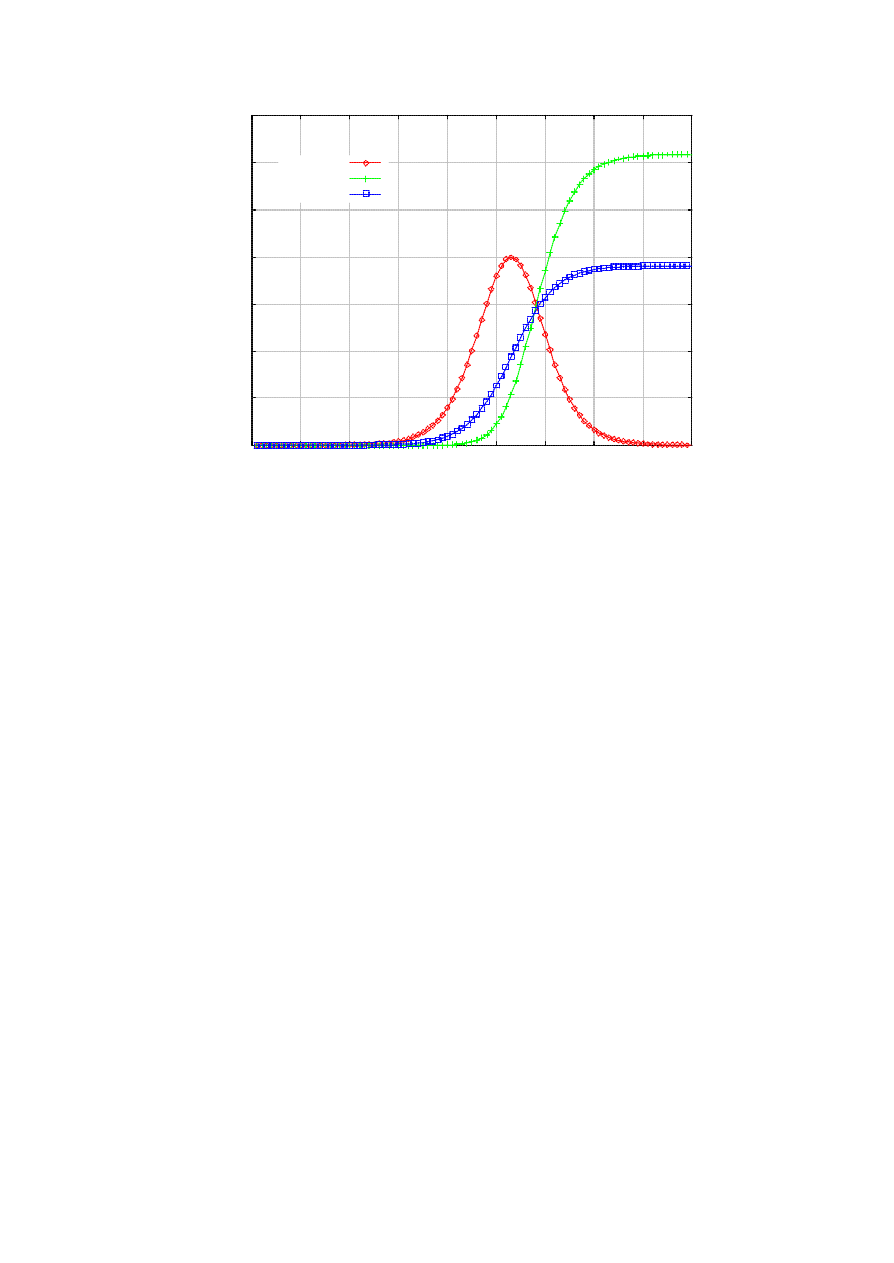
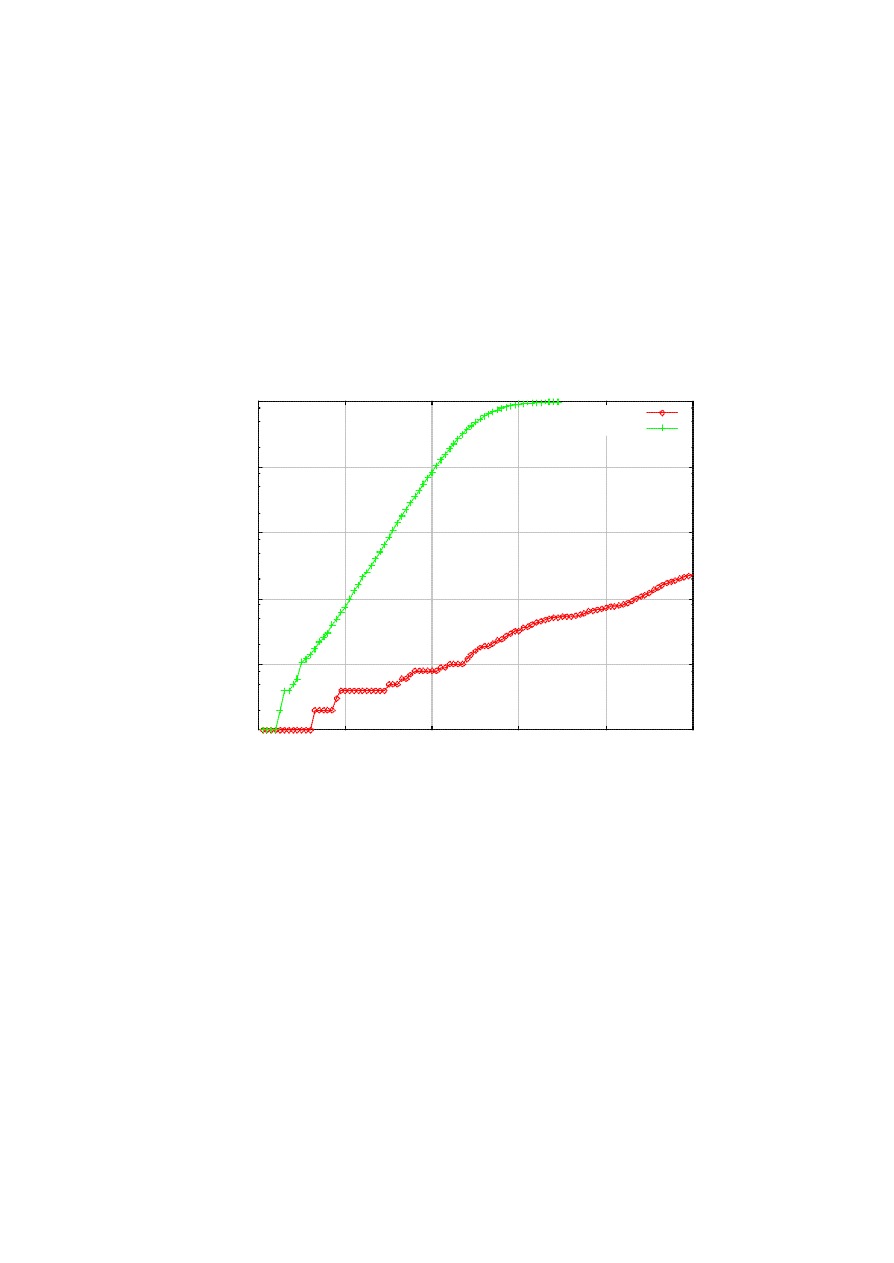
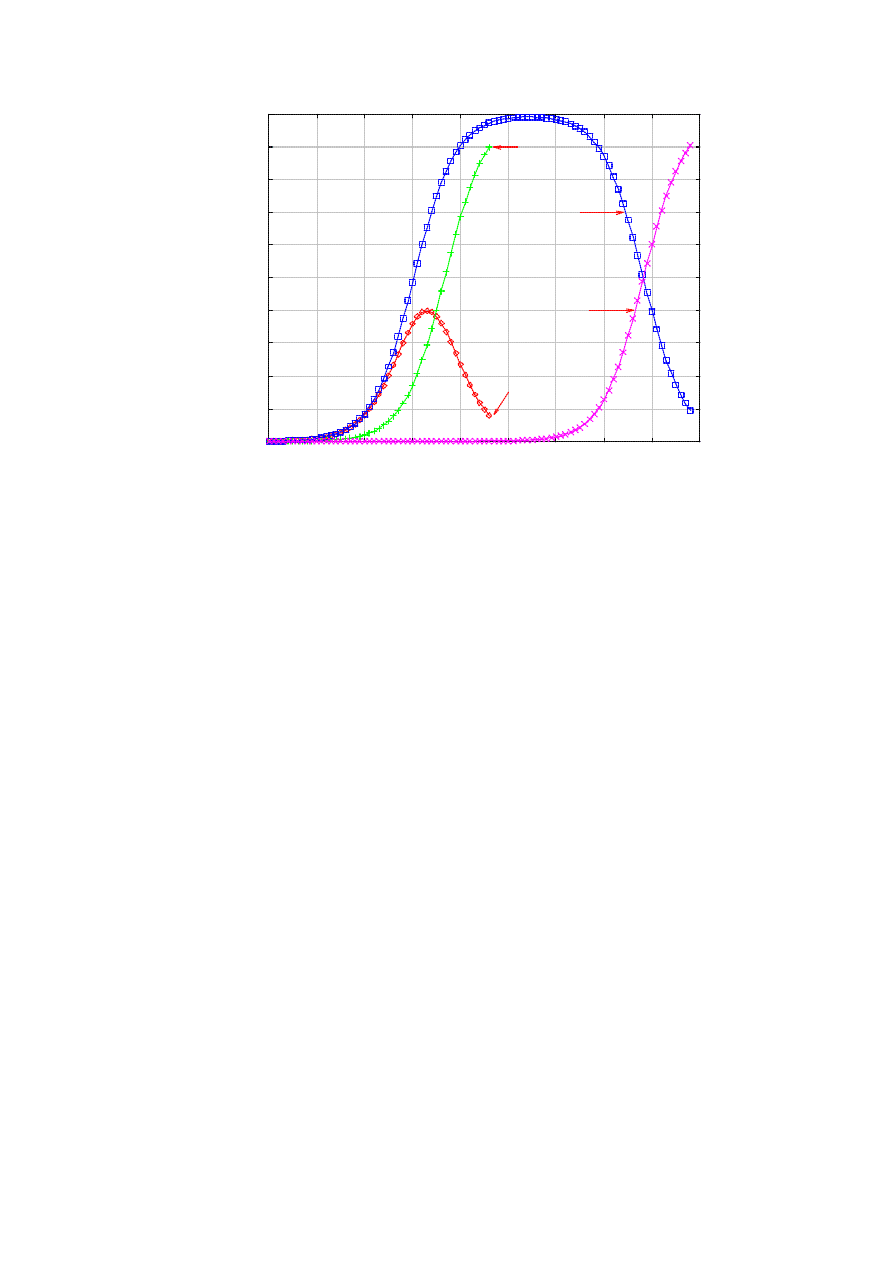
Figure 1 shows the typical dynamics of the infected population vs. treated population (i.e., removed +
prevented) as a function of time, under the default parameter value s listed in Table I. We notice that for a
relatively long time in the beginning of the epidemic, the number of infected population remains small. This
is exactly why hit- list scanning may be employed, to shorten this period as much as possible [3]. But at
around 30 seconds into the epidemic it explodes, demonstrating its characteristic exponential take-off [3].
However, the killer worm encroaches upon the infected nodes base, forcing the epidemic to die out after 90
seconds. Instead, the sum of the removed and the prevented should show the logistic curve, since the killer
worm preys on both the susceptible and the infected, whose sum is fixed at S.
0
10000
20000
30000
40000
50000
60000
70000
0
10
20
30
40
50
60
70
80
90
number of nodes
time (s)
infected
removed
prevented
Figure 1. Typical epidemic in the presence of the killer.
A. Parameter sensitivity
In the first experiments, we investigate the impact of the parameters to the dynamics of the epidemic,
starting from the reaction time, a. Just as in any infectious disease control, containing the outbreak in its
early stage is considered crucial [10]. For instance, in retrospect, it is argued that we had 30- to 60-second
window at the beginning of the SQL Slammer epidemic for effective containment [2]. In this paper we are
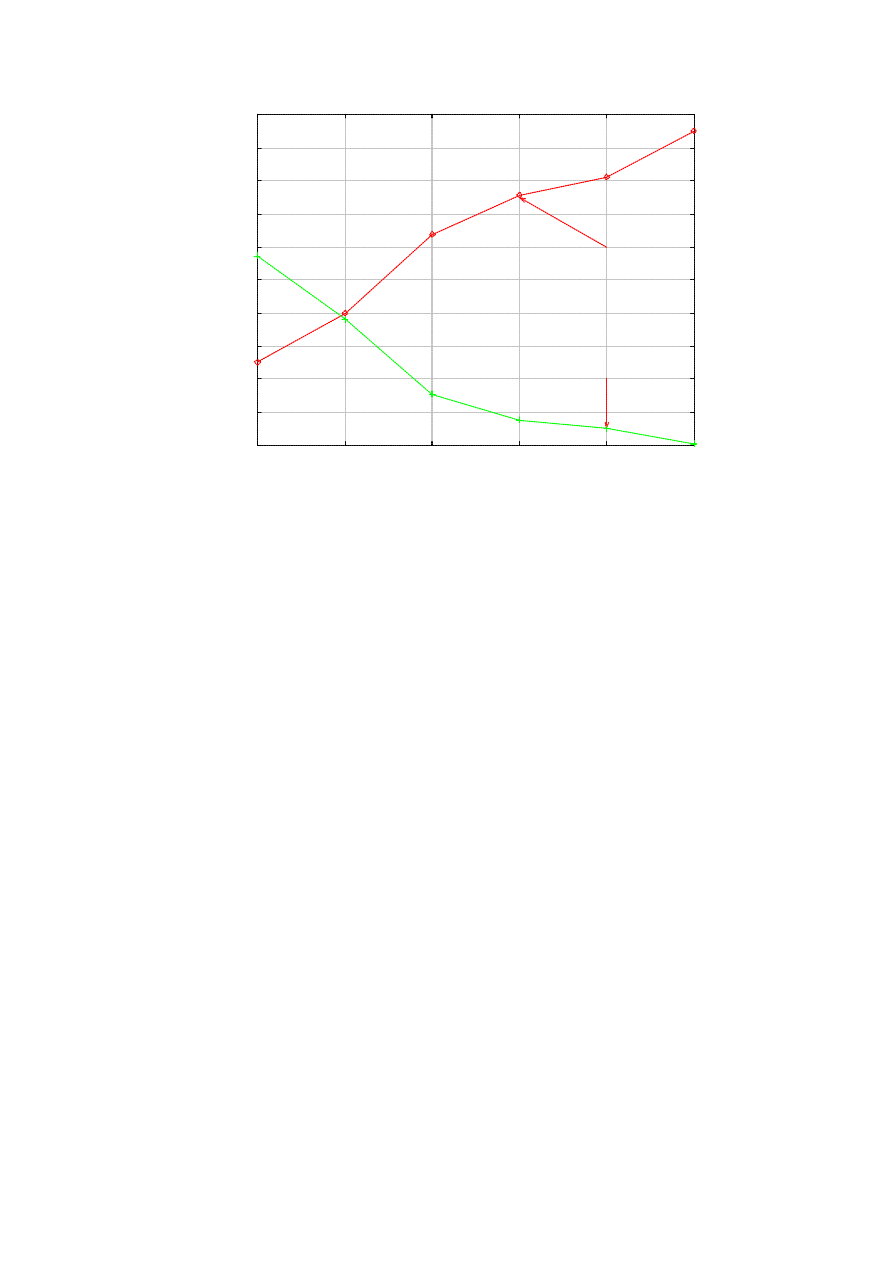
looking at faster epidemics, so we vary a well within that range: from 5 to 30 seconds. Figure 2 shows the
result. The x-axis represents a, while the y-axis is the number of infected nodes at the peak of the epidemic,
I
max
. For instance, the peak occurs at t=53 in Figure 1. We find that I
max
is roughly a linear function of a. In
terms of the prevention effect, the number of nodes patched by the killer before infection nearly disappears
with a > 30. Namely, almost all vulnerable nodes in the system are infected before the killer visits in that
time. It corroborates the analysis on the size of the time window for effective response in a fast epidemic [2].
This result has a grave implication – in future fast epidemics, detection must be done extremely fast, in
much less than a minute. Otherwise, most vulnerable nodes will have already sustained a possibly damaging
hit from the worm by the time a killer worm comes to the aid.
0
10000
20000
30000
40000
50000
60000
70000
80000
90000
100000
5
10
15
20
25
30
number of nodes
reaction time (s)
max. infected
infection prevented
Figure 2. The impact of the reaction time.
But how easy is it to detect the onset of the outbreak within, say 10 seconds, without too many false
positives, considering there are only a small number of infected nodes in that time (e.g., it is 0.011% of the
vulnerable population at t=10 in Figure 1)? Designing a detector with such precision and speed will be
extremely difficult, if not impossible. Unless set loose within a few tens of seconds into the epidemic, even
the powerful killer worm cannot prevent massive infection. Therefore, unleashing the killer worm after
detecting the outbreak is likely to have limited utility against a fast worm . But we reserve the judgment on
its effectiveness on slow epidemics.
The impact of parameter S is also important. In essence, with a smaller vulnerable population base, it is
more difficult to derive a fast epidemic. Assuming that the killer is unlikely to encounter an infected node at
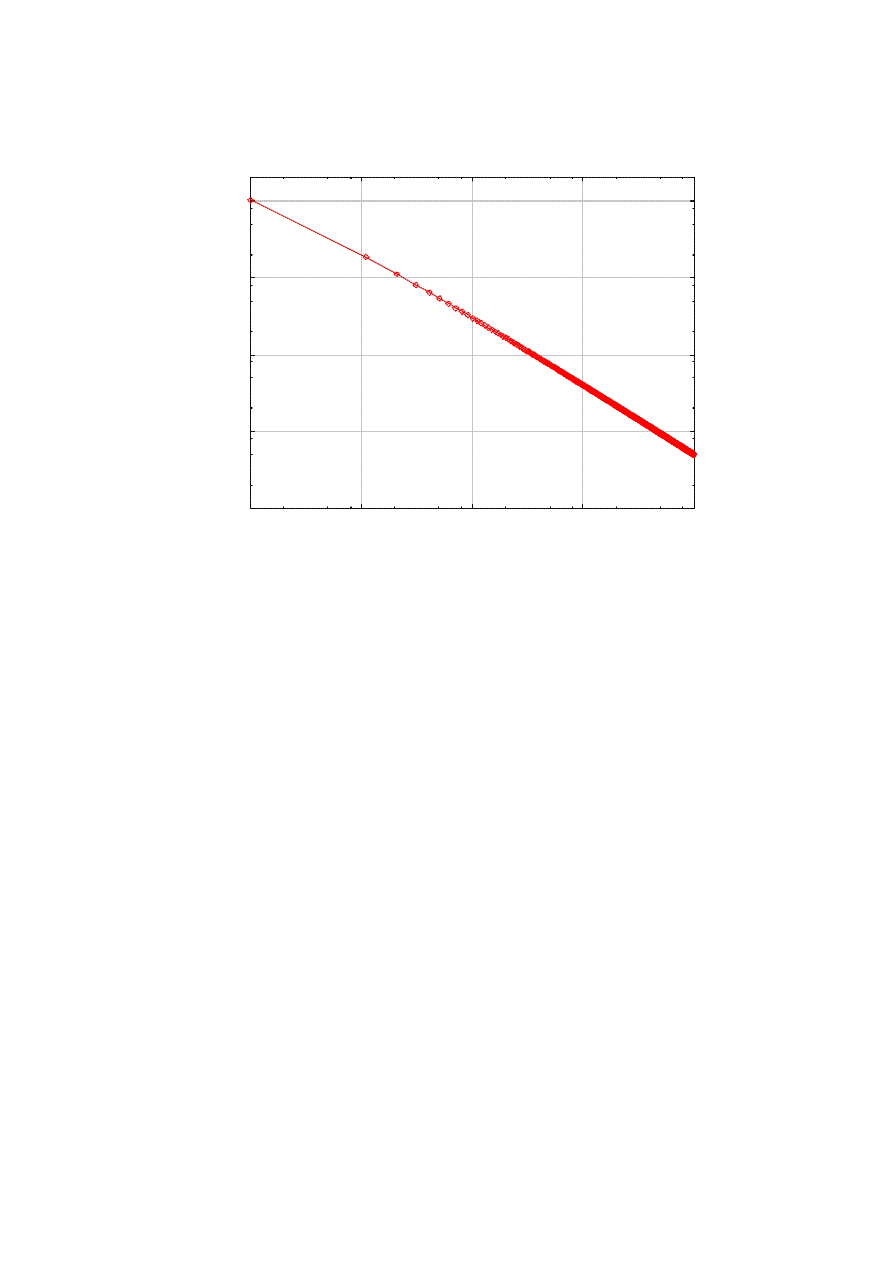
the early stage of the outbreak, we can approximate the number of infected nodes using the logistic equation
given in [3]. Figure 3 shows the approximate time for the infection to reach 10% of S, as a function of S.
With S=10,000 and all other parameters fixed at the default, the number of infected is predicted at 12, even
at t=100. In contrast, if the susceptible population is 1,000,000, it takes less than 10 seconds to reach the
10% infection. This tells us that we need to ensure first the integrity of more widely deployed softwares, in
order to avoid fast and large worm epidemics. For larger values of the infection ratio, our assumption of
limited interactivity between the worm and the killer will be probably broken, and the logistic equation will
be rather misleading.
The contribution of W in boosting the initial growth can be also predicted based on the same assumption
of interactivity (or lack thereof) – the number of infected nodes is strictly proportional to W [4].
1
10
100
1000
10000
100
1000
10000
100000
1e+06
time to 10% infection
initial susceptible population
Figure 3. Time to 10% infection as a function of s.
And we can see from (Eq. 1) that the infection rate is proportional to the scanning rate (v or k depending
on the kind of worm in hand). So the number of infected nodes grows as an exponential function of the
scanning rate [4]. In reality, however, the scanning rate is something that is hardly controlled, so we do not
quantitatively analyze its performance impact. The larger the scanning rate, the faster the spread, so the
attacker would want the scanning to be as fast as the bandwidth and processing allows [3]. For instance, in
SQL Slammer, UDP packets with the worm payload were blasted out as fast as they can be, making the
epidemic “bandwidth- limited” [1].
B. Cease and desist
In terms of the bandwidth usage, a killer worm that keeps trying to spawn even after the epidemic dies
out will be no less problematic than the worm epidemic itself. Recollect that SQL Slammer worm could
paralyze a substantial part of the Internet with just scanning traffic (it carried no other damaging payload).
In [4], this very issue is addressed and a solution is proposed – controlling “predatory rate” and “predator
multiplication rate”. The former is the rate at which a killer worm hunts (thus kills) a malicious worm, and
the latter is the rate at which a killer replicates itself upon a kill. For instance, in our system the
multiplication rate is 1, i.e., a killer worm that found an infected node gives birth to a single replica.
Unfortunately, in reality we cannot determine the predatory rate a priori – it can only be obtained through a
post mortem analysis, e.g., 8.5 per second in SQL Slammer [7]. This is because the predatory rate is a
function of many system parameters we do not know before the outbreak. For one, we do not know S,
namely how many have not patched for the particular vulnerability, before the epidemic actually occurs.
Therefore, we need a more practical mechanism to optimize the traffic usage of the killer worm. In this
paper, we fuse the “rumor- mongering” model [11] into the construction of the killer worm: a rumor- monger
loses incentive to spread the word when he finds that too many people already heard about it. This way, by
the time most people have heard the rumor, the rumor naturally stops spreading. Likewise, if the modified
killer finds that the visited node has been removed of the worm already, it considers the visit a failure. When
the fraction of the failures increases beyond a threshold r, the killer (to be precise, an instance) self-destroys.
Figure 4 shows the impact of this modification on the system behavior. The y-axis represents the number of
killers’ scanning packets generated system- wide. We vary r from 0 to 0.9, and the impact is significant.
Even at r = 0.1, the number of scanning packets decreases by half. However, higher thresholds cause less
dramatic decrease. But it is one required self-control mechanism that a killer worm must be equipped with.
0
1e+08
2e+08
3e+08
4e+08
5e+08
6e+08
7e+08
8e+08
9e+08
1e+09
30
40
50
60
70
80
90
100
number of scans by killer
time (s)
r=0
r=0.1
r=0.5
r=0.9
Figure 4. Volume of scanning traffic with different r.
Would the infection be more virulent with more stringent killer control (i.e., larger r)? Surprisingly, the
number of infected nodes for different values of r is almost identical in our current setting (Figure 5). Figure
5 also shows that the time the curves in Figure 4 begin to diverge interestingly concurs with the time at the
peak infection. Although Figure 4 seems to suggest that lowering r is only beneficial, the optimal value of r
must be a function of many other system parameters. Again, we need a general analytical framework to
dynamically determine the optimal value of r. It is a subject of our ongoing work.
0
5000
10000
15000
20000
25000
30000
35000
40000
20
25
30
35
40
45
50
55
60
65
70
number of infected hosts
time (s)
r=0
r=0.1
r=0.5
r=0.9
Figure 5. Number of infected hosts under cease-and-desist.
C. Address checking
Above we argued that the killer worm is practically useless if started long into a fast outbreak, due to the
severe requirement for early reaction. One way to slow down the epidemic to buy more time for the killer
worm launch, is to let each host check if the outgoing packet is using legitimate IP addresses. If not, it is
highly likely that the packet is part of an attack [8]. In particular, if the destination address is illegal (either
“Martian” [12] or unallocated by IANA[13]), it is likely a scanning packet [8]. This is because worms
randomly scan the IP address space: Code Red II generates an address within the same /8 prefix with
probability of 1/2, /16 prefix with 3/8, others with 1/8 [7]. SQL Slammer does not have such preference, and
it generates a random address with equal probability. Since the probability of illegal address generation is as
large as 0.5 [8], the presence of an attack can be quickly identified at the traffic source. In this paper, we
assume that the worm randomly scans the entire IP address a la SQL Slammer. If address violations occur
more than a preset number of times
θ, we assume here that the host begins self-audit, eventually killing the
worm within. In [8], it is shown that the exact threshold value is not important because in reality, there are
few innocent hosts that habitually transmit to illegal addresses. So, ordinary hosts are hardly punished even
if
θ is set relatively low. We let θ=5 in this paper.
Obviously, it is unrealistic to assume that the address checking is deployed on all nodes. At best the
deployment will be partial. We refer to the deployment ratio as
δ, and we vary it from 0 to 0.99 to see the
impact. It is intuitive that address checking has an effect of reducing the susceptible population that can be
exploited as a worm spreader, by (1-
δ). This is because although the infected nodes with the address
checking can attempt maximum of
θ times to infect other nodes, S/T is so small that the probability of
finding a victim in so many attempts is low, and it has little affect on the result. Even if S is on the order of a
million, S/T is much less than 0.001. With such small S/T, we can see that
which makes the exponential term approach 1 in the logistic equation (Eq. 1). In particular, when rà0,
x(t)àx
0
. In other words, the epidemic does not progress.
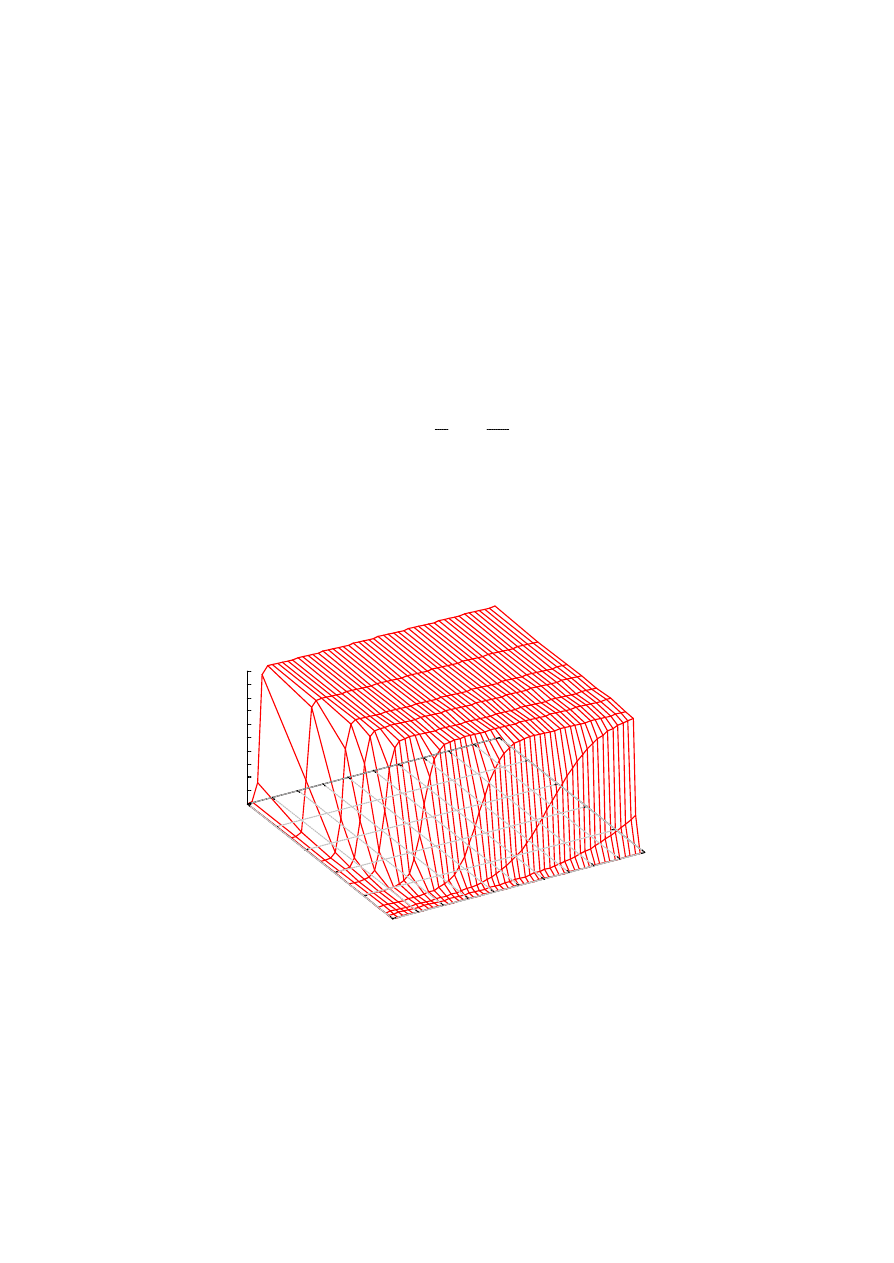
0
20
40
60
80
100
filtering percentage
100
200
300
400
500
600
700
800
900
1000
time (s)
0
10000
20000
30000
40000
50000
60000
70000
80000
90000
100000
# of infected
Figure 6. Impact of address checking.
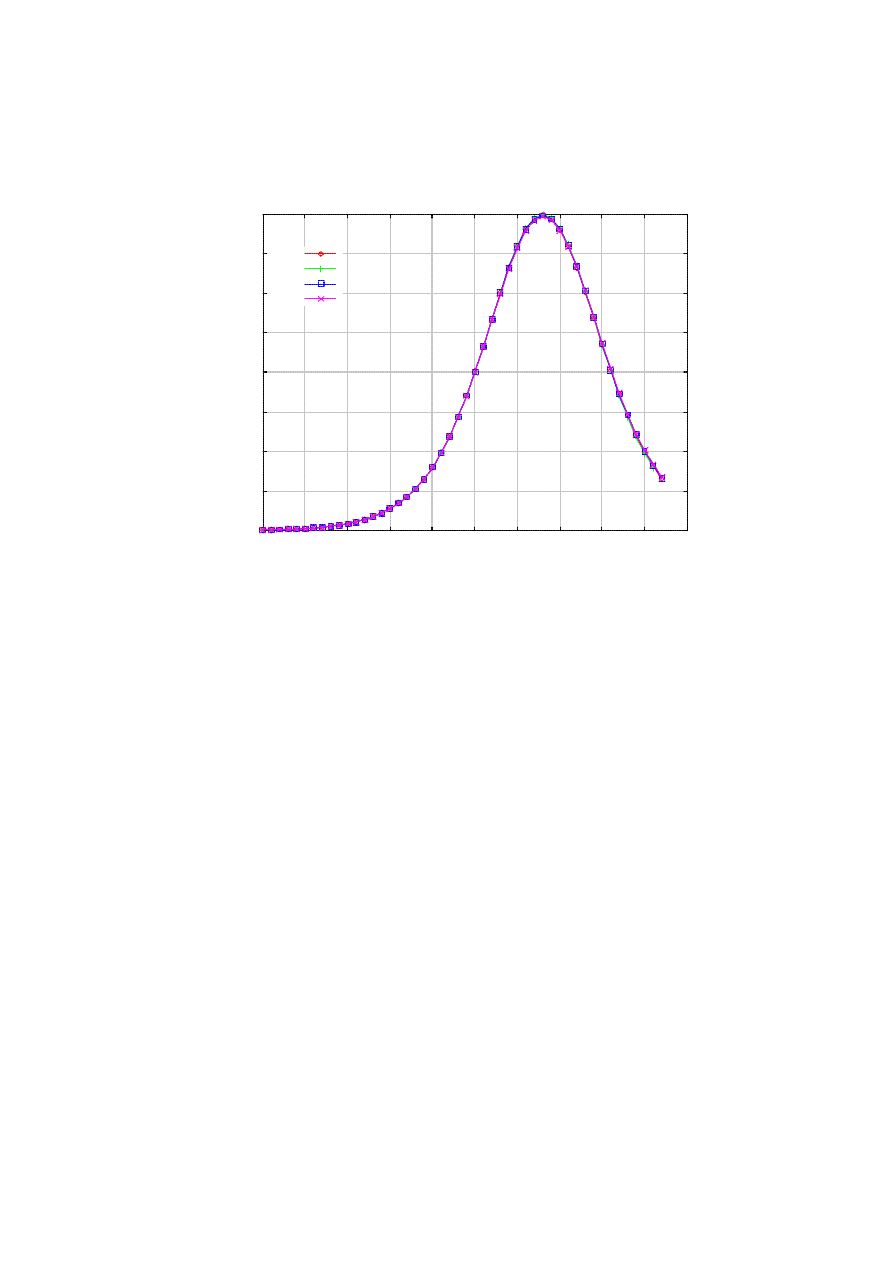
Figure 6 shows that the address checking indeed has a slowdown effect on the epidemic, but it is
pronounced only at larger
δ values. However, the address checking technique is simple to incorporate in
0
1
1
≈
≈
−
−
T
S
T
S
θ
θ
hosts [8], so it could be an effective deterrent to fast epidemics if adopted as a standard feature in Internet
hosts, as it is in routers [12]. Finally, note that the address checking is impartial – it can also kill the killer
worm if it were to blindly scan as most worms do. Therefore, the killer worm should filter illegal addresses
in its scanning packets to avo id being shut down by the address checking hosts.
D. Propagation path backtracking
In order to minimize the epidemic, the killer worm must hit as many infected nodes as possible at the
outset, when the number of the infected node is still small. One way to achieve this objective is to improve
the accuracy of the “guesses” on the part of the killer. To assist the killer, we can let each host maintain a list
of recent correspondents. For instance, a 30-second worth of IP addresses from which a host received
packets (possibly containing worm payload) could be recorded. When the killer worm finds an infected
node, it can start from the IP addresses in the node’s list since the worm that planted a replica at the infected
node could have come from one of those addresses. Figure 7 shows the result of this enhancement. We
notice that the infection is indeed significantly reduced, while the reduction quickly becomes marginal with
progressively large time window.
0
5000
10000
15000
20000
25000
30000
35000
40000
20
25
30
35
40
45
50
55
60
number of infected
time (s)
L=10
L=20
L=30
none
Figure 7. The impact of address recording for backtracking.
One might think that the notion of “time bomb ” is applicable on the attacker’s part – namely, if the
attacker intentionally puts a delay until the activation of the worm, e.g., 60 seconds, then the worm would
evade the backtracking. However, this delayed activation technique would only procrastinate the spread of
the worm in its initial phase, as shown in Figure 8. In the figure, the delayed epidemic still shows the
exponential behavior (the y-axis is in log scale), but it is too slow to cause a fast epidemic. This is because
the attacker, by inserting the artificial delay, is widening the time gap between the “generations ” [3] of
infection. So we can argue that fast epidemics will shun such delay. If deployed widely, therefore, exploiting
the history of communication in killer worm propagation will be a powerful technique to boost the killer’s
performance. One last caveat is that this technique is effective against the worms that are carried over TCP,
and those that use UDP but do not employ source address spoofing. This is because a bogus address in the
list does not help in the backtracking. Note that the scanner normally cannot spoof when using TCP.
1
10
100
1000
10000
100000
0
20
40
60
80
100
number of infected
time (s)
delay=30s
no delay
Figure 8. Pausing to avoid backtracking only backfires.
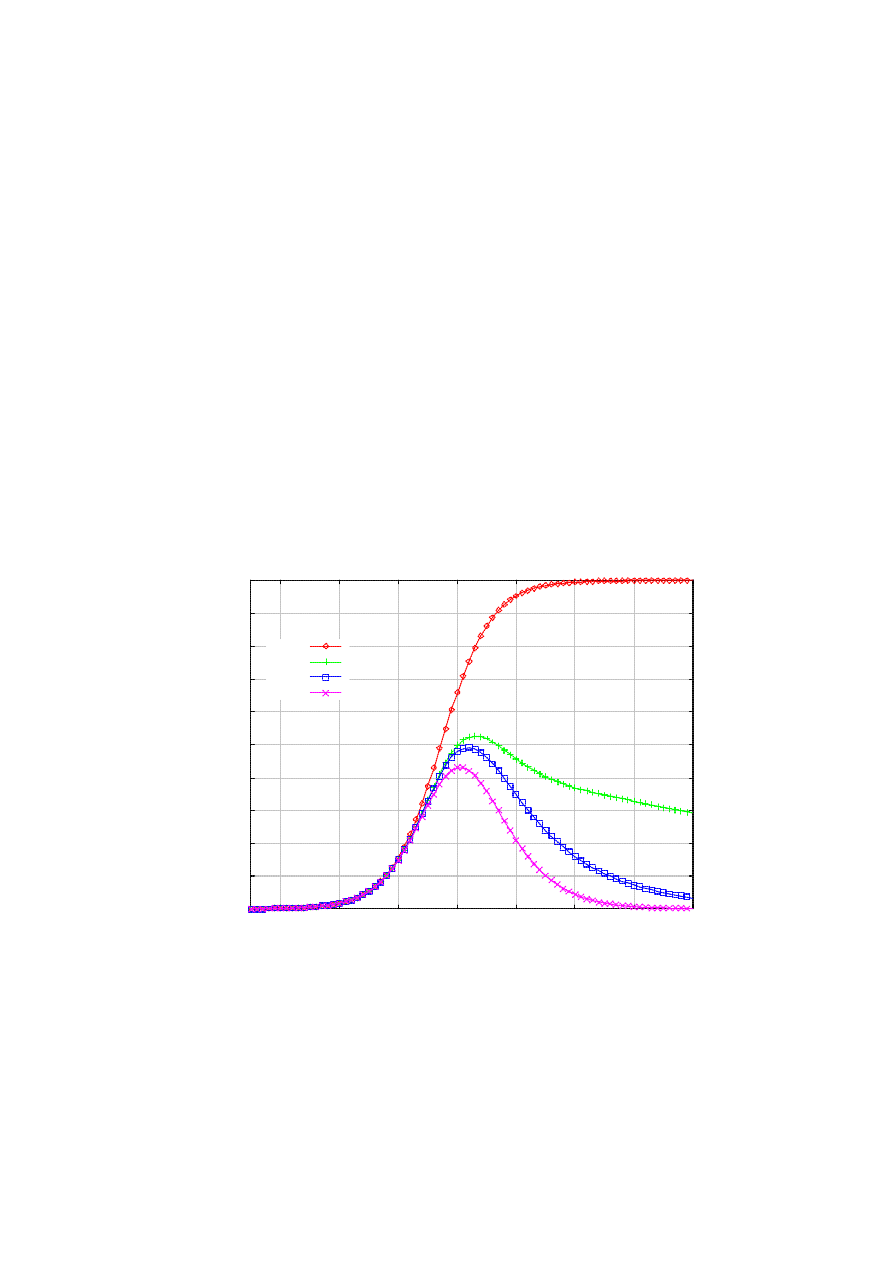
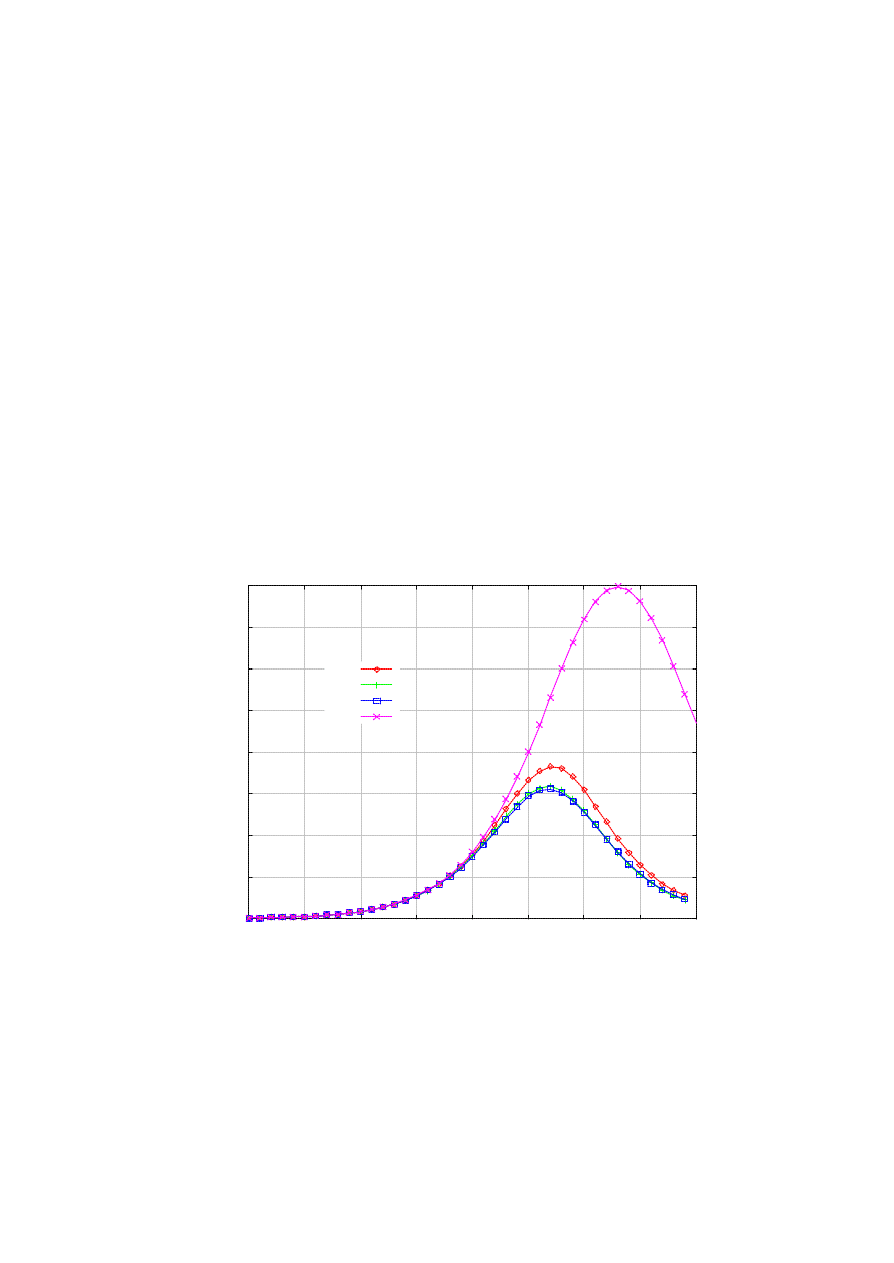
Finally, one might argue that it is more natural for the killer to replicate only when it succeeds to neutralize
a worm (but not upon patching the susceptible). However, then, the worm epidemic is expectedly more
virulent as less nodes participate in exterminating the worms. Figure 9 compares the impact of limiting the
spawning of the killer worm at the already infected nodes. With the default parameters, we can see that the
killer worm spreads too slowly to preempt the worm. In the particular example, almost all nodes get infected
before the epidemic starts to decrease. In contrast, the maximum infection tops out at 40,000 when the killer
worm is not constrained.
0
10000
20000
30000
40000
50000
60000
70000
80000
90000
100000
20
30
40
50
60
70
80
90
100
110
number of hosts
time (s)
removed+patched (kill-all)
infected (kill-all)
infected (feed-on-prey)
removed (feed-on-prey)
Figure 9. Killer worm is slower if it spawns only at infected nodes.
IV.
C
ONCLUSION
In this paper, we evaluate the mythical killer worm purely on its functional validity. Our investigation
shows that it would be hard to contain today’s fast worm epidemics with the killer worm technique, mainly
because of the difficulty to quickly detect the onset of the epidemic. Unless set loose within a few tens of
seconds into the epidemic or the epidemic is significantly slowed down with other assistive measures, even
the powerful killer worm would not prevent massive infection. But we reserve the judgment on its utility
against slow epidemics. Also, we find that the bandwidth usage of the killer worm must be controlled, to
prevent unintended DoS effect by excessive scan traffic generation. We propose a rumor- mongering model
to regulate the total number of killer worms in the system. We also demonstrate that recording the identity
of recent corresponding nodes helps to boost the performance of the killer unless address spoofing is
employed in the malicious worm propagation. The effect of illegal address checking is also evaluated as an
assistive technique, which turns out to slow down the epidemic if used widely.

R
EFERENCES
[1] CAIDA, “Analysis of the Sapphire Worm,” http://www.caida.org/analysis/security/sapphire/, Jan. 30,
2003.
[2] D. Moore et al., “The spread of the Sapphire/Slammer worm,” a NANOG presentation,
http://www.nanog.org/mtg-0302/ppt/worm.pdf.
[3] Stuart Staniford, Vern Paxson, and Nicholas Weaver, “How to Own the Internet in Your Spare Time,”
11th USENIX Security Symposium, August 5-9, 2002, San Francisco, USA.
[4] H. Toyoizumi and A. Kara, “Predators: good will mobile codes combat against computer viruses,” New
Security Paradigms Workshop 2002, Sept. 23-26, Virginia Beach, USA.
[5] Newsbyte, http://www.newsbytes.com/news/01/169707.html
[6] “D. HexXer,” Code Green, http://www.securityfocus.com/archive/82/211428.
[7] CAIDA, “CAIDA analysis of Code Red,” http://www.caida.org/analysis/security/code-red/.
[8] H. Kim and I. Kang, “On the effectiveness of Martian address filtering and its extensions,” Globecom
2003, Dec. 2003, San Francisco, USA.
[9] H. Kim, “Demystifying the killer worm,” Techreport, Korea University, Aug. 2003.
http://net.korea.ac.kr/killer.html.
[10]
D. Moore et al., “Interenet quarantine: requirements for containing self-propagating code,” Infocom
2003, Mar. 30-Apr. 3, San Francisco, USA.
[11]
A. Demers et al., “Epidemic algorithms for replicated data management,” Sixth Symp. on Principles
of Distributed Computing (Vancouver), ACM, August 1987, pp. 1-12.
[12]
F. Baker, “Requirements for IPv4 routers,” RFC 1812.
[13]
IANA, “Internet Protocol v4 address space,” http://www.iana.org/assignments/ipv4-address-space.
Wyszukiwarka
Podobne podstrony:
Tabor Evans Longarm Giant 014 Longarm On The Santee Killing Grounds
The Effect of Childhood Sexual Abuse on Psychosexual Functioning During Adullthood
Orpel, Aleksandra A Note On the Dependence of Solutions On Functional Parameters for Nonlinear Stur
1948 On the relationships between the frequency functions of stellar velovities de Jonge 553 61
Multiscale Modeling and Simulation of Worm Effects on the Internet Routing Infrastructure
On the Performance of Internet Worm Scanning Strategies
Begault Direct comparison of the impact of head tracking, reverberation, and individualized head re
Miller B L On the integration of elementary functions computing the logarithmic part (phd thesis, T
Code Red a case study on the spread and victims of an Internet worm
Interruption of the blood supply of femoral head an experimental study on the pathogenesis of Legg C
Ogden T A new reading on the origins of object relations (2002)
Pancharatnam A Study on the Computer Aided Acoustic Analysis of an Auditorium (CATT)
Newell, Shanks On the Role of Recognition in Decision Making
On The Manipulation of Money and Credit
Dispute settlement understanding on the use of BOTO
Fly On The Wings Of Love
31 411 423 Effect of EAF and ESR Technologies on the Yield of Alloying Elements
Effects of the Great?pression on the U S and the World
więcej podobnych podstron