
X L V I I I K O N F E R E N C J A N AU K O W A
KOMITETU INŻ YNIERII LĄ DOWEJ I WODNEJ PAN
I KOMITETU NAUKI PZITB
Opole – Krynica
2002
Tadeusz CHMIELEWSKI
1
Piotr GÓ RSKI
2
Bernd BEIROW
3
Joachim KRETZSCHMAR
3
COMPARISON OF THEORETICAL AND EXPERIMENTAL
FREE VIBRATIONS OF HIGH INDUSTRIAL CHIMNEY
INTERACTING WITH SOIL
1. Introduction
Theoretical frequencies and mode shapes of the high multi-flue industrial chimney, which is
located in the power station of Opole, interacting with soil have been evaluated through the
application of the finite element method and published in the paper [1]. The results were also
presented at the Krynica Conference [2].
The aim of the present paper is to study the free vibrations of this chimney by
dynamical testing in full scale to confirm a calculation model and to obtain important
information on the effect of soil interacting with the chimney.
2. The Industrial Chimney and Its Measuring Device
The most appropriate method to investigate the soil effect on free vibrations of the industrial
chimney was to measure the free vibrations response of the chimney in full scale because the
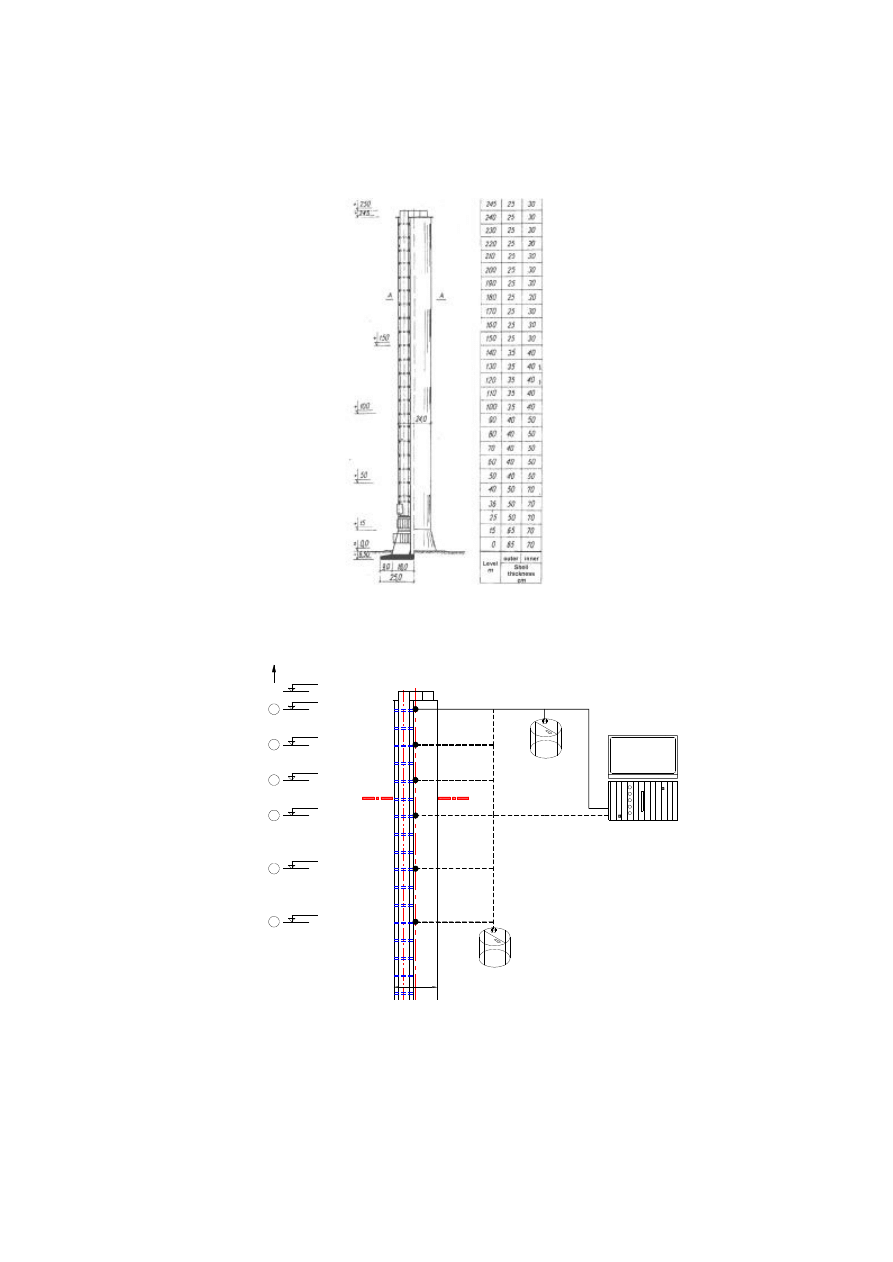
actual structure was available. The general view of the chimney and the most important
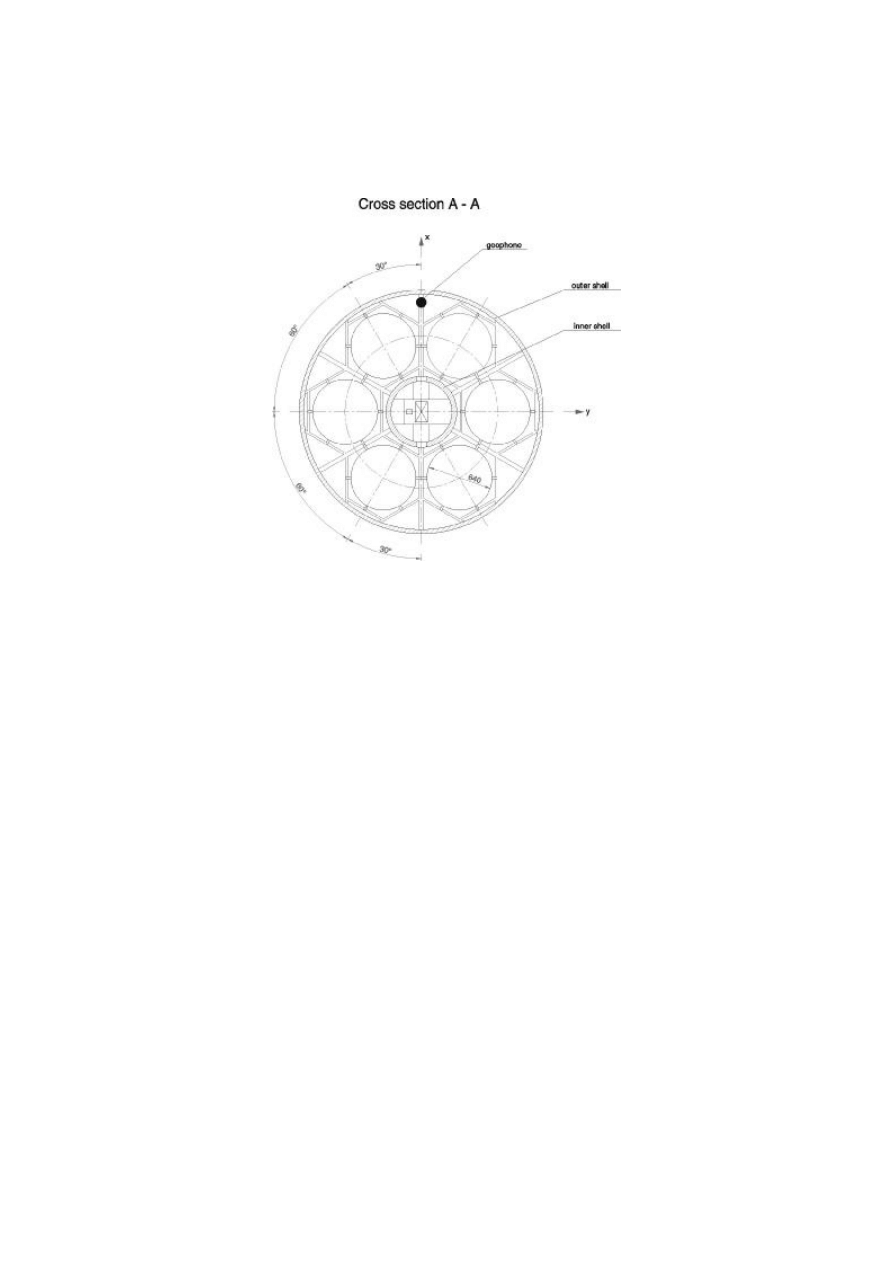
dimensions are given in Fig. 1, its cross-section is shown in Fig. 3.
The vibration measurements are focussed on determination of the lowest natural
frequencies and mode shapes. Applying high sensitive geophone sensors measuring vibration
velocities which frequencies down to 0.2 Hz can be recorded. The measuring chain is
completed by a frontend system and a laptop controlling the measurement and it is shown in
Fig. 2. The excitation due to wind load is permanently present and generally corresponds to a
white noise if the measuring time for each point is at least 20 minutes. That means that the
spectra of vibration response are dominated by the natural frequencies (see Section 3) [3].
1
Prof. dr hab. inż., Technical University of Opole
2
Mgr inż., Technical University of Opole
3
Dr.-Ing., Brandenburgische Technische Universität Cottbus
28
Fig. 1. Industrial chimney of Opole power station – general view and longitudinal section
Geophone 2 (Rover)
Frontend
Geophone 1 (Reference)
Laptop
+150
6
+ 120
5
4
3
+ 180
+ 220
2
+ 200
1
+ 240
z
+ 250
24,0
A
A
Fig. 2. Points of measurement and measuring devices
29
Fig. 3. Position of geophone sensor in the cross-section and definition of coordinates
The additional determination of mode shapes requires the application of two
geophones operating simultaneously. For this purpose altogether 6 measuring points in the
upper part of the chimney are chosen (Fig. 2). While one geophone is fixed at the reference
point 1 near the top of the tower, the second one is moved step by step from point 1 at the
level of 240 m down to the level of 120 m. From the ratio of associated peak amplitudes in
the vibration response spectra of the two actual points the ordinate of the corresponding
mode shape at the actual location of the roving sensor can be determined.
3. Results
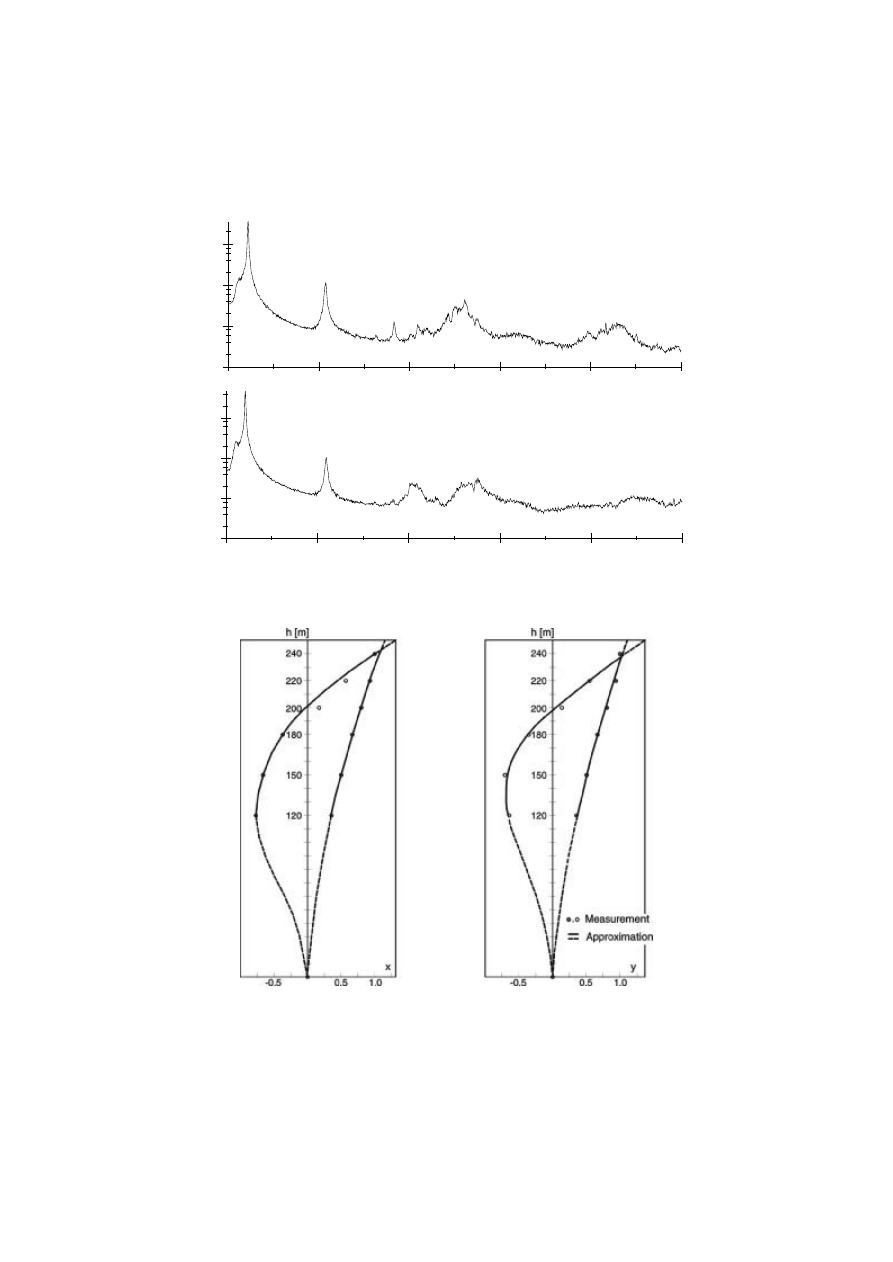
Fig. 4 shows representative Fourier spectra of vibration response due to the wind load
evaluated from measurement data at the reference point (December 2001). It can be seen that
the spectra are dominated each by two well separated peaks representing the lowest two
natural frequencies for the corresponding direction. The peaks are specified by the numerical
values of the frequencies. Additionally, considering the velocity amplitudes which can be
assigned to a certain natural frequency for both the fixed and the roving sensor
corresponding to the first and second mode shapes are determined and shown in Fig. 5. The
signs of the mode shape ordinates result from the comparison of the phase angles in the
frequency domain.
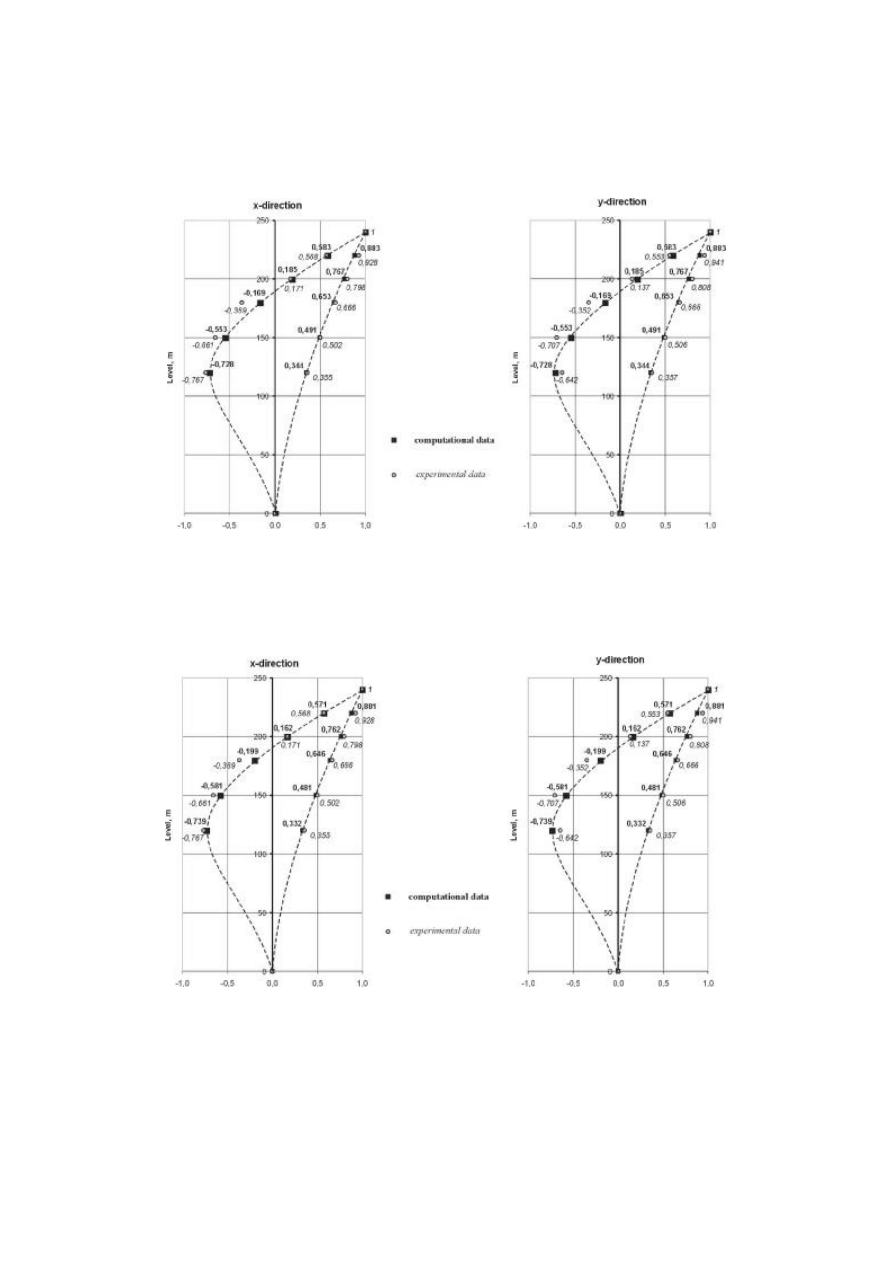
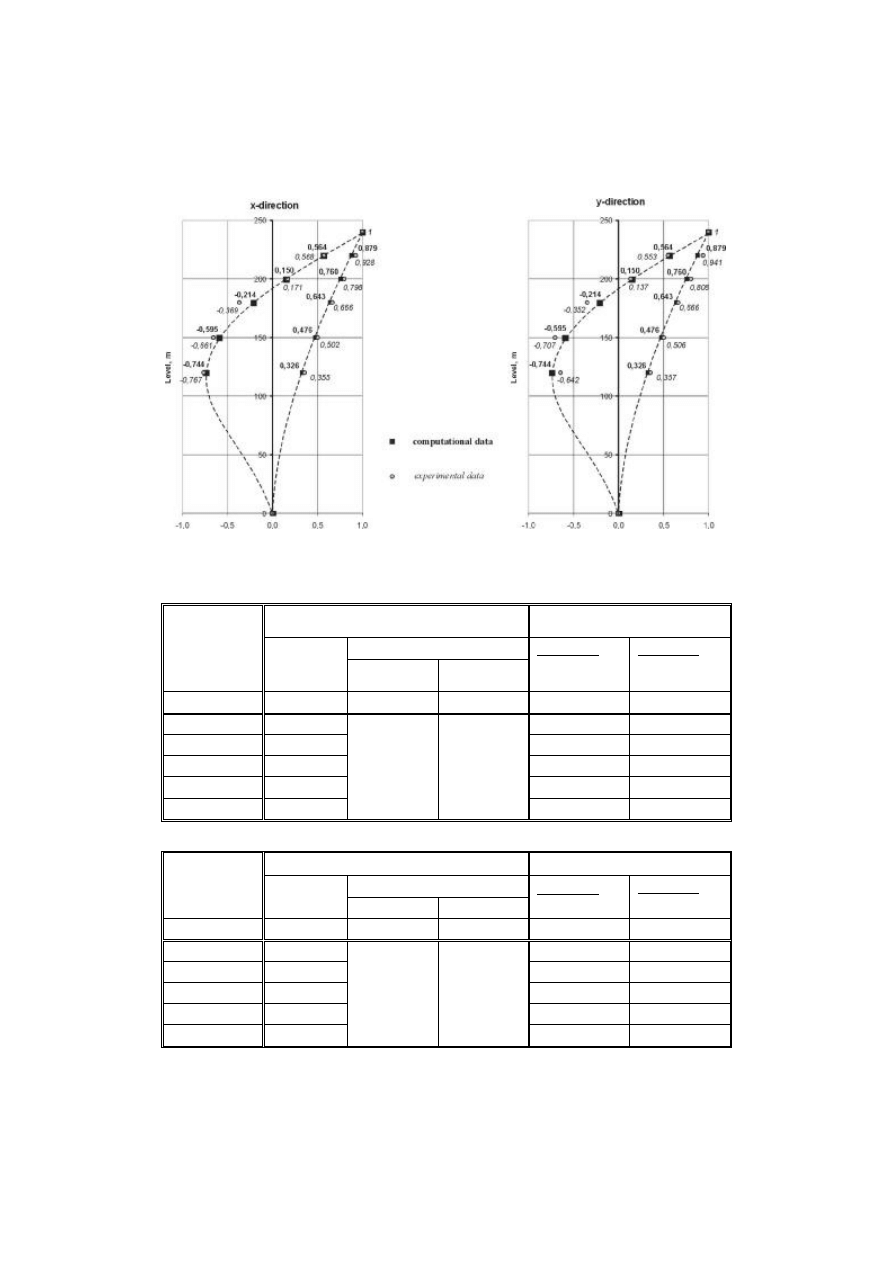
The first and second mode shapes in x and y directions determined from measurements
and these mode shapes calculated on the basis of the theoretical assumptions given in paper
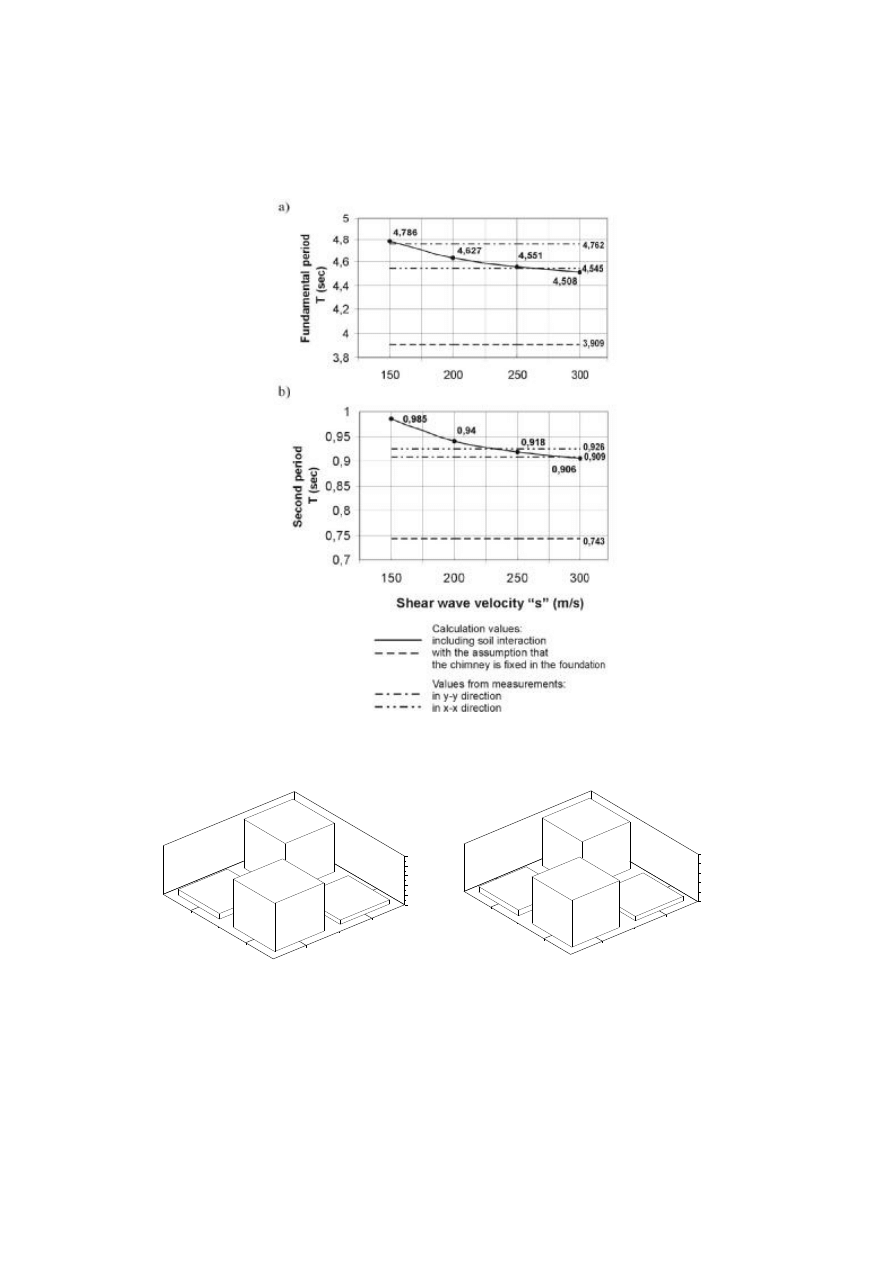
[1] for different values of the shear wave velocity “s” are presented in Figs. 6-8. Fig. 9,
Tables 1 and 2 depict the comparison of the values of the fundamental and second period
taken from measurements and calculations.
30
0
1
2
3
4
5
f [Hz]
0.0001
0.001
0.01
0.1
x [mm/s]
0
1
2
3
4
5
f [Hz]
0.0001
0.001
0.01
0.1
y [mm/s]
0.21
1.08
1.10
0.22
18,25
.
.
Fig. 4. Fourier spectra of velocity response at the height of 240 m / point 1 (2-hour-average)
Fig. 5. Mode shapes in x- and y-direction determined from measurement – the first
and second mode shapes
31
Fig. 6. The comparison of the first and second mode shapes taken from computation
and experiment, s=150 m/s
Fig. 7. The comparison of the first and second mode shapes taken from computation
and experiment, s=200 m/s
32
Fig. 8. The comparison of the first and second mode shapes taken
from computation and experiment, s=250 m/s
Table 1. The comparison of computational and experimental values of the fundamental period of the chimney
First period T
1
, s
The comparison values
Values from measurements
Shear wave
velocity „ s”
Calculation
values
x-x direction
y-y direction
100
3
.
kol
3
.
kol
2
.
kol
×
-
%
100
4
.
kol
4
.
kol
2
.
kol
×
-
%
1
2
3
4
5
6
s = 150 m/s
4,786
5,30
0,50
s = 200 m/s
4,627
1,80
2,83
s = 250 m/s
4,551
0,13
4,43
s = 300 m/s
4,508
0,81
5,33
s =
¥
3,909
4,545
4,762
13,99
17,91
Table 2. The comparison of computational and experimental values of the second period of the chimney
Second period T
2
, s
The comparison values
Values from measurements
Shear wave
velocity „ s”
Calculation
values
x-x direction
y-y direction
100
3
.
kol
3
.
kol
2
.
kol
×
-
%
100
4
.
kol
4
.
kol
2
.
kol
×
-
%
1
2
3
4
5
6
s = 150 m/s
0,985
6,37
8,36
s = 200 m/s
0,940
1,51
3,41
s = 250 m/s
0,918
0,86
0,99
s = 300 m/s
0,906
2,16
0,33
s =
¥
0,743
0,926
0,909
19,76
18,26
33
Fig. 9. The comparison of computational and experimental values of the fundamental period
(a) and the second period (b) of the chimney
Fig. 10. Computation of MAC-values in x- (left) and y- (right) direction, s = 250 m/s
Considering the computation of Modal Assurance Values (MAC, Fig. 10.) for the first
two mode shapes in x- and y-directions, good agreement of the mode shapes from
1
2
mod
e (e
xpe
rime
ntal
)
1
2
mod
e (c
om
puta
tiona
l)
0
0.2
0.4
0.6
0.8
1
M
A
C
0.1151
0.0916
0.9991
0.9821
1
2
mod
e (e
xpe
rime
ntal
)
1
2
mod
e (c
om
puta
tiona
l)
0
0.2
0.4
0.6
0.8
1
M
A
C
0.1155
0.0879
0.9994
0.9899

34
experimental data and numerical computation is confirmed. Main diagonal elements
approximate the ideal value of one. Elements of the secondary diagonal move around 0.1
which means that different mode shapes can be interpreted to be linearly independent.
4. Conclusions
Based on an application of two geophone sensors for an experimental investigation of the
free vibration behaviour for the 250 m high chimney of the Opole Power Station the first and
second natural frequencies and mode shapes could be seperated. It has been shown that an
adjustment of a numerical model which satisfies the standard of civil engineering can be
realized varying the stiffness representing the soil – foundation unit. With regard to the
fundamental period, an approximation of less than 5,4 % in x – and 5,4 % in y – directions
(for four values of “s”) was achieved. Especially in case of comparatively stiff structures
where the fundamental period is dominating this kind of approach is promising. Based on the
adjusted numerical model more realistic computations of the forced response due to the
across and along wind loads are possible.
References
[1] GÓ RSKI P., CHMIELEWSKI T., Free Vibrations of High Industrial Chimney
Interacting with Soil (in Polish), Inż ynieria i Budownictwo, 9/2001, pp. 528-530.
[2] GÓ RSKI P., CHMIELEWSKI T., Free Vibrations of High Industrial Chimney
Interacting with Soil (in Polish), Proc. of the XLVIII Scientific Conference of KILiW
PAN i KN PZITB, Krynica, 16-21 September, 2001 Vol. 2 pp. 67-72.
[3] LUZ E., Zur experimentellen Modalanalyse von Bauwerken, Materialprüfung, No. 28,
pp. 301-306, 1986 (in German).
PORÓ WNANIE TEORETYCZNEJ I DOŚWIADCZALNEJ
ANALIZY DRGAŃ WŁ ASNYCH
WYSOKIEGO KOMINA PRZEMYSŁ OWEGO
Z UWZGLĘ DNIENIEM PODATNOŚCI PODŁ OŻA GRUNTOWEGO
Streszczenie
W pracy przedstawiono doświadczalną analizę drgań swobodnych komina przemysłowego
Elektrowni Opole, otrzymaną na podstawie testów dynamicznych przeprowadzonych na
rzeczywistym obiekcie i porównanie jej z wynikami teoretycznymi, otrzymanymi z
uwzględnieniem podatności podłoża gruntowego pod fundamentem komina. Wzajemne
porównanie obu analiz pozwoliło na uzyskanie ważnych informacji na temat współpracy
podłoża gruntowego z konstrukcją komina. Różnice wyników eksperymentalnych w
stosunku do wyników teoretycznych są małe i potwierdzają konieczność uwzględniania
wpływu podatności podłoża gruntowego na odpowiedź dynamiczną wysokich kominów.
Wyszukiwarka
Podobne podstrony:
Comparison of theoretical and experimental free vibrations of high industrial chimney interacting
Comparison of Human Language and Animal Communication
Comparison of the Russians and Bosnians
A Comparison of Plato and Aristotle
A Comparison of the Status of Women in Classical Athens and E
Resuscitation Hands on?fibrillation, Theoretical and practical aspects of patient and rescuer safet
Comparison of the U S Japan and German British Trade Rivalr
Comparison of Plato and Aristotle's Political Theories
Comparison Of Judaism And Christianity
Comparison of cartesian vector control and polar
Alta J LaDage Occult Psychology, A Comparison of Jungian Psychology and the Modern Qabalah
12 Angry Men Comparison of the Movie and Play
Compare how Hobbes and Augustine think the condition of war a
1 1 William Blake Songs of Innocence and Experience (Selected poems)
A comparison of Drosophila melanogaster detoxication gene induction responses for six insecticides,
Gade, Lisa, Lynge, Rindel Roman Theatre Acoustics; Comparison of acoustic measurement and simulatio
więcej podobnych podstron