
65
Jażdżewska Iwona, 2013, The Warsaw – Lodz Duopolis in the light of the changes
in the urban population density, in: Mądry Cezary (ed.), Regions and their socio-
economic growth, Bogucki Wydawnictwo Naukowe, Poznań, p. 65-77
Jażdżewska Iwona
Departament of Geographical Science
University of Lodz
Lodz, Poland
The Warsaw – Lodz Duopolis in the light of the changes in the urban
population density
Abstract: The article presents the changes in the urban population density in
the 20
th
c., in central Poland, in an area where the two largest Polish cities –
Warsaw and Lodz are situated, within a distance of 120 km from each other.
The analysis was conducted by means of a statistical method used for
estimating discret distributions – the kernel function method. The
conclusions served the purpose of presenting the changes which took place
around these cities, as well as an academic discussion regarding the
condition and the future of the duopolis in the light of the discussed factor.
Key words: Warsaw, Lodz, Poland, duopolis, population density, GIS,
kernel function
Introduction
The concept of the Warsaw – Lodz duopolis has been debated with different
intensity since the late 1990’s. It was a subject widely discussed by Professor
Tadeusz Markowski from the Faculty of Urban Management, University of Lodz,
both in the academic context and from the local government perspective
1
.The issue
was also brought up by Kukliński. It can be considered on multiple planes of the
interconnections between the two cities, regarding e.g. economy, infrastructure,
local authority or social problems. It is certain that the inhabitants of these
agglomerations have to be a part of these interconnections. The number of the
population and, consequently, the population density, are among the factors
determining the formation of a duopolis. Therefore, they underwent a spatial and
temporal analysis.
1
The Presidents of the two cities met in 2002 and 2011; in 2001 – Wojciech Kozak and Krzysztof
Panas, and in 2011 - Hanna Gronkiewicz-Waltz and Hanna Zdanowska.

66
In the 20
th
c., the population density in the majority of cities was growing all
over Poland, including the Warsaw and Lodz area, along with the level of
urbanization, calculated as the percentage of the urban population. It was not a
continuous process, though. It stopped when the Second World War broke out, after
which many cities and towns never regained the previous number of population (e.g.
Brzeziny). In the communist period, the strong pressure towards industrialization
caused mass migrations to cities and an increase in their population. However, this
process changed at the turn of the 20
th
and 21
st
c. The direction of the migrations
changed, the population growth rate decreased and the number of people inhabiting
many urban centres started to shrink. Demographic processes and urbanization
affected the density of urban population, which was not evenly distributed within the
geographical space of Poland. This can be observed on the maps presenting the
concentration of towns/cities and the urban population density in individual decades
of the 20
th
c (Jażdżewska 2009).
The article presents the results of the analysis of the changes in the urban
population density in central Poland, where the two largest Polish cities – Warsaw
and Lodz – were situated 120 km apart. The author believes that it is worth
observing the changes which take place around these cities and thinking whether it is
possible for a duopolis to be formed.
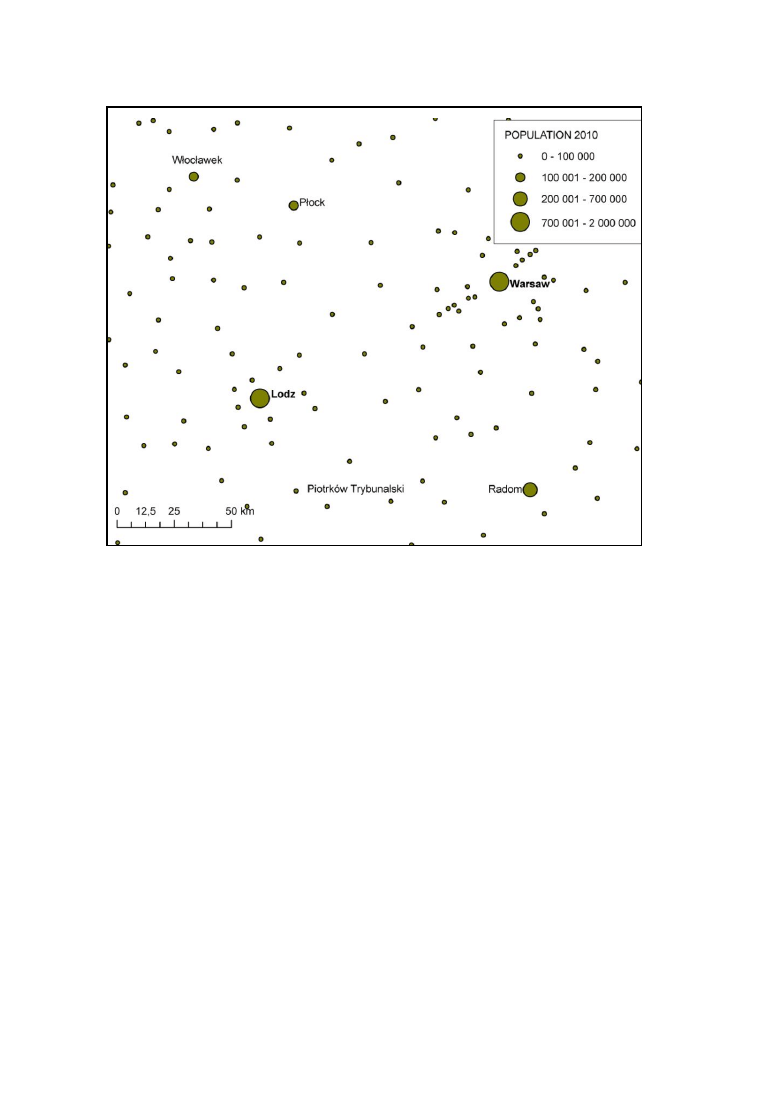
The study area and data sources.
The analysis regards a fragment of Poland covering 45,000 km
2
, with 147
towns and cities inhabited by the total of about 5 million people in 2010, including
the Warsaw and the Lodz agglomerations (Fig.1). It is an area which belonged to the
Polish state after 1918.
The author used the data established in the National Censuses in Poland, in
1931, 1950, 1960, 1970, 1978, 1988, 2002, as well as the Main Statistical Office
information regarding the year 2010. The author also made use of a lattice graph
of
towns and cities presented as points, which were ascribed the number of inhabitants
in a given census year. It was not only the number of inhabitants that was changing
in the 20
th
c. in Poland, but also the number of towns. New towns were established,
some towns were incorporated into other towns, and some lost the municipal rights
(Jażdżewska 2009).This fact was taken into account for each census year and the
actual number of towns was quoted.
Methods of presenting the population density
The maps of population density are prepared in many ways, and their basic
task is to present this phenomenon in space in as much detail and as truthfully as
possible. They were usually constructed with the use of a cartogram, where for given
administrative units (e.g. gminas, powiats, voivodeships) the authors presented
the quotient of the number of population divided by the area of the spatial unit
67
Figure. 1. Study area
Source: author’s compilation
(Ratajski 1989). If an analysis comprises several census periods, the results may be
presented in accordance with the administrative division valid for the census year,
but comparing them with the next census year requires additional work, which
involves estimating the number of population in new administrative units. In the
case of Poland, we deal with frequent changes of administrative borders, both on the
international (1918-1945) and national scale, such as the fluctuating number and
range of voivodeships after 1945, abolishing and establishing powiats, establishing
new gminas, incorporating some settlement units into cities/towns, or isolating
separate towns from larger ones. The traditional method of estimating the population
density seemed too sensitive to the changes of the borders of administrative units,
therefore it was abandoned and replaced with a different way of presentation, called
the kernel function.
The kernel function method.
The tool chosen for the analysis of the concentration of towns/cities, as well
as the urban population density was an estimation method called kernel function.
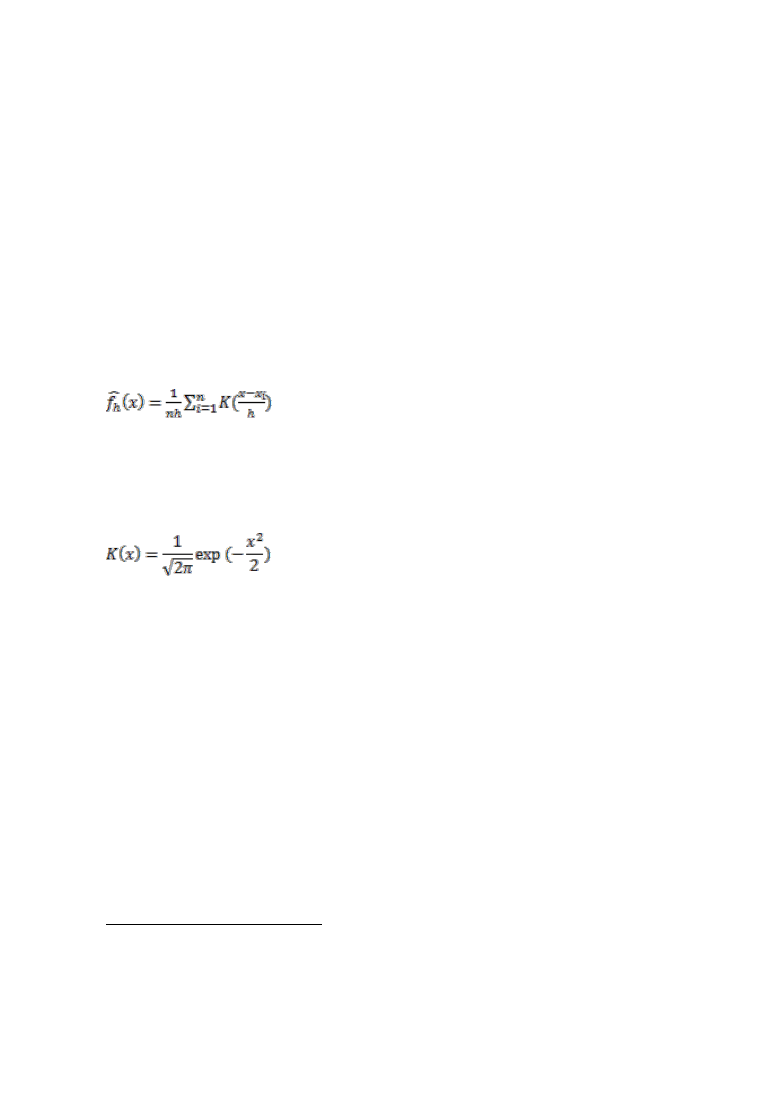
68
Using it eliminates the problems which arise while comparing the results of cross-
section studies from different periods of time, in which changes of the administrative
system occurred (Longley P.A. et al. 2008, Silverman 1981). The results presented
on the map do not depend on the administrative borders, but only on the number of
points and the ranks ascribed to them, as well as the values of the parameters used in
the method.
The kernel function method makes use of a set of points in space. Here,
towns were represented by points, where one of the attributes was the number of
inhabitants. This means that the data was represented by discret objects and met the
requirements of the method. With this type of data, the density measurement is taken
not by means of interpolation but estimation of the density distribution. It is a non-
parametric method, related to kernel estimators (kernel function). The function is
expressed by the following formulas:
,
where n means the size of the sample and h is the bandwidth, and x
1
, x
2
,…,
x
n
are the points of the n-element random sample (Peters 2011).
Where K is the kernel function of certain properties, e.g. it is symmetrical
about zero or integrates to the value of 1. It usually takes the form of the Gaussian
function:
Probability density function depends primarily on the value of parameter h,
called the bandwidth; the higher the value the flatter the function (Longley P.A. et
al. 2008, p. 344).
The method is constructed in the following way: first a lattice of squares is
created for a given area (the length of the sides of each square is selected subjectively
and depends on the scale of the map and the meticulousness of the study)
2
. Next, a circle
of a chosen radius is delineated around each square; inside each circle the number of
settlement points is counted. The important thing is to apply the appropriate length of the
radius, because if it is too long, the results become overgeneralized, and if it is too short,
the results become too detailed. In the present analysis of the town/city concentration,
the radius r = 50 km, the length of the square side is 1 km, and in the analysis of the
urban population density – r = 25 km and the length of the square side is 0.5 km.
Study results
The analysis regarded a series of maps presenting the urban population
density in census years, and was carried out by means of the kernel function method.
2
The author used the ArcMap 9.2 software by ESRI, Spatial Analysis module.
69
Each map presents the current number of towns/cities in a given census year, as well
as the estimated density. The method was chosen because it disregards the changing
administrative divisions in Poland during the studied period. The scales of the maps
are the same and the map keys were standardized in order for the maps to be
comparable.
It should be noticed that in the 20
th
c., in the area under study (Fig.1), the
number of towns increased from 104 in 1931 to 147 in 2010. They were mainly
small towns, with 2-20 thousand inhabitants. At the same time, the increase in the
total number of town inhabitants in the studied area was considerable – it nearly
doubled; in 1931 it did not exceed 3 million and in 2010 it was over 5 million
people. In the 20
th
c., both, the spatial distribution of towns and the urban population
density were changing (Fig.2-8). The analysis will regard first of all the changes
taking place within the radius of 60 km from Warsaw and Lodz (half the distance
between them).
In 1931, thirteen years after Poland regained independence, the distribution
of towns in central Poland was relatively even, with the exception of the Lodz
agglomeration, where there were ten towns within the distance of 25 km from the
city. At that time the number of towns around Warsaw was 50 % smaller.
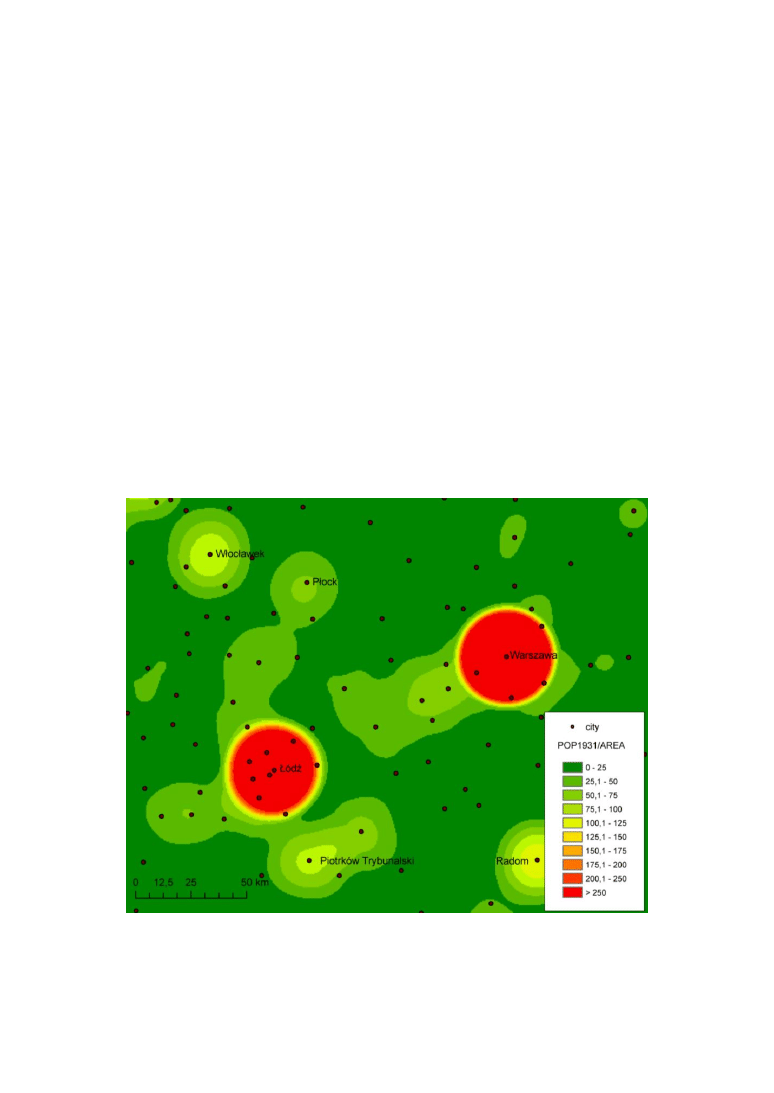
Figure. 2 Urban population density (1931)
Source: author’s compilation - kernel function
70
While the distribution of towns in 1931 was quite even, the urban population
was highly concentrated (Fig.2). Two agglomerations stand out in particular: the
Warsaw and the Lodz agglomerations. The former one is dominated by the city of
Warsaw and the urban population spreads from there to the south-west, along the
railway line, through Pruszków, Grodzisk Mazowiecki, Żyrardów, Skierniewice and
Łowicz. In the latter one, the urban population spreads in three directions:
westwards (Zduńska Wola, Sieradz), southwards (Piotrków Trybunalski, Tomaszów
Mazowiecki) and northwards (Zgierz, Ozorków, Łęczyca towards Płock). It is
interesting to notice that the urban population density is not higher in the area
between the Warsaw and the Lodz agglomerations. We may not talk about a
duopolis yet.
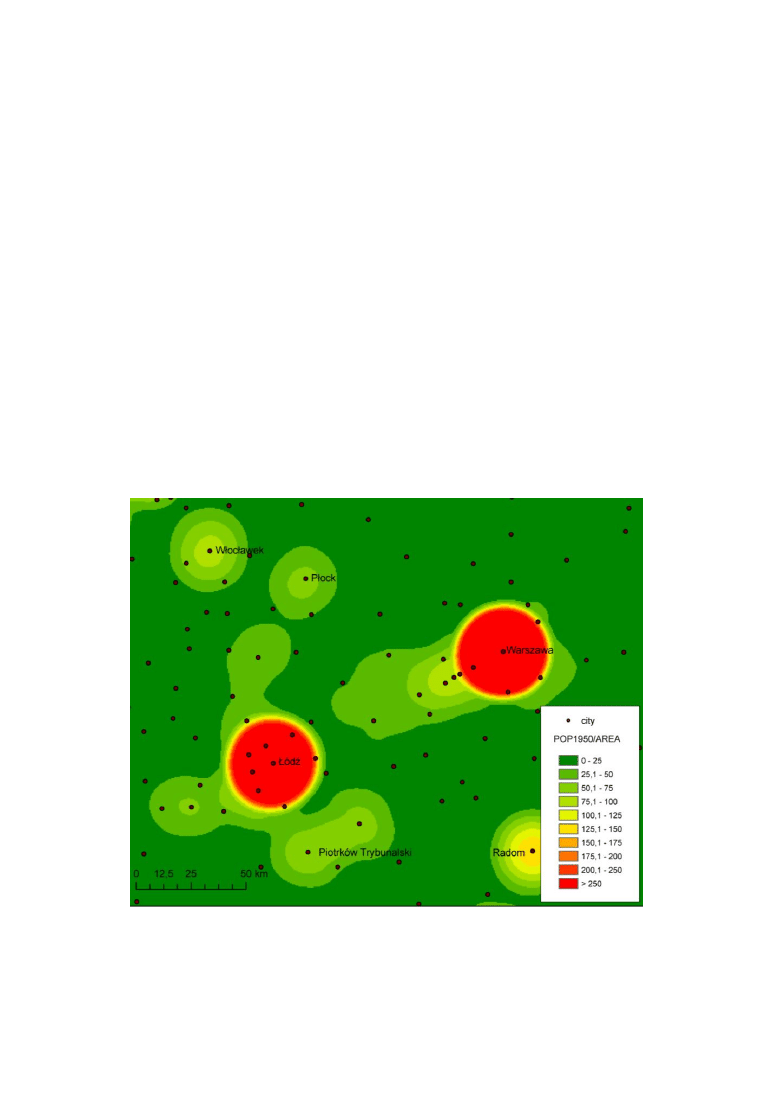
After the Second World War, the small town of Ruda Pabianicka was joined
to Lodz, new towns of Brwinów and Milanówek were founded near Warsaw, as well
as Koluszki – 25 km south-east of Lodz. In 1950, only small changes in the
concentration of towns and the population density could be observed near Warsaw
in the direction of Lodz (Fig.3).
After ten years, we could observe changes in the concentration of towns and
the urban population density in the studied area mainly near Warsaw; municipal
Figure. 3 Urban population density (1950)
Source: author’s compilation - kernel function

71
rights were given to Karczew, Legionowo, Piastów and Zielonka; the area and urban
population density of the Warsaw agglomeration increased in all directions. In the
east it included Mińsk Mazowiecki, in the south – Góra Kalwaria, in the north –
Serock, in the west – Sochaczew, and what is very important – it linked to the Lodz
agglomeration, which did not change its basic shape in 1950-1960, but connected
with Płock. The locality outside its borders which received municipal rights was
Zelów (Fig.4).
In 1960-1970, the following towns were established in the Warsaw
agglomeration: Podkowa Leśna, Ożarów Mazowiecki, Marki, Ząbki, Kobyłka,
Sulejówek, Konstancin Jeziorna, Tłuszcz and Tarczyn. As a result the concentration
of towns changed; they formed the rings of an ellipsoid, whose longer part ran along
the railway line (Fig.5). In the western part of the agglomeration we could observe
an increased population density; the connection with the Lodz agglomeration was
getting stronger, but the Warsaw agglomeration was also spreading eastwards.
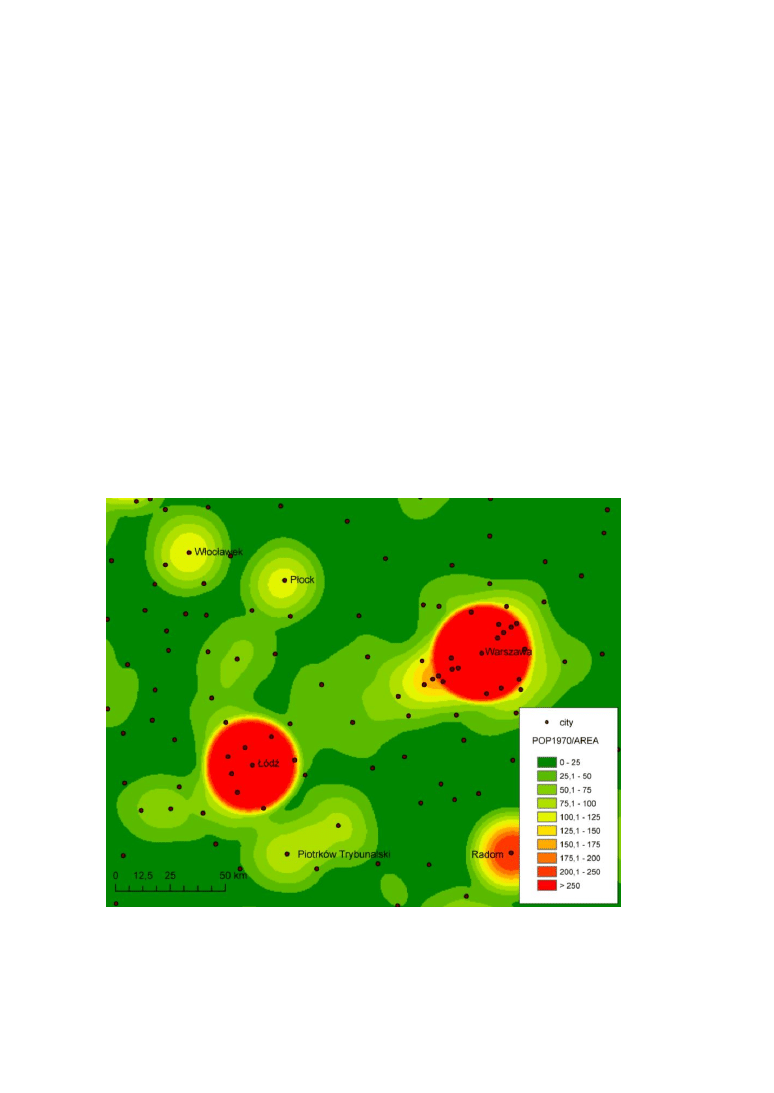
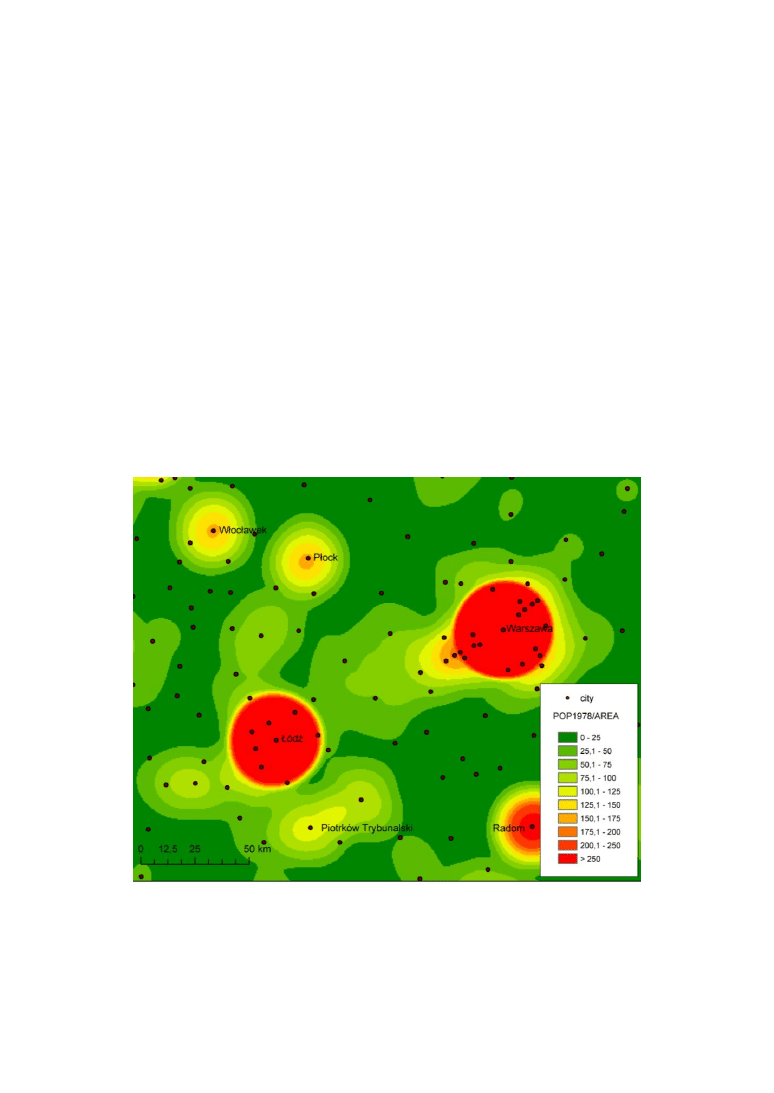
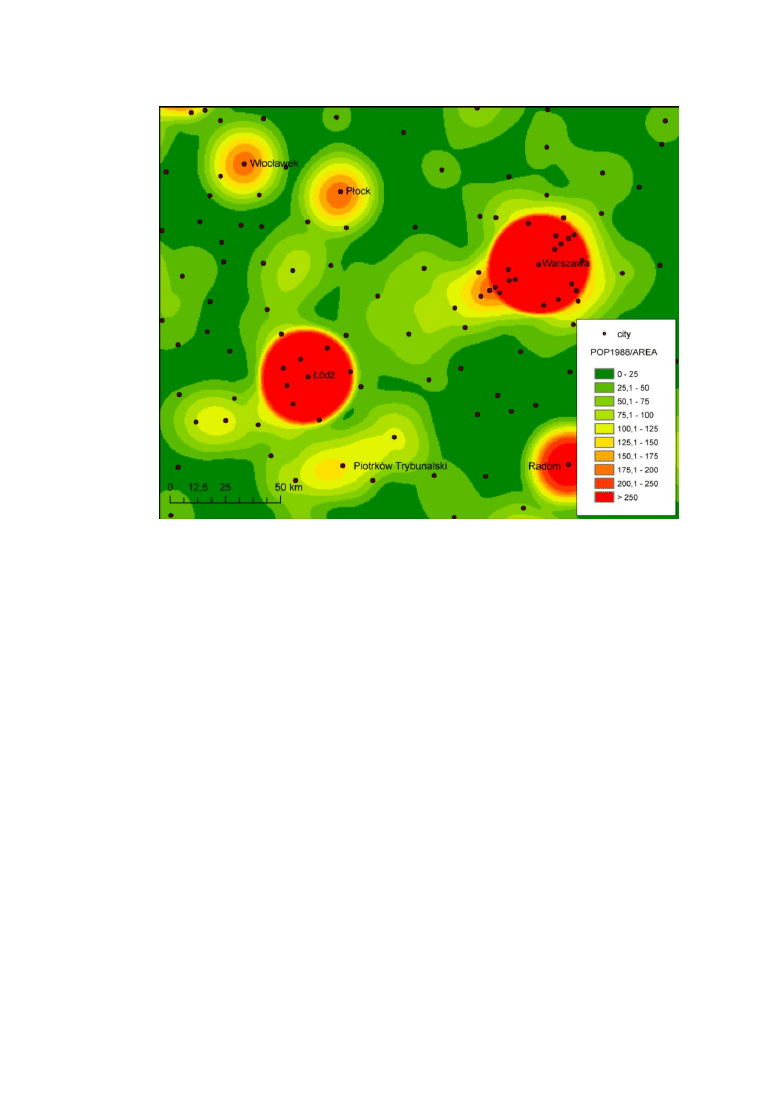
In 1970 – 1988, the process of urbanization in Poland was advancing, which
can be observed on the maps of the urban population density (Fig. 6,7). Moreover, in
1975, an administrative reform was introduced, which increased the number of
voivodeships to 49 and abolished the division into powiats.
Figure. 4 Urban population density (1960)
Source: author’s compilation - kernel function
72
Several medium-sized towns situated in the studied area were promoted to the rank
of the voivodeship capital: Sieradz, Piotrków Trybunalski, Płock and Radom. After
1970, the sanctions regarding compulsory registration were lifted and a large
number of migrants could register as the residents of Lodz and Warsaw, thus
increasing the population density in these cities. This, however, did not increase the
population density around them. The Warsaw agglomeration was still spreading
towards Lodz, but it also incorporated Wyszków. On the other hand, the Lodz
agglomeration was increasing its territory around Bełchatów. By 1988 further
serious changes of the urban population density had taken place around Warsaw,
whose range of influence grew considerably, not only westwards, but also to the
north-east, towards Wyszków and Pułtusk. There also appeared satellite towns
around this agglomeration: Józefów, Płońsk, Garwolin and Ostrów Mazowiecki. The
Lodz agglomeration also increased its population density, not only near Lodz, but
also around Piotrków Trybunalski and Tomaszów Mazowiecki, as well as Sieradz,
Zduńska Wola and Kutno. Ciechanów and Mława form an area with elevated
population density, which may link to the Warsaw agglomeration. In the south of the
Lodz agglomeration, Bełchatów became an area of elevated population density, due
to the investments in the brown coal mine and the power plant.
Figure. 5 Urban population density (1970)
Source: author’s compilation - kernel function
73
In the south-east, Radom is increasing its zone, connecting with the Lodz
agglomeration through the Opoczno region and towards Kozienice with the towns
situated to the east.
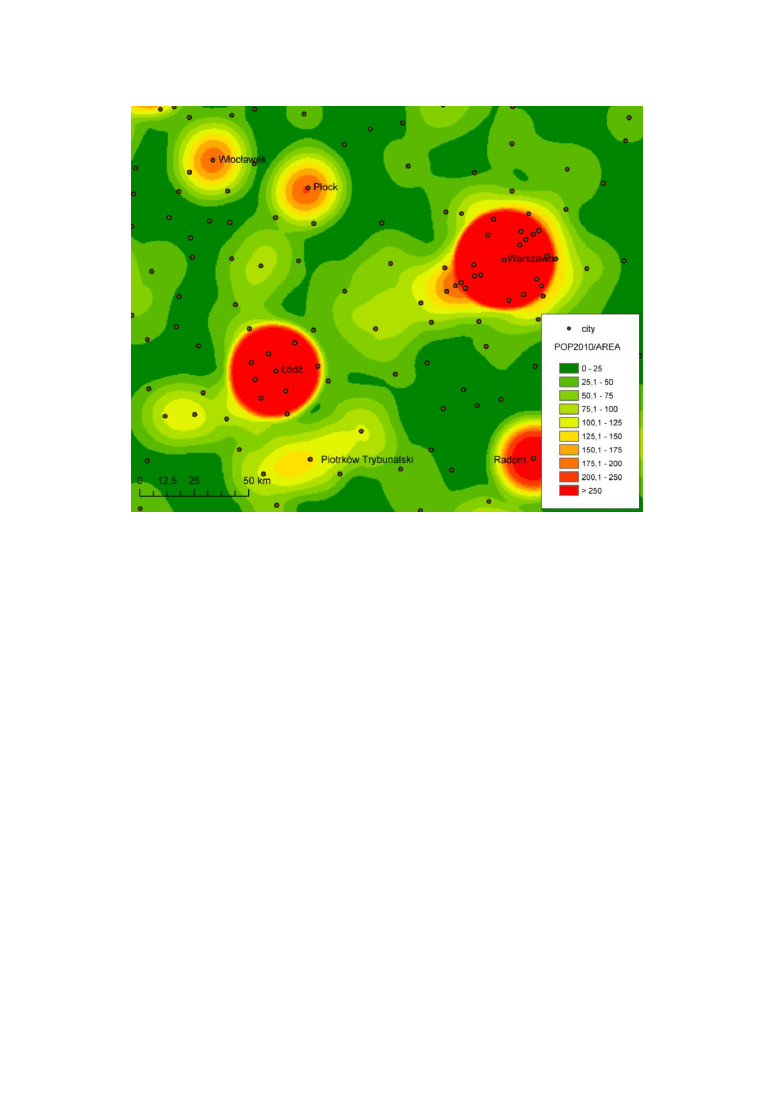
Other towns established near Warsaw by 2002 included Halinów,
Łomianki, Piotrków Kujawski, Skępe, Bieżuń, Pilawa, Drzewica and Glinojeck. The
expansion of the Warsaw agglomeration westwards slowed down (fig. 8) or even
stopped the development in towns like Żychlin, Brzeziny or Łowicz, due to the
decreasing number of inhabitants. Instead, the agglomeration developed in other
directions, especially northwards. The Lodz agglomeration did not significantly
increase its area; only in the south Bełchatów joined Piotrków Trybunalski and
Tomaszów Mazowiecki – together they form a complex of towns with an elevated
urban population density. In the first decade of the 21
st
c., the changes in the urban
population density were not so rapid as before. It may be said that it became
stabilized in this part of Poland. At present, we may observe other changes
approaching, antagonistic to the previous ones. The falling number of the population
of the towns situated on the border of the mazowieckie and łódzkie voivodeships,
Figure. 6 Urban population density (1978)
Source: author’s compilation - kernel function
74
Figure. 7 Urban population density (1988)
Source: author’s compilation - kernel function
such as Brzeziny, Głowno, Łowicz or Żychlin, is the reason why the areas east of
Lodz experience an urban population regression. Are there any chances for the
formation of a cohesive, strong duopolis in this situation?
Conclusions
The 20
th
c. witnessed significant changes in the urban population density in
central Poland. The increase in the number of the urban population from three to five
million changed its spatial distribution considerably. In 1931, two agglomerations
(Warsaw and Lodz) concentrated urban population, while in the larger part of the
studied area the population density was low. It is interesting to observe how it has
been changing around the Warsaw and the Lodz agglomerations. For many years,
the Warsaw influence zone was spreading westwards, towards Lodz, but in the
1980’s, it started to expand in other directions. During the studied period, municipal
rights were given to 16 towns situated up to 25 km from the capital, which together
with the remaining towns and the capital itself were inhabited by about 2.5 million
people. On the other hand, the greatest changes in the Lodz agglomeration were
recorded before 1988 and followed by regression in the next years (except
75
Figure. 8 Urban population density (2010)
Source: author’s compilation - kernel function
Bełchatów). At the beginning of the 20
th
c., Lodz and the towns in the
agglomeration were inhabited by about 1.5 million people.
The analysis of the Warsaw agglomeration spreading along the railway line
makes you wonder. Firstly, it may be assumed that the modernized railway line
between the two cities will tighten the bonds between them. Secondly, the A2
motorway, running northwards, will connect them even stronger. However, for ten
years, the falling number of people inhabiting the towns east of Lodz, such as
Głowno, Brzeziny, Łowicz, Rawa Mazowiecka or Biała Rawska has been the reason
why the area between Lodz and Warsaw does not have a chance of increasing the
urban population density in the near future. Looking at the series of maps presenting
the changes in the population density in the cities and in the towns between them in
the 20
th
c., we must conclude that if the duopolis were to become a fact, there would
have to be population changes in the towns situated east of Lodz. Despite the many
discussions regarding the chances and the need for a duopolis, as well as the benefits
both cities would enjoy, the whole issue is still highly questionable, especially as
regards the studies of the urban settlement network in this region. The
distinctiveness of the settlement system between the Lodz and the Warsaw

76
agglomerations has been observed for a long time (Jażdżewska 2008). From this
point of view, one may have reservations as to the sense of creating the duopolis in
the nearest future. (Jażdżewska 2006, p. 253). And not because of Warsaw’s
aversion to cooperating with Lodz, but the historical and contemporary conditions of
the spatial development of the Lodz agglomeration (Jażdżewska 2002), which has
been turning its back on the capital and spreading in other directions for over 100
years. Perhaps improving the accessibility by transport will change this tendency,
but it is a matter of a distant future.
References
Jażdżewska I. 2008, Przemiany miejskiej sieci osadniczej w Polsce w świetle metod
matematycznych, WUŁ, Łódź
Kraak M. J. ,Ormeling F. 1998, Kartografia wizualizacja przestrzenna danych,
PWN, Warszawa
Longley P. A., Goodchild M. F., Magiure D. J., Rhind D. W., 2008, GIS. Teoria i
praktyka, PWN, Warszawa
Peters S. 2011, Interactive Scale-dependent multidimensional Point Data Selection
Rusing enhanced Polarization Transformation, [w:] A. Ruas (red.) Advances in
Cartography and GIScience. Volume 1, Selection from ICC 2011 Paris, Springer
Heidelberg Dordrecht London New York, p. 387-409
Ratajski J., 1989, Metodyka kartografii społeczno-gospodarczej, PPWK
Warszawa-Wrocław
Silverman B. V., 1981, Using Kernel Density Estimates to Investigate
Multimodality, Journal of the Royal Statistical Society, Series B (Methodological),
v.43, Issue 1, p. 97-99
Donthu Naven, Rust Ronald T., Estimating Geographic Customer Densities Using
Kernel Density Estimation, Marketing Science, Vol. 8, No. 2. (Spring 1989), p.191 –
203
Wyszukiwarka
Podobne podstrony:
Jażdżewska, Iwona GIS in the Studies of Łódź Geographers (2014)
Masonry and its Symbols in the Light of Thinking and Destiny by Harold Waldwin Percival
In the Memory of Leonhard Herzenberg# Caravan, No 20, February, Moscow, 2013, pp 9 26 (by the Cultur
Łuczak, Andrzej Quantum Sufficiency in the Operator Algebra Framework (2013)
Kulesza, Mariusz The origin of pre chartered and chartered urban layouts in West Pomerania (2009)
Hustad A M The North Russian Lament in the Light of the Religious Songs of the Old Believers 1981
Kołodziejczyk, Ewa Literature as a Source of Knowledge Polish Colonization of the United Kingdom in
Reichelt, Melinda English language writing instruction in Poland Adapting to the local EFL context
interactive art vs social interactions analysis of interactive art strategies in the light of erving
Tarabasz, Anna The reevaluation of communication in customer approach – towards marketing 4 0 (2013
Chapman The Interpretation of Certain Verses of the First Chapter of Genesis in the Light of Paleont
Risk of Cancer by ATM Missense Mutations in the General Population
Lumiere du monde Light of the World Hymn Światowych Dni Młodzieży Kanada Toronto 02
CONTROL AND THE MECHANICS OF START CHANGE AND STOP
The most popular tenses (english)
3 By the light of the Moon Gasq Dion, Sandrine
Gabrielle Evans Moonlight Breed 2 By the Light of the Moon
1969 US Army Vietnam War Minimanual of the Urban Guerrilla 31p
więcej podobnych podstron