
Health and Safety Laboratory
Harpur Hill
Buxton
Derbyshire SK17 9JN
Project Leader:
Paul Pitts
Author(s):
Paul Pitts BSc(hons) MIOA
Science Group:
Human Factors Group
© Crown copyright 2004
Hand-arm vibration emission of chainsaws –
comparison with vibration exposure.
HSL/2004/13


iii
PRIVACY MARKING:
Available to anyone
This report and the work it describes were undertaken by the Health and Safety Laboratory
under contract to the Forestry Commission. Its contents, including any opinions and/or
conclusions expressed or recommendations made, do not necessarily reflect policy or views of
the Health and Safety Executive.
HSL report approval:
Dr L Kenny
Date of issue:
July 2004
Job number:
JC4500006
Registry file:
NV/07/2002/21089
Electronic filename:
Report final V4-2.doc
RESTRICTED: COMMERCIAL

iv

v
CONTENTS
1
INTRODUCTION
1
1.1
Background
1
1.2
Objectives
1
1.3
Project Plan
2
2
STUDY METHODS
3
2.1
Chainsaws
3
2.2
ISO 7505 tests
3
2.3
Hand-arm vibration forest measurements
3
2.4
Exposure time studies
6
3
RESULTS
9
3.1
ISO 7505 tests
9
3.2
Hand-arm vibration forest measurements
9
3.3
Exposure time Studies
10
3.4
Estimations of daily vibration exposures
12
3.5
Differences in daily exposure estimates
25
4
DISCUSSION
29
4.1
ISO 7505 test results
29
4.2
Exposure times
31
4.3
In-Forest vibration values
32
4.4
Ranking of chainsaws
32
4.5
Methods of estimating daily vibration exposure
34
4.6
Simplified exposure estimation
35
4.7
Example of the use of the simplified exposure estimation method
35
4.8
Recommendations on the use of the simplified estimation method
36
5
CONCLUSIONS
37
5.1
Emission test results
37
5.2
In-forest test results
37
5.3
Simplifcations of exposure based on published Emission values
37
6
ACKNOWLEDGEMENTS
38
7
REFERENCES
39
8
GLOSSARY
40
ANNEX A
CHAINSAW DETAILS
42
A.1
Saw A
42
A.2
Saw B
42

vi
A.3
Saw C
42
A.4
Saw D
42
A.5
Saw E
43
ANNEX B
HAND-ARM VIBRATION FOREST MEASUREMENTS
44
B.1
Sample of analysis – showing detail of frequency analysis
44
B.2
Summary of Vibration total values from in-forest measurements
45
ANNEX C
PREDICTION OF EMISSION VALUES
50
C.1
Prediction of vibration emission values from in-forest data
50
ANNEX D
STATISTICAL ANALYSIS OF SAW MODE DIFFERENCES
51
D.1
Forest activity modes
51
INDEX TO TABLES AND FIGURES
53

vii
EXECUTIVE SUMMARY
BACKGROUND
The manufacturer’s declared vibration emission of a hand held power tool should be related to
the vibration magnitude a
h
. Unfortunately, for many tool types the relationship is poor and the
vibration emission should not be used as a substitute for the in-use vibration magnitude.
However, evidence from previous HSL studies suggests that for chain saws there is a usable
relationship between emission and exposure.
Vibration exposure is highly dependent on exposure times. These will vary from job to job. To
simplify the estimation procedure, it may be possible to take into account typical exposure times
for a range of common activities.
At its simplest, the estimation procedure could use a simple multiplication factor for converting
from vibration emission to a daily vibration exposure, with tables of constants provided for
standard job types.
OBJECTIVES
The objective of this project was to establish whether it is feasible to produce simplified
methods for estimating daily vibration exposures based on hand-arm vibration emission data
provided by the saw manufacturers.
MAIN FINDINGS
1. All the manufacturer’s published emission values were verified according to the definition
in EN 12096.
2. For the in-forest measurements, the results from saws A, B and D were shown to be not
statistically significantly different and saw E (the top-handled saw) and Saw C show as
being statistically different from the other saws.
3. Ranking test showed that Saw E is the lowest-vibration saw and saw C is the highest, the
others share equal ranking.
4. For all forest operations, except arboriculture and cross cutting, daily exposure consistently
exceed the 2.5 m/s²A(8) exposure action value (EAV) defined in the EU Physical Agents
(Vibration) Directive. In four cases the daily exposure limit value (ELV) of 5 m/s²A(8) is
exceeded, these are all for the use of saw C.
5. There is some scope for simplif ication of exposure assessment, using nominal exposure
times for job categories, rather than exact exposure times.
6. A table of multiplying values has been produced. This can be used for converting emission
values to exposure estimates for the eight job categories seen in this study. Use of this table
has been shown to result in errors in daily exposure estimates in the range from –34% to
+46% when used with published emission data.
7. The use of the simplified exposure assessment methods, based on published ISO 7505 data,
might usefully be used as a first stage vibration exposure assessment, to provide an
indication of likely exposure, but should not be used as evidence that exposure is below an
EAV or ELV, particularly where the predicted exposure value is close to the EAV or ELV.

1
1
INTRODUCTION
1.1
BACKGROUND
Manufacturers and suppliers of hand held power tools, such as chain saws, are required to
provide information on hand-arm vibration emission. For chain saws the vibration emission
values are derived from an ISO Standard test ISO 7505: 1986 “Forestry machinery - Chain saws
- Measurement of hand-transmitted vibration”.
The users, and employers of users of handheld power tools need to assess the risk from
vibration resulting from the use of those tools. A European Directive on Physical Agents
(Vibration) published in July 2002 will result in the introduction of new UK legislation on hand-
arm vibration exposure in 2005. The new legislation will place duties on employers based on an
exposure action value for daily vibration exposure of 2.5 m/s²A(8) and an exposure limit value
of 5 m/s²A(8).
The assessment of hand-arm vibration exposure is based on ISO standard ISO 5349-1:2000
“Mechanical vibration - Measurement and evaluation of human exposure to hand-transmitted
vibration - Part 1: General requirements”. This standard assesses hand-arm vibration exposure
in terms of a daily exposure value, normalised to 8 hours, the A(8) value. This value is
dependent on both vibration magnitude a
h
and exposure time, t. For use of a single power tool:
( )
EightHours
8
T
a
A
hv
=
The vibration emission of a hand held power tool should be related to the vibration magnitude
a
h
. Unfortunately, for many tool types the relationship is poor and the vibration emission should
not be used as a substitute for the in-use vibration magnitude. However, there is some evidence
(Pitts et al 1990) that for chain saws there is a usable relationship between emission and
exposure.
1.2
OBJECTIVES
The objective of this project was to establish whether it is feasible to produce simplified
methods for estimating daily vibration exposures based on hand-arm vibration emission data
provided by the saw manufacturers.
If there is a consistent relationship between the manufacturer’s declared emission values and the
vibration magnitude on a tool handle when in real use, then it becomes possible to estimate
vibration exposure from vibration emission data when the exposure time is known.
The declaration for chain saw vibration emission is based on a combination of results from three
operating mode: idling, cutting and racing. An estimate of vibration exposure may be possible
based solely upon this overall value. However, the results from the individual tests are available,
and it may be necessary to use these individual components when estimating exposures.
Vibration exposure is highly dependent on exposure times. These will vary from job to job. To
simplify the estimation procedure, it may be possible to take into account typical exposure times
for a range of common job types, such as:

2
?
General thinning
?
Clear felling
?
Brashing
?
Crosscutting
?
General woodland maintenance
?
Arboriculture
At its simplest, the estimation procedure could use a simple multiplication factor for converting
from vibration emission to a daily vibration exposure, with tables of constants provided for
standard job types, for example:
( ) (
)
T
e
C
K
a
A
+
=
8
Where a
e
is the emission declaration level (with uncertainty K) and C
T
is a value that accounts
for:
?
The difference between the emission data and the mean vibration magnitude for task T
?
The typical daily exposure time for the task T. This can be considered for a full working
day (assuming an 8 hour standard working day) and for a typical working day (allowing
for shortened days due to weather or movement between sites).
With the values of C
T
being tabulated for various common job types.
1.3
PROJECT PLAN
The project had the following structure:
Phase 1:
Measure vibration emissions of 5 chainsaws, according to ISO 7505;
Phase 2:
Evaluate vibration magnitude during normal operational elements using the 5
chainsaws from phase1;
Phase 3:
By work-study of a cohort of FC foresters, determine the typical exposure
times to the operational modes measured in Phase 2;
Phase 4;
Review the data from Phase 1 – 3 to assess whether manufacturers vibration
emission data can be used, along simple multiplication factors based on job
titles, to provide reasonable estimates of likely daily vibration exposures.
Stihl and Husqvarna, sourced the five chainsaws for testing, and measured vibration emissions
according to ISO 7505 (Phase1 – Results shown in Annex A).
The Forestry Research, Technical Development Branch (FR-TDB) carried out work-study
evaluations (Phase 3 - Results summarised in Annex B) and identified and organised locations
for vibration exposure measurements
The Health and Safety Laboratory (HSL) performed the hand-arm vibration exposure
measurements (Phase 2) and has assessed the data to determine whether simple exposure
estimates are viable.

3
2
STUDY METHODS
2.1
CHAINSAWS
Five chainsaws were used throughout these studies. Stihl and Husqvarna obtained the saws.
They were chosen as being representative of saws of around 50cc capacity available on the
market. The saws used throughout these tests are identified as saws A to E. Details of each saw
are given in Annex A.
2.2
ISO 7505 TESTS
Vibration emission tests were performed by Husqvarna (saws A and B) and Stihl (saws C, D
and E).
ISO 7505 tests require vibration to be measured at two locations on the saw: on the rear handle
and on the top handle. Measurements are made with the saw in three operational modes: idling,
cutting (full-load) and racing.
In idling mode the saw is held stationary in the position normally adopted between cuts (i.e.
near horizontal). The cutting mode requires a cut to be taken through a specified test log while
operating at a specified engine speed that is controlled using the feed force. The racing test is
carried out at 133% of full-load speed, with the saw held as for the idling test.
Five repeats of each test are made; the averages of these are used as the declaration values.
2.3
HAND-ARM VIBRATION FOREST MEASUREMENTS
The original project plan was to perform a small number of “detailed” hand-arm vibration
measurements, followed by a larger number of “simple” measurements using a hand-held
vibration meter. During early “detailed” measurement, it became apparent that the “simple”
measurements were impractical, due to rapid changes of hand-position, and the need to be able
to select carefully sections of data for analysis.
The project plan was changed to allow more “detailed” measurement, with no “simple”
measurements.
Measurements were made in the three UK forests listed in Table 1.
Table 1 Forests and tree types used for vibration measurements
Forests
Region
Tree type
Tree size
(DBH in cm)
Ground type
Ae Forest
Dumfries
Sitka spruce
12 to 30
Upland peat forest
Alport Forest,
Ladybower
Derbyshire
Sitka spruce
14 to 34
Sloped alluvial ground.
Corsican pine
33 to 48
Cannock Chase
Staffordshire
Beech
36
Heathland forest area
sand stone
4
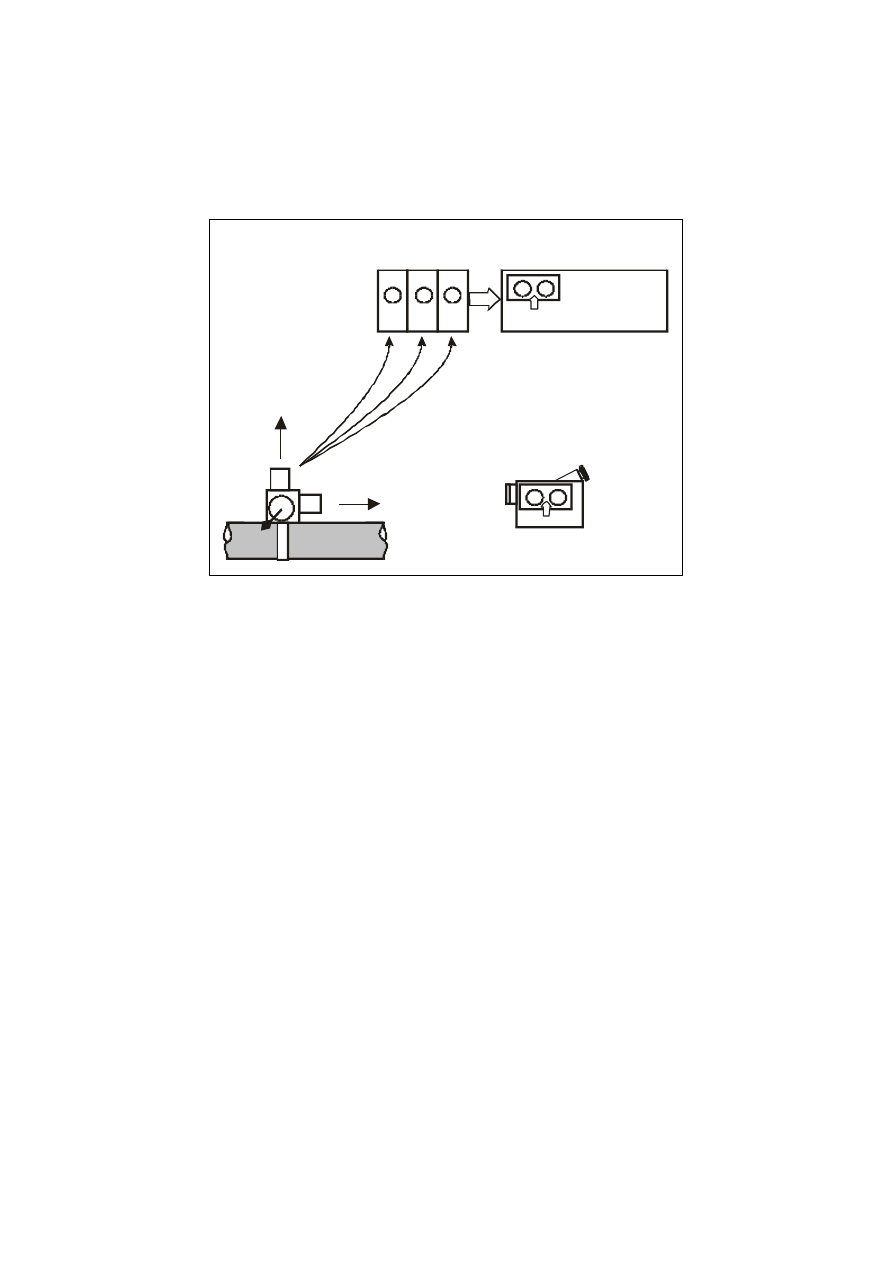
2.3.1 Data recording:
The data recording equipment for the detailed measurements is shown schematically in
Figure 1.
y-axis
y
x
z
Tool handle
Multichannel
data recorder
Camcorder
Charge
amplifiers
x-axis
z-axis
Real time
Real time
Figure 1 Diagram of data recording system
Three Brüel & Kjær type 4393 piezoelectric transducers are fitted to a small aluminium
mounting-block, which is strapped firmly onto the tool handle using a non-ratchet type nylon
cable tie. In the forest environment, three lengths of approximately 20m of high quality
Endevco microdot cable were required between the transducers and the charge amplifiers, to
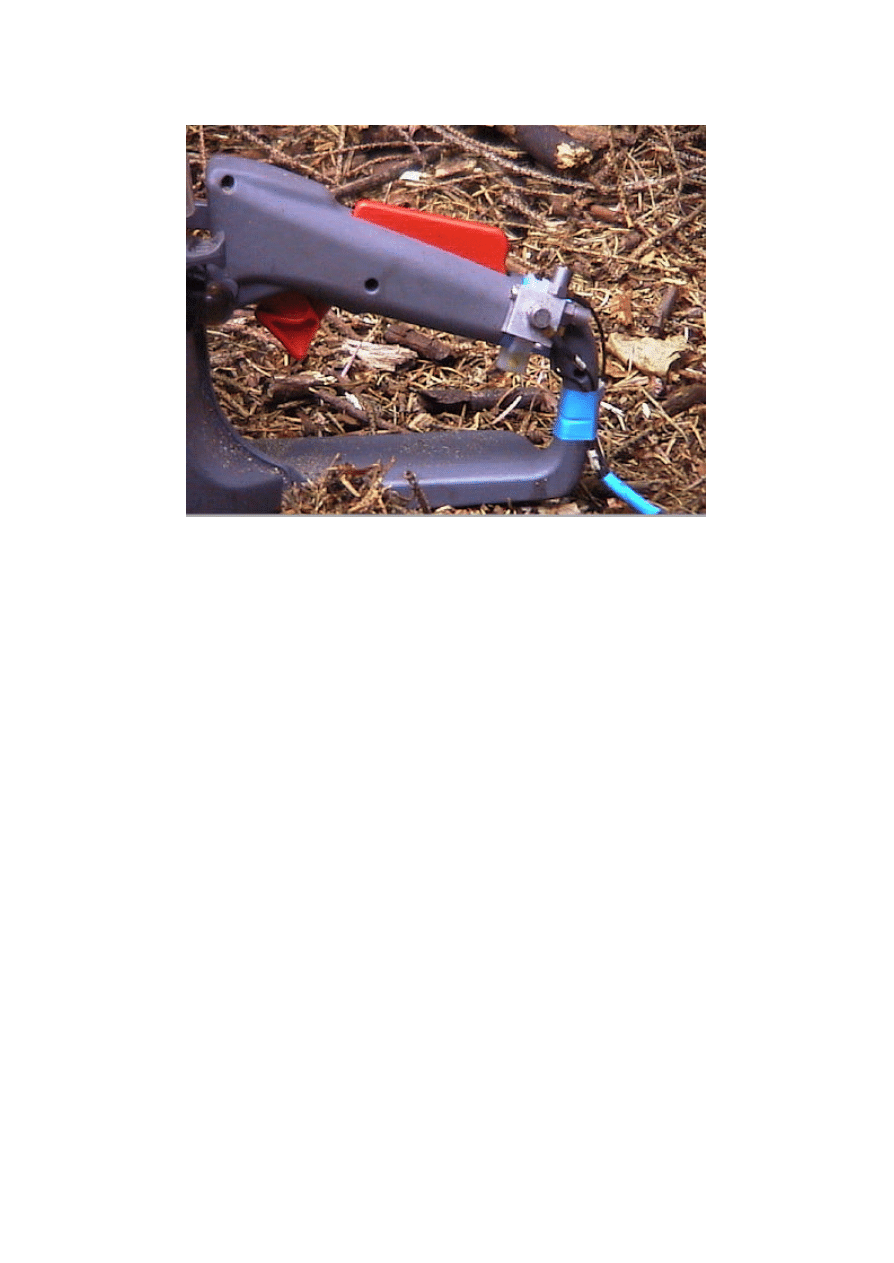
allow a reasonable range of movement by the forester. A photograph showing the transducers
fitted to a chainsaw is shown in Figure 2.
The vibration data were recorded on a TEAC RD135T 8 channel DAT recorder. During all
measurements a camcorder recorded, as far as possible, the movements and activities of the
forester.
5
Figure 2 Example of transducers fitted to rear handle
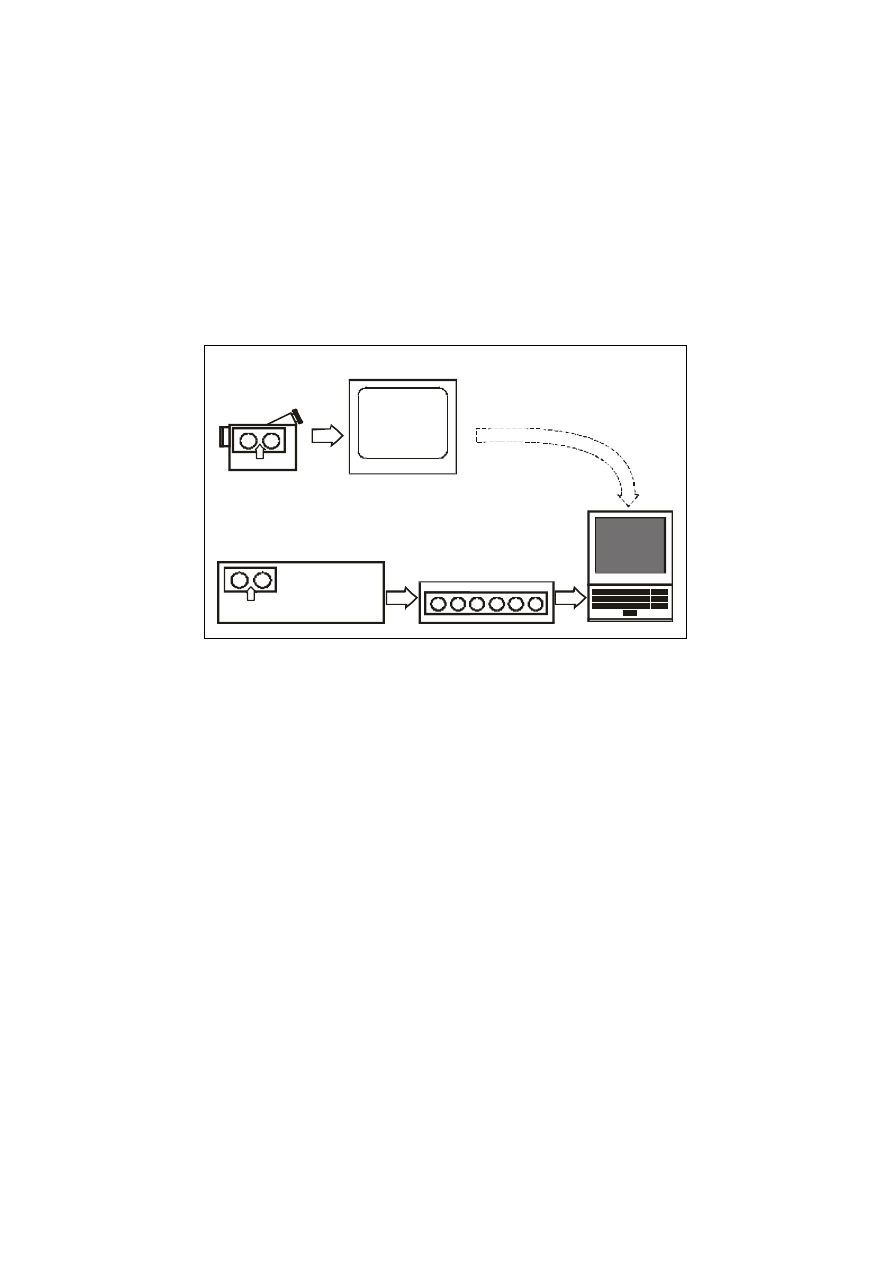
2.3.2 Analysis
The video recordings are used to identify suitable sections of recording for analysis. Periods
where the forester’s hand is in continuous contact with the machine handle being measured are
used for analysis. In some cases, these sections may be as much as one minute; generally they
are much less than this, due to the way the forester continuously changes grip and moves the
chainsaw between hands while moving branches or moving between sections of felled trees.
Analysis of the vibration data recordings is carried out using a Brüel & Kjær Pulse analysis
system (Figure 3). This system provides 1/3
rd
octave-band analysis from 1.6 Hz to 2.5 kHz and
frequency weighted vibration magnitudes for three channels, and a frequency weighted time
history based on the data from one axis.
Note: the measurement and analysis system is capable of handling 6 simultaneous channels of data (i.e. tri-axial data
from two hand positions), however, it was impractical to deal with 6 cables running between the chainsaw and
recording system in the forest environment.
The analyses are being performed based on three basic hand-positions:
?
Rear (throttle) handle (right hand)
?
Top handle (left hand on the top part of the wrap-around handle, used for vertical cuts)
?
Side handle (left hand on the side part of the wrap-around handle, used for horizontal
cuts)
The tasks being carried out are being analysed in categories that can easily be related to the
categories used in the workstudy exercise, they are:
?
Idling (both-hands and one-handed, supported and non-supported)
?
Brashing
6
?
De-buttressing – vertical cut
?
De-butressing – horizontal cut
?
Felling – vertical cut
?
Felling – horizontal cut
?
Snedding
?
Cross-cutting
?
General scrub clearance
Multichannel
data recorder
PC based
data acquisition
and analysis
Camcorder
Monitor
Real time
Real time
Figure 3 Diagram of data analysis system
2.4
EXPOSURE TIME STUDIES
2.4.1 Forest activities
The exposure time studies looked at the following forest activities:
First thinning
Tree size range 0.08 m³ to 0.12 m³ (softwoods)
Sub thin operation
Tree size range 0.15 m³ to 0.25 m³ (softwoods)
Clearfell operation
Tree size range > 0.25 m³ (softwoods)
Brashing
Continuous brashing for subsequent mechanised harvesting (i.e.
removal of the branches and small diameter stems attached to the tree
below breast height diameter (softwoods).
Cross cutting
Continual cross cutting operation, the conversion of the tree stem into
sections using the chainsaw (softwoods).
General clearance
Cutting of wood scrub or birch clearance operation. The species choice
will not affect the method and technique used by the operator
(softwoods and hardwoods).
Arboriculture
With the operator working in the tree: crown lifting, crown reduction or
full pollarding (hardwoods).

7
2.4.2 Time -study chain-saw operating modes
Table 2 identifies the operating modes being assessed. These operating modes were chosen to
provide some consistency with the hand-arm vibration magnitude measurements of phase 2.
Table 3 shows the number of studies for each forest operation type. The time studies were full-
day studies, using activity sampling at time intervals of 0.5 minute.
Table 2 Chainsaw operating modes
Activity Code
Operating mode
A
Saw on ground, no contact
B
Two hands on saw, saw revving no load
B1
Two hands on saw, saw idling, on hip/thigh
B2
Two hands on saw, revving, horizontal, light load
B3
Two hands on saw, revving, vertical, light load
B4
Two hands on saw, horizontal, under load
B5
Two hands on saw, vertical, under load
B6
Two hands on saw, vertical, under load - Delimbing
C
One hand on front handle, saw on thigh, saw idling
C1
One hand on front handle, saw on stem, saw idling
C2
One hand on rear handle, saw on thigh, saw idling
C3
One hand on rear handle, saw on stem, saw idling
C4
One hand on rear handle, saw on ground, revving, no load
O
All other work not requiring handling of an operating chainsaw

8
Table 3 Number of studies per operation type
Operation type
Number of studies
First thinning
3
Subsequent thinning
3
Clearfell
3 in sitka spruce, 1 in pine
Brashing
1
Cross cutting
1
General maintenance/ Clearance
1
Arboriculture/ Tree surgery
2

9
3
RESULTS
3.1
ISO 7505 TESTS
Each of the five chainsaws used in this study was tested, before the forest measurements using
the test procedure specified in ISO 7505. The results for each saw are summarised in Table 4.
Table 4 ISO 7505 emission test results (vibration total values in m/s²)
Emission mode results
Saw
Front (support) handle
Rear (throttle) handle
Emission
averages
Idling
Cutting Racing
Idling
Cutting Racing
Front
Rear
Saw A
5.2
6.1
8.3
6.1
12.9
7.4
6.5
8.8
Saw B
7.0
6.1
5.3
6.5
4.7
7.0
6.1
6.1
Saw C
3.7
7.0
4.3
5.5
8.5
11.3
5.0
8.4
Saw D
4.0
5.8
5.0
6.6
6.4
3.1
4.9
5.4
Saw E
4.4
5.6
4.1
7.4
6.0
4.9
4.7
6.1
3.2
HAND-ARM VIBRATION FOREST MEASUREMENTS
Due to the highly variable use of hand-position and operating mode of chainsaws in forestry, the
analysis of vibration values has needed to be broken up into periods where the hand is in contact
with the handle (or part of the handle) to which the vibration transducers are attached. Saws A
to D had measurements made at three locations:
?
Throttle (rear) handle,
?
Top of the support (front) handle,
?
Side of the support (front) handle
For saw E, the top-handled saw, there was insufficient space on the handle to perform
measurements actually on the throttle handle. However, it has been assumed that the support –
top measurement position is also representative of the adjacent throttle hand position to which it
is rigidly attached.
Over 900 individual hand arm vibration measurement analyses have been made on the five saws
being operated in the three forest environments. For each measurement data in the format shown
in Annex B.1 has been produced. The data from all measurements have been collated in a
spreadsheet that allows data to be grouped and analysed by saw, measurement handle, operating
mode. The analyses have all been performed using the overall total acceleration value (the
“vector sum” acceleration), rather than individual axes.
Table 5 summarises the results from the hand-arm vibration measurements, arranged by saw,
hand-position and forest operation type.

10
Table 5 Summary of average hand-arm vibration test results, in m/s
2
Activity code
B
B1
B2
B3
B4
B5
C
C1
C2
C3
Saw
Hand
Two hands on saw, saw
revving no l
oad
Two hands on saw, saw
idling, on hip/thigh
Two hands on saw, revving,
horizontal, light load
Two hands on saw, revving,
vertical, light load
Two hands on saw,
horizontal, under load
Two hands on saw, vertical,
under load
One hand on front handle,
saw o
n thigh, saw idling
One hand on front handle,
saw on stem, saw idling
One hand on rear handle,
saw on thigh, saw idling
One hand on rear handle,
saw on stem, saw idling
Saw A Support - side
5.98
6.81
4.42
6.12
6.37
Support - top
4.48
5.68
5.83
4.88
4.34
4.12
Throttle
4.70
6.29
6.05
5.63
Saw B Support - side
2.29
4.22
6.39
4.06
5.82
4.50
4.54
Support - top
3.49
6.36
7.14
5.43
4.90
4.85
4.69
Throttle
3.58
4.58
6.46
4.43
4.52
4.61
Saw C Support - side
4.65
5.41
Support - top
4.03
6.99
6.82
6.79
5.27
5.01
Throttle
6.02
8.43
6.48
7.92
3.57
Saw D Support - side
6.19
6.37
6.23
5.96
6.82
Support - top
3.76
6.73
8.42
5.96
3.51
3.72
Throttle
6.36
6.33
6.26
5.89
5.54
2.84
Saw E Support - side
6.28
7.40
9.87
6.86
5.03
Support - top
2.97
3.66
4.10
4.04
4.77 2.74
3.75
Throttle
2.97
3.66
4.10 4.04 4.77 2.74 3.75
* On the top handled saw, measurements at the support -top hand p osition are assumed to also represent the throttle hand
position, since the two positions are very close to each other.
3.3
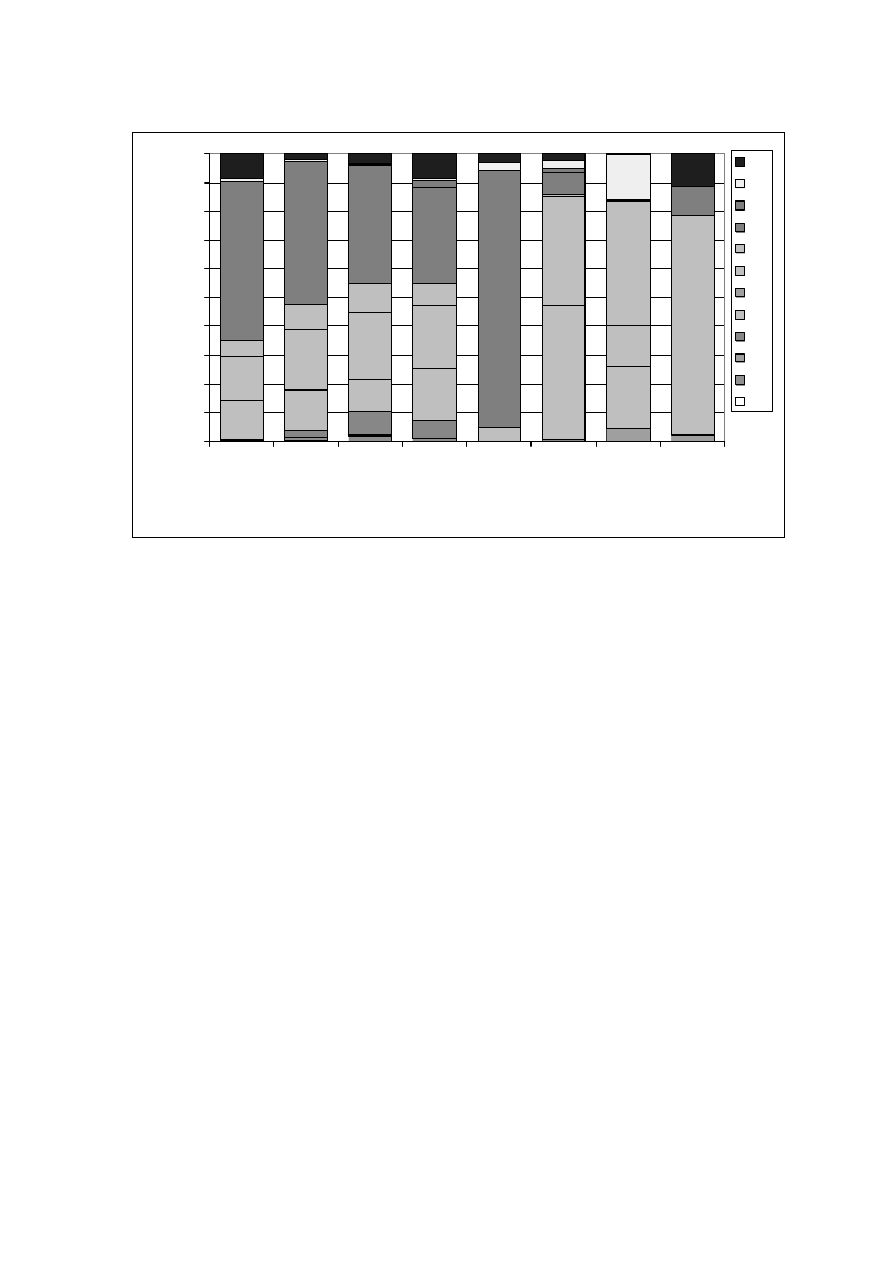
EXPOSURE TIME STUDIES
The results from the forestry time studies performed by FR-TDB are summarised in Table 6.
The data given in Table 6 are extracted from FR-TDB report November 2003, however, it is
assumed that the typical working day is 8 hours and the study times have been normalised to an
8-hour shift by FR-TDB. The same data is presented in Figure 4, showing the exposure times as
a percentage of the time in contact with the saw.

11
Table 6 Daily exposure time-study results
Operation
First thin
Subs. Thin
Clear fell(SS)
Clear fell(pine)
Brashing
Cross cutting
Forest
Cleaning
Arboriculture
Mode
(mins.)
A Saw on ground, no contact
91.3 121.8 56.2
19.3
6.5
83.8
15.9 212.4
B
Two hands on saw, saw
revving no load
20.7
4.1
9.2
22.7
8
1.6
1.4
5.3
B1
Two hands on saw, saw
idling, on hip/thigh
3.5
1.4
1.5
2.1
7.3
2.1
49.1
0
B2
Two hands on saw, revving,
horizontal, light load
0
0
0
6.2
0
1
0.5
0
B3
Two hands on saw, revving,
vertical, light load
134.2 108.2 109.4
88
239.3
5.2
1
4.8
B4
Two hands on saw, horizontal,
under load
13.2
18.9
27.1
19.9
0
0.5
138
0
B5
Two hands on saw, vertical,
under load
37.6
45.9
62.9
58.4
0
26.9
44.2
35.8
B6
Two hands on saw, vertical,
under load - Delimbing
0
0
0
0
0
0
0
0
C
One hand on front handle, saw
on thigh, saw idling
32.6
30.9
29.2
47.4
13.1
33.1
69.3
0
C1
One hand on front handle, saw
on stem, saw idling
1.6
5.2
22.6
16.5
0
0.5
0
0
C2
One hand on rear handle, saw
on thigh, saw idling
0.3
0.3
0.4
0
0
0
14.4
1
C3
One hand on rear handle, saw
on stem, saw idling
0
2.7
5.3
2.8
0
0
0
0
C4
One hand on rear handle, saw
on ground, revving, no load
0.3
0.4
0.1
0
0
0
0
0
O
All other work not requiring
handling of an operating
chainsaw
144.7 140.2 156.1 196.7 205.8 325.3 146.2 220.7
Total saw in hand (mins) 244
218 267.7 264 267.7 70.9 317.9 46.9
Total working day(mins) 480
480
480
480
480
480
480
480
Total saw in hand (hh:mm:ss) 4:04
3:38
4:27
4:24
4:27
1:10
5:17
0:46
Total working day (hh:mm:ss) 8:00
8:00
8:00
8:00
8:00
8:00
8:00
8:00
Average total study time (hh:mm:ss) 8:47
9:27
5:45
5:48
5:30
7:43
8:18
8:15
12
0%
10%
20%
30%
40%
50%
60%
70%
80%
90%
100%
First thin
Subs. Thin
Clear fell(SS) Clear fell(pine)
Brashing
Cross cutting
Forest Cleaning
Arboriculture
Percentage of total contact time
B
B1
B2
B3
B4
B5
B6
C
C1
C2
C3
C4
Figure 4 Distribution of exposure times for the forest activities
3.4
ESTIMATIONS OF DAILY VIBRATION EXPOSURES
3.4.1 Methods of assessment
Vibration exposure may be evaluated in a number of different ways, to compare the alternative
sources of vibration magnitude and exposure time information, daily vibration exposures have
been calculated based on:
1. In-forest measured vibration data and time -study data. This method provides the best
estimate of daily vibration exposure, and is used as the reference against which the other
methods are compared.
2. Measured vibration emission mode data and time -study data. This method uses the
most detailed emission data from ISO 7505 tests on the actual saws used in this study (i.e.
idling, cutting and racing data), and of the exposure estimates based on emission data, might
be expected to give the best results.
3. Measured vibration emission averaged data and time-study data. This method uses the
averaged emission test data, based on ISO 7505 tests on the actual saws used in this study.
(i.e. a single value is used to represent all modes of chainsaw use).
4. Published vibration emission averaged data and time -study data. Most chain saws users
will only have access to published emission data, usually in the form of averaged data (i.e.
for each model, an average of idling, cutting and racing data). This method represents the
best estimation method available to most chainsaw users.
5. In-forest measured vibration data and nominal exposure time data. This method has
been included to illustrate that the accurate evaluation of exposure time is less important
that the accurate evaluation of vibration magnitude.

13
3.4.2 Estimation based on measured vibration and time -study data
To assess likely daily vibration exposures from the hand-arm vibration analyses and the time-
study analyses the appropriate vibration values need to be assigned to the exposure categories
used in the time-study. While the exposure time categories were designed to relate to the
categories used in the vibration analyses, the relations hips are not in all cases straightforward.
The vibration analyses produced a range of descriptions for the operations, depending on which
hand-position was being assessed, and the operation type. Table 7 shows the vibration analysis
categories, and how they were mapped onto the time-study modes.
Table 7 Mapping of vibration measurement categories to time-study chain saw
operating modes
Vibration description
Time -study mode / description
Racing
B
Two hands on saw, saw revving no load
Idling - away from body - Held with both hands
B1 Two hands on saw, saw idling, on hip/thigh
Idling - Both hands - on knee, on its side
B1 Two hands on saw, saw idling, on hip/thigh
Idling - Both hands - on trunk, on its side
B1 Two hands on saw, saw idling, on hip/thigh
Snedding - horizontal
B2 Two hands on saw, revving, horizontal, light load
Brashing
B3 Two hands on saw, revving, vertical, light load
Snedding
B3 Two hands on saw, revving, vertical, light load
Snedding - vertical
B3 Two hands on saw, revving, vertical, light load
Cross cutting-Horizontal
B4 Two hands on saw, horizontal, under load
Felling
B4 Two hands on saw, horizontal, under load
Felling – Horizontal cut
B4 Two hands on saw, horizontal, under load
Cross cutting
B5 Two hands on saw, vertical, under load
Cross cutting-Vertical
B5 Two hands on saw, vertical, under load
Felling - Vertical cut
B5 Two hands on saw, vertical, under load
Idling - Support handle - on knee
C
One hand on front handle, saw on thigh, saw idling
Idling - Support handle only
C
One hand on front handle, saw on thigh, saw idling
Idling - Idling on trunk held only on support
C1 One hand on front handle, saw on stem, saw idling
Idling - Support handle - on trunk, on its side
C1 One hand on front handle, saw on stem, saw idling
Idling - Throttle handle on knee
C2 One hand on rear handle, saw on thigh, saw idling
Idling - on trunk - Held with rear hand only - saw horizontal
C3 One hand on rear handle, saw on stem, saw idling
Idling - on trunk - Held with rear hand only - saw vertical
C3 One hand on rear handle, saw on stem, saw idling
Idling - Throttle handle on trunk
C3 One hand on rear handle, saw on stem, saw idling
Idling - Throttle handle pointing down
C3 One hand on rear handle, saw on stem, saw idling

14
In addition to the mapping shown in Table 7, some substitutions need to be made for before
estimates of daily vibration exposure can be made:
1. For the Saw E, the top-handled saw, there is no space available on the throttle handle to
attach transducers, however, the top-support handle is very close to the throttle handle and
rigidly attached to the same support, therefore vibration measurements from the top of the
support handle are assumed to apply also to the throttle hand position.
2. For the vibration measurements on the throttle (rear) handle, there is no distinction between
horizontal and vertical saw operation. Although this mode is mapped to activity B3 (two
hands on saw, revving, vertical, light load) it also applies to activity B2
(two hands on
saw, revving, horizontal, light load).
3. No specific vibration data was collected for activity B6 (vertical de-limbing), which is
assumed to be the same as activity B3 (two hands on saw, revving, vertical, light load).
4. Little data was collected for “racing” (activities B and C4), in practice this operation takes
place as the saw is warmed up, or is seen briefly between other operations, such as snedding
or brashing. Since the “racing” generally involves revving the saw through a range of
speeds, similar to light cutting activities, then data from vertical light load (B3) has been
used where specific “racing” data is not available.
5. Where data for C2 and C3 (rear hand only idling activities) are not available then rear hand
data from B1 (Two hands on saw, saw idling, on hip/thigh) is used.
With the exception of the substitutions relating to the top-handle saw, these substitutions all
relate to activities for which the assessed exposure times are small. They are not therefore likely
to have any significant effect on the assessment of daily vibration exposures.
In Table 8 the vibration exposure times evaluated by FR-TDB (i.e. the data from Table 5) and
the in-forest vibration measurements from Table 5 have been used to calculate the vibration
exposures associated with the 8 work activities. These values are assumed to be the best
estimates of daily vibration exposures; they are the values against which all simplifications to
the methods of estimating vibration exposures will be compared.

15
Table 8 Daily exposure estimates for activities based on in-forest measured vibration
values and time-study data (m/s²A(8)).
Activ ity
Saw
Rear hand
Front hand
Highest
hand*
First thin
Saw A
4.1
3.8
4.1
First thin
Saw B
3.8
4.2
4.2
First thin
Saw C
5.4
4.7
5.4
First thin
Saw D
4.1
4.4
4.4
Subs. Thin
Saw A
3.7
3.5
3.7
Subs. Thin
Saw B
3.5
3.8
3.8
Subs. Thin
Saw C
5.0
4.4
5.0
Subs. Thin
Saw D
3.8
4.1
4.1
Clear fell(SS)
Saw A
4.0
3.8
4.0
Clear fell(SS)
Saw B
3.7
4.2
4.2
Clear fell(SS)
Saw C
5.4
4.8
5.4
Clear fell(SS)
Saw D
4.1
4.4
4.4
Clear fell(pine)
Saw A
3.9
3.8
3.9
Clear fell(pine)
Saw B
3.5
4.2
4.2
Clear fell(pine)
Saw C
5.2
4.7
5.2
Clear fell(pine)
Saw D
4.0
4.3
4.3
Brashing
Saw A
4.6
4.2
4.6
Brashing
Saw B
4.6
4.7
4.7
Brashing
Saw C
6.1
5.1
6.1
Brashing
Saw D
4.6
4.9
4.9
Cross cutting
Saw A
1.6
1.8
1.8
Cross cutting
Saw B
1.3
2.0
2.0
Cross cutting
Saw C
2.2
2.3
2.3
Cross cutting
Saw D
1.7
1.9
1.9
Forest Cleaning Saw A
4.1
3.6
4.1
Forest Cleaning
Saw B
3.2
3.5
3.5
Forest Cleaning
Saw C
4.8
4.3
4.8
Forest Cleaning Saw D
4.4
4.2
4.4
Arboriculture
Saw A
1.8
1.6
1.8
Arboriculture
Saw B
1.5
1.7
1.7
Arboriculture
Saw C
2.5
2.1
2.5
Arboriculture
Saw D
1.9
1.9
1.9
Arboriculture
Saw E
1.2
1.2
1.2
*
Daily exposure above 5m/s²A(8) are shown in bold,
daily exposures below 2.5m/s² are shown in italics

16
3.4.3 Estimation based on vibration emission and time -study data
Vibration exposure might be estimated using vibration data from the three ISO 7505 vibration
emission test modes. First, each exposure category has to be mapped onto one of the ISO 7505
test modes. The mapping shown in Table 9 has been used here.
Table 9 Mapping of time-study modes to emission test modes
Time-study mode, Description
Equivalent
Emission mode
B
Two hands on saw, saw revving no load
Cutting
*
B1 Two hands on saw, saw idling, on hip/thigh
Idling
B2 Two hands on saw, revving, horizontal, light load
Cutting
B3 Two hands on saw, revving, vertical, light load
Cutting
B4 Two hands on saw, horizontal, under load
Cutting
B5 Two hands on saw, vertical, under load
Cutting
B6 Two hands on saw, vertical, under load - Delimbing
Cutting
C
One hand on front handle, saw on thigh, saw idling
Idling
C1 One hand on front handle, saw on stem, saw idling
Idling
C2 One hand on rear handle, saw on thigh, saw idling
Idling
C3 One hand on rear handle, saw on stem, saw idling
Idling
C4 One hand on rear handle, saw on ground, revving, no load
Cutting
*
*
Although, in name, these modes appear to be closely related to “racing”, the variation in speed of the saw
during these modes is probably better related to cutting activities. Since these modes account for small
proportions of the day’s exposure, the effect of changing the mapping is small.
The estimates of daily vibration exposure in Table 10 have been calculated using the mapping in
Table 9, and the exposure times from Table 6.

17
Table 10 Daily exposure estimates for activities based on ISO 7505 vibration emission
test mode values and time-study data (m/s²A(8)).
Activity
Saw
Rear hand
Front hand
Highest
hand*
First thin
Saw A
8.5
4.3
8.5
First thin
Saw B
3.1
4.4
4.4
First thin
Saw C
5.6
4.7
5.6
First thin
Saw D
4.2
4.0
4.2
Subs. Thin
Saw A
7.9
4.0
7.9
Subs. Thin
Saw B
2.9
4.2
4.2
Subs. Thin
Saw C
5.2
4.4
5.2
Subs. Thin
Saw D
3.9
3.7
3.9
Clear fell(SS)
Saw A
8.5
4.4
8.5
Clear fell(SS)
Saw B
3.2
4.6
4.6
Clear fell(SS)
Saw C
5.6
4.8
5.6
Clear fell(SS)
Saw D
4.3
4.0
4.3
Clear fell(pine)
Saw A
8.2
4.3
8.2
Clear fell(pine)
Saw B
3.1
4.7
4.7
Clear fell(pine)
Saw C
5.4
4.7
5.4
Clear fell(pine)
Saw D
4.1
4.0
4.1
Brashing
Saw A
9.3
4.5
9.3
Brashing
Saw B
3.5
4.6
4.6
Brashing
Saw C
6.1
5.1
6.1
Brashing
Saw D
4.7
4.2
4.7
Cross cutting
Saw A
3.5
2.2
3.5
Cross cutting
Saw B
1.3
2.5
2.5
Cross cutting
Saw C
2.3
2.1
2.3
Cross cutting
Saw D
1.8
1.9
1.9
Forest Cleaning
Saw A
8.3
4.6
8.3
Forest Cleaning
Saw B
3.8
5.1
5.1
Forest Cleaning
Saw C
5.6
4.7
5.6
Forest Cleaning
Saw D
4.6
4.1
4.6
Arboriculture
Saw A
4.0
1.9
4.0
Arboriculture
Saw B
1.5
1.9
1.9
Arboriculture
Saw C
2.6
2.2
2.6
Arboriculture
Saw D
2.0
1.8
2.0
Arboriculture
Saw E
1.9
1.7
1.9
*
Daily exposure above 5m/s²A(8) are shown in bold,
daily exposures below 2.5m/s² are shown in italics

18
3.4.4 Estimation based on vibration averaged emission data and time -study data
Manufacturers usually present ISO 7505 data as either one or two values: representing the
combined emission value for the highest hand or both hands. The combination of emission
values being produced by:
racing
cutting
idling
emission
a
a
a
a
3
1
3
1
3
1
+
+
=
The averaged emission values have been calculated from the emission test results for each mode
and are shown in Table 11.
Table 11 Averaged emission values (m/s²)
Saw
Support - top
Throttle
Highest
Front
Rear
Hand Value
Saw A
6.5
8.8
8.8
Saw B
6.1
6.1
6.1
Saw C
5.0
8.4
8.4
Saw D
4.9
5.4
5.4
Saw E
4.7
6.1
6.1
The estimations of daily vibration exposures in Table 12 have been calculated using the single
emission values for each hand to represent any type vibration exposure (idling, revving, cutting,
etc.).

19
Table 12 Daily vibration exposure based on single value emission test data and time-
study data (m/s²A(8)).
Activity
Saw
Rear hand
Front hand
Highest
hand*
First thin
Saw A
5.8
4.7
5.8
First thin
Saw B
4.0
4.4
4.4
First thin
Saw C
5.6
3.6
5.6
First thin
Saw D
3.5
3.5
3.5
Subs. Thin
Saw A
5.4
4.4
5.4
Subs. Thin
Saw B
3.7
4.1
4.1
Subs. Thin
Saw C
5.2
3.3
5.2
Subs. Thin
Saw D
3.3
3.3
3.3
Clear fell(SS)
Saw A
5.9
4.8
5.9
Clear fell(SS)
Saw B
4.1
4.5
4.5
Clear fell(SS)
Saw C
5.7
3.7
5.7
Clear fell(SS)
Saw D
3.6
3.6
3.6
Clear fell(pine)
Saw A
5.7
4.8
5.7
Clear fell(pine)
Saw B
3.9
4.5
4.5
Clear fell(pine)
Saw C
5.4
3.7
5.4
Clear fell(pine)
Saw D
3.5
3.6
3.6
Brashing
Saw A
6.4
4.9
6.4
Brashing
Saw B
4.4
4.6
4.6
Brashing
Saw C
6.1
3.7
6.1
Brashing
Saw D
3.9
3.7
3.9
Cross cutting
Saw A
2.5
2.5
2.5
Cross cutting
Saw B
1.7
2.4
2.4
Cross cutting
Saw C
2.4
1.9
2.4
Cross cutting
Saw D
1.5
1.9
1.9
Forest Cleaning
Saw A
6.3
5.2
6.3
Forest Cleaning
Saw B
4.4
4.9
4.9
Forest Cleaning
Saw C
6.1
4.0
6.1
Forest Cleaning
Saw D
3.9
3.9
3.9
Arboriculture
Saw A
2.8
2.0
2.8
Arboriculture
Saw B
1.9
1.9
1.9
Arboriculture
Saw C
2.6
1.5
2.6
Arboriculture
Saw D
1.7
1.5
1.7
Arboriculture
Saw E
1.9
1.5
1.9
*
Daily exposure above 5m/s²A(8) are shown in bold,
daily exposures below 2.5m/s² are shown in italics

20
3.4.5 Estimation based on published average emission data and time -study data
The values of vibration emission used for Tables 10 and 12 have been based on the
measurements of vibration emission performed on the actual saws used in this proje ct. Not all
users will have the luxury of emission tests performed on the actual machines they are using,
and will therefore need to use ISO 7505 information published by the manufacturers in the
instruction manuals (referred to in this report as the “published emission data”).
For the saw types tested the manufacturer’s published emission information was obtained, see
Table 13. The published emission values have been used, with the nominal exposure times, to
produce the daily vibration exposure estimates in Table 14.
Table 13 Manufacturer’s published emission test data (m/s²)
Saw
Single value Support - top
Throttle
Highest hand
Front
Rear
value
Saw A
6.9
5.9
6.9
Saw B
4.2
3.9
4.2
Saw C
8.8
8.8
Saw D
6.9
7.6
7.6
Saw E
3.4
5.3
5.3

21
Table 14 Daily vibration exposure based on published emission test data and time-
study data (m/s²A(8))
Activity
Saw
Rear hand
Front hand
Highest
hand*
First thin
Saw A
3.9
4.9
4.9
First thin
Saw B
2.6
3.0
3.0
First thin
Saw C
5.8
6.3
6.3
First thin
Saw D
5.0
4.9
5.0
Subs. Thin
Saw A
3.6
4.6
4.6
Subs. Thin
Saw B
2.4
2.8
2.8
Subs. Thin
Saw C
5.4
5.9
5.9
Subs. Thin
Saw D
4.7
4.6
4.7
Clear fell(SS)
Saw A
4.0
5.1
5.1
Clear fell(SS)
Saw B
2.6
3.1
3.1
Clear fell(SS)
Saw C
5.9
6.5
6.5
Clear fell(SS)
Saw D
5.1
5.1
5.1
Clear fell(pine)
Saw A
3.8
5.1
5.1
Clear fell(pine)
Saw B
2.5
3.1
3.1
Clear fell(pine)
Saw C
5.7
6.5
6.5
Clear fell(pine)
Saw D
4.9
5.1
5.1
Brashing
Saw A
4.3
5.2
5.2
Brashing
Saw B
2.8
3.1
3.1
Brashing
Saw C
6.4
6.6
6.6
Brashing
Saw D
5.5
5.2
5.5
Cross cutting
Saw A
1.6
2.7
2.7
Cross cutting
Saw B
1.1
1.6
1.6
Cross cutting
Saw C
2.5
3.4
3.4
Cross cutting
Saw D
2.1
2.7
2.7
Forest Cleaning
Saw A
4.2
5.5
5.5
Forest Cleaning
Saw B
2.8
3.3
3.3
Forest Cleaning
Saw C
6.3
7.0
7.0
Forest Cleaning
Saw D
5.5
5.5
5.5
Arboriculture
Saw A
1.8
2.1
2.1
Arboriculture
Saw B
1.2
1.3
1.3
Arboriculture
Saw C
2.8
2.7
2.8
Arboriculture
Saw D
2.4
2.1
2.4
Arboriculture
Saw E
1.7
1.1
1.7
*
Daily exposure above 5m/s²A(8) are shown in bold,
daily exposures below 2.5m/s² are shown in italics

22
3.4.6 Estimation based on measured vibration data and nominal exposure times
The calculation of daily vibration exposure is influenced less by the uncertainty of exposure
time than the uncertainty of vibration magnitude. For this reason, it is possible to use cruder
assessments of exposure time and still produce reasonably reliable assessments of daily
vibration exposure. To illustrate this point, the estimate of daily vibration exposure are repeated
here using the measured vibration magnitudes and nominal exposure times.
To obtain the nominal exposure times, the exposure times from the time-studies Table 6, are
rounded to a nearest nominal time selected from Table 15. The equivalent rounded (or nominal)
exposure times are given in Table 16. These rounded exposure times are then used with the in-
forest vibration magnitudes values to provide a further set of daily exposures estimate, see
Table 17.
Table 15 Nominal exposure time categories
5
mins
10
mins
20
mins
30
mins
45
mins
1
hour
1½
hours
2
hours
3
hours
4
hours
6
hours
8
hours
12
hours

23
Table 16 Nominal daily exposure times
Operation
First thin
Subs. Thin
Clear fell(SS)
Clear
fell(pine)
Brashing
Cross cutting
Forest
Cleaning
Arboriculture
Mode
Nominal daily exposure time (hh:mm)
B
Two hands on saw, saw
revving no load
0:20
0:05
0:10
0:20
0:10
-
-
0:05
B1
Two hands on saw, saw idling,
on hip/thigh
0:05
-
-
-
0:10
-
0:45
-
B2
Two hands on saw, revving,
horizontal, light load
-
-
-
0:05
-
-
-
-
B3
Two hands on saw, revving,
vertical, light load
2:00
2:00
2:00
1:30
4:00
0:05
-
0:05
B4
Two hands on saw, horizontal,
under load
0:10
0:20
0:30
0:20
-
-
2:00
-
B5
Two hands on saw, vertical,
under load
0:45
0:45
1:00
1:00
-
0:30
0:45
0:30
B6
Two hands on saw, vertical,
under load - Delimbing
-
-
-
-
-
-
-
-
C
One hand on front handle, saw
on thigh, saw idling
0:30
0:30
0:30
0:45
0:10
0:30
1:00
-
C1
One hand on front handle, saw
on stem, saw idling
-
0:05
0:20
0:20
-
-
-
-
C2
One hand on rear handle, saw
on thigh, saw idling
-
-
-
-
-
-
0:10
-
C3
One hand on rear handle, saw
on stem, saw idling
-
-
0:05
-
-
-
-
-
C4
One hand on rear handle, saw
on ground, revving, no load
-
-
-
-
-
-
-
-

24
Table 17 Daily vibration exposure based on in-forest measured vibration data and
nominal exposure times (m/s²A(8))
Activity
Saw
Rear hand
Front hand
Highest
hand*
First thin
Saw A
3.9
3.7
3.9
First thin
Saw B
3.7
4.1
4.1
First thin
Saw C
5.3
4.6
5.3
First thin
Saw D
4.0
4.3
4.3
Subs. Thin
Saw A
3.8
3.6
3.8
Subs. Thin
Saw B
3.6
4.0
4.0
Subs. Thin
Saw C
5.1
4.5
5.1
Subs. Thin
Saw D
3.9
4.2
4.2
Clear fell(SS)
Saw A
4.1
3.8
4.1
Clear fell(SS)
Saw B
3.8
4.3
4.3
Clear fell(SS)
Saw C
5.5
4.9
5.5
Clear fell(SS)
Saw D
4.2
4.5
4.5
Clear fell(pine) Saw A
3.8
3.8
3.8
Clear fell(pine)
Saw B
3.5
4.2
4.2
Clear fell(pine)
Saw C
5.1
4.7
5.1
Clear fell(pine) Saw D
3.9
4.3
4.3
Brashing
Saw A
4.6
4.2
4.6
Brashing
Saw B
4.6
4.7
4.7
Brashing
Saw C
6.1
5.1
6.1
Brashing
Saw D
4.7
4.9
4.9
Cross cutting
Saw A
1.5
1.7
1.7
Cross cutting
Saw B
1.3
1.9
1.9
Cross cutting
Saw C
2.2
2.3
2.3
Cross cutting
Saw D
1.6
1.9
1.9
Forest Cleaning Saw A
3.8
3.4
3.8
Forest Cleaning Saw B
3.0
3.3
3.3
Forest Cleaning Saw C
4.5
4.1
4.5
Forest Cleaning Saw D
4.2
4.0
4.2
Arboriculture
Saw A
1.7
1.5
1.7
Arboriculture
Saw B
1.4
1.6
1.6
Arboriculture
Saw C
2.3
2.0
2.3
Arboriculture
Saw D
1.7
1.8
1.8
Arboriculture
Saw E
1.2
1.2
1.2
*
Daily exposure above 5m/s²A(8) are shown in bold,
daily exposures below 2.5m/s² are shown in italics

25
3.5
DIFFERENCES IN DAILY EXPOSURE ESTIMATES
Tables 8, 10, 12, 14 and 17 show the results from the five alternative methods of arriving at
estimates of daily vibration exposure values. To allow easy comparison of the methods, Table
18 summarises the results from the five methods by reproducing the highest axis data values
from Tables 8, 10, 12, 14 and 17.
The differences between the results from the five methods are presented in Table 19 as
percentage differences from the results given by the detailed evaluation method (i.e. the data
from Table 8). The values in Table 19 are given by:
100
x
−
=
thod
detailedMe
thod
detailedMe
Method
simplified
Method
simplified
a
a
a
ε
It is useful to view these percentage differences sorted by saw type, Table 20; this presentation
of the data highlights the problems with predictions based on emission test data from saw A.
Values at or near to 0% in Tables 19 and 20 represent good agreement between the measured
vibration exposures and the estimated values based on vibration emission data. Negative values
indicate underestimation (and the use of these values in any risk assessment is likely to result in
under-protection of the worker); positive values indicate overestimates of daily exposure (and
would lead to over-protection).
Saw A appears to have given higher than expected ISO 7505 emission data for the cutting test
on the rear hand position (see Table 3, saw A gives 12.9 m/s² where other machines give
between 4.7 and 8.5m/s² for the same test), this data distorts subsequent exposure evaluations,
and is much higher than the manufacturer’s published data for the same machine type.
For an estimation method to be useful, it should not produce excessively large positive
differences (i.e. method that potentially could lead to over protection by a large amount), and
should only produce small negative differences (i.e. is unlikely to underprotect, but where it
does it is by a small amount). The best indicator of the overall quality of each estimate type is
the r.m.s value. The r.m.s. value is used to recognise the fact that both positive and negative
differences are undesirable (a simple average value is not useful, since positive differences are
cancelled out by negative differences). Table 20 also shows minimum, maximum and r.m.s
values for the difference values. Maximum, minimum and r.m.s difference data are also
calculated with the difference data from saw A excluded.

26
Table 18 Comparison of highest handle daily vibration exposure estimates (m/s²A(8))
Vibration data: Measured
Emission
mode
Emission
averaged
Published
emission
Measured
Exposure time data:
---------- Time -studies ----------
Nominal
Activity
Saw
Table 8 Table 10 Table 12 Table 14 Table 17
First thin
Saw A
4.1
8.5
5.8
4.9
3.9
First thin
Saw B
4.2
4.4
4.4
3.0
4.1
First thin
Saw C
5.4
5.6
5.6
6.3
5.3
First thin
Saw D
4.4
4.2
3.5
5.0
4.3
Subs. Thin
Saw A
3.7
7.9
5.4
4.6
3.8
Subs. Thin
Saw B
3.8
4.2
4.1
2.8
4.0
Subs. Thin
Saw C
5.0
5.2
5.2
5.9
5.1
Subs. Thin
Saw D
4.1
3.9
3.3
4.7
4.2
Clear fell(SS)
Saw A
4.0
8.5
5.9
5.1
4.1
Clear fell(SS)
Saw B
4.2
4.6
4.5
3.1
4.3
Clear fell(SS)
Saw C
5.4
5.6
5.7
6.5
5.5
Clear fell(SS)
Saw D
4.4
4.3
3.6
5.1
4.5
Clear fell(pine)
Saw A
3.9
8.2
5.7
5.1
3.8
Clear fell(pine)
Saw B
4.2
4.7
4.5
3.1
4.2
Clear fell(pine)
Saw C
5.2
5.4
5.4
6.5
5.1
Clear fell(pine)
Saw D
4.3
4.1
3.6
5.1
4.3
Brashing
Saw A
4.6
9.3
6.4
5.2
4.6
Brashing
Saw B
4.7
4.6
4.6
3.1
4.7
Brashing
Saw C
6.1
6.1
6.1
6.6
6.1
Brashing
Saw D
4.9
4.7
3.9
5.5
4.9
Cross cutting
Saw A
1.8
3.5
2.5
2.7
1.7
Cross cutting
Saw B
2.0
2.5
2.4
1.6
1.9
Cross cutting
Saw C
2.3
2.3
2.4
3.4
2.3
Cross cutting
Saw D
1.9
1.9
1.9
2.7
1.9
Forest Cleaning
Saw A
4.1
8.3
6.3
5.5
3.8
Forest Cleaning
Saw B
3.5
5.1
4.9
3.3
3.3
Forest Cleaning
Saw C
4.8
5.6
6.1
7.0
4.5
Forest Cleaning
Saw D
4.4
4.6
3.9
5.5
4.2
Arboriculture
Saw A
1.8
4.0
2.8
2.1
1.7
Arboriculture
Saw B
1.7
1.9
1.9
1.3
1.6
Arboriculture
Saw C
2.5
2.6
2.6
2.8
2.3
Arboriculture
Saw D
1.9
2.0
1.7
2.4
1.8
Arboriculture
Saw E
1.2
1.9
1.9
1.7
1.2
Note:
Daily exposure above 5m/s²A(8) are shown in bold,
daily exposures below 2.5m/s² are shown in italics

27
Table 19 Comparison of highest handle daily vibration exposure estimates as
percentage differences from the detailed method (%)
Vibration data:
Emission
mode
Emission
averaged
Published
emission
Measured
Exposure time data: ---------- Time -studies ---------- Nominal
Activity
Saw
Table 10 Table 12 Table 14 Table 17
First thin
Saw A
109
43
21
-3
First thin
Saw B
6
4
-29
-3
First thin
Saw C
3
3
16
-3
First thin
Saw D
-4
-20
14
-3
Subs. Thin
Saw A
111
45
23
3
Subs. Thin
Saw B
9
7
-27
3
Subs. Thin
Saw C
5
5
18
3
Subs. Thin
Saw D
-3
-19
15
3
Clear fell(SS)
Saw A
111
46
26
3
Clear fell(SS)
Saw B
11
9
-26
2
Clear fell(SS)
Saw C
5
6
21
2
Clear fell(SS)
Saw D
-3
-17
15
3
Clear fell(pine)
Saw A
113
47
31
-1
Clear fell(pine)
Saw B
12
9
-26
0
Clear fell(pine)
Saw C
6
6
26
-1
Clear fell(pine)
Saw D
-4
-16
18
0
Brashing
Saw A
104
41
13
1
Brashing
Saw B
-1
-2
-33
0
Brashing
Saw C
1
1
8
1
Brashing
Saw D
-5
-20
13
1
Cross cutting
Saw A
93
38
46
-5
Cross cutting
Saw B
25
17
-20
-4
Cross cutting
Saw C
1
2
47
-2
Cross cutting
Saw D
0
-1
38
-3
Forest Cleaning
Saw A
104
56
35
-6
Forest Cleaning
Saw B
46
38
-5
-6
Forest Cleaning
Saw C
18
26
46
-6
Forest Cleaning
Saw D
4
-12
23
-6
Arboriculture
Saw A
122
53
18
-7
Arboriculture
Saw B
8
9
-26
-6
Arboriculture
Saw C
6
5
10
-7
Arboriculture
Saw D
5
-12
25
-6
Arboriculture
Saw E
51
53
33
-7

28
Table 20 Comparison of highest handle daily vibration exposure estimates as
percentage differences from the detailed method, sorted by saw (%)
Vibration data:
Emission
mode
Emission
averaged
Published
emission
Measured
Exposure time data: ---------- Time -studies ---------- Nominal
Saw
Rear hand
Table 10 Table 12 Table 14 Table 17
Saw A
First thin
109
43
21
-3
Saw A
Subs. Thin
111
45
23
3
Saw A
Clear fell(SS)
111
46
26
3
Saw A
Clear fell(pine)
113
47
31
-1
Saw A
Brashing
104
41
13
1
Saw A
Cross cutting
93
38
46
-5
Saw A
Forest Cleaning
104
56
35
-6
Saw A
Arboriculture
122
53
18
-7
Saw B
First thin
6
4
-29
-3
Saw B
Subs. Thin
9
7
-27
3
Saw B
Clear fell(SS)
11
9
-26
2
Saw B
Clear fell(pine)
12
9
-26
0
Saw B
Brashing
-1
-2
-33
0
Saw B
Cross cutting
25
17
-20
-4
Saw B
Forest Cleaning
46
38
-5
-6
Saw B
Arboriculture
8
9
-26
-6
Saw C
First thin
3
3
16
-3
Saw C
Subs. Thin
5
5
18
3
Saw C
Clear fell(SS)
5
6
21
2
Saw C
Clear fell(pine)
6
6
26
-1
Saw C
Brashing
1
1
8
1
Saw C
Cross cutting
1
2
47
-2
Saw C
Forest Cleaning
18
26
46
-6
Saw C
Arboriculture
6
5
10
-7
Saw D
First thin
-4
-20
14
-3
Saw D
Subs. Thin
-3
-19
15
3
Saw D
Clear fell(SS)
-3
-17
15
3
Saw D
Clear fell(pine)
-4
-16
18
0
Saw D
Brashing
-5
-20
13
1
Saw D
Cross cutting
0
-1
38
-3
Saw D
Forest Cleaning
4
-12
23
-6
Saw D
Arboriculture
5
-12
25
-6
Saw E
Arboriculture
51
53
33
-7
Min diff:
-5
-20
-33
-7
Max diff:
122
56
47
3
r.m.s diff:
55
27
26
4
Excluding data from Saw A
Min diff:
-5
-20
-33
-7
Max diff:
51
53
47
3
r.m.s diff:
16
17
25
4

29
4
DISCUSSION
4.1
ISO 7505 TEST RESULT S
ISO 7505 data has been available to this project in three forms:
?
Results from the tests performed on the actual saws used in the study for the three
operational modes, idling, cutting and racing.
?
Averaged results from the tests performed on the actual saws
?
Manufacturer’s declared emission data for each type of saw, as printed in the machine’s
user manual
Each of these three has been used for producing estimates of vibration exposure. However, most
users will only have access to the 3
rd
form, i.e. the values printed in the user manual.
There is one notable discrepancy between the test results for the individual saws and the
manufacturers published data: for Saw A, the rear hand, cutting test gave 12.9 m/s², and the
overall value for the rear hand was 8.8 m/s², while the manufacturer’s published data is 5.9 m/s²
for the same hand and 6.9 m/s² for the highest hand.
To allow direct comparison between the in-forest measurements of vibration and the ISO 7505
emission test data, the forest data has been collated according to the equivalent emission test
mode (see Table 9). Annex C summarises all the measurement data according to the equivalent
emission test modes of idling and cutting. The average data from Annex C is used in Table 21 to
determine predicted emission values, from the in-forest vibration measurements.
Table 21 Emission values predicted by forest tests (m/s²).
Support - top
Throttle
Sum of 1/3rds
Saw
Idling Cutting Racing Idling Cutting Racing Front
Rear
Max
Saw A
4.4
5.4
4.7
6.0
5.1
5.6
5.6
Saw B
4.1
6.3
4.6
5.7
5.6
5.3
5.6
Saw C
4.5
6.9
5.5
8.0
6.1
7.2
7.2
Saw D
3.7
6.9
3.7
6.9
5.8
5.8
5.8
Saw E
3.6
4.0
N/A
3.6
4.0
N/A
3.8
3.8
3.8
Average
5.6
Average
(excluding saw E)
6.0
30
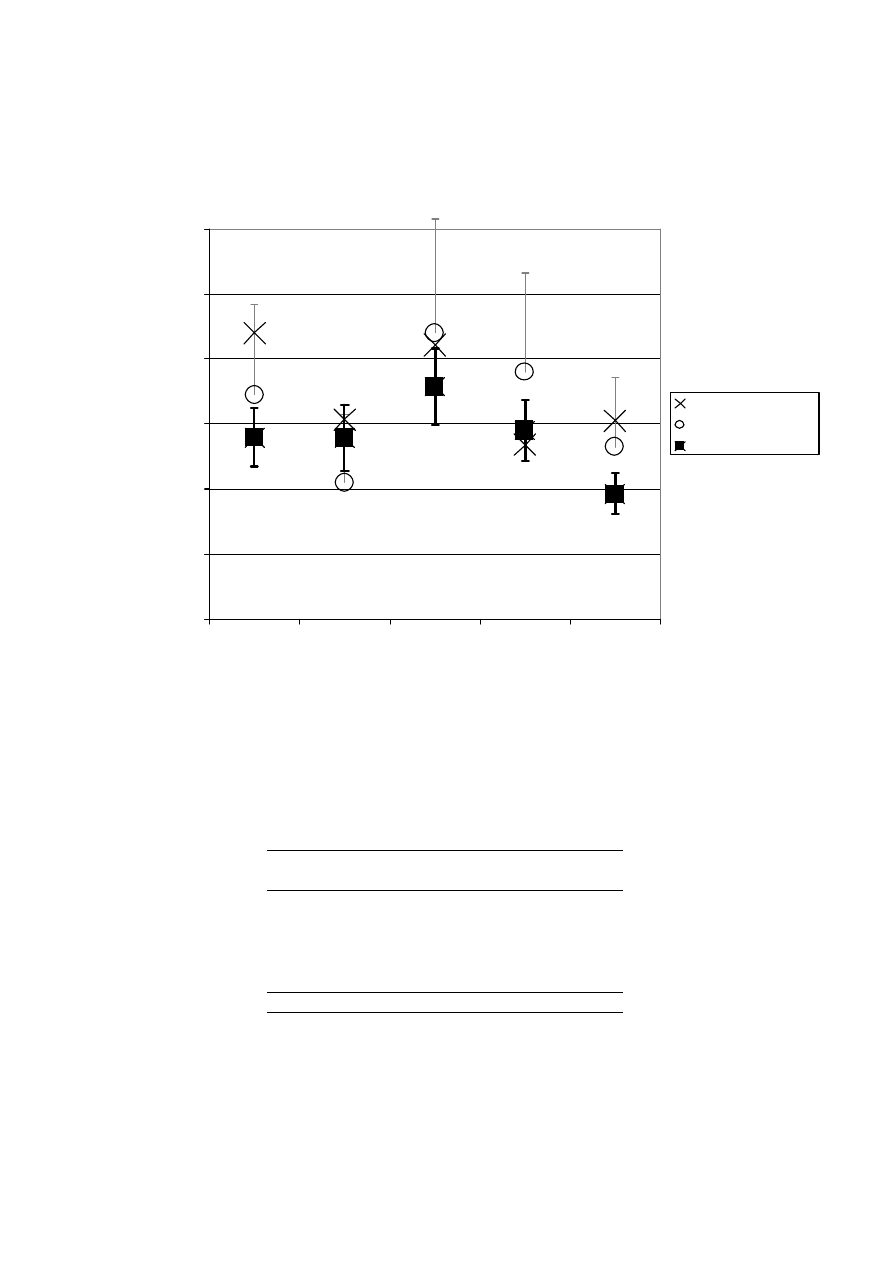
Figure 5 compares the highest hand averaged data from Table 21 with the equivalent figures
from Tables 4 and 13 (the emission values from the ISO 7505 tests for the test saws and the
manufacturer’s published data).
0.0
2.0
4.0
6.0
8.0
10.0
12.0
Saw A
Saw B
Saw C
Saw D
Saw E
Highest hand emisison Value (m/s²)
Measured emission
Published emission
Predicted emission
Figure 5 Comparison of predicted emission and measured emission data
(Note – the positive error bars on published emission data represent the uncertainty values K)
Table 22 Percentage difference in highest handle emission data from that predicted by
in-forest measurements
Saw
Emission
average data
Published data
Saw A
58
24
Saw B
10
-25
Saw C
18
23
Saw D
-8
31
Saw E
58
38
average
27
18

31
Generally ISO 7505 data over-estimates the values predicted by the in-forest vibration tests. As
shown in Table 22, the average difference between individual saw test data and the field
predictions is 27%; for the published emission data and field predictions the average difference
is 18%.
4.1.1 Verification of declared emission values
EN 12096 defines a method for verification of vibration emission values. If the measured
emission of a machine is less than manufacturer’s published value, a, plus the uncertainty value,
K, then the published emission value is verified. None of the machines used in these tests were
declared with uncertainty values, in which case EN 12096 says that values of K = 0.5a should
be used if a is less than or equal to 5 m/s², and K = 0.4a for a greater than 5 m/s². Figure 5
shows the K value as the positive error bar on the published emission data values. All of the
published emission values were verified by the individual emission tests. However, Saw B was
only just within the acceptable range and Saw D was substantially below the published emission
value, with the published emission value being more than two standard deviations above the
predicted emission value.
It is worth noting that the emission test modes in ISO 7505 are fixed engine speed modes.
However, in practice, chainsaws rarely operate at fixed speed for very long; even when idling
the engine speed of is often unsteady. In particular, the test mode of racing does not appear to
reflect actual operating modes in the forest (therefore no information is available in Table 20 for
racing). When machines are revved, it appears to be rapid revving through the entire speed
range of the machine. In vibration terms, this will effectively excite every available resonance of
the machine, and is likely to generate a very different vibration level to that produced by racing
in the ISO 7505 test (i.e. at 133% of the speed of the engine at maximum engine power).
4.2
EXPOSURE TIMES
4.2.1 Dominant modes
Table 6 and Figure 4 show how for most operations, the daily vibration exposures times are
dominated by the three modes:
?
B3 - two hands on saw vertical cutting under light loads;
?
B5 - two hands on saw vertical cutting under heavy loads; and
?
C - idling held with the top handle saw resting on the hip/thigh.
For forest clearing operations two other modes become important:
?
B1 - two hands on saw idling, saw resting on hip/thigh; and
?
B4 - two hands on saw horizontal cutting under light loads.
4.2.2 Nominal exposure times
The relationship between daily vibration exposure and exposure time is given by:
( )
EightHours
8
T
a
A
hv
=

32
The relationship means that the daily vibration exposure is less sensitive to uncertainty in
exposure time than it is to changes in acceleration value. If p represents a percentage
uncertainty, then
4
2
2
)
8
(
T
ahv
A
p
p
p
+
=
This relationship means that it may be possible to treat exposure time as nominal values; in this
study the exposure time values have been rounded to the nearest 10% of 8hours. The data in
Table 6 then becomes that shown in Table 16, this greatly simplifies the process of estimating
daily vibration exposures.
4.3
IN-FOREST VIBRATION VALUES
Annex D considers whether there is any statistically significant difference between the saw data
based on the forest activity modes.
Annex D shows that the saw pairings that may be said to produce statistically significant
differences are Saws C from saws A, B and E, and between Saws D and E (although in this later
case only at the weaker “probably significant” level).
4.4
RANKING OF CHAINSAWS
One function of ISO 7505 test data is to indicate whether one chainsaw type is lower vibration
than another.
This study has gathered data that can provide ranking data, based on in-forest measurements of
vibration exposure, predicted emission data, measured emission data and published emission
data. For the vibration exposure data, the comparison must be based on arboriculture work,
since only this activity used all 5 chainsaws.
Table 23a summarises the data used in this comparison of ranking, Table 23b shows the ranking
given by the data in Table 23a

33
Table 23a Vibration values used for assessing vibration ranking
Daily
exposures
Predicted
Measured
Published
Arboriculture
Emission
Emission
Emission
m/s²A(8)
m/s²
m/s²
m/s²
Saw A
1.8
5.6
8.8
6.9
Saw B
1.7
5.6
6.1
4.2
Saw C
2.5
7.2
8.4
8.8
Saw D
1.9
5.8
5.4
7.6
Saw E
1.2
3.8
6.1
5.3
Table 23b Vibration ranking (high number = high vibration value)
Saw
Daily
exposures
Predicted
Measured
Published
Arboriculture
Emission
Emission
Emission
rank
rank
rank
rank
Saw A
3
3
5
3
Saw B
2
2
3
1
Saw C
5
5
4
5
Saw D
4
4
1
4
Saw E
1
1
2
2
The two ranking methods based on in-forest measurements give the same ranking result.
Although these results are based on the same in-forest vibration data, the exposure data also
accounts for exposure times; therefore these methods do not necessarily need to give the same
results.
The ranking based on measured emission data shows Saw A as coming last, this result is due to
the high values measured for the cutting test, and is not seen in any of the other ranking results.
Generally Saw E ranks consistently as a low-vibration machine, and Saw C ranks consistently
as a high vibration machine. Saw B tends to be ranked as a lower vibration machine, and Saw D
tends to come out as a higher vibration machine, although the measured emission values put this
tool in first place.
It must be noted that some of the values used in this ranking assessment are very close (e.g. saw
A and saw B for predicted emission are 5.59 and 5.57m/s²). To assess which saws can be
demonstrated to be statistically different, paired-t tests have been performed on the in-forest
vibration data (using data grouped by work mode). The details of the analysis are given in
Annex D.
Annex D show that there is no statistically significant difference between saws A, B and D.
Combining this with the rankings based on the in-forest measurements, gives saw E as the
lowest vibration tool, saw C is the highest and, between these, saws A, B and D share an equal
ranking.

34
4.5
METHODS OF ESTIMATING DAILY VIBRATION EXPOSURE
4.5.1 Using measured in-forest vibration values and time -study exposure times
Table 8 shows that for all forest operations, except arboriculture and cross cutting, daily
exposure consistently exceed the 2.5 m/s²A(8) exposure action value (EAV) defined in the EU
Physical Agents (Vibration) Directive.
In four cases the Physical Agents (Vibration) Directive daily exposure limit value (ELV) of
5 m/s²A(8) is exceeded, these are all for the use of saw C.
For Cross-cutting and arboriculture operations, all exposures are at or below the 2.5 m/s²A(8)
EAV.
4.5.2 Using vibration emission mode test data and time -study exposure times
When Tables 8 and 10 are compared, it is noticeable that there are substantial differences
relating to saw A. In Table 10, for saw A the exposure estimates are consistently much higher
than the 5 m/s²A(8) ELV. This change is due to the high emission test result for cutting for saw
A; this emission value is also much higher than the predicted emission data from Table 21 and
means that the daily vibration exposure estimates using emission mode data are high for saw A.
This finding is very apparent in Table 20 where the large percentage differences for saw A are
noticeable where exposure is calculated using the emission mode data.
4.5.3 Using vibration average emission test data and time -study exposure times
When comparing Tables 10 and 12 with Table 8, the effect of the high emission test result for
saw A is apparent, but is less noticeable when the measured average emission values are used in
Table 12.
If the results from saw A are excluded for the data, Table s 20 shows that moving to Emission
averaged data (Table 12) produces another small increase in the errors of estimation of daily
vibration exposure assessment, increasing from 16% to 18% r.m.s. difference.
4.5.4 Using vibration published emission data and time -study exposure times
The published emission data is not affected by the exceptional measured emission values for
saw A when cutting. For published emission data and nominal exposure time (Table 17) there is
little effect of removing saw A from the analysis.
The error values shown in Table 20 suggest that estimates based on the published data are
slightly biased towards overestimates of the daily vibration exposure, but still allow errors as
much as +47% and –33%. The r.m.s difference increases to 25%, compared to 16% and 17% for
the assessments based on measured emission data.
4.5.5 Using measured in-forest vibration values and nominal exposure times
The use of nominal exposure times, provides a degree of simplification of vibration exposure
assessment, without substantially affecting the accuracy of the assessment. Table 17 and the
final column in Table 20 show that this simplification in estimating exposure times introduces
an error of between –8% and + 3% (r.m.s value of 4%), theses errors are much less than the
errors introduced by the use of emission data.

35
4.6
SIMPLIFIED EXPOSURE ESTIMATION
The objective of this project was to assess whether exposure estimates could be made using an
equation of the form:
( ) (
)
T
e
e
C
K
a
A
+
=
8
In this equation the terms a
e
+ K effectively represent the in use vibration magnitude, and C
T
is
related to exposure time. The analysis suggests that, on average, the vibration emission values
are close to the average vibration magnitudes; therefore there is no need to use an additional
factor K (related to uncertainty of emission data). It is possible to use nominal exposure times,
and rounding to the nearest 10% of 8 hours appears to give an acceptable degree of accuracy.
In its simplest form, using the single value average emission value as a
e
, then a daily vibration
exposure estimate would be given by:
( )
hours
T
T
a
A
i
c
e
e
8
8
+
=
where T
c
and T
i
are the times spent cutting and idling. Using the percentage times p
c
and p
i,
gives:
( )
100
8
i
c
e
e
p
p
a
A
+
=
Using the nominal exposure percentages in Table 10(b), gives the values for the correction
factor C
T
shown in Table 24.
Table 24 Values for C
T
for the forest operations
Operation
100
i
c
T
p
p
C
+
=
First thin
0.71
Subs. Thin
0.67
Clear fell(SS)
0.75
Clear fell(pine)
0.74
Brashing
0.75
Cross cutting
0.38
Forest Cleaning
0.81
Arboriculture
0.31
4.7
EXAMPLE OF THE USE OF THE SIMPLIFIED EXPOSURE ESTIMATION
METHOD
The C
T
values can be used along with manufacturer’s emission data to estimate daily
exposures, For example: Saw A has a published emission value of 6.9m/s² (Table 13), if it is
used in clear felling operations, then multiply the emission value by the appropriate C
T
value
(0.75 for Sitka Spuce) to give 5.175, rounding this to 1 decimal gives a daily exposure estimate
of 5.2m/s²A(8).

36
If the C
T
values in Table 24 are used with the published emission values, then the highest axis
values of Table 13 will be reproduced. As shown in Table 20, the differences from the measured
daily vibration exposures will range from –33% to +47% (r.m.s value of 25%).
4.8
RECOMMENDATIONS ON T HE USE OF THE SIMPLIFIED ESTIMATION
METHOD
This study shows that for chainsaws the ISO 7505 emission data is a reasonable indicator of
likely vibration magnitude in real forest operations. The emission data can therefore be used to
calculate an indication of likely vibration exposures.
The simplified exposure method uses a lookup table of constants for each forest activity. This
method is capable of providing a reasonable indication of likely vibration exposure, for tasks
where the vibration exposure pattern is similar to those shown in Figure 4 and Table 6.
Where exposure patterns are different to those seen in this study, then assessments of exposure
time should be made. It is shown here that time needs to be assessed to the nearest nominal time
shown in Table 15, this approximates to an uncertainty of around -30% to +50% on the
assessed time and introduces an uncertainty in the assessed vibration exposure of ±7% or less
(last column in Table 20).
These simplified exposure assessment methods, based on published ISO 7505 data, might
usefully be used as a first stage vibration exposure assessment, to provide an indication of likely
exposure, but should not be used as evidence that exposure is below an EAV or ELV,
particularly where the predicted exposure value is close to the EAV or ELV.
It is important to note that the results from this study only apply to chainsaws. Evidence from
testing on other machine types shows that emission values are generally unreliable indicators of
the ranges of vibration magnitudes found in real work situations (S Hewitt and P Brereton 2000,
S.M Hewitt and D Smeatham 2000, R Hutt and D Smeatham 2002).

37
5
CONCLUSIONS
5.1
EMISSION TEST RESULT S
1. All the manufacturer’s published emission values were verified according to the definition
in EN 12096.
2. For four of the five machines the vibration emission values provided by ISO 7505 tests gave
results similar to those predicted by the in-forest measurements.
3. For one machine, Saw A, the ISO 7505 tests on the machine did not correspond to either the
in-forest measurements or the manufacturer’s published data.
4. For three of the five machines the published vibration emission was more than one standard
deviation from the average of those predicted by the in-forest measurements.
5. For Saw D the published vibration emission was more than two standard deviations higher
than the average of those predicted by the in-forest measurements
5.2
IN-FOREST TEST RESULTS
6. For the in-forest measurements, saws A, B and D gave results, which were shown to be not
significantly different.
7. Saw E (the top-handled saw) and Saw C were shown to be statistically different from the
other saws.
8. Ranking test showed that Saw E is the lowest-vibration saw and saw C is the highest, the
others share equal ranking.
9. For all forest operations, except arboriculture and cross cutting, daily exposure consistently
exceed the 2.5 m/s²A(8) exposure action value (EAV) defined in the EU Physical Agents
(Vibration) Directive. In four cases the Physical Agents (Vibration) Directive daily
exposure limit value (ELV) of 5 m/s²A(8) is exceeded, these are all for the use of saw C.
5.3
SIMPLIFCATIONS OF EXPOSURE BASED ON PUBLISHED EMISSION
VALUES
10. There is some scope for simplification of exposure assessment, using nominal exposure
times for job categories, rather than exact exposure times.
11. A table of multiplying values has been produced (Table 24). This can be used for converting
emission values to exposure estimates for the eight job categories seen in this study. Use of
this table has been shown to result in errors in daily exposure estimates in the range from –
34% to +46% when used with published emission data.
12. The use of this simplified exposure assessment methods, based on published ISO 7505 data,
might usefully be used as a first stage vibration exposure assessment, to provide an
indication of likely exposure, but should not be used as evidence that exposure is below an
EAV or ELV, particularly where the predicted exposure value is close to the EAV or ELV.

38
6
ACKNOWLEDGEMENTS
The author would like to thank:
Mr C Saunders, FR-TDB
For organising and collating the time-study data, and for
organising vibration measurement sites and operating
chainsaws.
Mr M Mole, HSL
For processing vibration measurement data and assisting with
the in-forest vibration measurements.
Mrs S Hewitt, HSL
For assisting with in-forest vibration measurements and
reviewing the final text.
Miss A Darby, HSL
For assisting with in-forest vibration measurements.

39
7
REFERENCES
1. P M Pitts, W Jones, J Hodges, and S Hewitt Vibration exposure from chain saws Parts 1 - 4
HSE, RLSD Internal reports 1990
2. ISO 7505:1986 “Forestry machinery - Chain saws - Measurement of hand-transmitted
vibration”
3. European Parliament and the Council of the European Union (2002) Official Journal of the
European Communities Directive 2002/44/EC on the minimum health and safety
requirements regarding the exposure of workers to the risks arising from physical agents
(vibration). OJ L177, 6.7.2002, p13.
4. ISO 5349-1:2001 Mechanical vibration - Measurement and evaluation of human exposure
to hand-transmitted vibration - Part 1: General requirements
5. EN 12096:1997 Mechanical vibration. Declaration and verification of vibration emission
values
6. Forest Research – Technical Development Branch Contract Report ref 1100A/35/03 HSL
Chainsaw vibration, operator exposure values November 2003
7. Moroney M J Facts f rom figures Penguin Books 1990 ISBN 0-14-013540-5
8. S Hewitt and P Brereton Measurement of hand-tool vibration emission and workplace risk
Proceedings of IOA Spring Conference 2000. 17-18 April 2000.
9. S.M Hewitt and D Smeatham Correlation of vibration emission data with vibration in use -
Final Report HSL Internal Report NV/00/11, June 2000.
10. R Hutt and D Smeatham The relationship between vibration emission and workplace risk
assessment” Proceedings of IOA Spring Conference 2002. Vol. 24, Pt4.

40
8
GLOSSARY
Actual exposure time ............... See “Exposure time, actual”
Averaged emission data ........... See “Emission data, averaged”.
Brashing ................................. Removing branches up to chest height in a forest (to allow for
safe access).
Breast height ........................... 1.3m above highest ground level at the base of the tree
Clearfell.................................. Felling all trees in an area of forest.
Crosscutting ............................ Cutting felled tree stems to specified lengths.
Cutting ................................... ISO 7505 test mode: cutting through a test log, with the throttle
full open and the saw operating at maximum engine power
(controlled by the operator’s down force on the saw).
De-buttressing......................... Horizontal and vertical cuts at the base of a standing tree, to
remove large root off-shoots that are visible above ground level.
This process is usually required prior to mechanical harvesting,
where these buttresses would obstruct the harvester.
Declared emission value .......... The result from a standardised vibration test on a machine
published by the manufacturer in the machine’s handbook.
Usually a vibration emission test is performed in controlled
operating conditions, and repeated with more than one operator.
Delimbing............................... Removing branches from stem (see brashing and snedding)
EAV....................................... “Exposure action value”, defined in the Physical Agents
(Vibration) directive as 2.5 m/s²A(8) for hand-arm vibration. A
value at or above which workers should not be exposed
ELV ....................................... “Exposure limit value”, defined in the Physical Agents
(Vibration) directive as 5 m/s²A(8) for hand-arm vibration. A
value at or above which actions must be taken to reduce and
manage exposure.
Emission data, Average ........... The average of the vibration from the three emission modes
defined in ISO 7505, i.e.: the average of the “idling”, “cutting”
and “racing” tests. This is the value that is the declared
emission value for chainsaws.
Emission mode data................. ISO 7507 emissio n test data from individual test modes, i.e. the
data from each test mode “idling”, “cutting” and “racing”.
Emission modes ..................... The vibration emission test for chain saws is based on an
average result from three operating modes: “idling”, “cutting”
and “racing”.
Exposure time ......................... The exposure time of an operator to a machine, usually while
operating in a specified mode.
Exposure time, actual .............. Used in this report to refer to the exposure time assessed from
time studies.
Exposure time, nominal........... The actual exposure time rounded to convenient “simple”
durations (e.g. 2 hours, ½ hour, 15 mins).

41
Felling (cuts)........................... Use of the chain saw to cut through the base of the standing
tree. These usually consist of three cuts, two vertical and
horizontal, to create the triangular cross-section “gob” at the
front of the tree, and the final horizontal cut from the back of
the tree, to leave just the hinge, about which the tree falls.
Hand position – support .......... Same as “hand-position – front”. For in-forest measurement this
position is further clarified by either “top” or “side”, where
“top” represents the normal left-hand position with the saw held
for vertical cuts, and “side” represents the normal left-hand
position with the saw held for horizontal cuts.
Hand position – Throttle ......... Same as “hand-position – rear” (the right-hand position)
Idling...................................... 1) ISO 7505 test mode: saw idling at speed specified by the
manufacturer.
2) During forest use: the saw is running but the throttle is not
being held.
Job type ................................. General name for the type of forestry work being undertaken
(e.g. “General thinning”, “Arboriculture”)
Nominal exposure time ............ See “Exposure time, nominal”
Predicted emission values ........ An emission value based on the in-forest measurement of
vibration during normal use. The results for the idling and
cutting modes are substituted by in-forest data from activities
that correspond to idling or cutting activities (for the purpose of
the predicted emission, racing is assumed to be the same as
cutting)
Published emission data ........... The ISO 7505 results published by the chain saw manufactures
for the five saws used in this study (see also “declared emission
value”.
Racing .................................... ISO 7505 test mode: the saw speed is set to 133% of the saw
speed at maximum power or its maximum speed (whichever is
less).
Revving.................................. During forest use: running the saw under no load, usually with
rapid changes to the throttle setting.
Snedding................................. Removing branches from felled trees, to provide access to the
stem
Stem....................................... Trunk of tree
Thinning operations ................. Felling saplings and young trees to provide greater forest space
for the crop.
Vibration emission .................. The vibration produced by the machine while operating (units:
m/s²)
Vibration exposure ................. The total daily exposure to vibration of a machine operator. The
units for exposure are expressed as “m/s²A(8)” to distinguish
them from vibration emission values.

42
ANNEX A CHAINSAW DETAILS
Note – the information on engine size, power, guide-bar range, weight and emission values
given in this annex is generic information for the chainsaw type, obtained from the
manufacturer’s web site or instruction manual.
A.1 SAW A
HSL Sample ID
NV/02/45
Engine size
45cm³
Power
2.4kW
Guide bar range
41-46cm
Weight without chain and bar
4.9kg
Declared emission values
Left (front) hand: 5.9 m/s²
Right (rear) hand: 6.9 m/s²
A.2 SAW B
HSL Sample ID
NV/02/46
Engine size
56.5 cm³
Power
3.2 kW
Guide bar range
33 - 60 cm
Weight without chain and bar
5.5 kg
Declared emission values
Front: 3.9 m/s²
Rear: 4.2 m/s²
A.3 SAW C
HSL Sample ID
NV/02/47
Engine size
49.3 cm³
Power
2.6 kW
Guide bar range
38 - 50 cm
Weight without chain and bar
4.9 kg
Declared emission values
8.8 m/s²
A.4 SAW D
HSL Sample ID
NV/02/48
Engine size
48.7 cm³
Power
2.6 kW
Guide bar range
37 - 40 cm
Weight without chain and bar
4.7 kg
Declared emission values
Front: 6.9 m/s²
Rear: 7.6 m/s²

43
A.5 SAW E
HSL Sample ID
NV/02/49
Engine size
35.2 cm³
Power
1.7 kW
Guide bar range
30 - 35 cm
Weight without chain and bar
3.5 kg
Declared emission values
Front: 3.4 m/s²
Rear: 5.3 m/s²
44
ANNEX B HAND-ARM VIBRATION FOREST MEASUREMENTS
B.1 SAMPLE OF ANALYSIS – SHOWING DETAIL OF FREQUENCY ANALYSIS
MeasurementID
75
Date
12/03/2003
SiteID
1
DATTapeNo
2
VideoNumber
2
InstrumentSetUpID
4
DATIDNumber
1
ReportID
DATStartTime
10:24:52
VideoStart time 10:24:52
ResultsID
212
DATStopTime
10:25:30
VideoStop time 10:25:30
Duration
00:00:38
Continuousoperation? n
Machine:
Echo CS-5100
Activity
Snedding
HandPosition:
Rear handle
Comments
Brief pause to idling with saw on tree, in middle of
Handleft/right:
r
this period
Freq
X-
axis
Y-
axis
Z-axis
1.6
0.98
1.29
0.89
2
1.12
0.94
0.76
2.5
1.42
0.94
0.81
3.15
1.47
0.91
0.74
4
1.37
0.85
0.71
5
1.30
0.62
0.80
6.3
1.12
0.51
0.72
8
1.09
0.36
0.76
10
1.11
0.38
0.84
12.5
0.96
0.35
0.92
16
1.02
0.37
1.16
20
1.18
0.38
1.22
25
1.20
0.39
1.66
31.5
1.21
0.44
1.88
40
2.01
1.14
2.15
50
3.17
1.66
2.21
63
3.84
1.72
2.89
80
4.05
1.65
3.29
100
4.76
1.61
3.55
125
6.47
2.40
6.36
160
15.33
4.37
13.96
200
53.68
18.02
47.33
250
22.20
9.38
19.60
315
5.22
2.34
2.76
400
14.06
7.09
4.80
500
9.83
4.27
3.20
630
7.02
6.11
3.57
800
4.72
4.30
2.86
1000
2.58
2.70
1.66
1250
1.85
1.55
1.91
1600
2.11
1.10
2.48
2000
0.97
0.61
1.37
2500
0.69
0.64
1.04
ahw:
5.84
2.13
5.23
m/s²
ahv:
8.12
m/s²
Sensitivities (mV/(m/s²)):
x1
y1
z1
10
10
10
0.1
1
10
100
1
10
100
1000
10000
Frequency (Hz)
Acceleration (m/s²)
x-axis
y-axis
z-axis
0.01
0.1
1
10
0
5
10
15
20
25
30
35
Time (seconds)
Acceleration (m/s²)

45
B.2 SUMMARY OF VIBRATION TOTAL VALUES FROM IN-FOREST
MEASUREMENTS
Table B.1a Saw A
Saw
Hand
Activity
code Count Minimum MaximumAverage StdDev
Saw A
Support - side
B1
7
3.27
9.13
5.98
1.96
B2
27
5.03
8.39
6.81
0.90
B4
6
2.73
6.40
4.42
1.18
B5
12
4.96
11.15
6.12
1.83
C
5
4.61
9.94
6.37
2.10
Support - side Total
57
2.73
11.15
6.27
1.55
Support - top
B1
2
3.84
5.13
4.48
0.91
B3
29
4.73
7.63
5.68
0.62
B4
4
4.58
6.84
5.83
0.98
B5
18
3.14
8.45
4.88
1.31
C
1
4.34
4.34
4.34
C1
1
4.12
4.12
4.12
Support - top Total
55
3.14
8.45
5.33
1.01
Throttle
B1
7
3.33
5.94
4.70
1.05
B3
46
4.58
8.62
6.29
1.10
B4
11
4.95
7.42
6.05
0.88
B5
31
3.28
9.95
5.63
1.49
Throttle Total
95
3.28
9.95
5.93
1.29
Saw A Total
207
2.73
11.15
5.87
1.34

46
Table B.1b Saw B
Saw
Hand
Activity
code Count Minimum Maximum Average StdDev
Saw B
Support - side
B
3
1.65
2.64
2.29
0.55
B1
8
3.22
6.20
4.22
0.97
B2
32
3.00
10.37
6.39
1.52
B4
15
2.41
6.60
4.06
1.02
B5
9
3.05
9.85
5.82
2.50
C
2
3.65
5.35
4.50
1.20
C1
1
4.54
4.54
4.54
Support - side Total
70
1.65
10.37
5.32
1.89
Support - top
B1
8
2.09
4.26
3.49
0.66
B3
36
3.53
8.38
6.36
1.25
B4
14
5.53
11.34
7.14
1.39
B5
17
3.17
7.82
5.43
1.46
C
3
3.99
6.44
4.90
1.34
C1
3
3.41
5.78
4.85
1.26
C3
1
4.69
4.69
4.69
Support - top Total
82
2.09
11.34
5.89
1.61
Throttle
B
1
3.58
3.58
3.58
B1
4
1.47
6.01
4.58
2.10
B3
61
3.13
10.28
6.46
1.20
B4
14
3.20
5.35
4.43
0.73
B5
27
3.30
8.38
4.52
1.20
C3
2
2.58
6.64
4.61
2.87
Throttle Total
109
1.47
10.28
5.59
1.55
Saw B Total
261
1.47
11.34
5.61
1.67

47
Table B.1c Saw C
Saw
Hand
Activity
code Count Minimum Maximum Average StdDev
Saw C
Support - side
B1
2
3.9
5.4
4.7
1.1
B4
3
4.8
6.3
5.4
0.8
Support - side Total
5
3.9
6.3
5.1
0.9
Support - top
B1
10
2.1
6.1
4.0
1.2
B3
71
4.5
10.1
7.0
1.1
B4
16
3.9
9.7
6.8
1.4
B5
29
4.9
10.3
6.8
1.4
C
4
4.7
6.0
5.3
0.6
C1
3
3.9
5.7
5.0
1.0
Support - top Total
133
2.1
10.3
6.6
1.4
Throttle
B1
7
2.2
7.4
6.0
1.8
B3
28
6.5
10.3
8.4
0.9
B4
7
4.3
8.7
6.5
1.5
B5
20
5.5
10.9
7.9
1.5
C3
2
1.5
5.6
3.6
2.9
Throttle Total
64
1.5
10.9
7.6
1.7
Saw C Total
202
1.5
10.9
6.9
1.6

48
Table B.1d Saw D
Saw
Hand
Activity
code Count Minimum Maximum Average StdDev
Saw D
Support - side
B1
8
3.88
8.66
6.19
1.91
B2
20
4.61
9.25
6.37
1.15
B4
4
5.25
7.93
6.23
1.27
B5
7
4.65
8.65
5.96
1.36
C
3
4.77
8.10
6.82
1.80
Support - side Total
42
3.88
9.25
6.28
1.35
Support - top
B1
4
2.89
4.25
3.76
0.64
B3
27
5.16
9.76
6.73
1.14
B4
10
6.48
11.15
8.42
1.43
B5
14
5.02
7.66
5.96
0.68
C
1
3.51
3.51
3.51
C1
3
3.19
4.22
3.72
0.51
Support - top Total
59
2.89
11.15
6.42
1.68
Throttle
B1
5
1.44
10.30
6.36
3.72
B3
30
4.59
10.38
6.33
1.41
B4
20
2.01
8.97
6.26
1.89
B5
25
2.77
10.88
5.89
2.36
C2
1
5.54
5.54
5.54
C3
1
2.84
2.84
2.84
Throttle Total
82
1.44
10.88
6.13
2.02
Saw D Total
183
1.44
11.15
6.26
1.77

49
Table B.1e Saw E
Saw
Hand
Activity
code Count MinimumMaximumAverage StdDev
Saw E
Support - side
B1
5
4.40
9.04
6.28
1.72
B2
10
4.29
10.03
7.40
2.18
B4
2
9.81
9.93
9.87
0.08
B5
20
5.00
9.72
6.86
1.34
C
1
5.03
5.03
5.03
Support - side Total
38
4.29
10.03
7.04
1.75
Support - top
B1
4
2.47
3.67
2.97
0.51
B3
12
2.92
5.74
3.66
0.75
B5
27
2.99
6.04
4.10
0.80
C
2
3.98
4.10
4.04
0.08
C1
2
3.55
6.00
4.77
1.73
C2
1
2.74
2.74
2.74
C3
2
3.26
4.25
3.75
0.70
Support - top Total
50
2.47
6.04
3.89
0.85
Throttle (same as support - top)
B1
4
2.47
3.67
2.97
0.51
B3
12
2.92
5.74
3.66
0.75
B5
27
2.99
6.04
4.10
0.80
C
2
3.98
4.10
4.04
0.08
C1
2
3.55
6.00
4.77
1.73
C2
1
2.74
2.74
2.74
C3
2
3.26
4.25
3.75
0.70
Support - top Total
50
2.47
6.04
3.89
0.85
Saw E Total
88
2.47
10.03
5.25
2.04

50
ANNEX C PREDICTION OF EMISSION VALUES
C.1 PREDICTION OF VIBRAT ION EMISSION VALUES FROM IN-FOREST DATA
Table C1 summarises the data from in-forest test, with results grouped according to the
equivalent emission test modes of idling and cutting (none of the in-forest activities were judged
to have been equivalent to the third test mode of racing).
Table C.1 Summary of data values relating to idling and cutting equivalent modes
Saw
Hand
Equivalent
mode
Count
Min
Max
Average StdDev
Saw A
Support - side
Cutting
45
2.73
11.15
6.31
1.45
Idling
12
3.27
9.94
6.14
1.93
Support - top
Cutting
51
3.14
8.45
5.41
1.01
Idling
4
3.84
5.13
4.36
0.55
Throttle
Cutting
88
3.28
9.95
6.03
1.26
Idling
7
3.33
5.94
4.70
1.05
Saw B
Support - side
Cutting
59
1.65
10.37
5.51
1.97
Idling
11
3.22
6.20
4.30
0.91
Support - top
Cutting
67
3.17
11.34
6.29
1.44
Idling
15
2.09
6.44
4.13
1.10
Throttle
Cutting
103
3.13
10.28
5.65
1.50
Idling
6
1.47
6.64
4.59
2.07
Saw C
Support - side
Cutting
3
4.77
6.32
5.41
0.81
Idling
2
3.87
5.43
4.65
1.10
Support - top
Cutting
116
3.92
10.33
6.92
1.20
Idling
17
2.11
6.08
4.49
1.14
Throttle
Cutting
55
4.29
10.87
7.99
1.39
Idling
9
1.50
7.43
5.47
2.16
Saw D
Support - side
Cutting
31
4.61
9.25
6.26
1.19
Idling
11
3.88
8.66
6.36
1.81
Support - top
Cutting
51
5.02
11.15
6.85
1.37
Idling
8
2.89
4.25
3.71
0.51
Throttle
Cutting
75
2.01
10.88
6.17
1.88
Idling
7
1.44
10.30
5.74
3.31
Saw E
Support - side
Cutting
32
4.29
10.03
7.22
1.74
Idling
6
4.40
9.04
6.07
1.62
Support - top
Cutting
39
2.92
6.04
3.97
0.80
Idling
11
2.47
6.00
3.62
0.99
Grand Total
941
1.44
11.34
6.04
1.74

51
ANNEX D STATISTICAL ANALYSIS OF SAW MODE
DIFFERENCES
D.1 FOREST ACTIVITY MODES
Table D.1 uses the values from Table 4 to compare the results from the forest activities (in cases
where data is available for all saws).
Table D.1 Average acceleration values in m/s² for forest activity modes
Handle
Mode
Saw A
Saw B
Saw C
Saw D
Saw E
Support - side
B1
5.98
4.22
4.65
6.19
6.28
Support - side
B4
4.42
4.06
5.41
6.23
9.87
Support - top
B1
4.48
3.49
4.03
3.76
2.97
Support - top
B3
5.68
6.36
6.99
6.73
3.66
Support - top
B5
4.88
5.43
6.79
5.96
4.10
Support - top
C
4.34
4.90
5.27
3.51
4.04
Support - top
C1
4.12
4.85
5.01
3.72
4.77
Throttle
B1
4.70
4.58
6.02
6.36
2.97
Throttle
B3
6.29
6.46
8.43
6.33
3.66
Throttle
B5
5.63
4.52
7.92
5.89
4.10
There are clearly similarities between the test results for the five saws. Table D.2 provides a
statistical analysis of the results in Table D.1, to see whether any pairs of data sets are
significantly different.
A t-test (Moroney) has been used in Table D.2, to assess whether the results from one saw is
significantly different from the results from another. The result are expressed as:
?
“Highly significant” equivalent to a probability factor result less than 0.1%,
?
“Significant” equivalent to a probability factor result less than 1%,
?
“Probably significant” equivalent to a probability factor result less than 5% or
?
“Not significant” equivalent to a probability factor result 5% or more.
Where the results are shown as being “not significant”, then the results from the two saws are
statistically the same.

52
Table D.2 t-test analysis of differences between saws based on forest activity modes
Saw
mean
Variance
t
Probability
Significance
difference
(s²)
(%)
Differences from saw A
Saw B
0.06
0.48
0.22
82.85
Not significant
Saw C
1.29
0.68
4.14
0.32
Significant
Saw D
0.27
0.73
0.82
43.46
Not significant
Saw E
-1.23
0.95
3.34
1.03
Probably significant
Differences from saw B
Saw C
1.23
1.00
3.26
1.16
Probably significant
Saw D
0.21
1.05
0.54
60.71
Not significant
Saw E
-1.29
0.92
3.55
0.75
Significant
Differences from saw C
Saw D
-1.03
0.73
3.18
1.29
Probably significant
Saw E
-2.52
2.09
4.62
0.17
Significant
Differences from saw D
Saw E
-1.50
2.34
2.59
3.23
Probably significant
The results from Table D.2 are summarised in Table D.3. The Table shows that:
?
Saws C may be said to produce statistically significant differences from all the other
saws (although only the differences C – B and C – D are at the weaker “probably
significant” level)
?
Saw E may be said to produce statistically significant differences from all the other
saws (although only the differences E – A and E – D are at the weaker “probably
significant” level)
?
The differences between Saws A, B and D are statistically not significant.
Table D.3 Summary of significance results
SawA
SawB
SawC
SawD
SawB
Not significant
SawC
Significant
Probably significant
SawD
Not significant
Not significant
Probably significant
SawE
Probably significant
Significant
Significant
Probably significant

53
INDEX TO TABLES AND FIGURES
Table 1 Forests and tree types used for vibration measurements.....................................................................................3
Figure 1 Diagram of data recording system.....................................................................................................................4
Figure 2 Example of transducers fitted to rear handle .....................................................................................................5
Figure 3 Diagram of data analysis system........................................................................................................................6
Table 2 Chainsaw operating modes..................................................................................................................................7
Table 3 Number of studies per operation type.................................................................................................................8
Table 4 ISO 7505 emission test results (vibration total values in m/s²)...........................................................................9
Table 5 Summary of average hand-arm vibration test results, in m/s
2
...........................................................................10
Table 6 Daily exposure time-study results.....................................................................................................................11
Figure 4 Distribution of exposure times for the forest activities....................................................................................12
Table 7 Mapping of vibration measurement categories to time-study chain saw operating modes ..............................13
Table 8 Daily exposure estimates for activities based on in-forest measured vibration values and time-
study data (m/s²A(8)).....................................................................................................................................15
Table 9 Mapping of time-study modes to emission test modes .....................................................................................16
Table 10 Daily exposure estimates for activities based on ISO 7505 vibration emission test mode
values and time-study data (m/s²A(8))...........................................................................................................17
Table 11 Averaged emission values (m/s²) ....................................................................................................................18
Table 12 Daily vibration exp osure based on single value emission test data and time-study data
(m/s²A(8))........................................................................................................................................................19
Table 13 Manufacturer’s published emission test data (m/s²)........................................................................................20
Table 14 Daily vibration exposure based on published emission test data and time-study data
(m/s²A(8))........................................................................................................................................................21
Table 15 Nominal exposure time categories ..................................................................................................................22
Table 16 Nominal daily exposure times.........................................................................................................................23
Table 17 Daily vibration exposure based on in-forest measured vibration data and nominal exposure
times (m/s²A(8))..............................................................................................................................................24
Table 18 Comparison of highest handle daily vibration exposure estimates (m/s²A(8))...............................................26
Table 19 Comparison of highest handle daily vibration exposure estimates as percentage differences
from the detailed method (%)..........................................................................................................................27
Table 20 Comparison of highest handle daily vibration exposure estimates as percentage differences
from the detailed method, sorted by saw (%)..................................................................................................28
Table 21 Emission values predicted by forest tests (m/s²).............................................................................................29
Figure 5 Comparison of predicted emission and measured emission data (Note – the positive error
bars on published emission data represent the uncertainty values K).............................................................30
Table 22 Percentage difference in highest handle emission data from that predicted by in-forest
measurements..................................................................................................................................................30
Table 23a Vibration values used for assessing vibration ranking..................................................................................33
Table 23b Vibration ranking (high number = high vibration value)..............................................................................33
Table 24 Values for C
T
for the forest operations............................................................................................................35
Table B.1a Saw A...........................................................................................................................................................45
Table B.1b Saw B...........................................................................................................................................................46
Table B.1c Saw C...........................................................................................................................................................47
Table B.1d Saw D ..........................................................................................................................................................48
Table B.1e Saw E ...........................................................................................................................................................49
Table C.1 Summary of data values relating to idling and cutting equivalent modes .....................................................50
Table D.1 Average acceleration values in m/s² for forest activity modes......................................................................51
Table D.2 t-test analysis of differences between saws based on forest activity modes .................................................52
Table D.3 Summary of significance results ...................................................................................................................52
Wyszukiwarka
Podobne podstrony:
Forgotten Realms The Fighters 01 Master of Chains # Jess Lebow
Shock waves in molecular solids ultrafast vibrational spectroscopy of the first nanosecond
Attribution of Hand Bones to Sex and Population Groups
Effects of Kinesio Tape to Reduce Hand Edema in Acute Stroke
Hand of blood
Chains of luck
Comparison of theoretical and experimental free vibrations of high industrial chimney interacting
63 907 917 Chemical Depth Profiling of Tool Materials Using Glow Discharge Optical Emission
Attribution of Hand Bones to Sex and Population Groups
Niven, Larry ARM 2 The Long ARM of Gil Hamilton
The Legend of Kyrandia 2 Hand of Fate Komplettlösung
Knudsen, 3rd Hand in the Angers Fragment of Saxo Grammaticus
Elizabeth Hand Prince of Flowers
Nancy Drew 6 Secret of the Scarlet Hand
Hand of the Mysteries
Legend Hand of God poradnik do gry
057 Bonus Law of Vibration
więcej podobnych podstron