
Page 1 of 6
EJ_4H Method
Definition:
- Use H4 chart.
- Blue candles mean uptrend and red candles mean down trend, green ones (non-colored) means
directionless or range market.
- In most of the time changing red or blue color to green one means changing trend possibility.
- White line is 8SMA and yellow one is 55SMA; 8SMA swings and oscillates around 55SMA, they most of
the time play the role of resistances especially 55SMA that shows the longer term trend.
- When yellow line (55SMA) has a positive slope means the major trend is up and we buy, when
pointing down we go short (sell), the signals for enter long (buy) are:
o
Up pointing blue arrow
o
Blue candle
o
White line has crossed yellow one and pointing up
o
Yellow line has positive slope or is going to head up
Until candles are above the white line it means uptrend still has the momentum to go upper, same goes for
down trend, until candles are below the white line it means the downward momentum exists. Any close below
white line means the uptrend is going to over and this is a start for downward move, same goes for uptrend,
any close above white line indicates a potential reversing from downside to upside and moving up. This
happens most of time with green candles and the trend reverse with arrow signals and changing the color of
candles (from green or blue to red or form green or red to blue)
THE BEST ENTRY:
Most of the time after a sharp (strong trend) breakout or breakdown the price will reverse nicely after
reaching top in uptrend or dip in downtrend, this can be recognized by changing slope of white line, changing
color of candle and signal arrow, the close at the other side of the white line is a confirmation. The examples
may be easier to understand:
Page 2 of 6
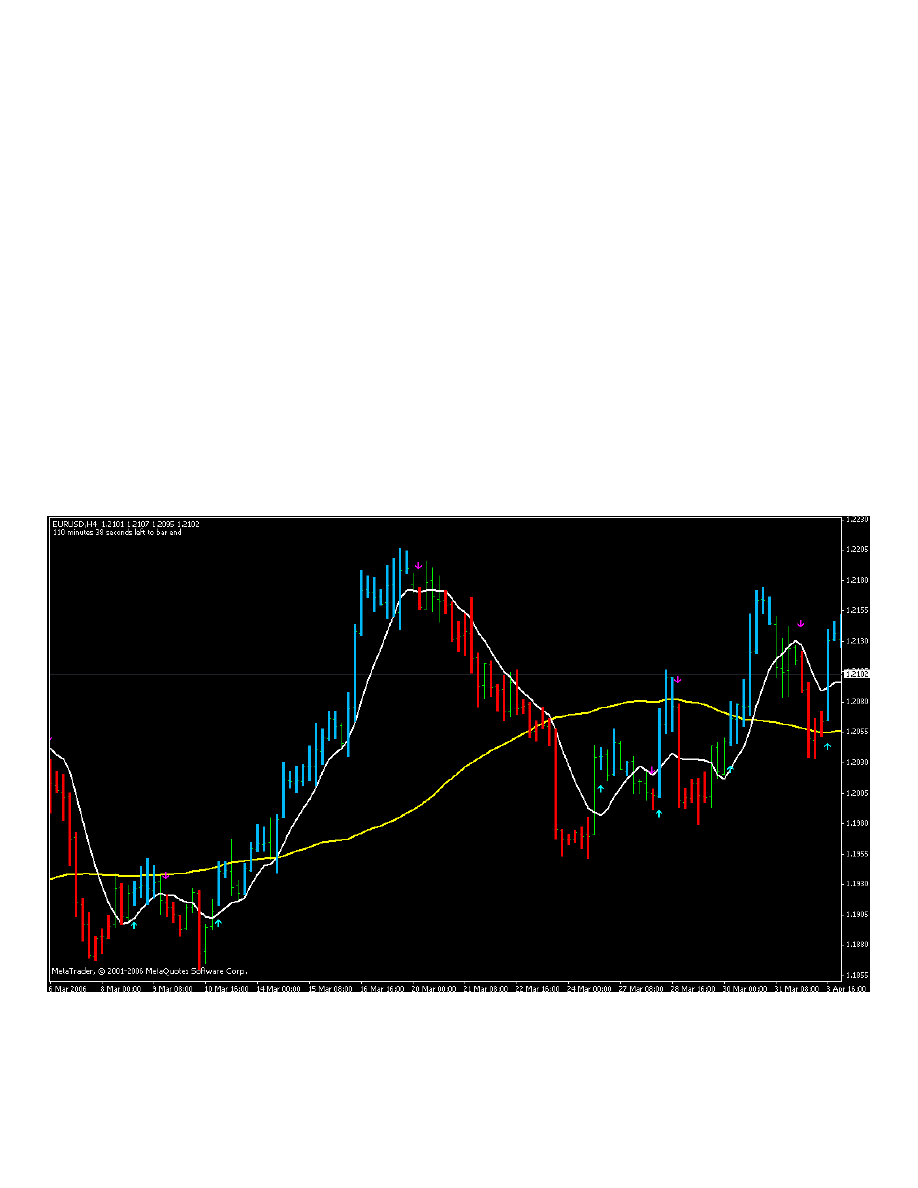
Example 1:
(EURUSD)
After a good uptrend (almost 350 pips) price movement stalls and just after the first close below white line
the color changes into red and the magenta arrow indicates a sell signal. Two close is better and three is a
charm. In these types of entries the stop loss will be about 10 pips above the higher high and the first target
will be yellow line. This is the easiest way to put a stop loss, any other way is OK, same goes for taking a
target level, for take profit the methods are different and this must be implemented better. The best
instruments that can be used to determine a good take profit and exiting time are:
- weekly and monthly pivot points
- Fibonacci resistances/extensions
- 100/200 EMA (Exponential Moving Average)
- Candle patterns especially hammer and spinning top near a moving average or PP (Pivot Point)
- Changing the slope of white line
- Changing the color of candles
- Close at the other side of white line
- Chart patterns especially double/triple top/bottom
It is not important that what implement or how many of them you use, the implementing is important, it
means that try to keep it as much as easy you can. The best systems are the simplest. In this type of entry
the slope of yellow must not be regarded except when price is getting closer to that, because it may rebound
from that and continue its major trend that would be our exit point.
Page 3 of 6
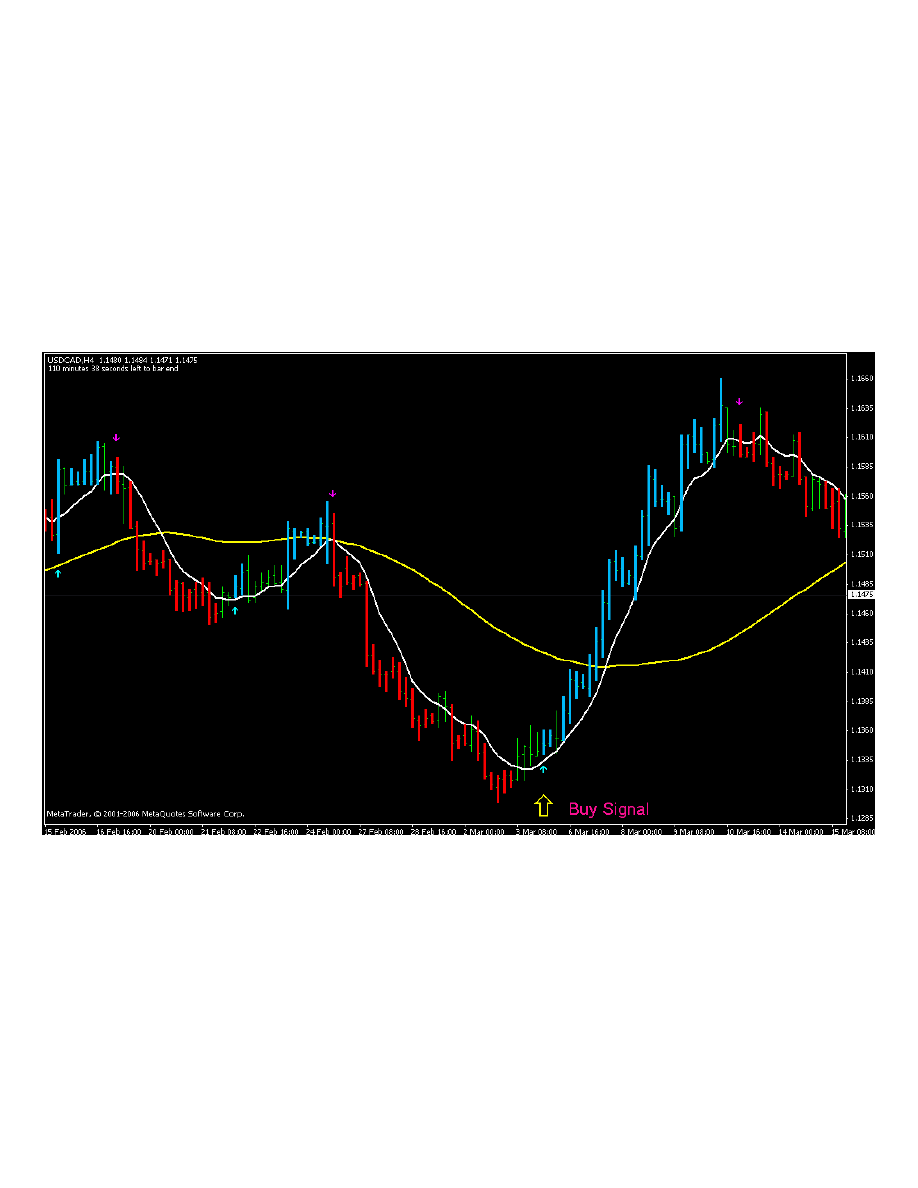
Example 2:
(USDCAD)
The distance between white line and yellow one is noticeable, changing color of candles, changing slope and
signal arrow means BUY, there are 2 green abreast candles before the entry point, look that there are two
close above whit line, but there is not any signal arrow and even the slope is still downward so it means that
the momentum to go down is still high and we must wait that price tends to reverse. You just need to trail
the price, up to top the candles are above white line and except two ones they are blue. Two green candles
are not combined with any other reversal signal, you should just tighten the stop loss when see such candles
and get out when see arrow signal or changing candle color. The range for this uptrend was about 360 pips.
Easily you could get 300 pips. After reaching top condition for entering a contrary sell position is OK.
Page 4 of 6
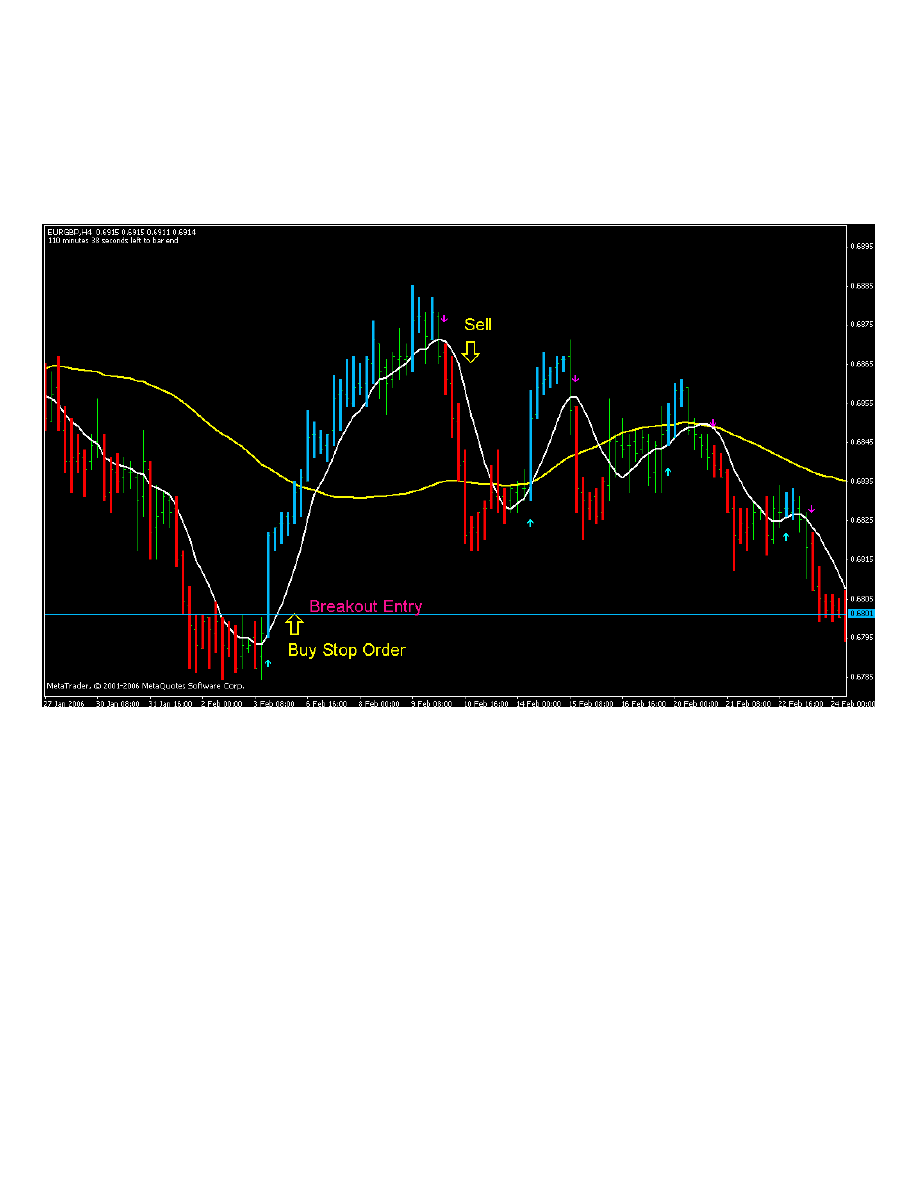
Example 3:
(EURGBP)
Two easy entry, distance between lines, close above and below white line in conjunction with arrow signal,
the first one is a buy entry that occurs after a range market (sideways), in such situations that we expect a
breakout a stop order is a very good confirmation and entry order. The range for uptrend is 100 and for
downtrend 70 pips, in most of cases more than 70% of range could be caught.
Page 5 of 6
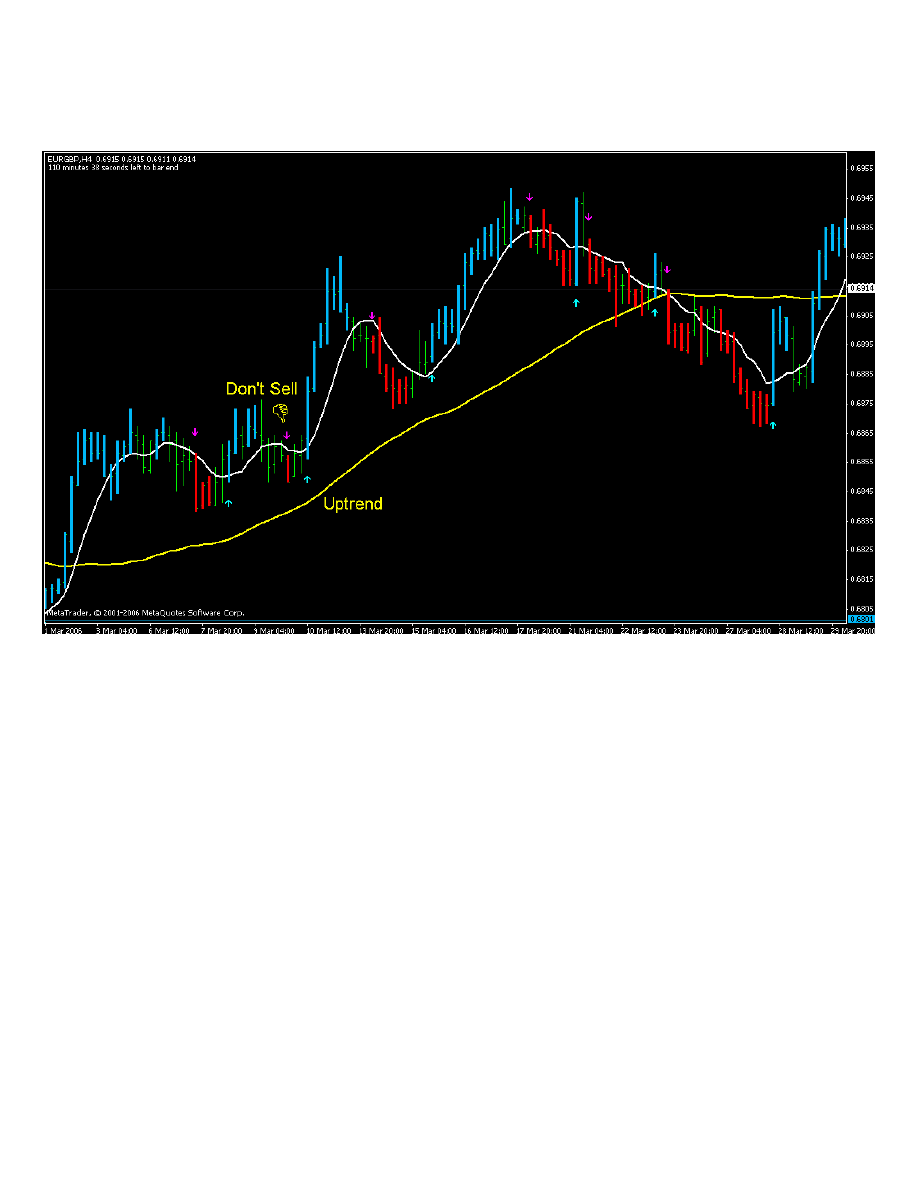
NOTES:
1- Never fight the trend; yellow line shows the main sentiments of the market; when it has a slope and the
difference between lines is not noticeable don’t enter.
Page 6 of 6
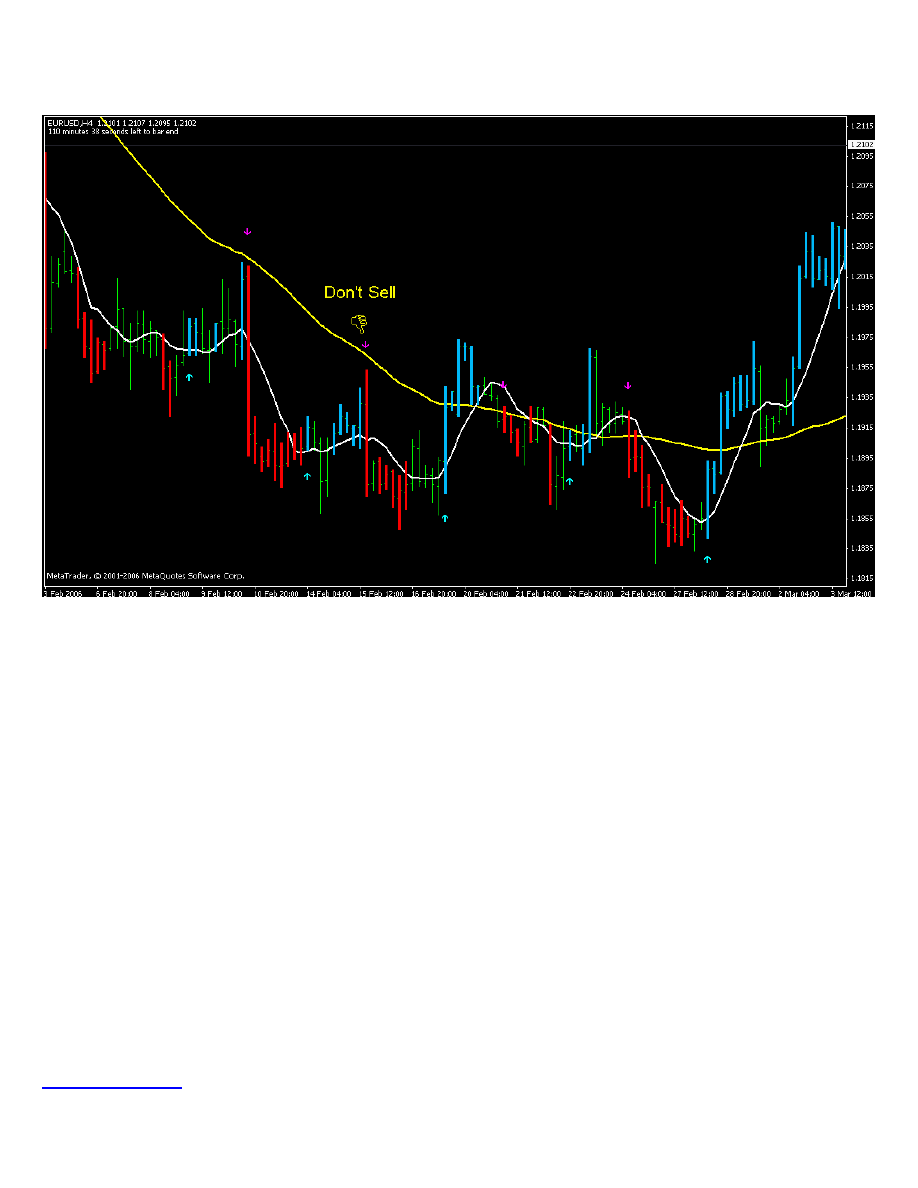
2-When the white line is below and there is a sell signal or when the white line is above the yellow one and
there is a buy signal, don’t enter, because this is not a reversal and it is just a retrace to 55SMA and you can
not enter a trade with a good risk-reward ratio.
3- Always trail the price with a good range till you exit.
4- The number of trades is not important in long run, the winners percentage is important.
5- Try not to be greedy and exit with a good profit.
6-Never trade till you see a strong signal, there will be weeks that you can not find anything to trade.
7-don’t trade ranging market, let price to get a good momentum and after its run enter a reversal.
8- Reversal trading is profitable because the risk (stop loss range) regarding profit range is very low (high
reward/risk) and you can easily discern between right and misleading signal.
9-Use other stuff to empower the method; Pivot points, Fibonacci, candle patterns and chart patterns are
appreciable.
10- With this method you normally will miss the first candle (the candle that bears arrow signal), don’t be
rash, wait for candle to be closed then consider.
11- Moving averages are lagging indicators but in higher time frames they work well, don’t try to test the
method in smaller charts, for shorter time frames moving averages are misleading indication.
12- H4 chart is a suitable time frame because you can trade with less stress rather than smaller time frames
that bear a hyper stress.
13- Every currency has its own behavior, try to be familiar before trading, you can back test and see what a
good distance is and how is a choppy market for that currency pair (symbol).
14- Implement the method for yourself, just keep it simple, when you trade profitably you can trade real.
15- In channel or ranging market use H1 chart and a breakout entry to get in a good time.
If you have any question regarding the method, don’t hesitate to email.
Happy Trading
Ibo
April 2006
Wyszukiwarka
Podobne podstrony:
EJ 4H Method Part II
EJ 4H Method Part III
4H
Symmetrical components method continued
Gunwitch Method
Opponens Pollicis KT method
SK-cw2 4h MODEMY opis przebiegu zaj dla studenta, Sieci Komputerowe
test z fizyki, Energetyka AGH, semestr 6, VI Semestr, Energia Jądrowa, EGZAMIN, EJ
Fibularis (Peroneus) Longus KT method
Flexor Hallucis Longus KT method
Popliteus KT method
Posterior Diaphragm KT method
Palmaris Longus KT method
Oblique Abdominis Externus KT method
Connexions 1 Methode de francais
Earned Value Method
więcej podobnych podstron