
National Indian Gaming Commission
Comparison Analysis of Various Class II
Configuration Options
BMM North America, Inc
The content of this document is strictly confidential. It has been prepared by
BMM North America (BMM) exclusively for the perusal of National final Indian
Gaming Commission and may not be disclosed to any other party without the prior
written approval of National Indian Gaming Commission
26 October, 2006

THE REFRESHING CHOICE IN TESTLABS
Comparison Analysis of Various Class II Configuration Options
Page i
simulation results 3
WPM October 26,2006
TABLE OF CONTENTS
1
Introduction
1
2
Description of the Simulator Parameters
1
3
Components
2
3.1
Bingo Game Templates
2
3.2
Experiments
2
4
Results
3
4.1
Experiment 1
3
4.2
Experiment 2
3
4.3
Experiment 3
4
4.4
Experiment 4
4
4.5
Experiment 5 Consensus versus One Touch
4
5
Effect of the Game Winning Prize
5
Appendix A: Configuration Experiments / Options / Results
THE REFRESHING CHOICE IN TESTLABS
Comparison Analysis of Various Class II Configuration Options
Page 1
simulation results 3
WPM October 26,2006
1
INTRODUCTION
BMM North America (BMM) has been asked by the National Indian Gaming Commission (NIGC) to
develop a Bingo simulator that could represent Class II Bingo games. The simulator has a number of
parameters that enable the game to be customized.
The NIGC also asked BMM to run a number of simulations with nominated parameters which match
various options under consideration. These simulations have been run and this report is a summary of the
findings of the simulation. The results are provided without comment. Note that Appendix A contains a full
description of the parameters and options used during the simulation runs and their outcomes.
2
DESCRIPTION OF THE SIMULATOR PARAMETERS
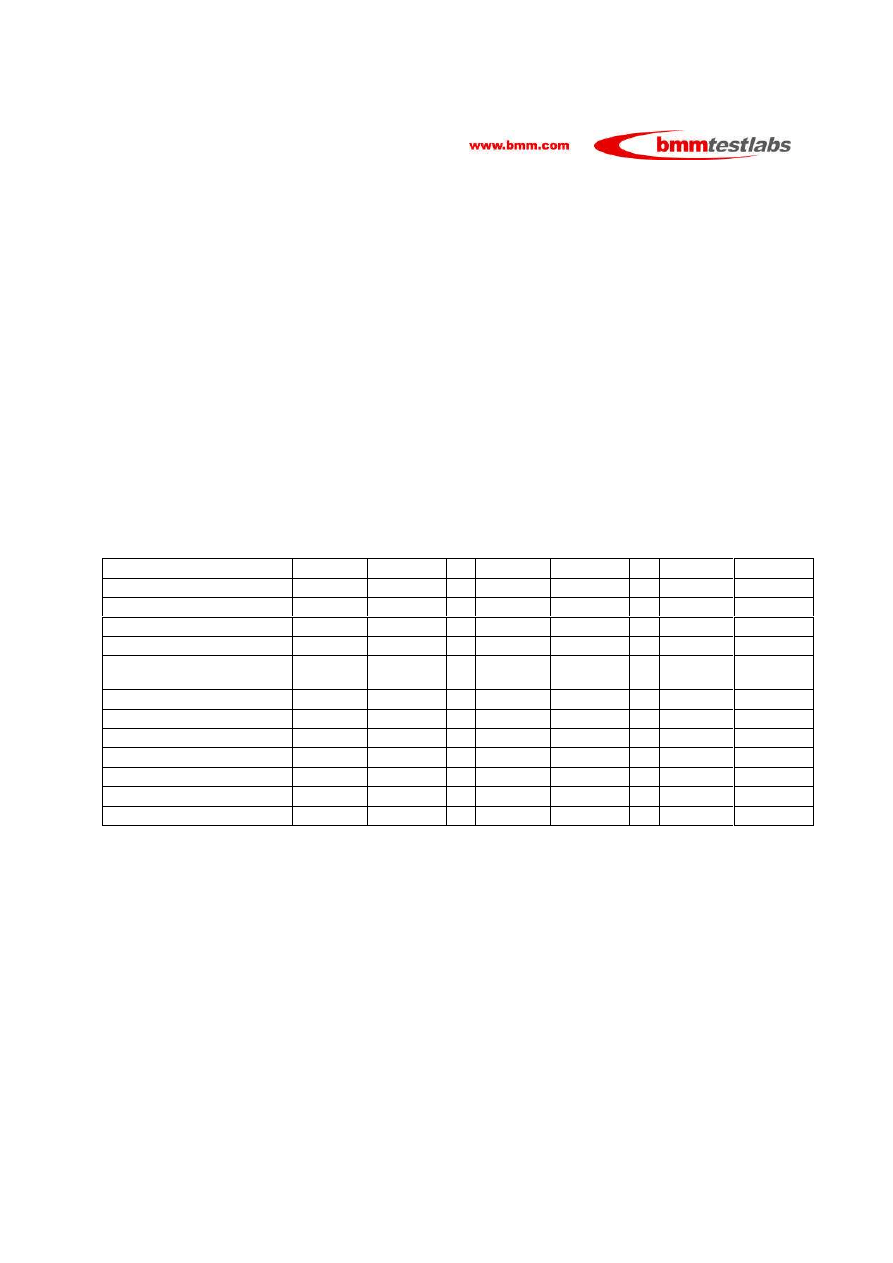
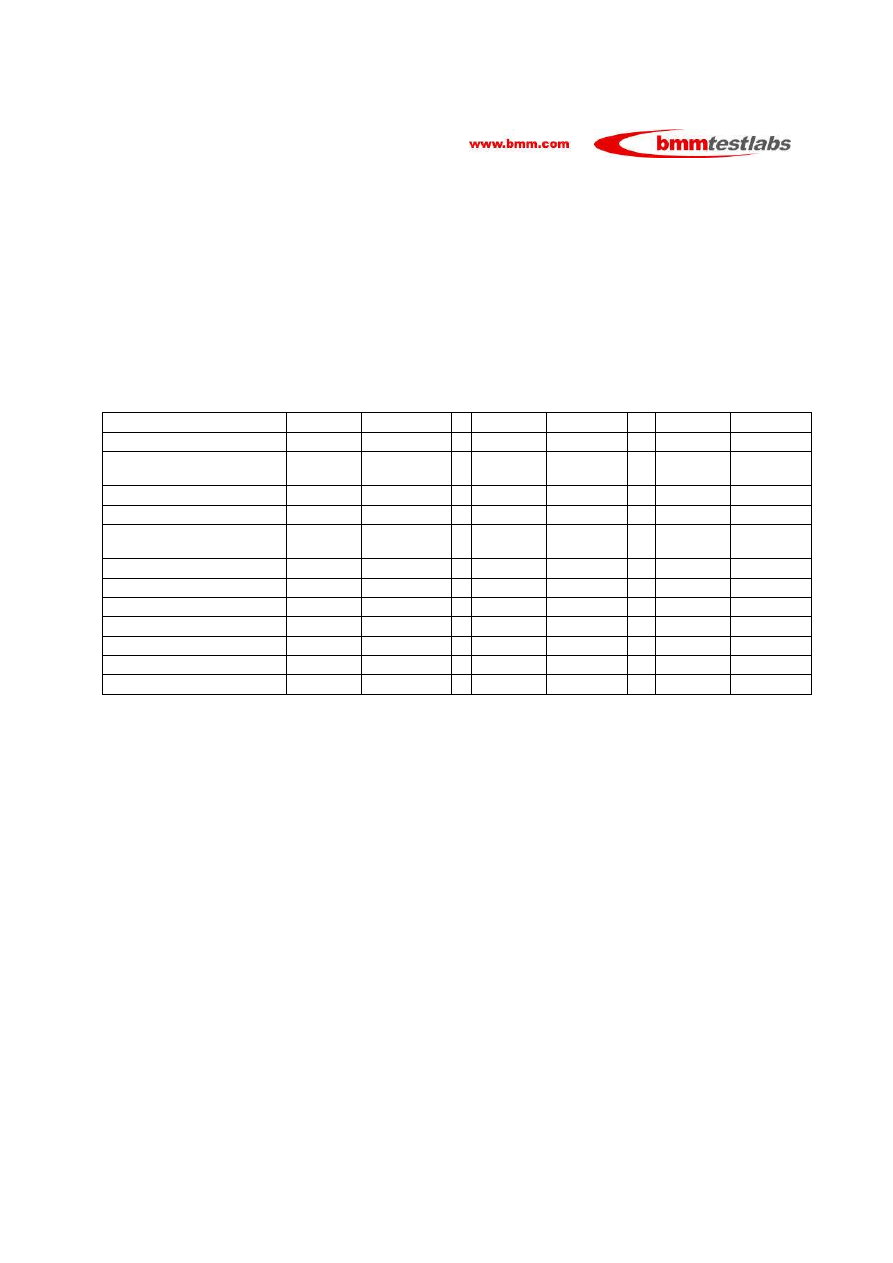
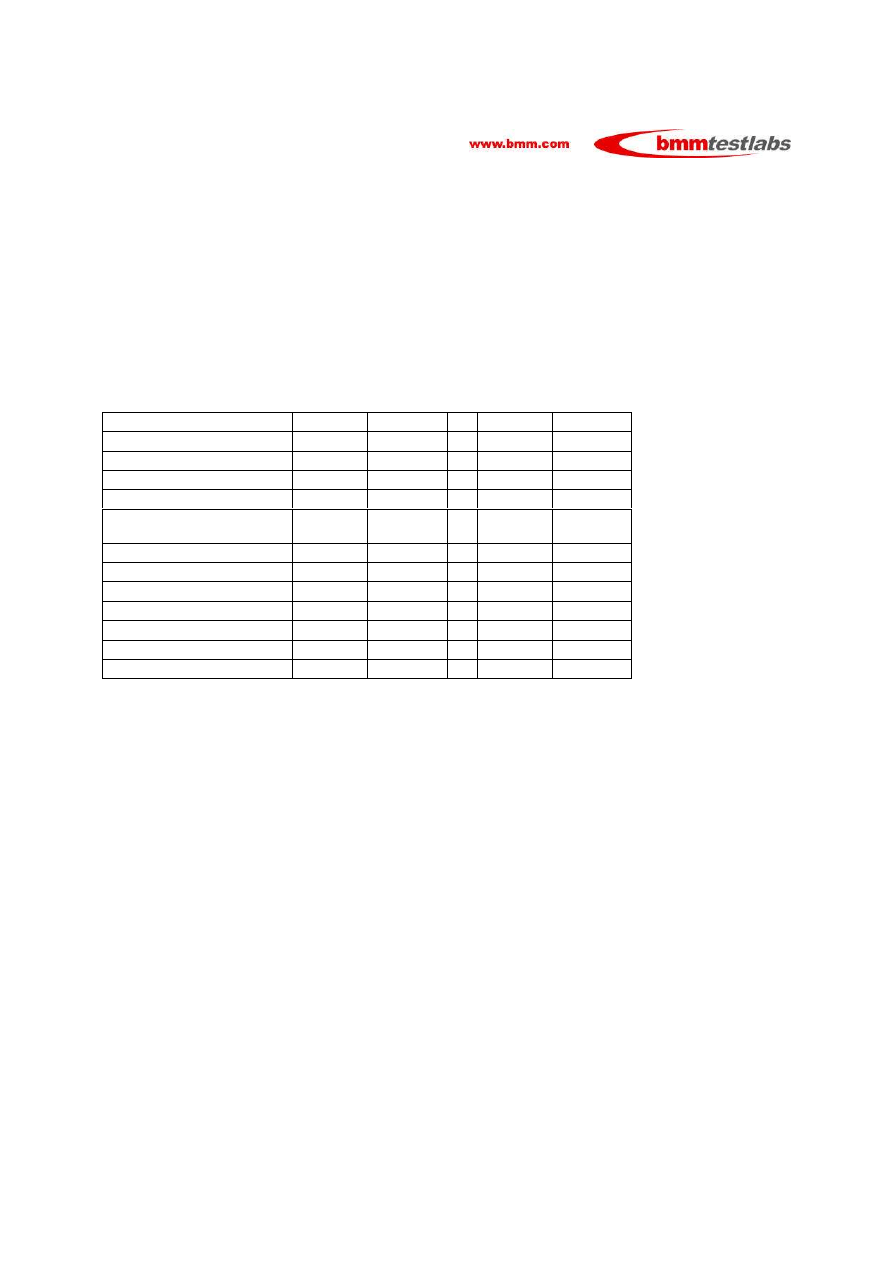
The following table, which has been extracted from Appendix A, describes the various parameters
available with the simulator.
Description
Minimum
Maximum
Minimum
Maximum
Minimum
Maximum
Time between games
1000
1000
1000
1000
1000
1000
Time to wait for all players
2000
2000
2000
2000
2000
2000
Time for first ball release
2000
2000
2000
2000
2000
2000
Time to wait for first cover
2000
2000
2000
2000
2000
2000
Time for second ball
release
2000
2000
2000
2000
2000
2000
Time for final claim
2000
2000
2000
2000
2000
2000
Time for fast start
N/A
N/A
12
2000
12
2000
Number Players
2
2
6
6
2
12
Fast Start / Duration
6
720
13
720
6
720
Games / Coin In
3762
4159600
4118
6893712
3981
6553310
Games & Coin In Rate
5.23
5777.22
5.72
9574.6
5.53
9101.82
Comparison
9.46%
5.82%
1) The Time parameters are fairly self explanatory. Their units are milliseconds. Thus the Time Between
Games for all of the experiments in the above table is 1,000 milliseconds or one second.
2) Where the Minimum and Maximum values are different, a random number is selected within their
range, inclusively.
3) The number of players represents those to participate in each Bingo game simulation. The first pair of
columns is two players in each game and the second pair six players in each game. The third pair
represents that a random number of players between two and twelve will participate in each game.

THE REFRESHING CHOICE IN TESTLABS
Comparison Analysis of Various Class II Configuration Options
Page 2
simulation results 3
WPM October 26,2006
4) The Fast Start parameter is used to reflect that a Bingo game under the current Classification
Standards may commence “early” if there are six or more players within the game, otherwise the
game would need to wait a full two seconds to start (the Time to wait for all players). In these
experiments, the Fast Start parameter was a variable between 12 milliseconds and two seconds
reflecting a real life variability in players starting the next play.
5) The duration is the time for which the experiment was run – in the table above, it was 720 minutes or
12 hours.
6) The outputs of the simulation are the number of Games played during the simulation run and the Coin
In obtained for that simulation.
7) These two outputs are converted to a rate per minute by dividing the result by the elapsed time. We
have chosen the Games played as the most meaningful statistic in the comparisons made during this
report. Thus the Games per Minute for the three experiments show Game Play rates of 5.23, 5.72 and
5.53 respectively.
8) The comparisons will vary between experiments but represent a percentage of Games Played for one
criteria versus Games Played for another criteria. In the table above, the comparisons show a 9.46%
higher Game Play rate for six players in a game and 5.82% greater game play rate for variable 2 to 12
players in a game.
3
COMPONENTS
3.1 Bingo Game Templates
There are three Bingo game templates described in detail in Appendix A. The following is a brief
description of each of the three templates:
1) “Compliant” – parameters that reflect the current state of the Classification Standards.
2) “Consensus” – parameters that reflect games that were the subject of Class II classification opinions
by the NIGC General Counsel.
3) “One Touch” – the most commonly implemented parameters for current Class II equipment.
3.2 Experiments
There were four experiments requested to be run which are described in Appendix A.
1) A comparison of the effect of the “Fast Start” option for Compliant Games i.e. game that would start
faster if six or more players are rapidly playing in each game. The rate or play for getting all players
active in the compliant game was set randomly in the range of 12 to 2000 milliseconds where
appropriate, perhaps more closely resembling what might happen in real life.

THE REFRESHING CHOICE IN TESTLABS
Comparison Analysis of Various Class II Configuration Options
Page 3
simulation results 3
WPM October 26,2006
2) A comparison of the outcome, Games Played, of the Compliant Games versus the outcome of the
Consensus games. The rate of play for getting all players active in a Consensus Game was set
uniformly as one second.
3) A comparison of the outcome, Games Played, of the Compliant games versus the outcome of the One
Touch games. The rate of play for getting all players active in a game was also set randomly in the
range of 12 to 2000 milliseconds where appropriate, perhaps more closely resembling what might
happen in real life.
4) A comparison of the Compliant Games versus both Consensus Games and One Touch Games in a
simulation of less and less play in the game within the casino. This has been structured to represent
a range of times between games as a means to broadly emulate the out of hours performance of a
typical casino.
4
RESULTS
The following is a brief summary of the results of these experiments for which details are contained within
the various Tables within Appendix A.
4.1 Experiment 1
This experiment performed a comparison of the performance effect of the “Fast Start” option for Compliant
Games i.e. in situations when there are six or more players in a game, it may start immediately rather than
wait the full two seconds. The outcome of the comparisons from this experiment show a 20.46% higher
Game Play rate for six players versus two players in a game and 16.25% greater game play rate for
variable 2 to 12 players in a game also versus two players. In absolute terms, for the 12 hours of the
simulation experiment, the results showed 3,762 games played with two players per game, 4,118 games
played with six players per game and 3,981 games played with a variable number of players per game
ranging between 2 and 12. The reason that the variable 2 to 12 players is a lower rate than the six players
per game is because in circumstances where five or less players join in a game, there must be a full two
seconds wait for the game to start, whereas with six fixed, that component of the waiting can be
dramatically reduced.
4.2 Experiment 2
This experiment performed a comparison of the performance of the Compliant Games versu s the
performance of the Consensus Games. The outcome of the comparison of the three runs, based upon
number of active players in a game, show a percentage increase of about 75%, 60% and 65% in games
played per minute for the Consensus Games when compared with the Compliant Games. In absolute
terms, for the 12 hours of the simulation experiment, the results showed 3,762 versus 6,583 games played
with two players per game, 4,118 versus 6,570 games played with six players per game and 3,981 versus
6,568 games played with a variable number of players per game ranging between 2 and 12 with the
former figure the Compliant Game results and the latter figure the Consensus Game results for each of
the three comparisons.

THE REFRESHING CHOICE IN TESTLABS
Comparison Analysis of Various Class II Configuration Options
Page 4
simulation results 3
WPM October 26,2006
4.3 Experiment 3
This experiment performed a comparison of the performance of the Compliant Games versu s the
performance One Touch Games. The outcome of the comparison of the three runs, based upon number
of active players in a game, show a percentage increase of about 152%, 130% and 137% in games
played per minute for the One Touch Games when compared with the Compliant Games. In absolute
terms, for the 12 hours of the simulation experiment, the results showed 3,762 versus 9,474 games played
with two players per game, 4,118 versus 9,457 games played with six players per game and 3,981 versus
9,452 games played with a variable number of players per game ranging between 2 and 12 with the
former figure the Compliant Game results and the latter figure the One Touch Game results for each of the
three comparisons.
4.4 Experiment 4
This experiment performed a comparison of the performance of the Compliant Games versu s the
performance of both the Consensus and One Touch Games in a simulation of less and less play in the
game within the casino. The outcome of this experiment is shown in Table D in the Appendix and shows a
diminishing effect of the rules and timing variations as the utilization diminishes, ranging from 57% down
to 5.7% for the Consensus Game versus the Compliant Game and 112% down to 9.2% for the One Touch
Game versus the Compliant Game. Appendix A also contains graphs which summarize the output.
4.5 Experiment 5 Consensus versus One Touch
As an extra analysis, we show in Appendix A the outcome of a comparison of simulation runs for one
consistent set of parameters of the Consensus versus One Touch game. This shows an improvement of
42.5% for the latter over the former. In absolute terms, for the 12 hours of the simulation experiment, the
results showed 6,583 versus 9,374 games played with the former figure the Consensus Game results and
the latter figure the One Touch Game results.
THE REFRESHING CHOICE IN TESTLABS
Comparison Analysis of Various Class II Configuration Options
Page 5
simulation results 3
WPM October 26,2006
5
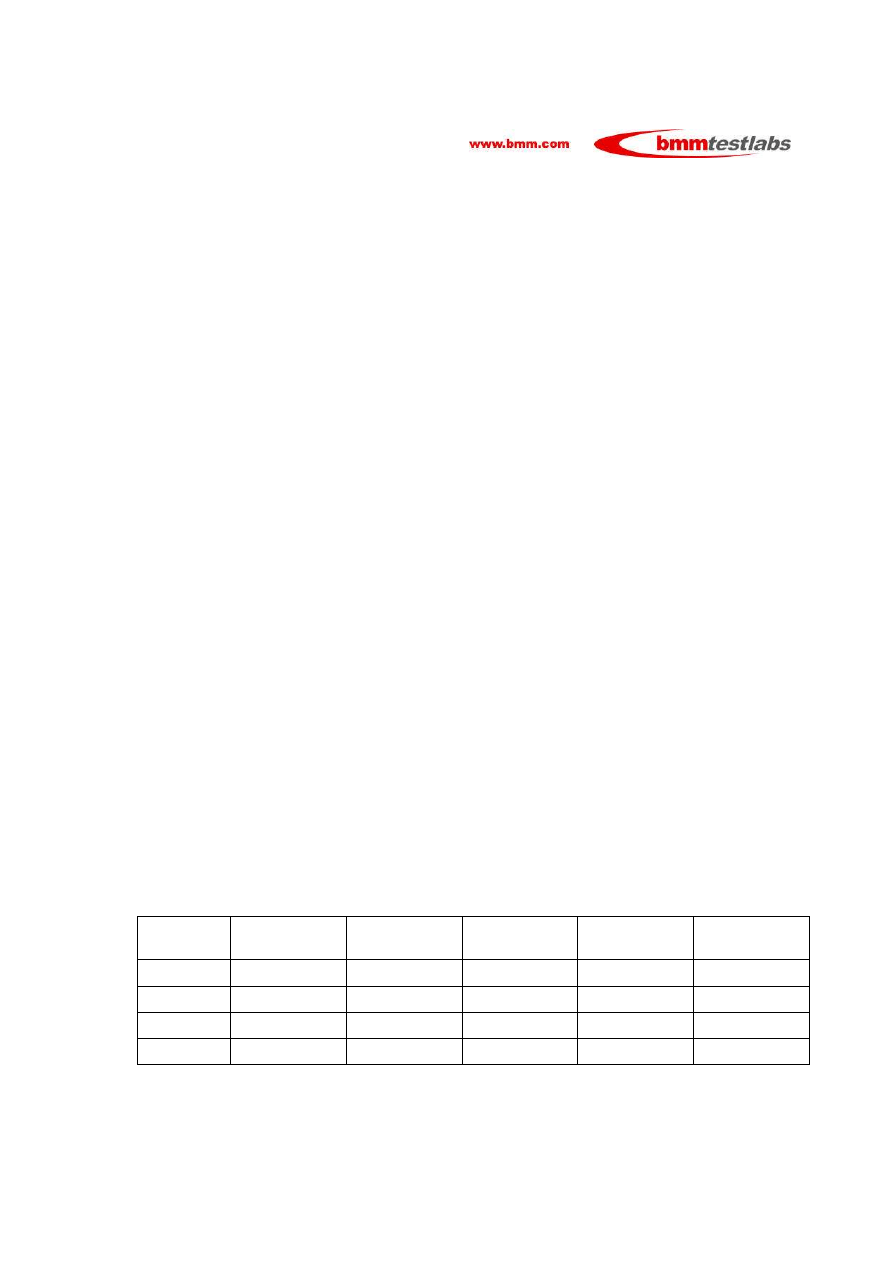
EFFECT OF THE GAME WINNING PRIZE
The Classification Standards establish a minimum prize for the game winning prize which is to be 20% of
the wager placed or one cent, whichever is greater. This can cause a high degree of variability of player
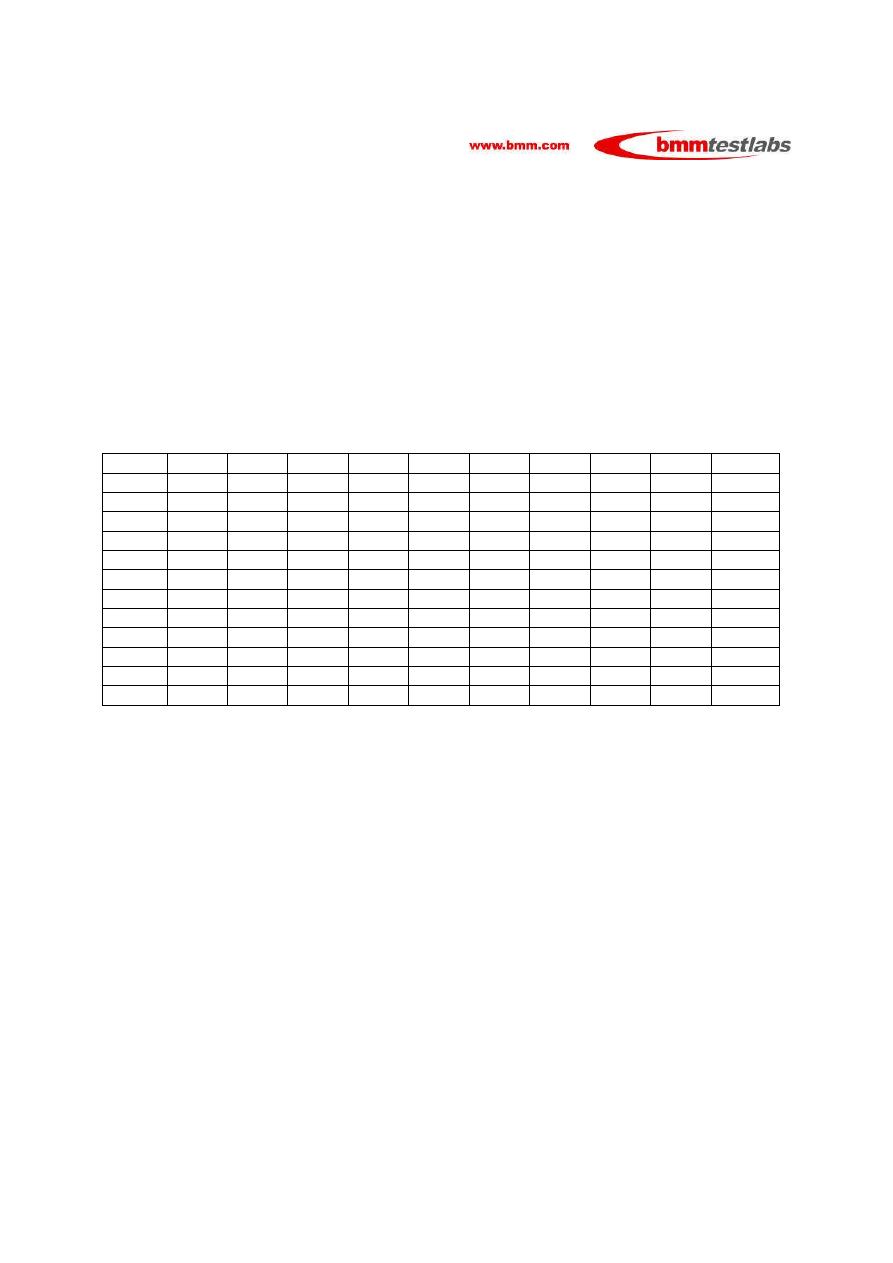
return depending upon the number of players in the game. The following table shows these variations with
the vertical column showing the number of players within a game and the horizontal the effect of the game
winning prize at various percentages. (The table assumes that there will be bets that are a direct multiple
of the percentage.
Players
1
2
3
4
5
8
10
12
15
20
2
0.5000
1.0000
1.5000
2.0000
2.5000
4.0000
5.0000
6.0000
7.5000
10.0000
3
0.3333
0.6667
1.0000
1.3333
1.6667
2.6667
3.3333
4.0000
5.0000
6.6667
4
0.2500
0.5000
0.7500
1.0000
1.2500
2.0000
2.5000
3.0000
3.7500
5.0000
5
0.2000
0.4000
0.6000
0.8000
1.0000
1.6000
2.0000
2.4000
3.0000
4.0000
6
0.1667
0.3333
0.5000
0.6667
0.8333
1.3333
1.6667
2.0000
2.5000
3.3333
7
0.1429
0.2857
0.4286
0.5714
0.7143
1.1429
1.4286
1.7143
2.1429
2.8571
8
0.1250
0.2500
0.3750
0.5000
0.6250
1.0000
1.2500
1.5000
1.8750
2.5000
9
0.1111
0.2222
0.3333
0.4444
0.5556
0.8889
1.1111
1.3333
1.6667
2.2222
10
0.1000
0.2000
0.3000
0.4000
0.5000
0.8000
1.0000
1.2000
1.5000
2.0000
11
0.0909
0.1818
0.2727
0.3636
0.4545
0.7273
0.9091
1.0909
1.3636
1.8182
12
0.0833
0.1667
0.2500
0.3333
0.4167
0.6667
0.8333
1.0000
1.2500
1.6667
Delta
0.4167
0.8333
1.2500
1.6667
2.0833
3.3333
4.1667
5.0000
6.2500
8.3333
As can be seen there is a large variability at 20% depending upon the number of players who participate
in a game. The payout table used was 89.1% for the bonus prizes which would mean a variation in player
return between 90.8% and 99.1% depending upon the number of players in the game.

Comparison Analysis of Various Class II Configuration Options
Page A- 1
simulation results 3
WPM October 26,2006
Appendix A
Configuration Experiments / Options / Results
The following experiment / configuration options were used for the various simulation experiments
conducted by BMM:
1. Measure variability in games played and coins handled within the compliant “three-touch” game
itself.
Constants:
Time between games =1,000 ms
Time for first ball release = 2,000 ms
Time for first cover = 2,000 ms
Time for second ball release = 2,000 ms
Time for final claim all = 2,000 ms
Wager size = 1 (100) to 10 (1,000) coins, random.
Variables in different simulations:
A. Assume two players at all times.
Time to wait for all players = 2,000 ms
B. Assume six players at all times.
Time to wait for all players = 12 ms to 2,000 ms, random.
C. Assume 2 - 12 players.
Time to wait for all players = 2,000 ms, unless Number of players > 5, in which case time to wait
for all players = 12 ms to 2,000 ms, random.
Comparison Analysis of Various Class II Configuration Options
Page A- 2
simulation results 3
WPM October 26,2006
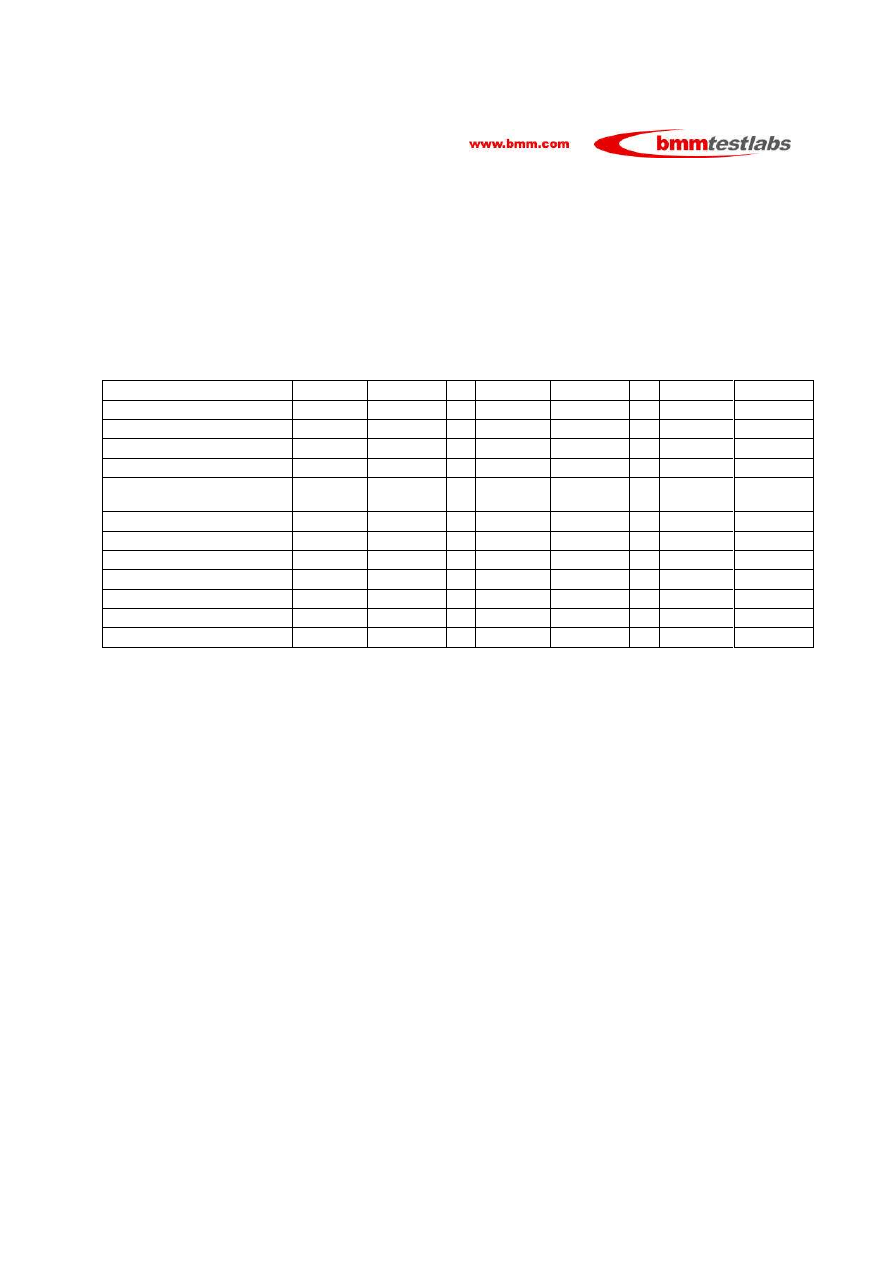
Results:
For this comparison experiment, the time to start the game is variable between 12 and 2,000 milliseconds
representing a medium pace of game play. With the compliant game, if there are less than 6 players, the
full two seconds is the time between games.
Table A
Description
Minimum
Maximum
Minimum
Maximum
Minimum
Maximum
Time between games
1000
1000
1000
1000
1000
1000
Time to wait for all players
2000
2000
2000
2000
2000
2000
Time for first ball release
2000
2000
2000
2000
2000
2000
Time to wait for first cover
2000
2000
2000
2000
2000
2000
Time for second ball
release
2000
2000
2000
2000
2000
2000
Time for final claim
2000
2000
2000
2000
2000
2000
Time for fast start
N/A
N/A
12
2000
12
2000
Number Players
2
2
6
6
2
12
Fast Start / Duration
6
720
13
720
6
720
Games / Coin In
3762
4159600
4118
6893712
3981
6553310
Games & Coin In Rate
5.23
5777.22
5.72
9574.6
5.53
9101.82
Comparison
9.46%
5.82%
2. Measure difference in games played and coins handled between compliant three-touch game
and game meeting requirements of Consensus ("Consensus game").
Constants:
Consensus Game:
Time between games = 1,000 ms
Time to wait for all players = 1,000 ms
Time for first ball release = 10 ms
Time for first cover = 2,000 ms
Time for second ball release = 10 ms
Time for final claim = 2,000
Wager size = 1 (100) to 10 (1,000) random.
Comparison Analysis of Various Class II Configuration Options
Page A- 3
simulation results 3
WPM October 26,2006
Compliant Game:
Time between games = 1,000 ms
Time for first ball release = 2,000 ms
Time for first cover = 2,000 ms
Time for second ball release = 2,000 ms
Time for final claim = 2,000
Wager size = 1 (100) to 10 (1,000) random.
Variables in different simulations:
A. Assume two players at all times in both games.
Time to wait for all players in compliant game = 2,000 ms
B. Assume six players at all times in both games.
Time to wait for all players in compliant game = 12 ms to 2,000 ms, random.
C. Assume 2 - 12 players in both games.
Time to wait for all players = 2,000 ms, unless Number of players > 5, in which case time to wait
for all players = 12 ms to 2,000 ms, random.
Results, Consensus Game – see Table A in section 1. for results of Compliant Game.
Table B
Description
Minimum
Maximum
Minimum
Maximum
Minimum
Maximum
Time between games
1000
1000
1000
1000
1000
1000
Time to wait for all
players
1000
1000
1000
1000
1000
1000
Time for first ball release
10
10
10
10
10
10
Time to wait for first cover
2000
2000
2000
2000
2000
2000
Time for second ball
release
10
10
10
10
10
10
Time for final claim
2000
2000
2000
2000
2000
2000
Time for fast start
N/A
N/A
N/A
N/A
N/A
N/A
Number Players
2
2
6
6
2
12
Fast Start / Duration
6
720
7
720
13
720
Games / Coin In
6583
7180000
6570
10976500
6568
10717890
Games & Coin In Rate
9.14
9972.22
9.13
15245.14
9.12
14885.96
Comparison
74.76%
59.54%
64.98%

Comparison Analysis of Various Class II Configuration Options
Page A- 4
simulation results 3
WPM October 26,2006
3. Measure difference in games played and coins handled between compliant three-touch game
and one-touch game.
Constants:
One-Touch Game:
Time between games = 1,000 ms
Time to wait for all players = 12 ms to 2,000 ms, random
Time for first ball release = 10 ms
Time for first cover = 10 ms
Time for second ball release = 10 ms
Time for final claim = 2,000
Wager size = 1 (100) to 10 ( 1,000) random.
Compliant Game:
Time between games = 1,000 ms
Time for first ball release = 2,000 ms
Time for first cover = 2,000 ms
Time for second ball release = 2,000 ms
Time for final claim = 2,000
Wager size = 1 (100) to 10 (1,000) random.
Variables in different simulations:
A. Assume two players at all times in both games.
Time to wait for all players in compliant game = 2,000 ms
B. Assume six players at all times in both games.
Time to wait for all players in compliant game = 12 ms to 2000 ms, random.
C. Assume 2 - 12 players in both games.
Comparison Analysis of Various Class II Configuration Options
Page A- 5
simulation results 3
WPM October 26,2006
Time to wait for all players in compliant game = 2,000 ms, unless Number of players > 5, in which
case time to wait for all players = 12 to 2000 ms, random.
Results, One Touch – See Table A In Section 1. for results of Compliant Game.
As for the compliant game, the time to start the game is variable between 12 and 2,000 milliseconds
representing a medium pace of game play.
Table C
Description
Minimum
Maximum
Minimum
Maximum
Minimum
Maximum
Time between games
1000
1000
1000
1000
1000
1000
Time to wait for all
players
12
2000
12
2000
12
2000
Time for first ball release
10
10
10
10
10
10
Time to wait for first cover
10
10
10
10
10
10
Time for second ball
release
10
10
10
10
10
10
Time for final claim
2000
2000
2000
2000
2000
2000
Time for fast start
N/A
N/A
N/A
N/A
N/A
N/A
Number Players
2
2
6
6
2
12
Fast Start / Duration
6
720
7
720
13
720
Games / Coin In
9474
10347600
9457
15856310
9452
15517050
Games & Coin In Rate
13.16
14371.67
13.13
22022.65
13.13
21551.46
Comparison
151.63%
129.55%
137.43%
4. Measure effect of casino not operating at capacity - change in difference in games played and
coins in between the One Touch Games, Consensus Games and Compliant Games when time
between games increases.
Constants:
Consensus Game:
Number of players = 2 to 12, random
Time to wait for all players = 1,000 ms
Time for first ball release = 10 ms
Time for first cover = 2,000 ms
Time for second ball release = 10 ms
Time for final claim = 2,000
Comparison Analysis of Various Class II Configuration Options
Page A- 6
simulation results 3
WPM October 26,2006
Wager size = 1 (100) to 10 (1,000) random.
Complaint Game:
Number of players = 2 to 12, random
Time to wait for all players = 1,000 ms
Time for first ball release = 2,000 ms
Time for first cover = 2,000 ms
Time for second ball release = 2,000 ms
Time for final claim = 2,000
Wager size = 1 (100) to 10 (1,000) random.
One-touch Game:
Number of players = 2 to 12, random
Time to wait for all players = 1,000 ms
Time for first ball release = 10 ms
Time for first cover = 10 ms
Time for second ball release = 10 ms
Time for final claim = 2,000
Wager size = 1 (100) to 10 (1,000) random.
Variables in different simulations:
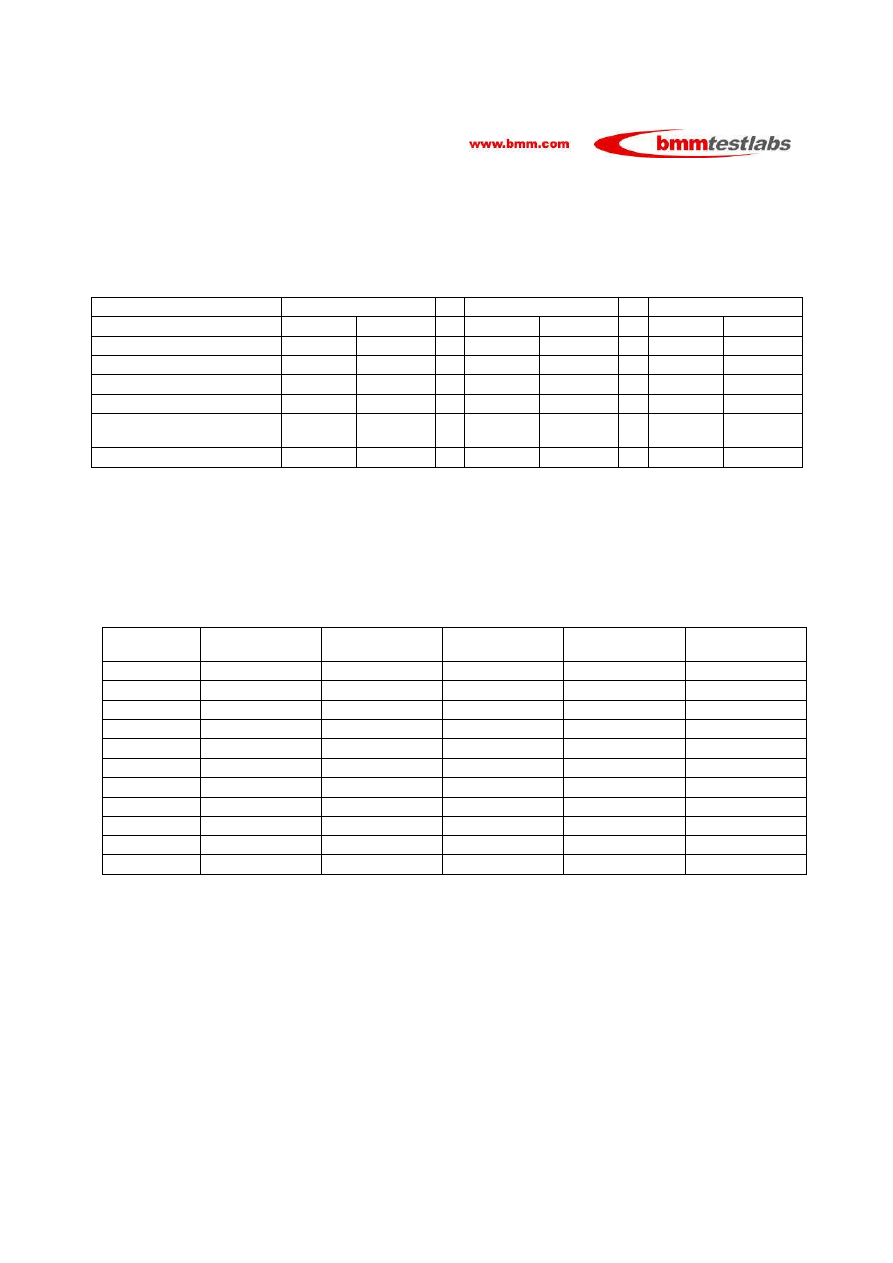
The following table shows the various time between games experiments that were run.
Experiment
Time Between
Games
Experiment
Time Between
Games
Experiment
Time Between
Games
A.
60,000 ms
B.
50,000 ms
C.
40,000 ms
D.
30,000 ms
E.
20,000 ms
F
15,000 ms
G.
10,000 ms
H.
8,000 ms
I.
6,000 ms
J.
4,000 ms
K.
2,000 ms
Comparison Analysis of Various Class II Configuration Options
Page A- 7
simulation results 3
WPM October 26,2006
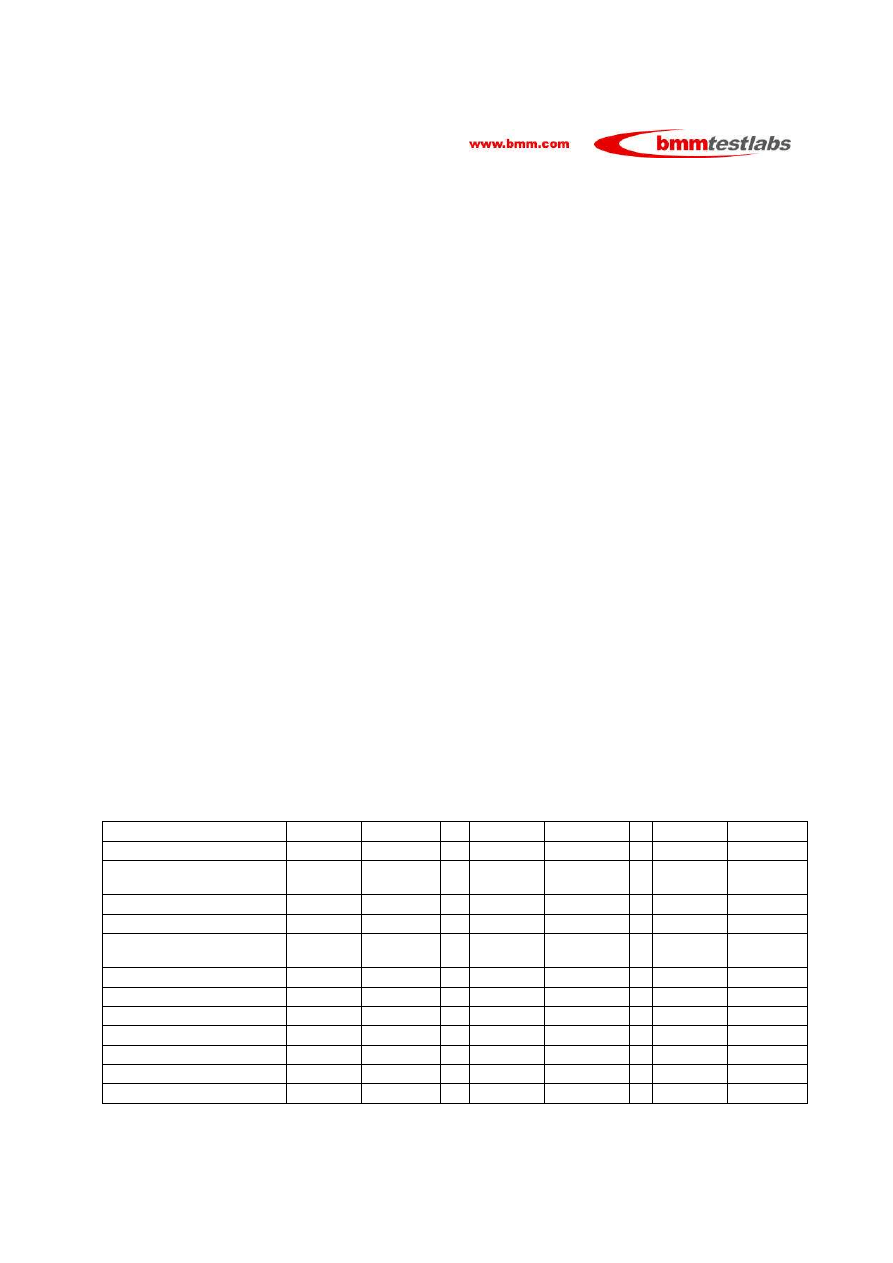
Game Parameters
The following table shows the game parameters used during these experiments:
Compliant Game
Consensus Game
One Touch Game
Description
Minimum
Maximum
Minimum
Maximum
Minimum
Maximum
Time between games
Variable
Variable
Variable
Variable
Variable
Variable
Time to wait for all players
1000
1000
1000
1000
1000
1000
Time for first ball release
2000
2000
10
10
10
10
Time to wait for first cover
2000
2000
2000
2000
10
10
Time for second ball
release
2000
2000
10
10
10
10
Time for final claim
2000
2000
2000
2000
2000
2000
Results:
The following table shows the results comparison of games per minute for each of the Experiments for the
three different games:
Table D
Time
Between
Compliant
Consensus
Ratio
Consensus
One Touch
Ratio One
Touch
2,000
5.06
7.94
56.917%
10.73
112.055%
4,000
4.46
6.30
41.256%
7.94
78.027%
6,000
3.89
5.22
34.190%
6.30
61.954%
8,000
3.43
4.42
28.863%
5.17
50.729%
10,000
3.08
3.86
25.325%
4.42
43.506%
15,000
2.49
2.96
18.876%
3.27
31.325%
20,000
2.04
2.38
16.667%
2.57
25.980%
30,000
1.54
1.70
10.390%
1.80
16.883%
40,000
1.22
1.33
9.016%
1.40
14.754%
50,000
1.02
1.09
6.863%
1.13
10.784%
60,000
0.87
0.92
5.747%
0.95
9.195%
Comparison Analysis of Various Class II Configuration Options
Page A- 8
simulation results 3
WPM October 26,2006
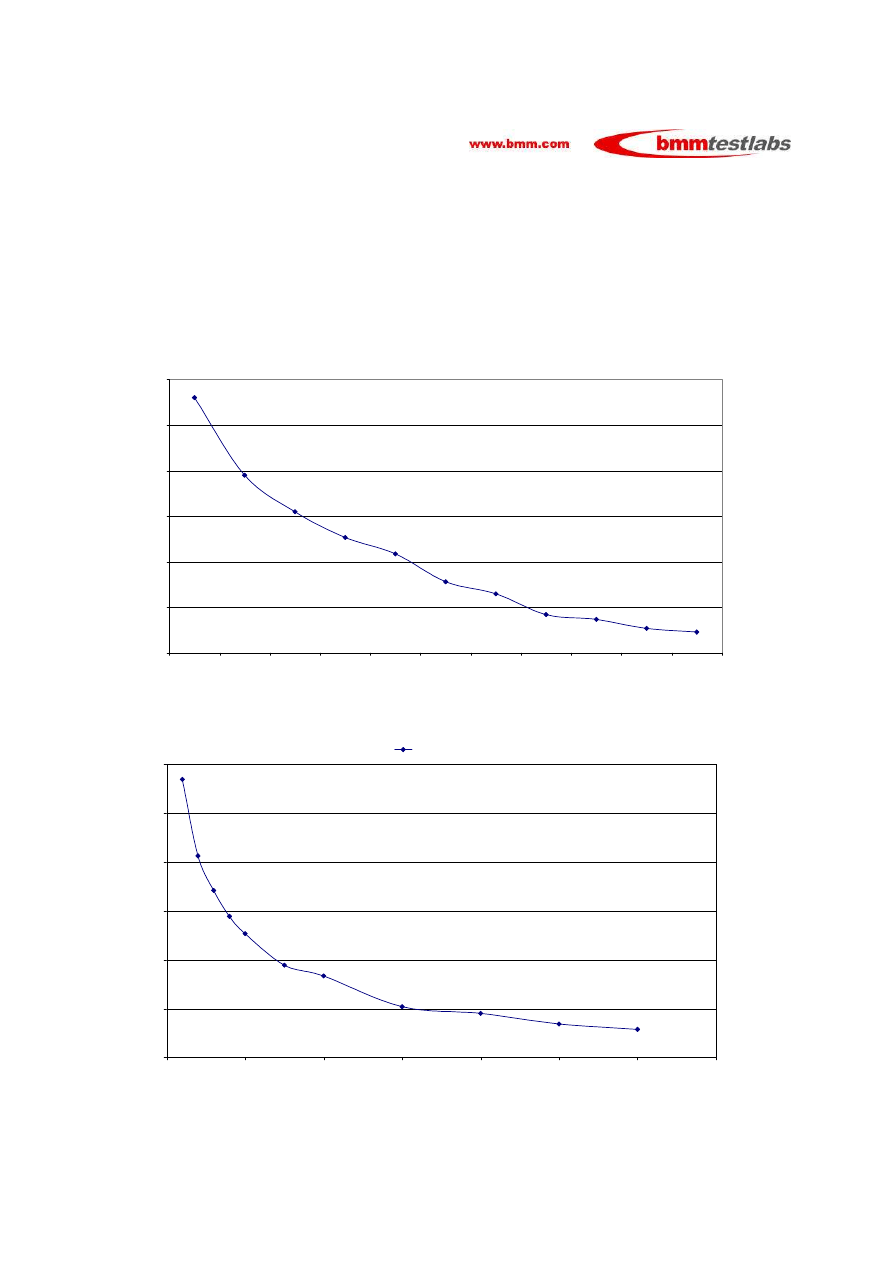
The following are graphical views of the above data where the X axis represents the average time
between games and the Y axis the percentage difference between the Compliant Game and the One
Touch and Consensus Games respectively.
Compliant Games vs. One-Touch Games
112.06%
78.03%
61.95%
50.73%
43.51%
31.33%
25.98%
16.88%
14.75%
10.78%
9.20%
0.00%
20.00%
40.00%
60.00%
80.00%
100.00%
120.00%
2
4
6
8
10
15
20
30
40
50
60
Average Time Between Games (secs)
%
D
if
fe
r
e
n
c
e
(G
a
m
e
s
p
e
r
m
in
.)
Compliant Games vs. Opinion Games
56.92%
41.26%
34.19%
28.86%
25.33%
18.88%
16.67%
10.39%
9.02%
6.86%
5.75%
0.00%
10.00%
20.00%
30.00%
40.00%
50.00%
60.00%
0
10
20
30
40
50
60
70
Average Time Between Games (secs)
%
D
if
fe
re
n
c
e
Series1
Comparison Analysis of Various Class II Configuration Options
Page A- 9
simulation results 3
WPM October 26,2006
5. Additional Experiment
Consensus versus One Touch
The following is a comparison of simulation runs for one consistent set of parameters of the Consensus
versus One Touch game.
Table E
Description
Minimum
Maximum
Minimum
Maximum
Time between games
1000
1000
1000
1000
Time to wait for all players
1000
1000
1000
1000
Time for first ball release
10
10
10
10
Time to wait for first cover
10
10
2000
2000
Time for second ball
release
10
10
10
10
Time for final claim
2000
2000
2000
2000
Time for fast start
N/A
N/A
N/A
N/A
Number Players
2
12
2
2
Fast Start / Duration
13
720
6
720
Games / Coin In
9374
15333690
6583
7180000
Games & Coin In Rate
13.02
21296.79
9.14
9972.22
Comparison
42.45%
Wyszukiwarka
Podobne podstrony:
puchar swiata 2006 www prezentacje org
Gospodarka płynami kwiecień 2006
Znaki taktyczne i szkice obrona, natarcie,marsz maj 2006
Prowadzenie kliniczne pacjentów z dobrym widzeniem M Koziak 2006
prezentacja cwiczen 2006
Wyklad 09 2006
Wyk 2 WE Polityka monetarna 2006 2
urazy kl piersiowej 04 2006
Wyk 6 Model klasyczny 2006
ADHD 2006
1 zaburzenia krążenia 1 2006 07 III
więcej podobnych podstron