
THE
MANAGING BUDGETS
POCKETBOOK
By Anne Hawkins and Clive Turner
Drawings by Phil Hailstone
“A clear presentation of ‘how to’ in an area of management where there are so many
examples of ‘we didn’t’. It successfully deals with a subject area that is either
mystique-ridden or handled too simplistically, showing that budgets are based on a series
of practical management decisions rather than on one simple technique”.
Peter Nicholls, Head of Investors In People, Walsall Training & Enterprise Council
“Typical of Clive’s excellent teaching standards. It deals with a critical process in a very
readable style, and reflects the very practical experience that both authors have gained
in their careers”.
Andy Stevens, Chief Operating Officer, Messier-Dowty International
CONTENTS
INTRODUCTION
1
FINANCIAL PLANNING
7
What is a Budget, need to plan,
planning for profit and cash, challenge
process, continuous review
REVENUE BUDGETS
29
Budget saboteurs, golden rules,
four stages of setting budgets,
input-output analysis, revisions,
monitoring and controlling
CAPITAL BUDGETS
55
Strategic fit, preparation, authorisation,
evaluation, link to other budgets
PRODUCT COSTING
63
Why it is important, how to
understand the system, challenge
the system, be flexible
APPENDIX ONE
100
Business Financial Model
APPENDIX TWO
Product Costing Example
103
NB

INTRODUCTION
1
INTRODUCTION
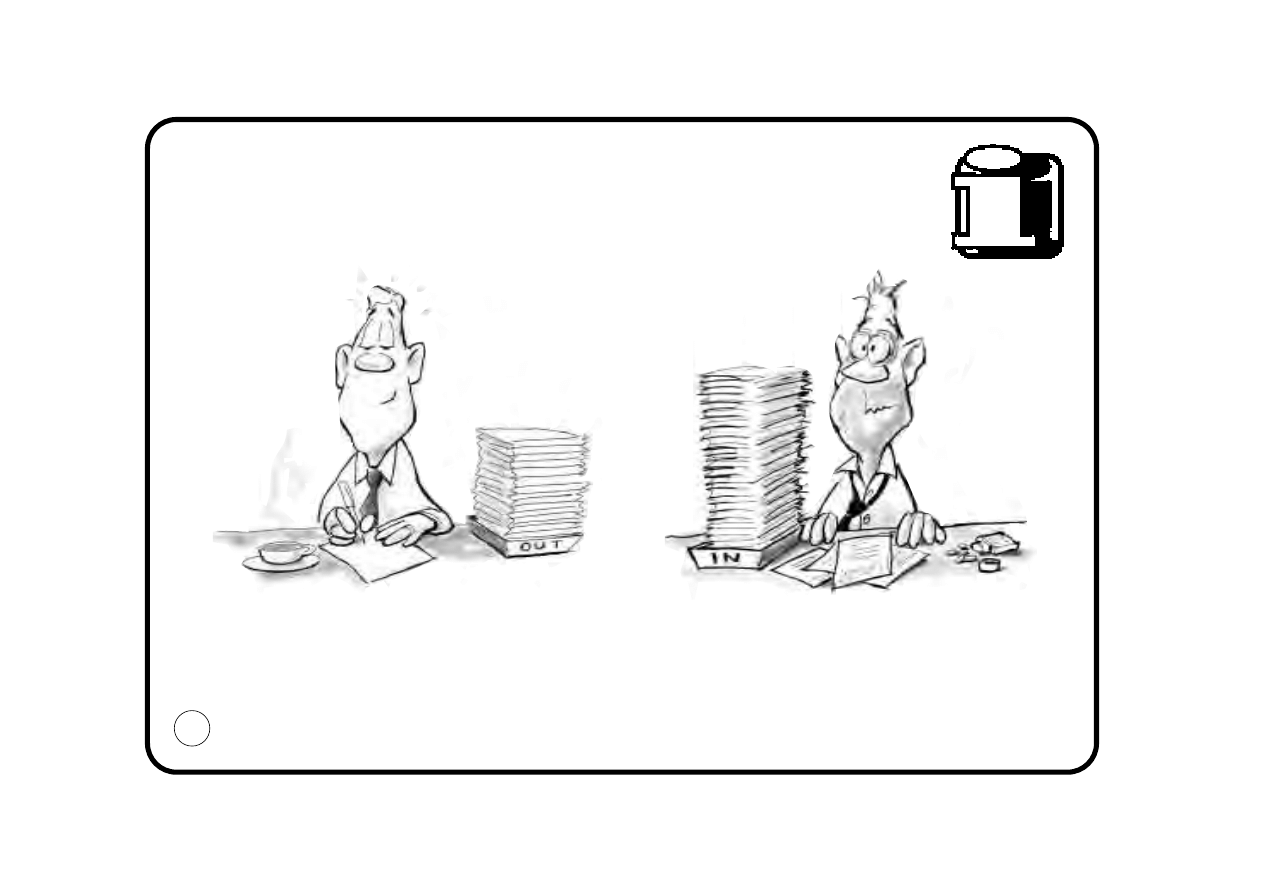
ARE YOU MANAGING?
Are you managing your business ...
or is your business managing you?
Do you plan what you are going to do ... or just react?
2
INTRODUCTION
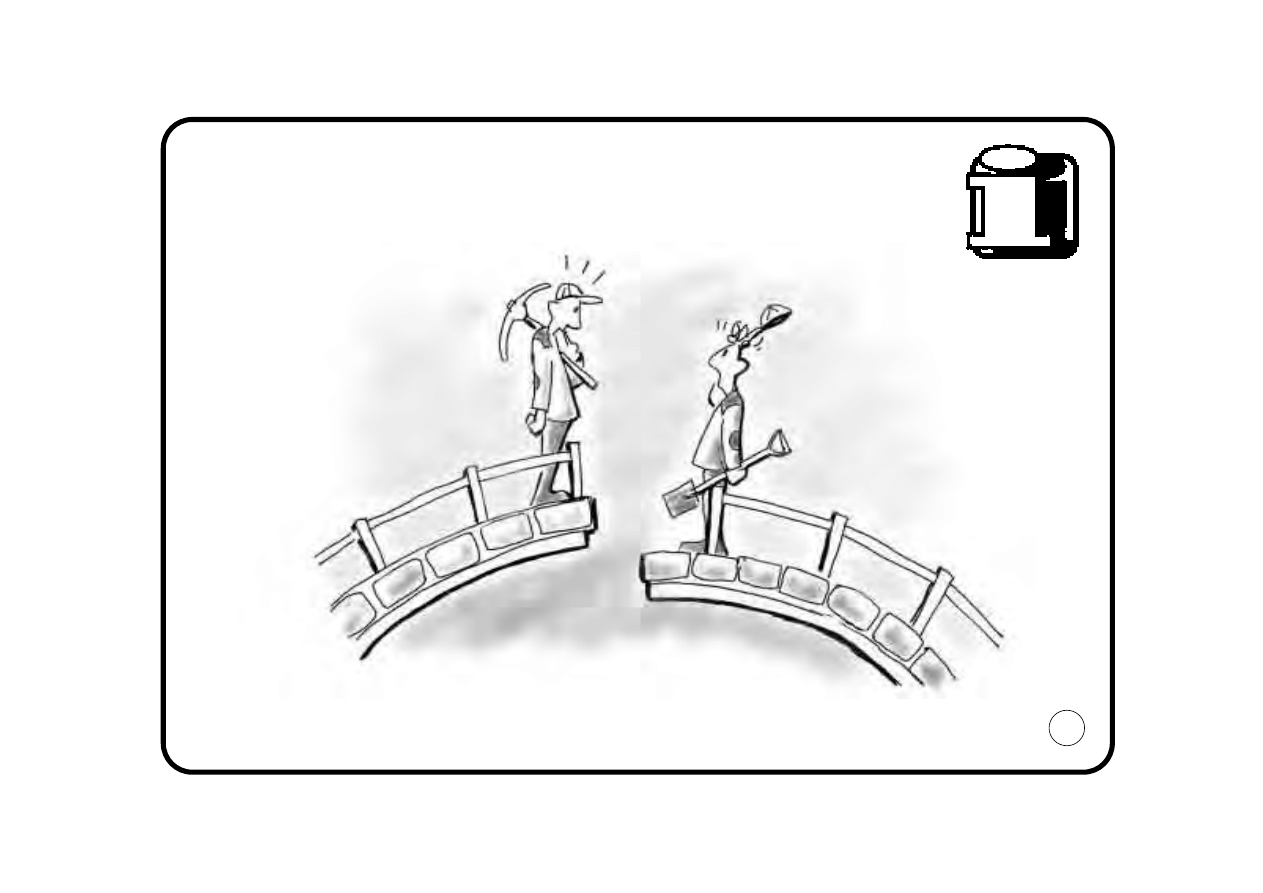
FAILURE TO PLAN
Has this happened in your business?
Why did it happen?
3
INTRODUCTION
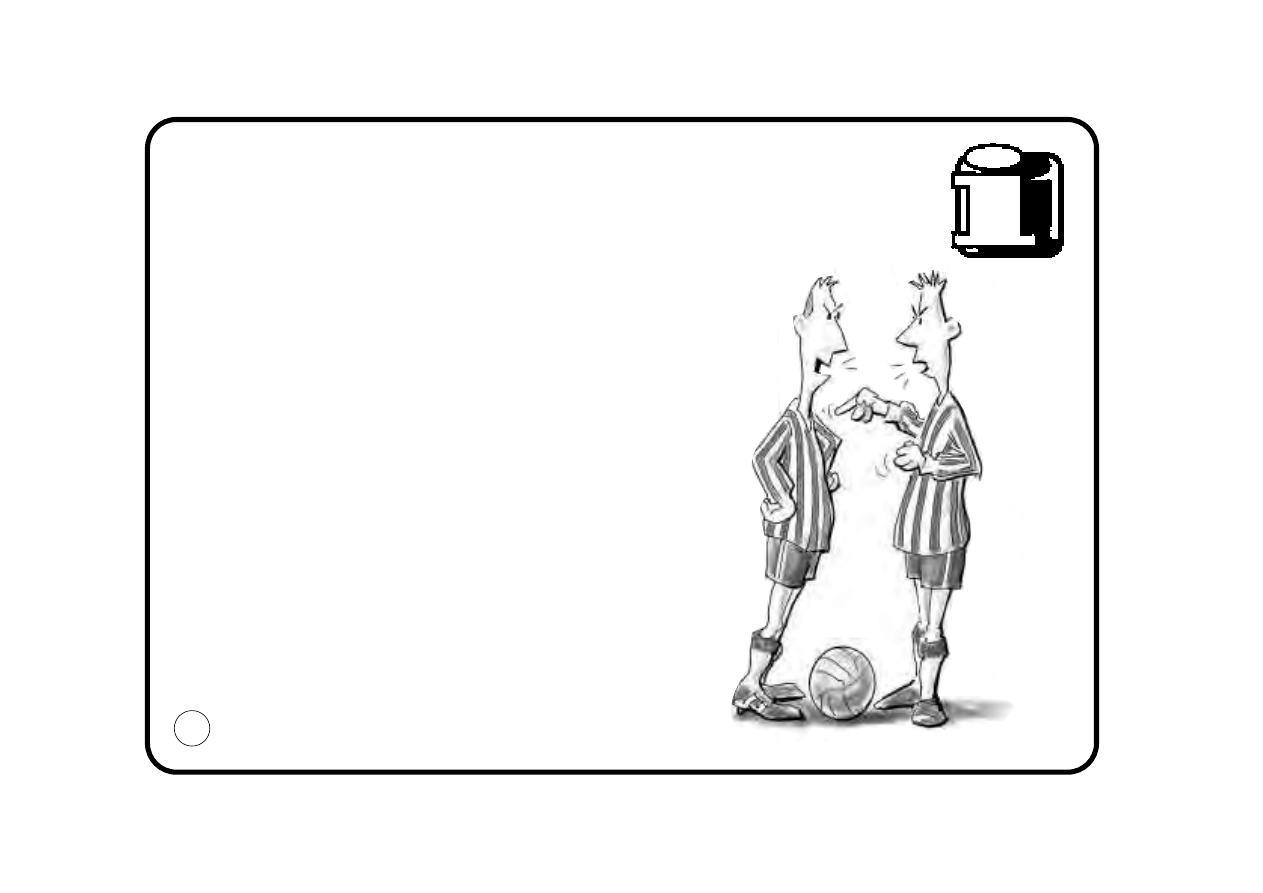
CO-ORDINATE AND CONTROL
Planning is essential for businesses to co-ordinate and
control their activities.
Co-ordinate
Businesses are run by a group of individuals, each of
whom will have a personal view of the best way ahead.
If there is no agreement on where the business is going,
and how it will get there, the team cannot pull together.
Control
Businesses need to measure their progress against
their plan in order to reassess how they are going
to arrive at the agreed destination.
4

INTRODUCTION
CLASSIC CLICHÉS
“I’m too busy to plan” ... perhaps you’re too busy because you don’t plan!
“My boss plans. I get on with it” ... but are you pulling in the same direction as the
rest of the team?
“Just get the sales” ... which sales? Are they profitable? Will the business be
worth winning?
“What’s the point? Things never go according to plan” ... by planning you are focused on
the future and will respond quicker to the changing environment.
5

INTRODUCTION
PLANNING IS FOR EVERYONE!
Remember
Even the smallest cog in the largest wheel has a vital role to play in the planning process.
Don’t underestimate the significance of your contribution ... and the damage that can be
inflicted if you get it wrong!
6

FINANCIAL PLANNING
7
FINANCIAL PLANNING
WHAT IS A BUDGET?
A budget is a management tool which underpins the planning and control process within
the business.
Definition:
A budget is telling your money
●
Where to go
●
Instead of worrying where it went
8
FINANCIAL PLANNING
IS IT NECESSARY?
●
Is there a need to budget?
●
Is it necessary to plan the finances?
YES!
A business is a sophisticated
money-making machine.
Don’t leave it to chance!
9

FINANCIAL PLANNING
NEED TO PLAN
Businesses have financial responsibilities
- to their owners
- to lenders
- to employees
- to suppliers
- to customers
Businesses must plan Profit and Cash.
●
Will the business be successful?
●
Will it meet its responsibilities?
●
Will it satisfy the expectations of the owners?
●
Will it be worth the effort?
10
These responsibilities must be planned!
FINANCIAL PLANNING
LONG-TERM AND SHORT-TERM PLANNING
●
Businesses must plan for the long-term (the Strategic Plan) as well as the short-term
(the Business Plan)
●
The Strategic Plan sets the ‘vision’ of where the business wants to be
in 3-5 years’ time
●
The Business Plan sets out the steps the
business needs to take now in order to
move towards the strategic aims
●
Financial Planning will be detailed at the
business plan level, more of an ‘overview’
at the strategic level
11
FINANCIAL PLANNING
PLANNING FOR PROFIT
WHERE TO START
●
You need to persuade people to invest
●
You need to examine the markets
●
You need to design products/services
●
You need to select facilities -
the tools to do the job
But you start with a plan!
12

FINANCIAL PLANNING
PLANNING FOR PROFIT
WHERE TO START
●
People will not invest
●
Banks will not lend money
Unless it is clear: - why you need the money
- that the scheme is viable
- that the financial outcome will meet your expectations and theirs
You start with a business plan
13

FINANCIAL PLANNING
PLANNING FOR PROFIT
THE BUSINESS PLAN
The Business Plan should ‘set the scene’ and state the short-term objectives.
‘Setting the scene’
●
What will be your products/markets?
●
Who will be your competitors? What will they be doing?
●
Economic factors - inflation, interest rates, exchange rates, etc
●
Technological changes - affecting your processes and/or markets
Short-term objectives
What are you planning to achieve in the short-term?
●
Products - existing/new products
●
Markets - existing/new customers
●
Processes - existing/new methods of supply
●
Employees - changes to skills-base
14
FINANCIAL PLANNING
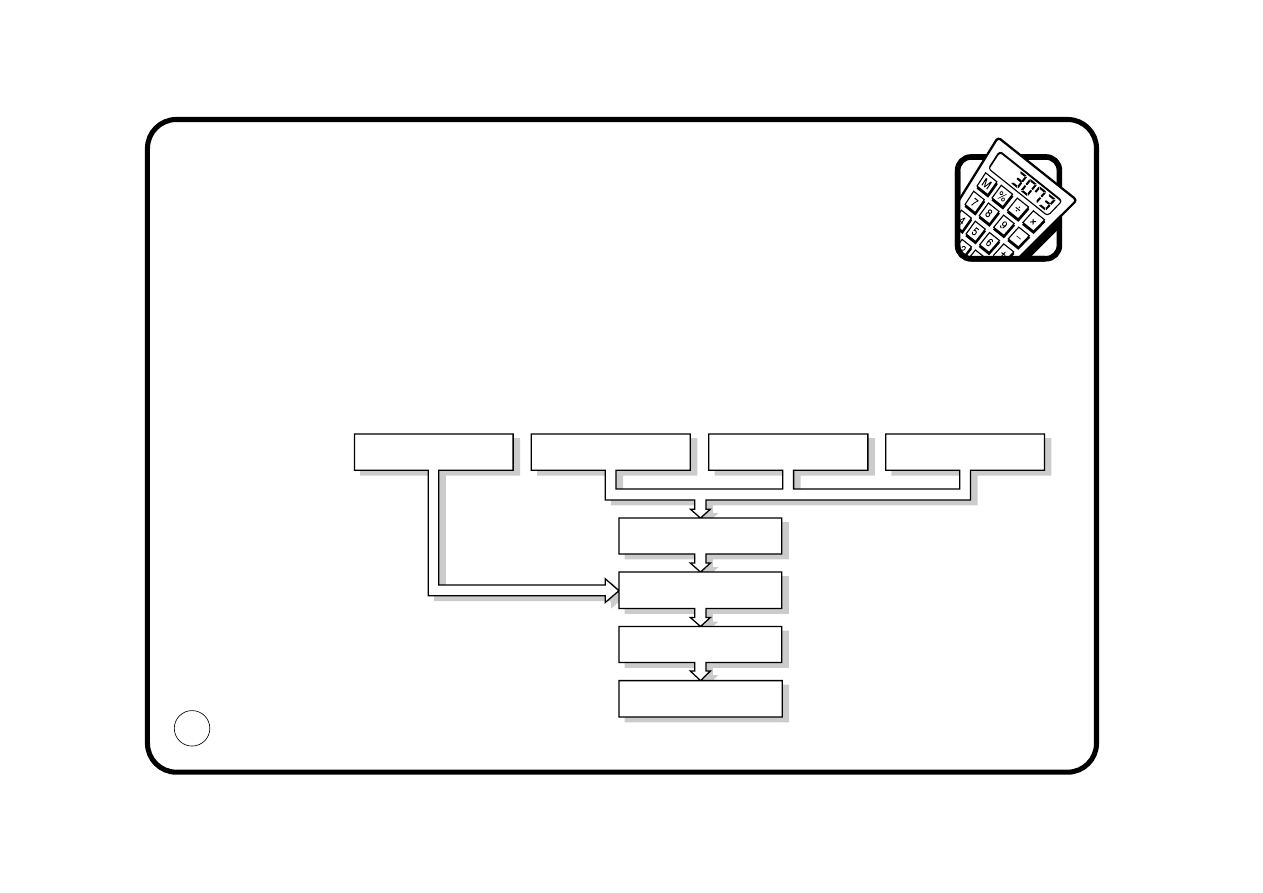
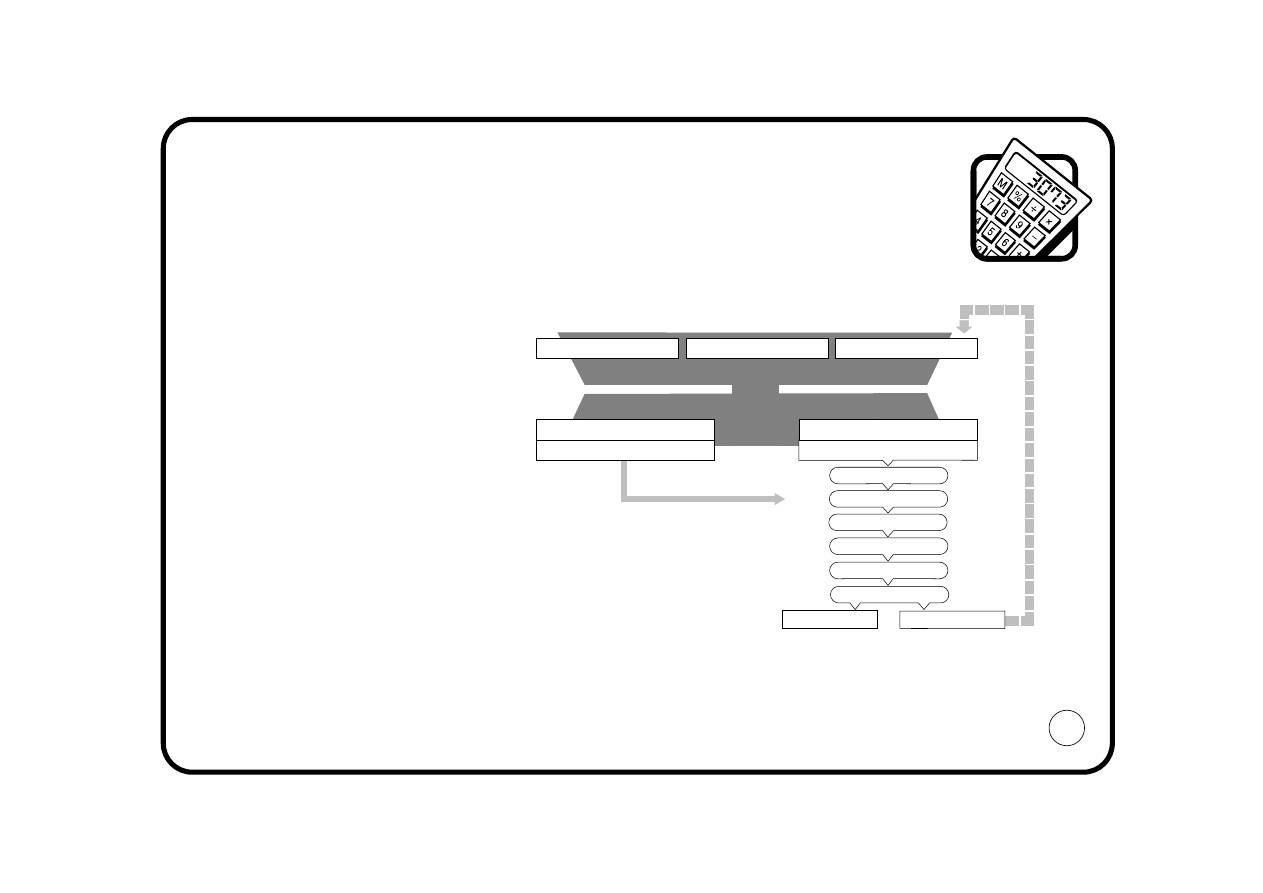
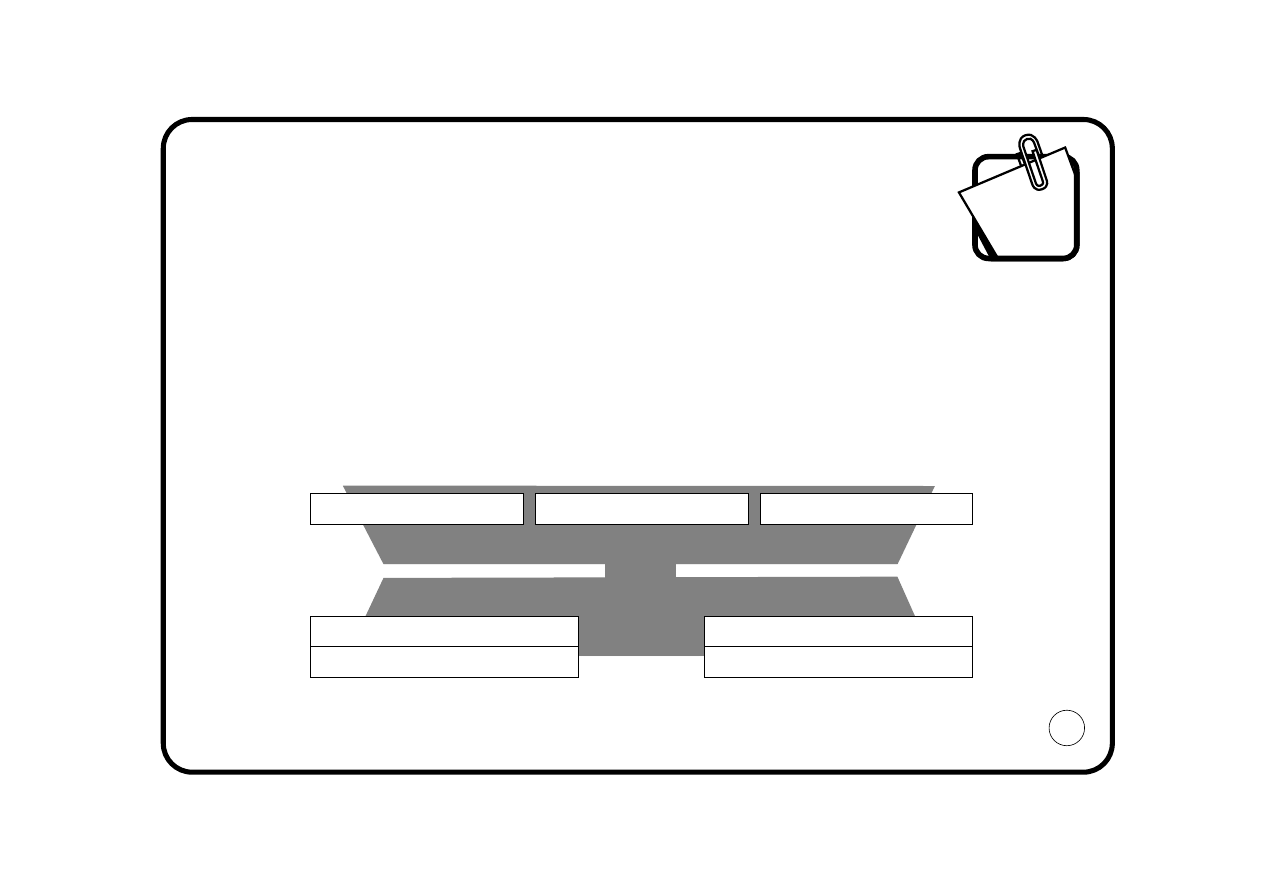
PLANNING FOR PROFIT
THE BUSINESS FINANCIAL MODEL
The Business Financial Model explains how money works within the business.
Financial planning involves managing the model forward... not just letting it happen.
See further Appendix One.
15
SOURCE OF FUNDS
USE OF FUNDS
SHARE CAPITAL
LOAN CAPITAL
RETAINED PROFITS
PRODUCTS / SERVICES
WORKING CAPITAL
Sales
Attributable Cost
Operating Profit
Interest
Tax
Earnings
Dividend
Retained Profits
Less:
Less:
Less:
Depreciation
FACILITIES / PROCESSES
FIXED ASSETS
THE
BALANCE
SHEET
PROFIT
and
LOSS
ACCOUNT
A summary of investment
in the business at a
specific point in time
A summary of Profit
Performance covering
a stated Trading Period
}
}
FINANCIAL PLANNING
PLANNING FOR PROFIT
LOGISTICS FLOW
Where do I enter the model?
Start with the products or services you are planning to sell. Think how you process and
deliver them to your customer.
Example
Which areas hold your business back?
16
PURCHASED
PRODUCTS
MATERIALS
LABOUR
MACHINE
CAPACITY
PRODUCTION
OUTPUT
FINISHED
GOODS STOCK
DISTRIBUTION
SALES
FINANCIAL PLANNING
PLANNING FOR PROFIT
LIMITING FACTOR
●
Identify the limiting factor
This is usually sales - but could be capacity, labour skills availability, etc.
The limiting factor can change from year to year, eg:
Limiting factor
What if you:-
- spend more on advertising
- cut the selling price of the product
- purchase extra machinery
- sub-contract work
- increase wages
- recruit from other labour markets (eg: overseas)
Part of the challenge process (see page 26) is to argue these ‘what-ifs?’.
17
LABOUR SKILLS
CAPACITY
SALES

FINANCIAL PLANNING
PLANNING FOR PROFIT
LIMITING FACTOR
●
Having identified the limiting factor you can now start to plan:
What income will I receive? - the Sales Budget
What will I need to spend in order to deliver the sales and achieve the other short-term
objectives? - the Expenditure Budgets
Note: CASH CAN ALSO BE THE LIMITING FACTOR! See page 24.
18

FINANCIAL PLANNING
PLANNING FOR PROFIT
THE SALES BUDGET
The sales budget is driven by sales forecasts ... compiled by sales people.
●
Traditionally sales forecasts are optimistic!
●
You need to take into account:
- Price(s)
- Mix of product
- Volume(s)
- Timing
●
The budget must be phased to assess capacity/workload implications
●
Don’t forget to allow for customer credit in budgeting cash receipts
●
Challenge each of the components planned in the light of:
- the total market
- track record
- the competition
Note: The sales budget must be set in sufficient detail to allow the expenditure budgets
to be formulated sensibly. In a one-product business this is straight-forward. In a
multi-product business where products have dramatically different expenditure
implications, a detailed analysis of the planned sales is essential.
19

FINANCIAL PLANNING
PLANNING FOR PROFIT
THE EXPENDITURE BUDGETS
Planned expenditure is classified as Capital or Revenue.
Capital Budget
- planned expenditure on the processes/facilities (Fixed Assets)
Revenue Budget
- planned expenditure on the materials, labour and running costs
of the business
Compiling Capital Budgets and Revenue Budgets is dealt with in detail in later sections
of the pocketbook.
However - do be careful!
Capital and revenue budget-setting can be mistakenly seen as separate activities - but
each can have implications on the other, eg:
- buying a new machine (Capital) will affect maintenance, power, insurance,
etc (Revenue)
- using outside hauliers (Revenue) will obviate the need for new delivery vans (Capital)
Be consistent!
20
FINANCIAL PLANNING
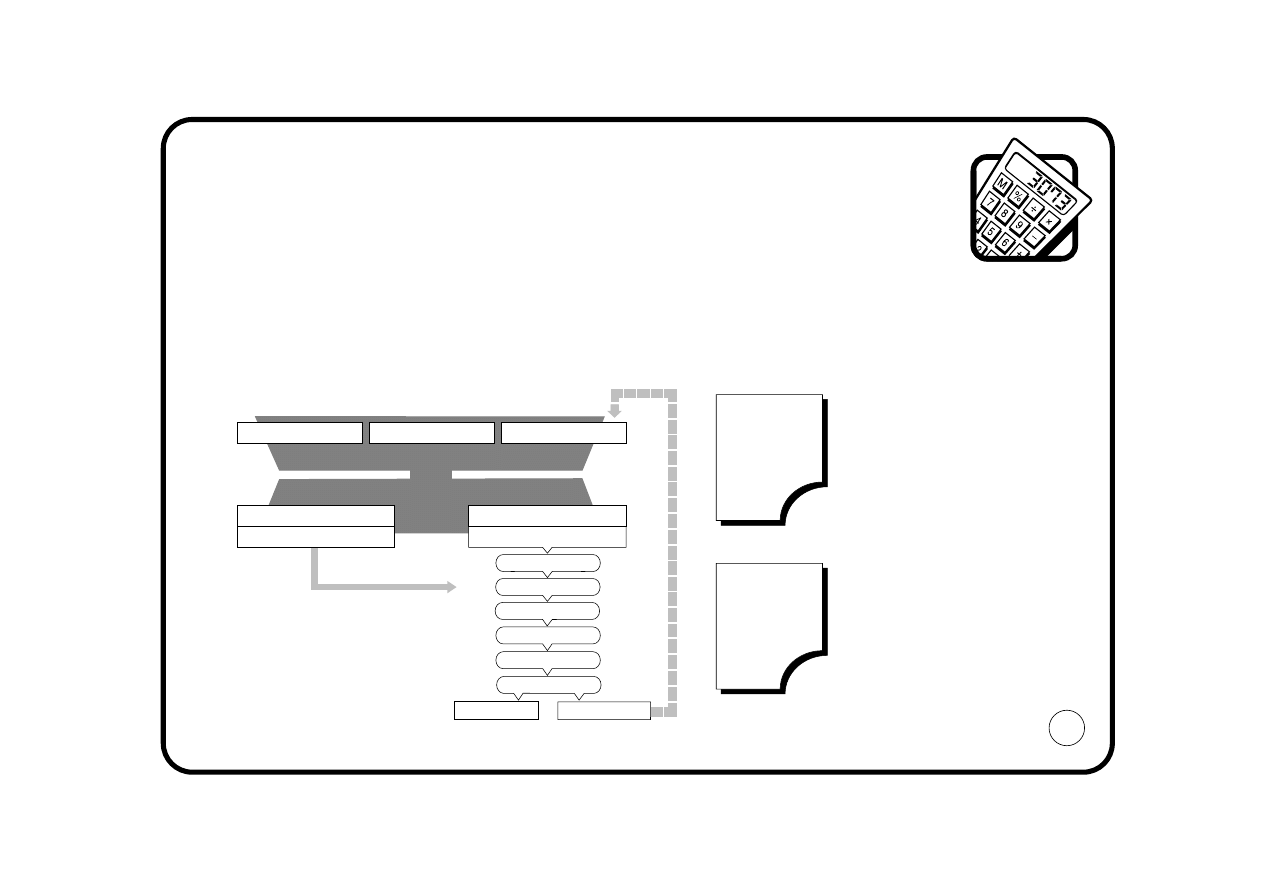
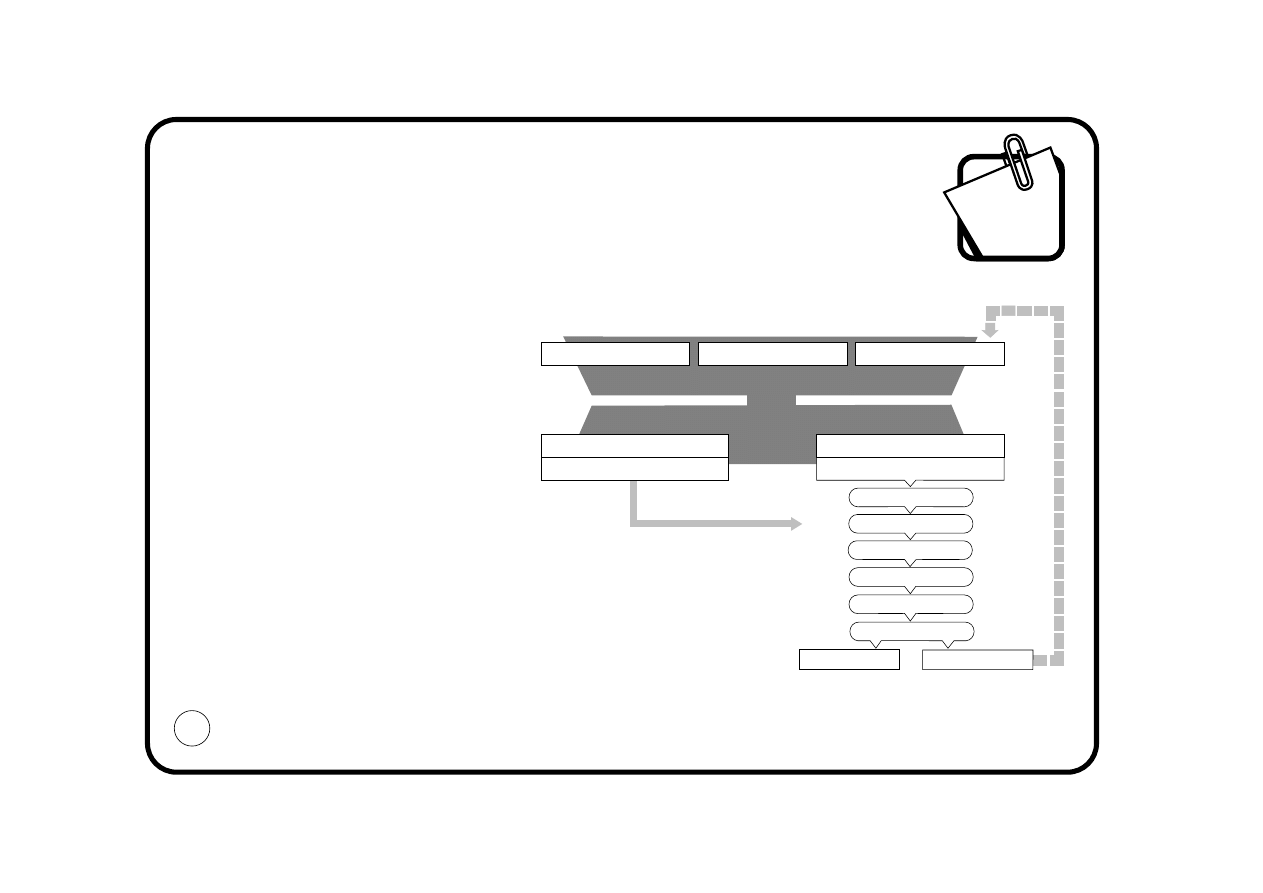
PLANNING FOR PROFIT
LINK TO THE MODEL
Now feed the sales budget and expenditure
budgets into the model.
21
CAPITAL
BUDGET
SALES
BUDGET
SOURCE OF FUNDS
USE OF FUNDS
SHARE CAPITAL
LOAN CAPITAL
RETAINED PROFITS
PRODUCTS / SERVICES
WORKING CAPITAL
Sales
Attributable Cost
Operating Profit
Interest
Tax
Earnings
Dividend
Retained Profits
Less:
Less:
Less:
Depreciation
FACILITIES / PROCESSES
FIXED ASSETS
REVENUE
BUDGET
REVENUE
BUDGET
SALES
BUDGET
CAPITAL
BUDGET

FINANCIAL PLANNING
PLANNING FOR PROFIT
HAVE YOU MADE A PROFIT?
Use your product costing system to determine:
- given your revenue budget
- what will be the budgeted cost of your products?
And having set your sales budget
- will you make a profit on the products you plan to sell?
Note: Product costing systems are explained in a later section of the pocketbook.
22
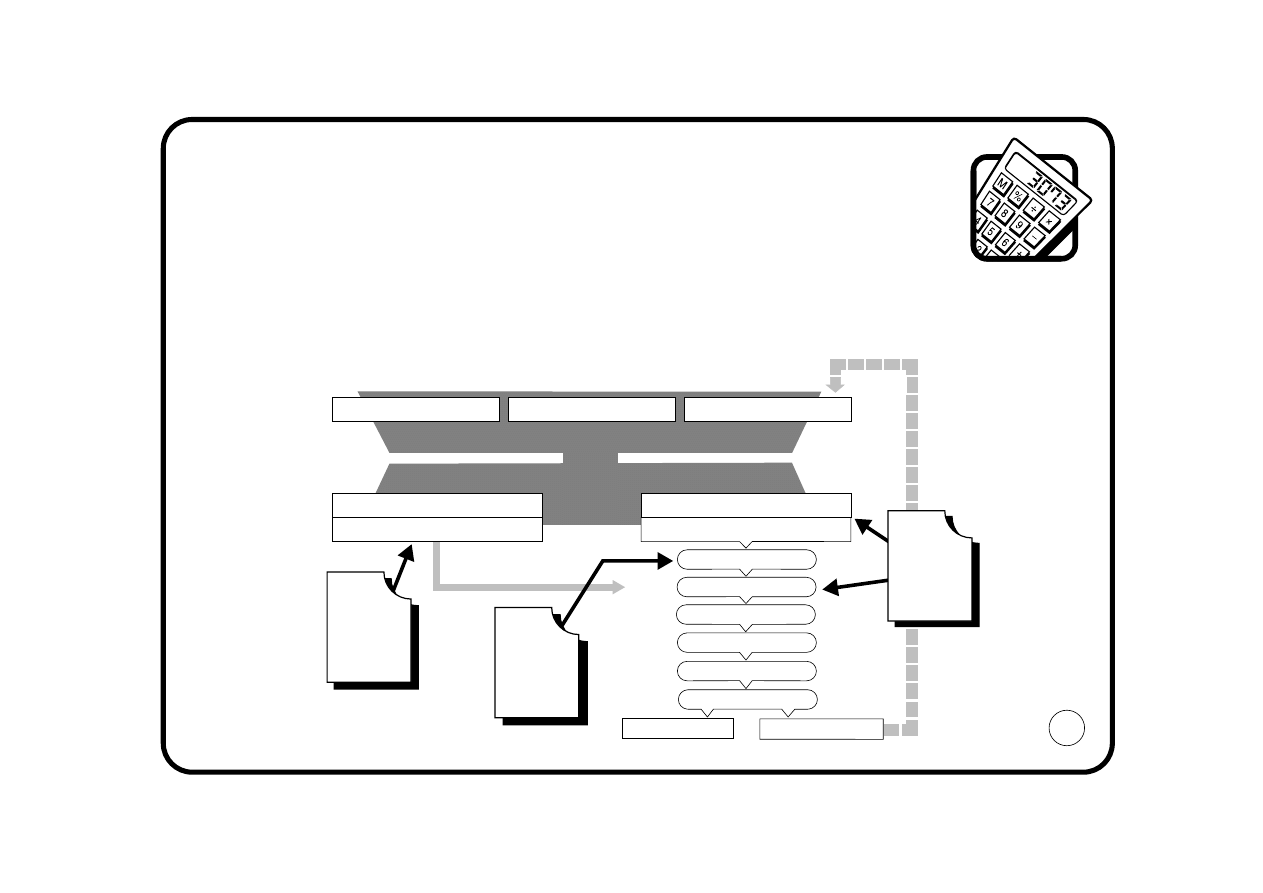
FINANCIAL PLANNING
PLANNING FOR PROFIT
FINANCING COSTS
You are now in a position to
complete the model by
feeding in the budget for
interest, tax and dividends.
Don’t forget to review the Source of Funds.
●
Will you need additional share capital and/or loan capital?
●
Have you remembered to adjust dividends/interest accordingly?
Repeat until the model is in equilibrium.
23
SOURCE OF FUNDS
USE OF FUNDS
SHARE CAPITAL
LOAN CAPITAL
RETAINED PROFITS
PRODUCTS / SERVICES
WORKING CAPITAL
Sales
Attributable Cost
Operating Profit
Interest
Tax
Earnings
Dividend
Retained Profits
Less:
Less:
Less:
Depreciation
FACILITIES / PROCESSES
FIXED ASSETS
24
FINANCIAL PLANNING
PLANNING FOR CASH
Businesses need cash in order to survive.
Without cash you cannot pay for materials, or labour, or services.
Without cash the profit-making machine will grind to a halt.
Profit is not the same thing as cash
●
You must plan the cash as well as the profit.
●
Many profitable businesses end up in liquidation!
●
Therefore, just planning for profit is not good enough!
Note that the cash plan - the cashflow forecast - is an
integral part of the budget review process.
Never approve a budget plan unless the cashflow forecast
has been reviewed and is acceptable.
The business graveyard is littered with ‘successful’ businesses which ran out of cash.
Be warned!
The difference between profit and cash, and cashflow forecasting is explained in The Managing
Cashflow Pocketbook.

FINANCIAL PLANNING
EVALUATE THE OUTCOME
Now assess your plan. Is it good enough? Look at the expected outcome.
Will the plan enable the business to meet its financial responsibilities to its:
- owners: dividends, share price growth
- lenders: interest, capital repayments
- employees: wages, salaries, secure employment
- suppliers: payment, continued ‘partnership’
- customers: quality, availability, service, warranty
Will the result enable the business to progress towards its strategic aims?
If not ... go back to the drawing-board!
Remember this is a plan - if the expected outcome is unsatisfactory you have the chance
to redirect the business ... before it is too late!
25

26
FINANCIAL PLANNING
THE CHALLENGE PROCESS
You now submit (or formally present) your budget. Next comes the challenge process -
ideally carried out by a team who have not been involved in the previous stages.
●
Is the budget consistent?
- have the same assumptions been used throughout?
●
Are those assumptions valid?
●
What are the critical success factors? What are the risks involved? ie:
- which events/outcomes are the key determinants in achieving the budgeted result?
●
Are the budgeted returns worth the risks?
●
Could you do better?
The budget may be re-worked many times before agreement is reached.
FINANCIAL PLANNING
CONTINUOUS REVIEW
The future is uncertain.
Planning enables the business to be proactive - but you
will still be unable to dictate your own destiny precisely.
Don’t bury your head in the sand!
Continuously review your plans:
- what new opportunities have arisen?
- new threats?
- what are the financial implications?
Managing a business requires you to be in control.
Being in control means you can respond to
changes in circumstances.
Keep looking forward!
27
FINANCIAL PLANNING
INTER-RELATIONSHIPS
The following sections of the book examine some of the key elements of
financial planning:
●
Revenue budgets
●
Capital budgets
●
Product costing
Whilst these are often viewed as separate
exercises within the business, do not
overlook the complex inter-relationships.
For example, the decision to purchase a new machine will have a ripple effect, changing
the capital budget, revenue budget, sales budget (if customers buy more or pay more)
and cash budget.
View each of the budgets as part of the whole.
28

REVENUE BUDGETS
29

REVENUE BUDGETS
AIM
The Revenue Budget sets out the expenditure plans for the running costs of the business.
●
What are we trying to achieve?
- an effective and efficient allocation of resources to achieve the company plan
●
What do many businesses have?
- a discredited process which everyone ignores!
Why?
Recognise any of the following?
30

REVENUE BUDGETS
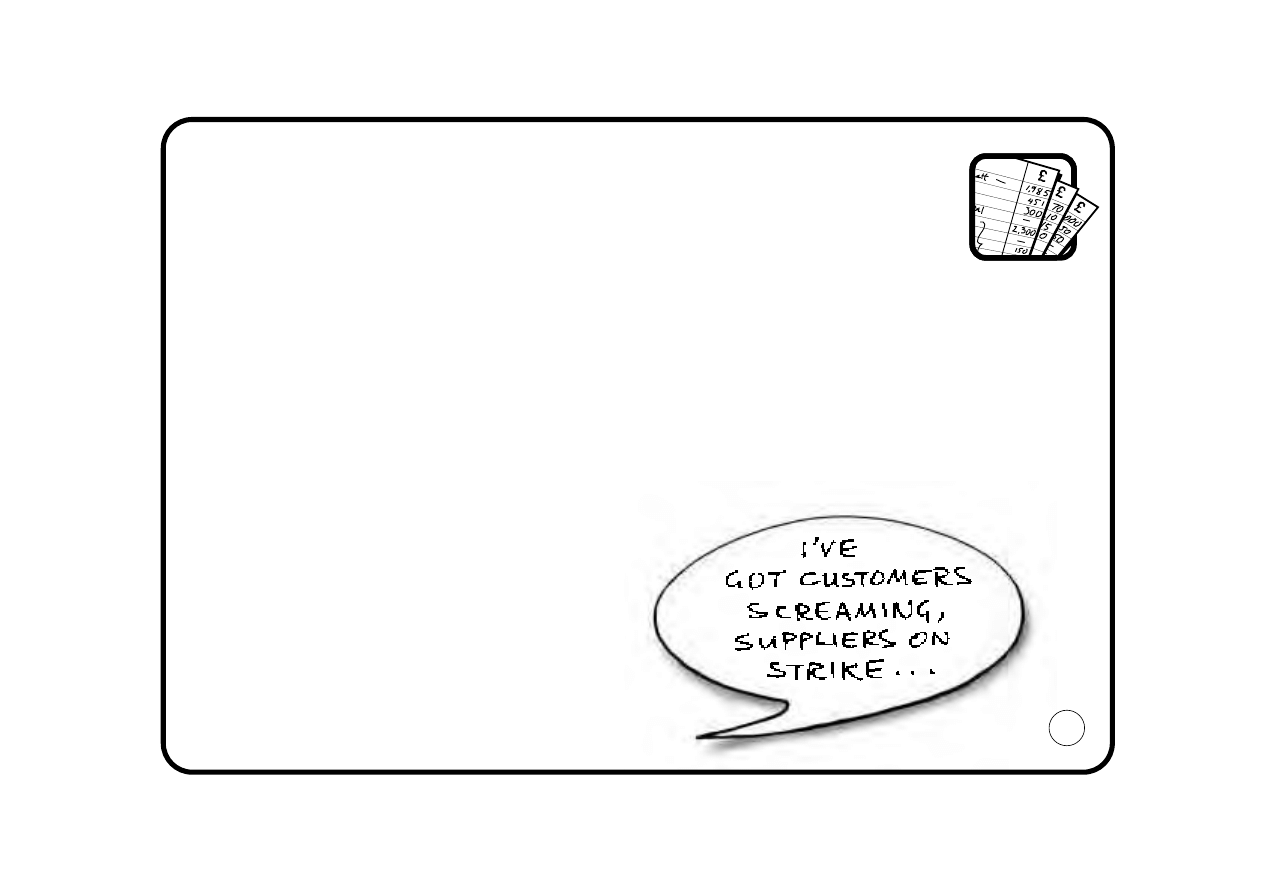
THE BUDGET SABOTEURS!
1
“Nobody asked my opinion ... even a half-wit should have realised that we’d need
extra maintenance work”
2
“You want me to set my budget? I’ve got customers screaming, suppliers on strike ...
say £10,000 and leave me to get on with my real job”
3
“My budget for next year? What have I spent this year?”
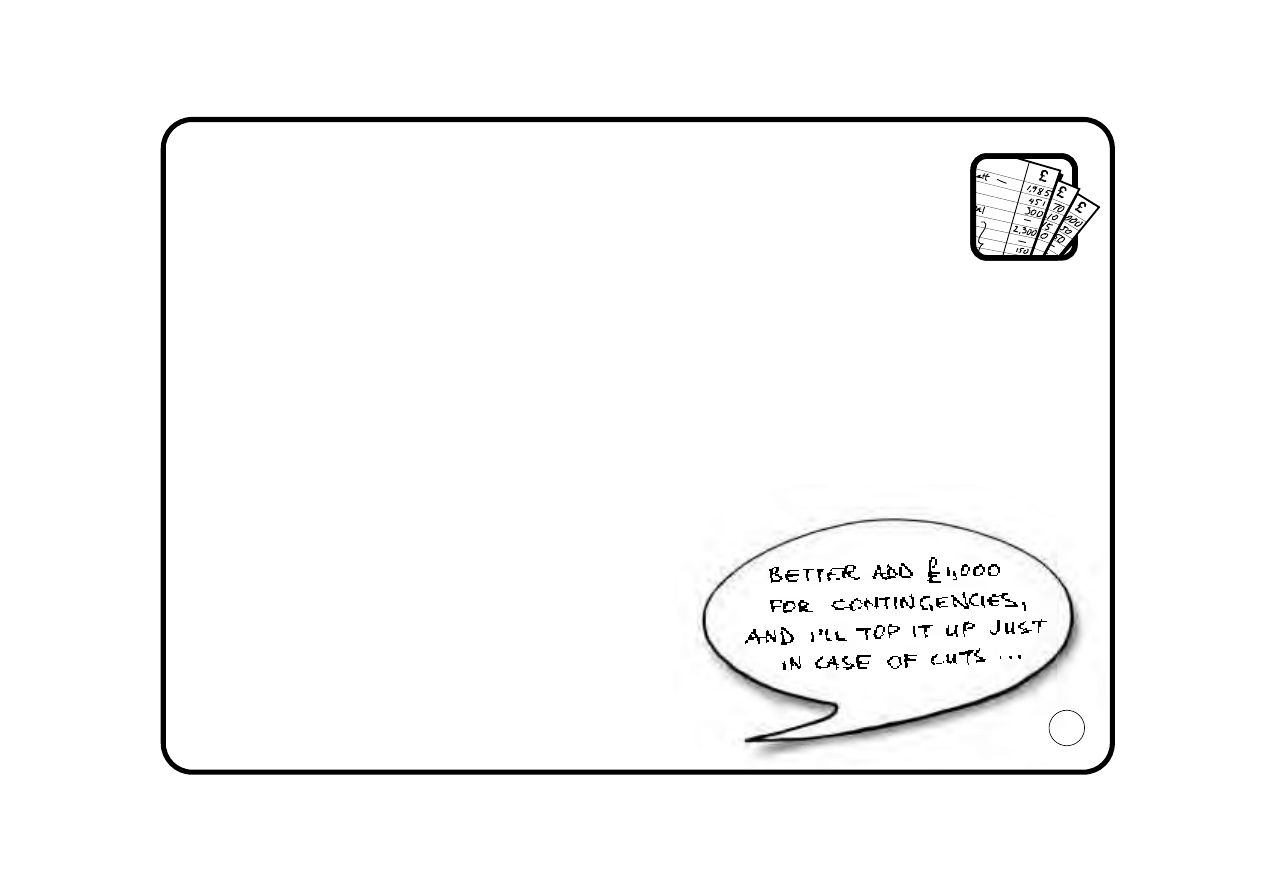
4
“I’ll need £9,000 ... I’d better add £1,000 for contingencies, and last year they cut all
budgets by 8%, so I’ll top it up by 10% just in case ... Tell them £11,000”
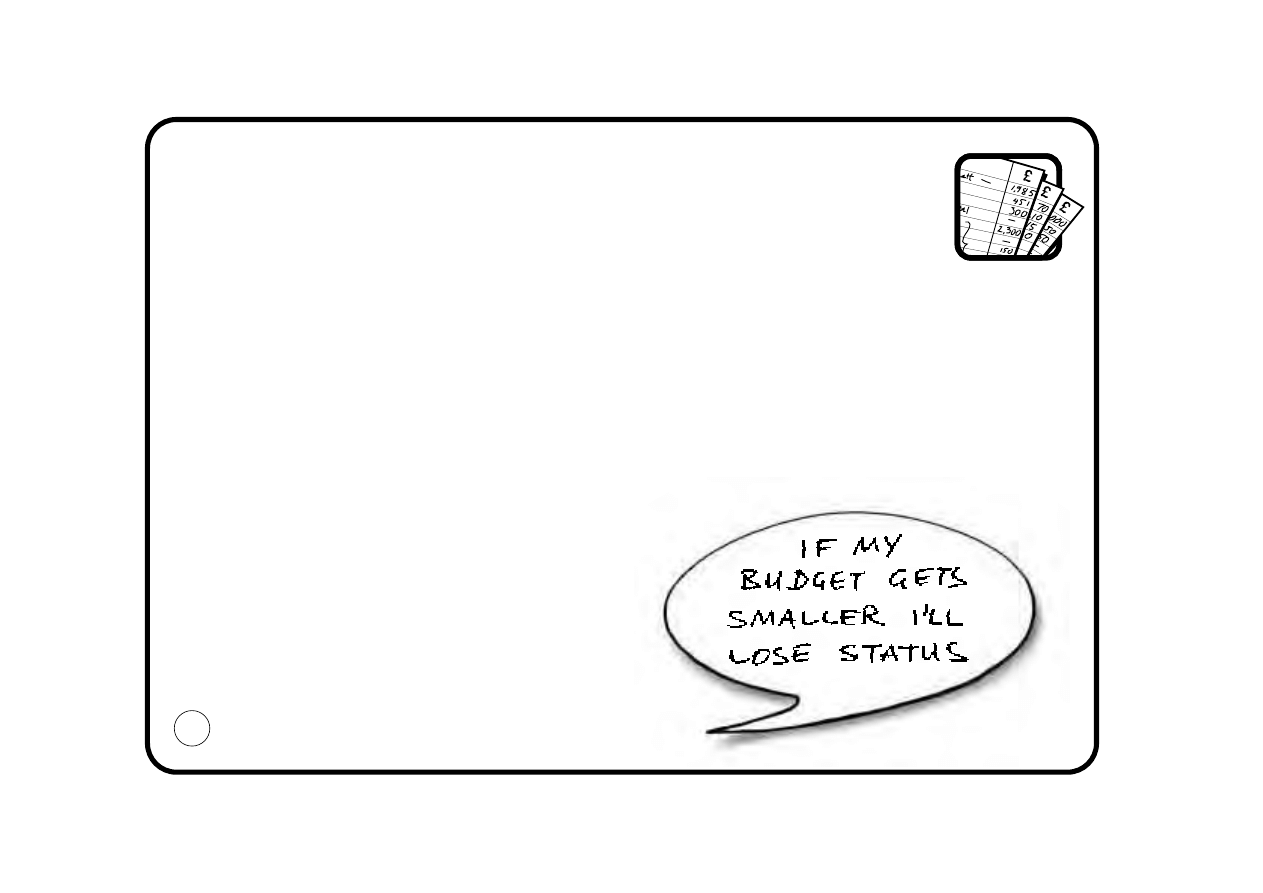
5
“If my budget gets smaller I’ll lose status in the organisation”
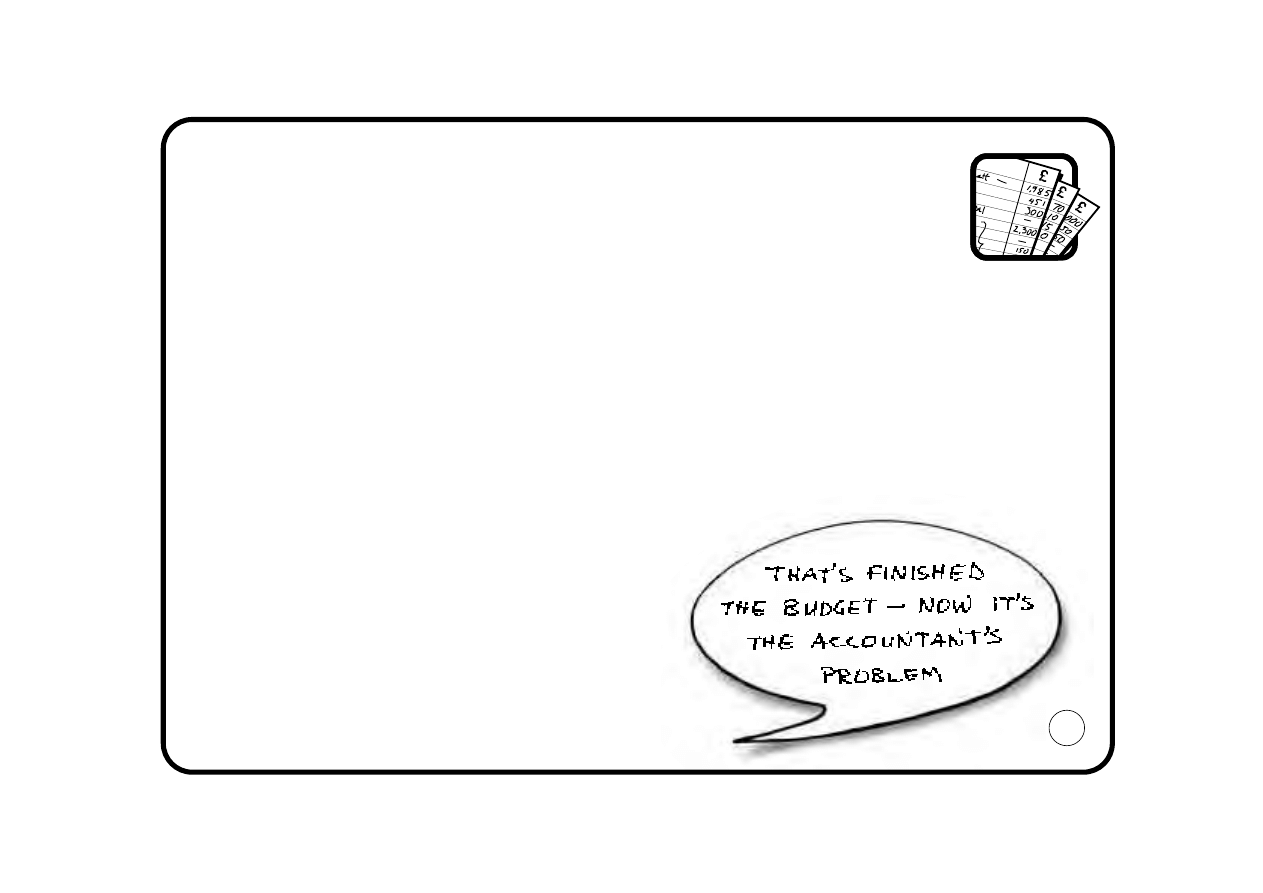
6
“That’s finished the budget then. Let’s pass it to the accountant and it’s her problem
for the next 12 months”
7
“If I don’t spend everything in my budget I won’t get as much next year”
8
“As long as I stay within budget, nobody will ask me any questions”
31

REVENUE BUDGETS
GOLDEN RULES OF BUDGETING
1: Draw everyone into the process. Build a team solution to
a team challenge.
DON’T make budgeting a top-level activity
DO involve everyone who is responsible for spending the business’s money
- they have ‘hands on’ knowledge of where resources will be required
- involvement encourages them to ‘buy into’ the plan
- if they are to be responsible for the outcome
they must have a role in determining
the resources available to them
●
Commitment to the ownership of the figures
in the budget plays an important part in
making them achievable during the year
32
REVENUE BUDGETS
GOLDEN RULES OF BUDGETING
2: Budgets are a key part of the planning process.
Invest sufficient time to do them properly!
DON’T underestimate the importance of budget setting ... it IS a VITAL part of your job
DO take sufficient time to set the budget properly
●
Setting a budget properly requires you to formulate your plans; this will help
with day-to-day decisions as well
●
Too low a budget and you spend the next
year trying to achieve the impossible
●
Too high a budget and you deprive
others of valuable resources they
could have used to benefit
the business
33

REVENUE BUDGETS
GOLDEN RULES OF BUDGETING
3: Budgets allocate resources to meet future needs. Keep
looking ahead!
DON’T base the future on the past
DO look at what you need to achieve in the budget period
●
Making comparison with last year - applying a small across the board increase - is a
common method of budgeting; it is one way of
finding a starting place, but it is not enough
●
How many businesses assume next year
will be the same as this year - and
survive to tell the tale!
●
Planning is not easy - next year
will be different ... in what ways?
34
REVENUE BUDGETS
GOLDEN RULES OF BUDGETING
4: Budgets allocate scarce resources to competing needs. Don’t
ask for more than you need!
DON’T pad budgets
DO budget on a ‘most likely’ basis
●
Clearly state the budget assumptions
●
Explain resource implications of alternative scenarios
●
Budget padding turns the budget process
into a game - the business will be the loser
35
REVENUE BUDGETS
GOLDEN RULES OF BUDGETING
5: The successful manager is not the one with the largest budget;
he or she is the one who makes best use of the budget
available.
DON’T measure people by the size of their budgets!
DO judge them by how effectively and efficiently they use the resources available to them
●
Condemn empire-building
●
Change parochial attitudes aimed
at ‘protecting’ the department
●
Promote the team approach
36
REVENUE BUDGETS
GOLDEN RULES OF BUDGETING
6: Time is a continuum. Budgeting, planning for the future, must
also be a continuous process.
DON’T make budgeting an annual activity
DO have a process of continual review and revision
●
Re-examine and revise budgets regularly to adapt to the changing business
environment; eg: every quarter re-forecast and
budget next twelve months
●
Remember that the future is uncertain
Look what happened to the dodo!
37

REVENUE BUDGETS
GOLDEN RULES OF BUDGETING
7: Budgets are determined according to future needs - not this
year’s spend. Challenge any flurry of expenditure near
year-end!
DON’T waste valuable resources in a misguided attempt to protect your budget
for the next year
DO inform others so that the extra resources can be usefully
deployed elsewhere
●
Remember - next year’s budget should
be based on next year’s need NOT
this year’s spend!
38
REVENUE BUDGETS
GOLDEN RULES OF BUDGETING
8: Budgets allocate resources based on current priorities and
anticipated costs. These priorities and costs may change.
DON’T see the budget as a ‘licence to spend’
DO review all expenditure - is it still necessary?
- is this the best way?
- have priorities changed?
●
Challenge all expenditure!
●
Releasing resources can resolve problems
elsewhere in the business
39
REVENUE BUDGETS
GOLDEN RULES OF BUDGETING
FORECAST
Successful budgeting cannot be achieved single-handed.
Everyone must be committed to the new approach.
The team may have cynics who need converting.
Evangelise! Spread the word!
Don’t forget the Forecast!
F orward-thinking
O pen Management style
R eview continuously
E xacting
C ommitted
A daptable
S elf-critical
T eam Approach
40

REVENUE BUDGETS
SETTING BUDGETS
Adopt the FORWARD PLANNING APPROACH
Start with the statement:
“The reason I need a budget is that you need me to do something”.
Then the 4 stages follow:
Stage 1: What do you need me to do?
Stage 2: How am I going to do it?
Stage 3: What resources will I need?
Stage 4: How much will these resources cost?
The Input-Output approach can guide you through these four stages.
41
42
REVENUE BUDGETS
SETTING BUDGETS
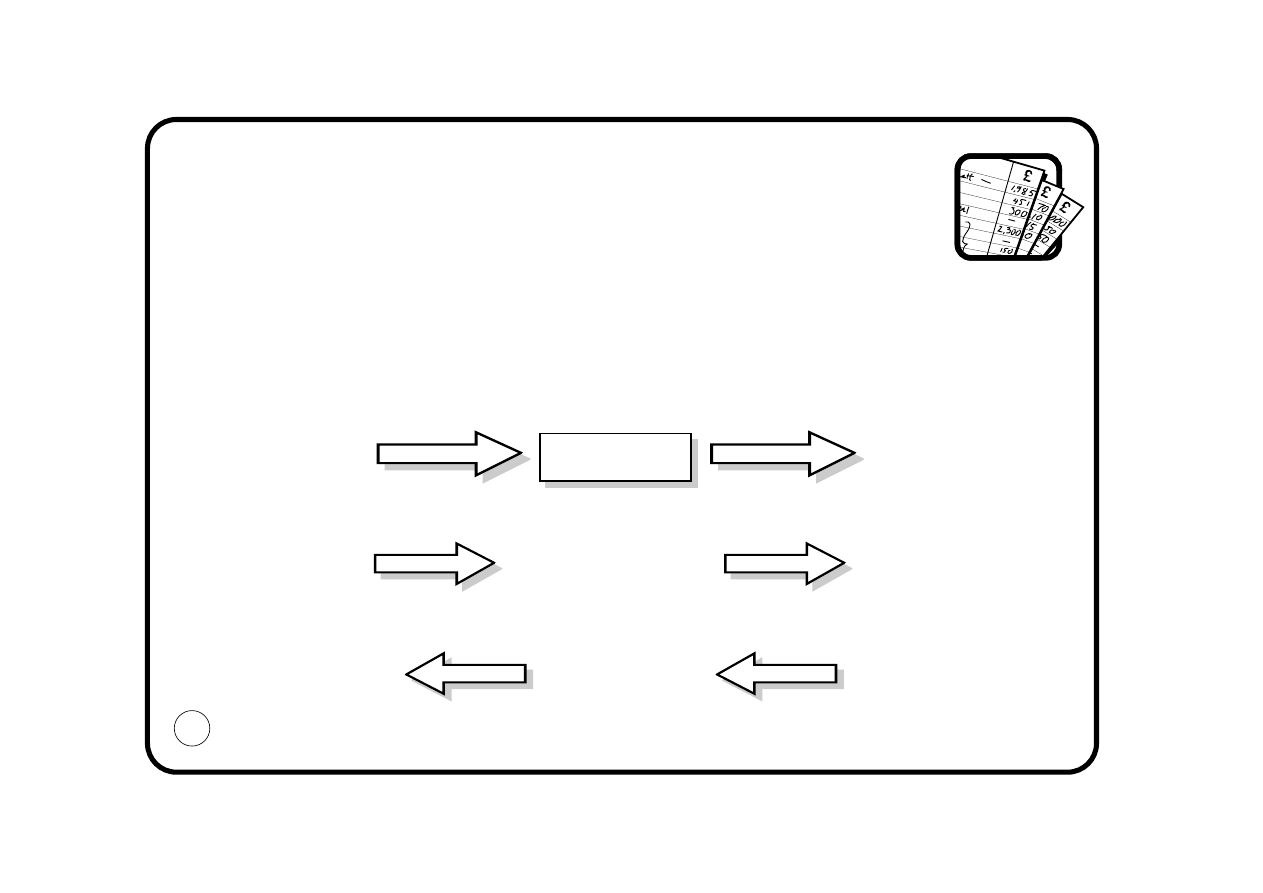
INPUT-OUTPUT ANALYSIS (I/O)
●
I/O is a technique often used in TQM (Total Quality Management) where the
relationship between departments is charted on a customer-supplier basis
●
The technique is also useful to depict the wrong and right way to budget:
INPUT OUTPUT
WRONG !!
RIGHT !!
“This is what
I’ve got”
“This is what
I’ll do with them”
“This is what you
need me to achieve”
“So this is what
you can have”
“So these are the
resources I’ll need”
“This is how I’m
going to do it”
PROCESS
REVENUE BUDGETS
SETTING BUDGETS
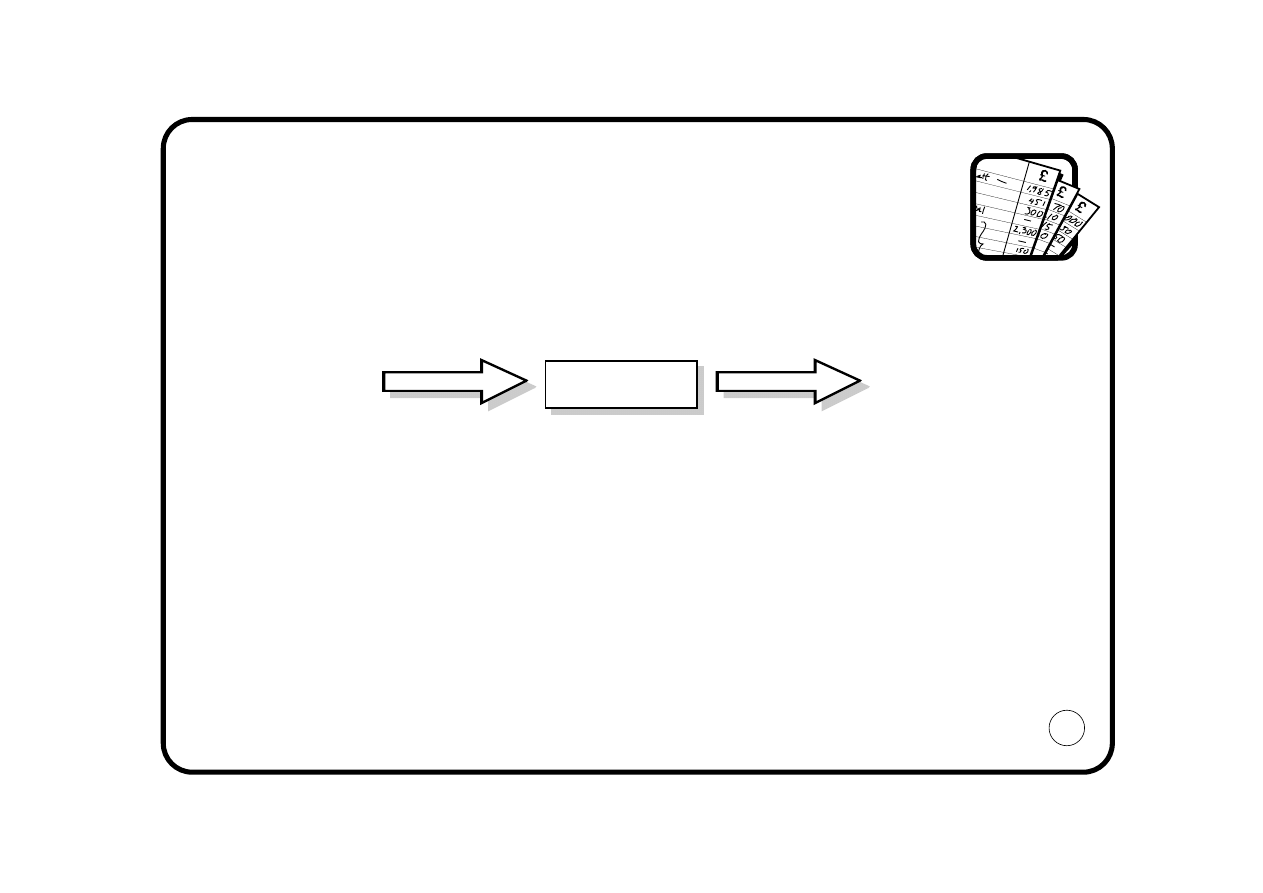
INPUT-OUTPUT APPROACH
INPUT
OUTPUT
Stage 1: What do you need me to do?
●
Identify the OUTPUTS
●
Clarify what has to be achieved and when, eg: make 1,000 units of product
each month
or sell 500 crates every quarter
or devise an advertising campaign by December
or reduce complaints of bad quality by 20% within 12 months
or visit every customer 4 times a year
43
PROCESS

44
REVENUE BUDGETS
SETTING BUDGETS
INPUT-OUTPUT APPROACH
Stage 2: How am I going to do it?
●
Choose the PROCESS, ie: the way you will achieve your OUTPUT
●
Challenge the existing process
●
Brainstorm alternatives:
- use our own employees?
- use outside agencies?
- automate?
●
Encourage innovative ideas from your staff
Then evaluate the alternatives and make your choice.
Stage 3: What resources will I need?
Identify the INPUTS you require:
People
- how many?
- which skills?
- what hours?
Expenses - what do you need to buy? Quality? Quantity?

45
REVENUE BUDGETS
SETTING BUDGETS
INPUT-OUTPUT APPROACH
Stage 4: How much will these resources cost?
Only now do you attempt to quantify in financial terms.
This is the easy bit! Your accountant will be able to help.
People:
Salary applicable to skills required
Overtime and shift premiums
Anticipated salary increases
Employment costs (National Insurance and pension contributions)
Expenses:
Current prices - or obtain quotation
Predicted/known price increases
This is your budget submission!

REVENUE BUDGETS
SETTING BUDGETS
BUDGET CO-ORDINATION
The input-output approach also provides an effective tool to co-ordinate the budgets.
Remember every output should be someone’s input.
‘WALK’ YOUR PLANNED OUTPUTS TO YOUR CUSTOMER
- is the output required?
- will it be in the format / frequency required?
Are the budgets consistently prepared?
46

REVENUE BUDGETS
SETTING BUDGETS
BUDGET REVISIONS
●
By going through the 4 stage procedure, agreement is reached on:
1 The outputs to be achieved
2 The process to be used
3 The resources required for this
4 The cost of those resources
process to achieve those outputs
●
Subsequent changes to the budget must therefore correspond to:
a change to the outputs required
or an alternative process
or a change to the resources required
or a change to the cost of those resources
●
Budget credibility can be maintained with an amended balance of `Input’
and `Output’
47
REVENUE BUDGETS
SETTING BUDGETS
BUDGET REVISIONS
●
This structured approach should prevent the
demoralising effect of indiscriminate
across-the-board budget cuts
●
No wonder the budgets lose credibility
when such cuts are announced!
●
A well-prepared budget submission is destroyed;
why bother doing it properly next time?
●
Some costs cannot be rationally treated this way, eg:
a computer maintenance contract has been signed costing £5,000 a year for the
next 3 years; how can you impose a 10% reduction here?
48
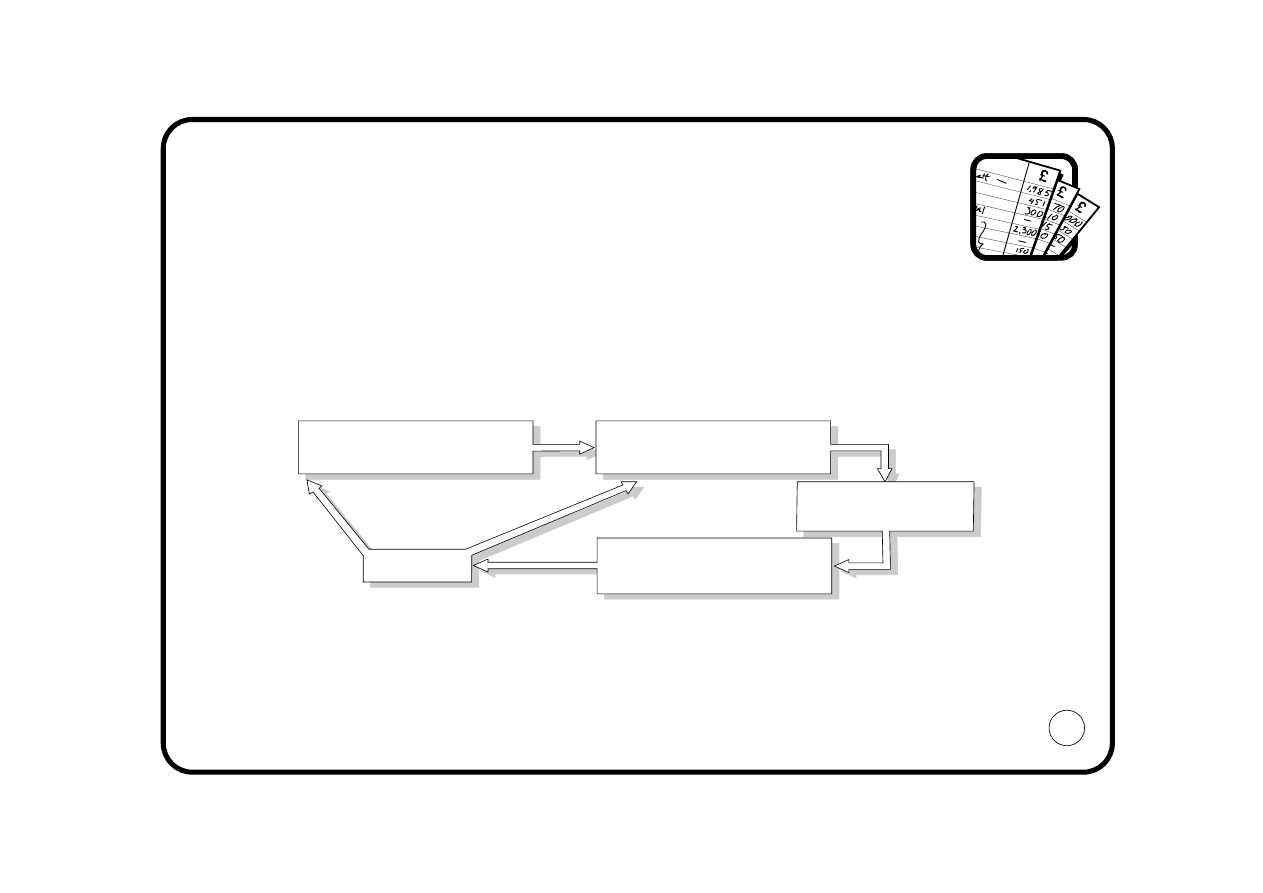
PLAN
The Budget
ACTUAL
Actual Expenditure
REPORT
Overspends/Savings
known as 'Variances'
COMPARE
Budget v Actual
ACTION*
REVENUE BUDGETS
MONITORING AND CONTROLLING BUDGETS
The budget has now been agreed. Is that it? NO
It must now be controlled.
Budgetary control is often viewed as a simple closed loop system:
* Action - the most important part!
You must either: i) bring actual expenditure back in line with budget, or
ii) notify a need to change the budget as a result of a permanent
or on-going overspend or saving
49

REVENUE BUDGETS
MONITORING AND CONTROLLING BUDGETS
REPORTING THE VARIANCES
Remember the three Rs:
●
Feedback from the system must be:
- Rapid
- Regular
- Reliable
●
You need to identify variances quickly in order to:
- investigate and understand why they have happened
- understand the relationships between budgets and hence variances
(eg: extra sales will result in additional work in the packing department and
increased shipping costs)
- respond effectively, either changing your actions to bring expenditure back in line
with the budget or communicating the need to change the budget
●
Don’t hide your problems!
50

REVENUE BUDGETS
MONITORING AND CONTROLLING BUDGETS
UNDERSTANDING THE VARIANCES
●
This system is not just about measuring whether you will need more money
than originally planned
●
Remember that the reason for allocating resources is to take actions to achieve the
company objectives
- is any saving or overspend attributable to a change in the level of performance?
- have the plans been achieved? ... surpassed?
The budget should never stand still! It is an allocation of resources to carry out the
required actions perceived at a particular point in time
- have the required actions changed?
- have the business objectives changed?
- has the strategic plan changed?
51
REVENUE BUDGETS
MONITORING AND CONTROLLING BUDGETS
TEAM APPROACH
Successful budgeting involves a flow of resources to and from
managers as the needs of the business change.
Just because you have the money in your original
budget doesn’t mean you ought to spend it!
Someone else may now have a more urgent need!
Encourage the team approach to optimise
resource allocation.
Communication is the key!
- What new opportunities have arisen in
the business?
- What new threats have appeared?
- What resources can managers
offer to meet these?
52

REVENUE BUDGETS
MONITORING AND CONTROLLING BUDGETS
TEAM APPROACH
Departments must not act in isolation.
●
Problems in one area can be
- caused by actions taken in other areas
- have implications for other budget holders
(Remember the Input-Output analysis and the internal supplier-customer relationship.)
See page 42
●
An overspend on money-back guarantees to customers, for example, could
- be caused by purchasing cheaper materials (does the budget saving in one area
compensate the overspend elsewhere?)
- have implications for the success of the launch of your new products
Look at such issues from an overall company perspective NOT from a parochial
departmental view.
This can be improved by meetings where overspends are communicated and tackled as a
company problem - what about monthly working lunches as a forum for
such discussions?
53

REVENUE BUDGETS
MONITORING AND CONTROLLING BUDGETS
KEEP LOOKING FORWARD!
Accounting periods - month end, year end, etc, have an impact which is largely artificial.
Businesses should not be run in this stop-start manner!
Think beyond year end!
●
Rolling budgets encourage managers to continue to look ahead, enhancing the
quality of the planning and helping to avoid short-term solutions
●
To prepare a rolling budget, add an additional month to the budget at every
month-end, thereby always looking 12 months ahead; this will also save you a lot of
time and effort at the formal budget-setting period!
54

55
CAPITAL BUDGETS

CAPITAL BUDGETS
INTRODUCTION
The Revenue budget does not include Capital Expenditure.
Capital expenditure is the purchase of plant, equipment, buildings, etc (known as
‘Fixed Assets’) which will be used by the business over a number of years.
Capital expenditure is budgeted separately in the Capital Budget.
56

CAPITAL BUDGETS
STRATEGIC FIT
●
Capital expenditure is a strategic investment
- it determines the way the business will make its
products or deliver its services for many years into
the future
●
The wrong choices will result in competitive disadvantage
●
Reversing the decision is: time-consuming
expensive
●
Hence the budgeting and approval system should be searching
●
Many companies require capital expenditure to be authorised by the board
57

CAPITAL BUDGETS
COMPILING THE BUDGET
●
The capital budget will be compiled after considering:
Capacity
- Does the business plan necessitate additional
production/distribution capacity?
Replacement - Which facilities need replacing; with what?
Safety
- Is there investment required to comply with health and safety
legislation?
Efficiency
- How could overall costs be reduced?
All this must be done in the context of the manufacturing strategy
- The capital budget will be submitted to the board for approval
- Acceptance will depend on:
- cash availability
- competing priorities within the company or group
58

CAPITAL BUDGETS
AUTHORISATION OF EXPENDITURE
●
The capital budget agrees a planned level of investment
●
However: just because it is in the budget doesn’t mean you can have it!
●
When the manager wishes to proceed with the investment he/she will have to submit
a further evaluation
●
This document is commonly called a ‘Capital Appraisal Form’, ‘Indent’, or ‘CER’
(Capital Expenditure Request)
●
The level of detail required will vary but will usually include:
- Details of the item to be purchased
- Reason for recommending purchase (‘the strategic logic’)
- Financial evaluation
59

CAPITAL BUDGETS
EVALUATING CAPITAL EXPENDITURE
THE STRUCTURED APPROACH
Each request for capital expenditure will be examined on its merits in respect of:
Strategic fit:
Is the proposed expenditure consistent with the business strategy?
Risk profile:
What is the resultant business risk profile - is it acceptable?
Database:
How has the data been compiled? What assumptions have been used?
Financial
profile:
What is the anticipated financial return? Is the return worth the risk?
Management
Are the management resources/skills available to ensure the satisfactory
implications:
completion of the project?
60

CAPITAL BUDGETS
LINK TO OTHER BUDGETS
LINK TO REVENUE BUDGET
Remember the inter-relationships between Capital and Revenue expenditure.
Capital expenditure
Revenue expenditure
Buildings
Rates, electricity, maintenance, depreciation *
Machinery
Power, labour, maintenance, depreciation *
Vehicles
Tax, insurance, fuel, depreciation *
The capital and revenue budgets must therefore be prepared on a consistent basis.
LINK TO SALES BUDGET
What benefit does the investment offer your customers?
Will the additional sales offset the additional revenue costs?
If they do not, your business will end up footing the bill - through reduced profits!
* Depreciation and capital and revenue expenditure are explained more fully in
The Balance Sheet Pocketbook.
61

CAPITAL BUDGETS
LINK TO CASH BUDGET
Capital expenditure requires Cash!
It is essential to consider:
●
How much will be required?
●
When will it be required?
●
Will sufficient funds be available?
Note: Possible finance charges should be linked to the revenue budget.
62

PRODUCT COSTING
63

PRODUCT COSTING
LINK TO BUDGETS
To win sales, the business must agree a selling price!
In most instances the customer demands to know the price before placing an order.
Therefore, a business must plan ahead to assess the expected revenue expenditure
which will be incurred.
Budgets provide the management tool and the basis for assessing future costs.
64
PRODUCT COSTING
DO COSTS MATTER?
“As long as we are making a profit, does it matter where it comes from?”
YES!!
How much profit will you make this year?
●
Will it be enough? (see page 25)
●
How much profit does each of the products make?
●
What are the implications of a change in sales mix?
●
What will be the impact of cost increases?
Are you in control of your business?
If you want to manage profit you must
understand and control the costs of
making and selling your products.
THE PRODUCT COST
65
PRODUCT COSTING
WHY PRODUCT COSTS?
Product costs are used for:
●
Valuing stocks
●
Calculating profit
●
Business decisions:
- pricing
- cost reduction
- make/buy
- capital expenditure
evaluation
●
Transfer pricing
Understanding the product cost is essential
66

PRODUCT COSTING
LINK TO PRICING
●
In many instances price is not determined by cost but by how much the
market will pay
●
Where there is no established market valuation, you will use cost as the basis for
- price lists
- bids/tenders/quotations
If you don’t understand your costs you may be turning down profitable business ...
or taking on orders that will kill the business off!
Where do you get this cost information from?
The Costing System
67

PRODUCT COSTING
BASIS OF MANAGEMENT DECISIONS
Which are your most profitable
●
Products?
●
Product groups?
●
Markets?
●
Customers?
Your response will drive key strategic decisions:
●
Which products shall we expand/drop?
●
Should we increase market penetration in America?
●
Can we afford to offer a discount to secure more business?
etc
Where do you get your information for such decisions?
The Costing System
68

PRODUCT COSTING
COST CONTROL
●
Which costs are increasing/decreasing?
●
Would it be cheaper to make or sell our products in a different way?
- using different machines
- sub-contracting
- using distributors, etc
●
How can we design for cost?
Where do you turn to for this information?
The Costing System
69

PRODUCT COSTING
THE PROBLEM ... THE SOLUTION
“Can’t I leave all that to the accountant?”
No!
WORRYING FACT: There is no such thing as the product cost!
Why not? Because all costing systems entail assumptions/judgements being made.
Give twelve accountants the task of costing a product and they will come up with twelve
different, correct answers!
What can you do?
1 Understand the way your existing costing system works
2 Identify its strengths and weaknesses and contribute to constructive criticism aimed
at overcoming the problems
3 Accept that there is no one product cost and be prepared to adjust the cost
database accordingly
70
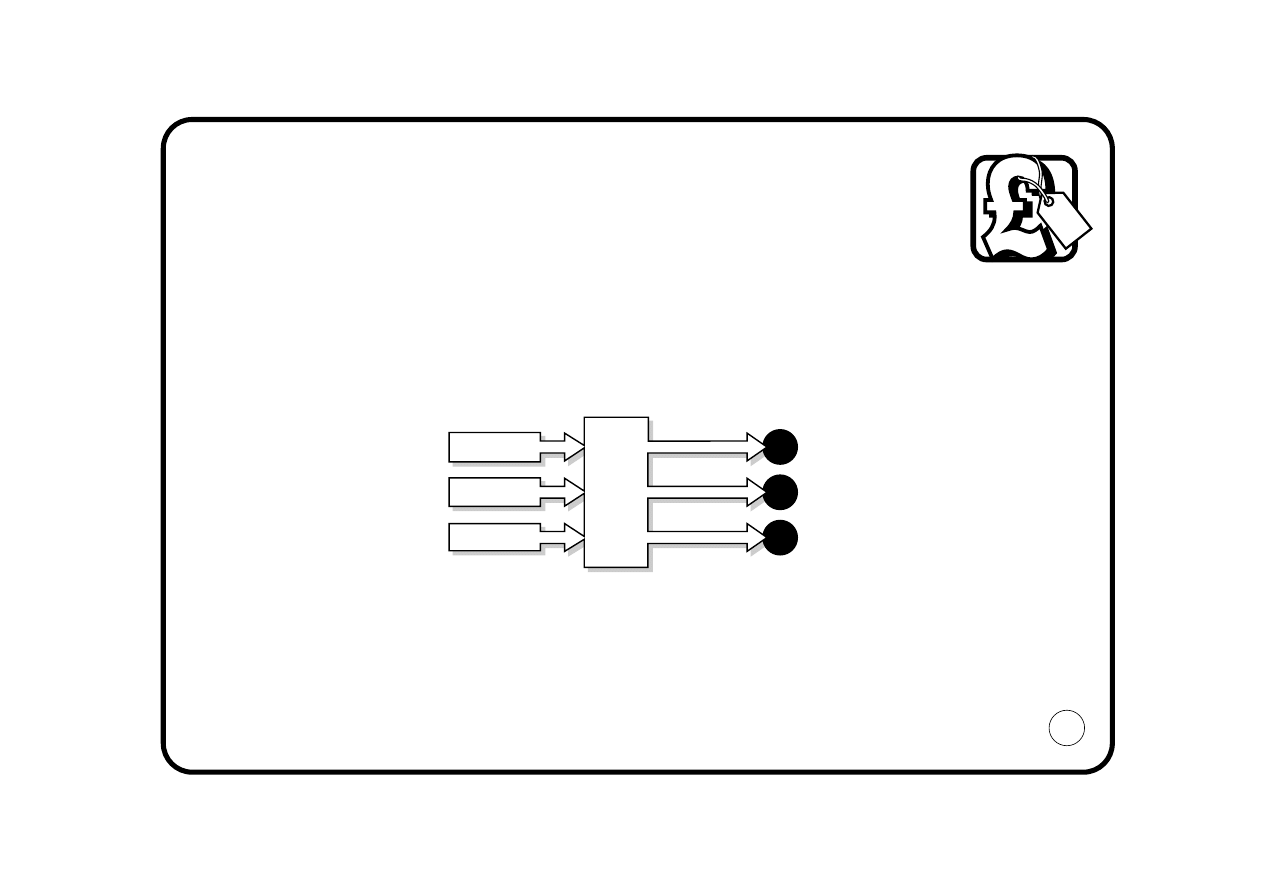
PRODUCT COSTING
STEP 1: UNDERSTAND THE SYSTEM
What is a costing system?
Businesses use resources to make products.
Assessing the resources is easy.
You pay for them via invoices and the payroll.
But which of the resources are used for each of the products?
The link attributing resources to products is
The Costing System
71
Materials
Labour
Services
A
B
C
PRODUCTS
RESOURCES
B
U
S
I
N
E
S
S
PRODUCT COSTING
UNDERSTAND THE SYSTEM
THE CONFLICT
How do accountants tackle this?
There are two types of accounting:
FINANCIAL
versus
MANAGEMENT
72

PRODUCT COSTING
UNDERSTAND THE SYSTEM
FINANCIAL ACCOUNTING
Primary objective:
Published accounts
Costs required for:
Profit and loss account (cost of sales)
Balance sheet (stock valuation)
Focus:
Backwards - reporting events that have already happened
Criteria for Adequacy? Compliance with accounting standards.
Note:
●
Financial accountants have rules (Statements of Standard Accounting Practice -
SSAPs or Financial Reporting Standards - FRS) which they must comply with when
producing published accounts
●
SSAP 9 governs the method of valuing stock and hence product costing
●
Published accounts are for external users and the standards aim to improve
consistency in approach
But will this be appropriate for decision-making?
73

PRODUCT COSTING
UNDERSTAND THE SYSTEM
MANAGEMENT ACCOUNTING
Primary objective: To assist decision making
Costs required for: Day to day operational decisions
Medium- and long-term strategic decisions
Focus:
Forward - predicting cost implications
Criteria for adequacy? Local relevance!
Where do you get this decision-making information from? Is it the financial accounting
system? Look at its different focus. Will it really be adequate? Probably not!
74
PRODUCT COSTING
UNDERSTAND THE SYSTEM
ELEMENTS OF COST
●
In most businesses the product costing
system will have been set up to include
some or all of these elements
●
What do these terms mean and how are
they calculated?
Direct Material
Total material consumed in producing
each unit, calculated by either
i) booking all materials against a
particular job, or
ii) having a bill of materials for products,
listing the materials that must have
been used *
* Note: When producing budgeted product costs these costs have to be estimated (see page 71)
75
Direct Labour
Total cost of operatives involved in
adding value to the cost unit, calculated
by either
i) booking time to specific jobs, or
ii) having a layout listing the
operations that must have been
carried out *
£
Direct Material
xx
Direct Labour
xx
Production Overhead
xx
Product Cost
xx

PRODUCT COSTING
UNDERSTAND THE SYSTEM
PRODUCTION OVERHEAD
What are the production overheads?
- the running costs of the manufacturing department including wages, salaries
and expenses *
How are the production overheads attributed to products? This is the tricky bit!
- How much electricity did we use for Product A?
- How much of the managers’ costs should be charged to each product?
- How much maintenance cost should be charged to Product B? etc
Accountants use the 3 A’s
Allocation
Apportionment
Absorption
* Note: The non-manufacturing departmental costs are often excluded from the product
costing system. This can be dangerous! (see page 87)
76
PRODUCT COSTS
UNDERSTAND THE SYSTEM
OVERHEADS: ALLOCATION
●
The Production process is divided up into areas of similar types of activity
called Cost Centres
●
These could be, eg: machining, assembly, repair
●
Each type of production overhead cost is then allocated or apportioned to the
cost centres to arrive at an overhead cost for each cost centre
77
Expense
Basis of charge
Machining
Assembly
Repair
Total
£’000 £’000 £’000
£’000
Indirect Labour
300
Depreciation
270
Maintenance
160
Indirect Materials
60
Power
50
Rent
160
TOTAL 1,000

PRODUCT COSTING
UNDERSTAND THE SYSTEM
OVERHEADS: ALLOCATION AND APPORTIONMENT
●
Wherever possible overheads are allocated to the cost centre consuming the
resources, eg: if each cost centre has different supervisors, their salaries can be
allocated to the centre in which they work
●
Certain overheads will not be capable of allocation, eg: rent, power,
personnel services
●
An appropriate method of sharing these between the relevant cost centres must be
found, ie: apportionment
Example:
power
- machine rating x machine hours
rent
- area occupied
personnel - number of employees
Be rational. Don’t waste money trying to allocate small sums accurately only to
apportion large amounts!
Focus on the dominant costs!
78
PRODUCT COSTING
UNDERSTAND THE SYSTEM
OVERHEADS BY COST CENTRE
The tabulation analysing all overheads by cost centre can now be completed.
79
Expense
Basis of charge
Machining
Assembly
Repair
Total
£’000 £’000 £’000
£’000
Indirect Labour
Allocation
160
80
60
300
Depreciation Allocation
160
30
80
270
Maintenance
Allocation
80
30
50
160
Indirect Materials
Allocation
15
20
25
60
Power
Apportionment
25
5
20
50
Rent
Apportionment
60
35
65
160
TOTAL 500
200
300
1,000

PRODUCT COSTING
UNDERSTAND THE SYSTEM
OVERHEADS: ABSORPTION
●
The costs of each cost centre are then charged out to the products using an
overhead absorption rate
●
The traditional approach is to use a
labour hour rate, or machine hour rate
Step 1
Establish the overhead costs allocated/apportioned to the cost centre,
eg: £500,000
Step 2
Determine the number of labour (or machine) hours to be produced by the
cost centre in the year, eg: 20,000
Step 3
Calculate the overhead hourly rate, eg:
£500,000 = £25/hour
20,000
Step 4
Charge products with overhead according to the number of hours’ work
required in the cost centre, eg:
1/2 hour £12.50 overhead
80

PRODUCT COSTING
UNDERSTAND THE SYSTEM
EXAMPLE
●
You are invited to tender for a contract to supply Product X
●
Product X will require: Direct materials £50
Direct labour 7 hours
●
Your Production Budget shows: Total Production overheads
£600,000
Planned labour hours
15,000
Planned direct wages per hour
£5
●
You calculate your overhead absorption rate:
£600,000 = £40/hour
15,000 hours
This information would play a key
role in the tendering process.
Is it correct? Or could there be
other answers - see Appendix Two.
81
£
Direct material
50
Direct labour (7 hours x £5)
35
Production overhead: 7 hours x £40/hour 280
Product cost
365
PRODUCT COSTING
STEP 2: CHALLENGE THE SYSTEM
●
Look at your own costing system
●
Is it deficient?
●
Here are some classic indicators of problems:
- ‘easy’ products are reported to be loss-makers
- ‘difficult’ products are reported as highly profitable
- competitors seem unable to match your low prices
- competitors continually under-cut you
- cost information is ignored/disbelieved
- departmental PC based information is
compiled to provide ‘true costs’
82

PRODUCT COSTING
CHALLENGE THE SYSTEM
YOU ARE UNIQUE!
The following pages identify some of the areas to start looking at, when you challenge
your own product costing system.
●
The costing system should trace resources through to products (see page 71)
●
No two companies use identical resources in exactly the same way to make the
same products
●
Hence no two costing systems should be the same!
Is your system tailored to reflect what goes on in your business?
83

PRODUCT COSTING
CHALLENGE THE SYSTEM
WHO WROTE IT?
●
The costing system should trace resources through to products
●
Who knows this process best? Probably not the accountant!
But who wrote the costing system?
●
How often do you change the resources, processes or products?
How often does the costing system change?
●
The management accountant produces cost information to facilitate decision-making
Does it really help you take better decisions?
84

PRODUCT COSTING
CHALLENGE THE SYSTEM
OVERHEADS
●
Product costs will be affected by:
- number and definition of cost centres
- basis of apportioning costs
- method of absorption
Has sufficient thought been given to the choices in your system?
A detailed example of the effect this can have on the product cost is given
in Appendix Two
85
PRODUCT COSTING
CHALLENGE THE SYSTEM
BELOW-THE-LINE COSTS
●
Most costing systems treat direct materials, direct labour and production overhead as
product-related, whereas other operating costs (expenses) are deemed to be non
product-related
●
These expenses are often referred to as ‘below-the-line’, ie: below gross profit
●
This results in profit reports which only identify product profitability at the
Gross Profit stage
Example
●
The business wishes to
focus its product range
●
Which product should it
drop, A or B?
●
What effect will it have
on operating profit?
86
A
B
Total
£
£
£
Sales
100
100
200
Less:
Cost of Goods Sold
70
50
120
Gross Profit
30
50
80
Expenses:
Admin
10
Selling
20
Service
30
Operating Profit
20
PRODUCT COSTING
CHALLENGE THE SYSTEM
BELOW-THE-LINE COSTS
Would your response be different if the following information were available to you?
A has been made for many years and any design/manufacturing problems eliminated.
It is sold in large quantities to a few customers.
B is a new product with many teething problems. It is sold in small quantities to many
different customers.
Discussions with the relevant
departmental managers enable the
below-the-line expenses to be
analysed by product. Don’t be put off!
You are not looking for excessive
precision in this allocation. Managers
should be able to give you an
approximate percentage split.
Does your business make its strategic decisions at the gross profit stage?
87
A
B
Total
£
£
£
Sales
100
100
200
Less:
Cost of Goods Sold
70
50
120
Gross Profit
30
50
80
Expenses:
Admin
2
8
10
Selling
4
16
20
Service
-
30
30
Operating Profit/(Loss)
24
(4)
20

PRODUCT COSTING
CHALLENGE THE SYSTEM
TIME-RELATED OVERHEADS
Traditional absorption costing implies that the overhead part of the product cost depends
on time, ie: if the overhead rate is £60/hour then if Product J and K both take 10 minutes
to make, they will both be charged with £10 overhead.
Is this realistic?
Are all overhead costs driven by time?
Example:
Products J and K both take 10 minutes per unit to machine. J is a long-established
product; material is purchased and received in the normal batch size of 100. When J is
machined, the first-off is inspected and the balance run automatically.
K is a new product. It has been badly designed and engineered. Material is purchased
and received in the normal batch quantity of 1! When K is being machined, managers,
designers, engineers and inspectors crowd around the machine nursing the product
through the process.
88

PRODUCT COSTING
CHALLENGE THE SYSTEM
TIME-RELATED OVERHEADS
What goes into overhead costs?
- purchasing, receiving, inspection, etc, etc
Did J really cost the same to produce as K?
Do you have products with differing cost demands?
Activity Based Costing (ABC) seeks to remedy this problem by grouping overheads by
activity, eg: purchasing, setting up machines, despatching and then charging products
according to their demand for these activities.
89

PRODUCT COSTING
CHALLENGE THE SYSTEM
STANDARD COSTING
●
Some businesses use standard costs, ie: pre-determined values for:
Materials - price and quantity
Labour - rate and hours
●
Differences between the standard and actual values are reported as variances
●
If your business uses standards:
- Are the variances analysed by product? or
- Are they treated as `below-the-line’? or
- Even worse, are they prorated based on standard cost?
Look how it can influence your view!
90
PRODUCT COSTING
CHALLENGE THE SYSTEM
CHALLENGES: VARIANCES
Method 1
‘Below-the-line’
or
Method 2
‘Prorata’
or
Method 3
‘Analysed by
product’
Only the last analysis reveals that BETA makes a loss!
91
Products
ALPHA %
BETA %
TOTAL %*
£’000
£’000
£’000
Sales
200
100
300
Standard Cost of Sales
100
50
150
Standard Gross Profit
100
50
50
50
150
50
Variances
(30)
Actual Gross Profit
120 40
Sales
200
100
300
Standard Cost of Sales
100
50
150
Standard Gross Profit
100
50
150
Variances
(20)
(10)
(30)
Actual Gross Profit
80
40
40
40
120
40
Sales
200
100
300
Standard Cost of Sales
100
50
150
Standard Gross Profit
100 50
150
Variances
50
(80)
(30)
Actual Gross Profit
150
75
(30)
(30)
120
40
* Profit
figures
expressed
as a %
of sales

PRODUCT COSTING
CHALLENGE THE SYSTEM
SCRAP
Are scrap costs analysed by product?
- or treated as ‘below-the-line’?
- or prorated?
Scrap should be analysed by product and by cause.
You need this information to focus your drive against scrap!
92

PRODUCT COSTING
CHALLENGE THE SYSTEM
ESTIMATES
When producing budgeted product costs, the direct material, direct labour and production
overhead costs have to be estimated. The estimate is usually compiled by reference to
past cost experience as recorded in the costing system.
Get it right!
Incorrect records will perpetuate problems.
Is there sufficient feedback of actual cost information to those who compiled the estimate
for them to learn from their mistakes?
The most expensive mistake is the one nobody learns from!
93

PRODUCT COSTING
CHALLENGE THE SYSTEM
SPURIOUS ACCURACY!
Beware of decimals!
Don’t be conned by delusions of accuracy!
Remember there is no such thing as the
cost of a product!
... so why does your accountant insist
on producing costs to 3 decimal
places ...? It is far better to be
approximately right than precisely wrong.
94
PRODUCT COSTING
STEP 3: BE FLEXIBLE
●
Cost information must be adjusted according to
the decision being taken
●
Which costs are relevant to the decision?
- Product cost (from the costing system)?
- Incremental (or marginal) cost?
- Replacement cost?
- Opportunity cost?
●
What will be the impact to the business
- in the short-term?
- in the long-term?
One costing system cannot provide a
quick-fix to all your decision-making needs.
95

PRODUCT COSTING
BE FLEXIBLE
EXAMPLE I: MAKE OR BUY?
●
A key factor in the make or buy decision is the comparison between the purchase
price and the in-house cost
●
What is the in-house cost?
- which costs would change?
- costs that would not change are irrelevant!
- what would be the impact on working capital?
- what effect would there be on capacity/space/occupancy costs?
- what opportunity costs are there? etc
Remember to look at the long-term as well as short-term implications.
Don’t just use the product cost!
96

PRODUCT COSTING
BE FLEXIBLE
EXAMPLE II: MINIMUM ORDER QUANTITIES
●
You require a widget to satisfy a customer order
●
The supplier quotes £1 with a minimum order quantity of 50
●
What is the cost of the widget?
£1 or £50?
●
If the other 49 will be used, then £1
But beware
If the other 49 have no predicted use, then the cost is £50
Which cost is appropriate when pricing the order?
Be prepared to adjust basic cost information.
97

PRODUCT COSTING
SUMMARY
●
To manage a business you must
Understand your products
●
So you must understand the effect each product has on the business performance
●
Critical decisions are taken based on product cost information
Get it right!
98

APPENDICES
99
NB
APPENDIX ONE
BUSINESS FINANCIAL MODEL
SOURCE OF FUNDS
●
Businesses need long-term finance
●
This comes from
100
NB
Accountant’s term:
- Shareholders
- Share capital
- Lenders
- Loan capital
- Reinvestment of profits
- Retained profits
SOURCE OF FUNDS
SHARE CAPITAL
LOAN CAPITAL
RETAINED PROFITS
APPENDIX ONE
BUSINESS FINANCIAL MODEL
USE OF FUNDS
●
The long-term finance is used to provide
Accountant’s term
Facilities/processes
- Fixed assets
Products/services
- Working capital
101
NB
SOURCE OF FUNDS
USE OF FUNDS
SHARE CAPITAL
LOAN CAPITAL
RETAINED PROFITS
PRODUCTS / SERVICES
WORKING CAPITAL
FACILITIES / PROCESSES
FIXED ASSETS
APPENDIX ONE
BUSINESS FINANCIAL MODEL
MAKING PROFIT
●
By using the fixed assets,
the working capital
investment generates
products that can be sold
●
Once all costs have been
met and interest, tax and
dividend allowed for, then
any profit left over can be
reinvested into the business
* Depreciation is a charge for the use of the
fixed assets and is included in the product cost.
Note: This model is developed step by step in The Balance Sheet Pocketbook
102
NB
SOURCE OF FUNDS
USE OF FUNDS
SHARE CAPITAL
LOAN CAPITAL
RETAINED PROFITS
PRODUCTS / SERVICES
WORKING CAPITAL
Sales
Attributable Cost
Operating Profit
Interest
Tax
Earnings
Dividend
Retained Profits
Less:
Less:
Less:
Depreciation
FACILITIES / PROCESSES
FIXED ASSETS
*
APPENDIX TWO
PRODUCT COSTING EXAMPLE
CHOICE OF COST CENTRES
On page 85 it was stated that product costs will be affected by:
- number and definition of cost centres - method of absorption
- basis of apportioning costs
The following example demonstrates some of their effects. Refer back to page 81
for the initial information.
Suppose you use a separate cost centre for materials to charge out purchasing,
receiving costs, etc.
Additional information:
The overhead absorption rates would now be:
Materials
£75,000 = 10%
Labour £525,000 = £35/hour
£750,000
15,000
103
NB
Production overheads:
£
Material related overheads
75,000
Labour related overheads
525,000
Total
600,000
Planned material purchases
£750,000
APPENDIX TWO
PRODUCT COSTING EXAMPLE
CHOICE OF COST CENTRES
The revised product cost would be:
Which is correct?
Has your business got it right?
104
NB
£
Direct material
50
Direct labour
35
Production overhead:
Material (£50 @ 10%)
5
Labour (7 hours x £35/hour)
245
250
Product cost
335
APPENDIX TWO
PRODUCT COSTING EXAMPLE
CHOICE OF COST CENTRES
Example continued:
●
Suppose you then separate machining from assembly?
●
Additional information:
£
Production overheads:
Material related overheads
75,000
Labour related overheads: Machining 400,000
Assembly 125,000
Total
600,000
Planned labour hours:
Machining 10,000 hours
Assembly 5,000 hours
●
The overhead absorption rates for labour would now be:
Machining £400,000 = £40/hour
Assembly £125,000 = £25/hour
10,000
5,000
●
Product X requires
2 hours machining
5 hours assembly
105
NB
APPENDIX TWO
PRODUCT COSTING EXAMPLE
CHOICE OF COST CENTRES
The revised product cost would be:
Another correct answer!
106
NB
£
Direct material
50
Direct labour
35
Production overhead:
Material 5
Machining (2 hours x £40/hour)
80
Assembly (5 hours x £25/hour) 125
210
Product Cost
295

APPENDIX TWO
PRODUCT COSTING EXAMPLE
BASIS OF ABSORPTION
●
The choice of absorption factor will also influence the product cost
Example:
Suppose in the previous example you decided to recover the machining overheads
using machine hours rather than labour hours.
Additional information:
Planned machining hours
16,000
Machine hours required for Product X
3 hours
The overhead absorption rate for machining would be:
£400,000 = £25/hour
16,000 hours
107
NB
APPENDIX TWO
PRODUCT COSTING EXAMPLE
BASIS OF ABSORPTION
The revised
product cost would be:
Spoilt for choice! £365? £335? £295? £290?
Which would you use for your tender?
Don’t forget there is no such thing as the product cost.
Look for the method that is appropriate to your business and the decision to be made.
108
NB
£
Direct material
50
Direct labour
35
Production overhead:
Material 5
Machining (3 hours x £25)
75
Assembly 125
205
Product Cost
290

About the Authors
Anne Hawkins, BA, ACMA is a Management Accountant with a first class
honours degree in Business Studies. Anne has progressed from this
strong knowledge base to gain senior management accounting
experience within consumer and industrial product industries. As a
Training Consultant she develops and presents finance programmes to
Directors and Managers from all sections of industry.
Clive Turner, ACMA, MBCS is Managing Director of Structured Learning
Programmes Ltd, established in 1981 to provide management
consultancy and training services. Clive works with management to develop
strategic business options. He participates in the evaluation process: designs
the appropriate organisation structure and provides management
development to support the implementation process. Clive continues to have
extensive experience in delivering financial modules within Masters
Programmes in the UK and overseas.
For details of support materials available to help trainers and managers run
finance courses in-company, contact the authors at Unit 33, The Rubicon Centre,
Broad Ground Road, Lakeside, Redditch, Worcs B98 8YP
© Anne Hawkins and Clive Turner 1995
This edition published in 1995 by Management Pocketbooks Ltd. Reprinted 1997, 2000
14 East Street, Alresford, Hants. SO24 9EE
Printed in UK
ISBN 1 870471 342

Please send me:
The Managing Budgets
Pocketbook
The
Pocketbook
The
Pocketbook
The
Pocketbook
The
Pocketbook
Your details
Name
Position
Company
Address
Telephone
Facsimile
VAT No. (EC companies)
Your Order Ref
ORDER FORM
No.
copies
Order by Post
MANAGEMENT POCKETBOOKS LTD
14 EAST STREET ALRESFORD HAMPSHIRE SO24 9EE UK
Order by Phone, Fax or Internet
Telephone: +44 (0)1962 735573
Facsimile: +44 (0)1962 733637
E-mail: pocketbks@aol.com
Web: www.pocketbook.co.uk
Customers in USA should contact:
Stylus Publishing, LLC, 22883 Quicksilver Drive,
Sterling, VA 20166-2012
Telephone: 703 661 1581 or 800 232 0223
Facsimile: 703 661 1501 E-mail: styluspub@aol.com
Wyszukiwarka
Podobne podstrony:
Dublin budget
U S Budget?ficit Good or?d
Budgetary expenditure on the common agricultural policy
Government R&D budgets
10 Cable Plant Link Loss Budget Analysis
Implementation of budget (EAGGF Guidance Section) (2004)
C Budget w UOFP, Finanse Publiczne, Wykład III
Guide To Budgets And Financial Management
Masterspy Releases $45 6B Budget for FY2015
2 Budget Skarb Srodki Pubid 20181 ppt
Budżet instrukcja, Instructions for the presentation of the budget - Macro-projects
Government Spending & Budget
develop2gether preparing budget
Dublin budget
Budget Planner PDF
4 Budget EU 2020 EN
Start up Budget for a Coaching Practice
więcej podobnych podstron