
C
H
A
P
T
E
R
10
C
ABLE
P
LANT
L
INK
L
OSS
B
UDGET
A
NALYSIS
D A V E C H A N E Y
In order to operate properly, a fiber optic network link must have an adequate
loss margin. That is, the total loss in the installed cable plant must be less than the
tolerable loss of the transmitters and receivers in the transmission equipment
being used. Figure 10-1 graphically illustrates the link loss parameters.
During the design phase, the cable plant loss must be estimated, based on
average component specifications and the total cable length, to ensure the chosen
equipment will work properly. Ideally, there should be at least 3 dB less loss in
the cable plant than the link dynamic range to allow for component degradation
and potential restoration splicing.
Loss budget analysis calculation and verification of a fiber optic system’s
operating characteristics includes all items in the cable plant, such as fiber length,
number of connectors and splices, and any other passive components such as
optical splitters. Optical loss is the key parameter for loss budget analysis, but
bandwidth must be considered in some high bit-rate multimode systems such as
FDDI, where a maximum cable length is specified regardless of optical loss.
Prior to implementing or designing a fiber optic circuit, a cable plant loss
analysis is required. Prior to system turn up, test the circuit with a source and
fiber optic power meter to ensure that it is within the loss budget.
121
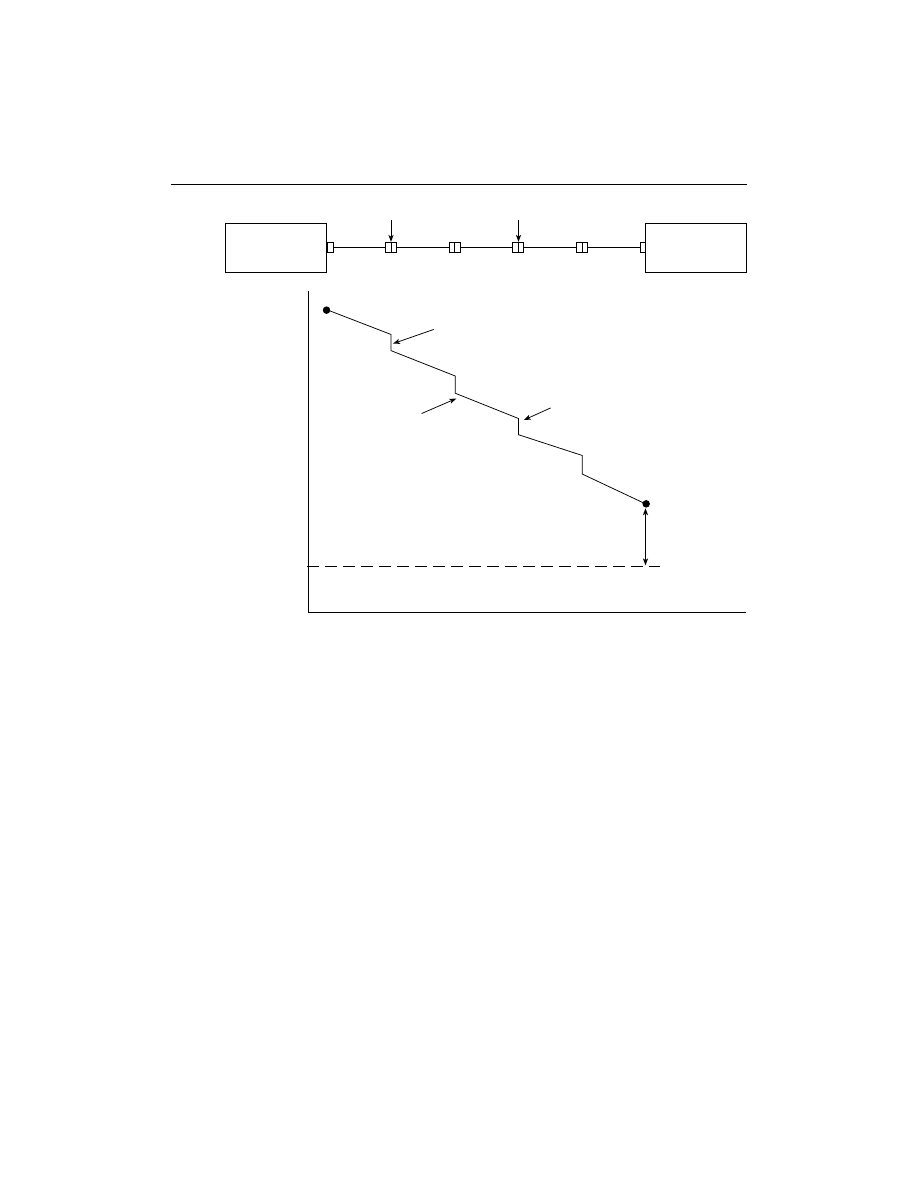
Figure 10-1
Fiber optic link loss budget.
CABLE PLANT PASSIVE COMPONENT LOSS
Consider the link shown in Figure 10-1 for operation at 1300 nm on multimode
fiber.
Step 1. Fiber Loss at the Operating Wavelength
Cable length (km)
2.0
Typical fiber loss:
Fiber type
Multimode
Singlemode
Wavelength (nm)
850
1300
1300
1550
Fiber attenuation (dB/km)
3
1
0.5
0.4
Total fiber loss for system
operating on multimode
fiber at 1300 mn
2.0
122
CHAPTER 10 — CABLE PLANT LINK LOSS BUDGET ANALYSIS
System
Transmitter
System
Receiver
Connnector
Splice
Power Coupled from Transmitter
Connnector Loss
Fiber Loss
Link Loss Margin
Received Power
Receiver Sensitivity
Distance
Splice Loss
Power
Connnector
Connnector

Step 2. Connector Loss
Typical connector loss
0.5 dB
Total number of connector pairs 5 (including connectors on ends of cable.)
Total connector loss
2.5 dB
Step 3. Splice Loss
Typical splice loss
0.2 dB
Total number of splices
1
Total splice loss
0.2 dB
Step 4. Total Cable Plant Attenuation
Total fiber loss (dB)
2.0
Total connector loss (dB)
2.5
Total splice loss (dB)
0.2
Other (dB)
0
Total link loss (dB)
4.7
EQUIPMENT LINK LOSS BUDGET CALCULATION
Step 5. From Manufacturer’s Specification for Active Components
Operating wavelength (nm)
1300
Fiber type
MM
Receiver sensitivity (dBm@ specified BER)
–31
Average transmitter output (dBm)
–18
Dynamic range (dB)
13
Recommended excess margin (dB)
3
Maximum cable plant loss (dB)
10
Step 6. Loss Margin Calculation
Dynamic range (dB)
10
Cable plant link loss (dB)
–4.7
Link loss margin (dB)
5.3
This calculation must be verified by testing with a source of the proper wave
length and a power meter after installation. In some cases, where the equipment
may be operating on two different wavelengths or future upgrades are planned,
testing at two wavelengths may be required. If the calculated and tested values
differ considerably, but all the tested fibers in the cable are similar in loss,
remember the specifications used for calculations are not exact. As long as proper
operating margins are available, the cable plant should be acceptable.
CHAPTER 10 — CABLE PLANT LINK LOSS BUDGET ANALYSIS
123

REVIEW QUESTIONS
cable length: 3 km
number of connections: 2
number of splices: 1
operating wavelength: 1300 nm
fiber type: MM
receiver sensitivity: –35 dBm
average transmitter output: –25 dBm
Using this example fiber link and the typical losses on page 122, determine the
following.
1. Connector loss: _____________
a. 1 dB
b. .5 dB
c. 2 dB
d. 3 dB
2. Total cable plant loss: _____________
a. 7.2 dB
b. 4.2 dB
c. 5.2 dB
d. 2.7 dB
3. Maximum allowable loss (with excess margin factored in): ___________
a. 10 dB
b. 5 dB
c. 7 dB
d. 2.8 dB
4. Link loss margin: _____________
a. 3 dB
b. 2 dB
c. 1.8 dB
d. 2.8 dB
5. Will the above fiber link loss be acceptable if the wavelength was
changed to 850 nm? Assume the transmitter and receiver specifications
remain the same.
_____________ Yes
_____________ No
124
CHAPTER 10 — CABLE PLANT LINK LOSS BUDGET ANALYSIS
Wyszukiwarka
Podobne podstrony:
13 Fiber Optic Cable Plant Documentation
Energy flows in biogas plants analysis and implications for plant design Niemcy 2013 (jest trochę o
How To Lose 10 Pounds In A Week The Ultimate 7 Day Weight Loss Kick Start
10 Metody otrzymywania zwierzat transgenicznychid 10950 ppt
10 dźwigniaid 10541 ppt
wyklad 10 MNE
Kosci, kregoslup 28[1][1][1] 10 06 dla studentow
10 budowa i rozwój OUN
10 Hist BNid 10866 ppt
POKREWIEŃSTWO I INBRED 22 4 10
Prezentacja JMichalska PSP w obliczu zagrozen cywilizacyjn 10 2007
więcej podobnych podstron