
conclusions, the out-of-Africa model is still the most strongly
favored, with little or no support for the multiregional model.
The mitochondrial Eve story:
briefly told
Most of the DNA in our cells is packaged within the 23 pairs
of chromosomes in the nucleus, which in total measures
about 3 billion base pairs in length; this structure is known
as the nuclear genome. The cell also contains many copies
of a second, much smaller genome that consists of a circu-
lar molecule of DNA, 16,569 base pairs long, called the
mitochondrial genome. Mitochondria are the organelles
responsible for the cell’s energy metabolism, and each cell
contains several hundred of these structures. (See figure 29.1.)
Mitochondrial DNA is useful for tracking relatively recent
evolutionary events for two reasons. First, the DNA, which
codes for 37 genes, accumulates mutations on average 10
times faster than occurs in nuclear DNA. Even in short peri-
ods of time, therefore, the DNA will accumulate mutations
that can be counted. As mutations represent the equivalent
of information, mitochondrial DNA provides more informa-
tion over the short term than does nuclear DNA. Second,
unlike an individual’s nuclear genome, which consists of a
combination of genes from both parents, the mitochondrial
genome comes only from the mother (except under unusual
circumstances). Because of this maternal mode of inherit-
ance, no recombination of maternal and paternal genes
occurs; such a mixture may sometimes blur the history of the
genome as read by geneticists. Potentially, therefore, mito-
chondrial DNA offers a powerful way of inferring population
history, unhindered by the genetic fog of recombination.
One of the first significant observations to emerge from
this work was that the amount of variation of mitochondrial
DNA types in the modern human population throughout the
world is surprisingly lowajust one-tenth of that known
among chimpanzees, for instance. One explanation is that
modern humans evolved very recently, a view that Wallace
and Wilson independently supported. A calculation based
Modern human origin has come under the scrutiny of molecular
genetic analysis more than any other topic in anthropology, including
the origin of the hominin clade, which was its first target. In the two
decades of work on this topic, two things have become clear. First, the
analysis of genetic data is more challenging than was once thought.
Second, the picture that emerges from several realms of genetic ana-
lysis shows the pattern of origin and dispersal of modern humans was
probably more complex than is inferred from anatomical evidence.
Nevertheless, the weight of genetic evidence favors the out-of-Africa
model, but probably with multiple dispersals rather than one.
The first application of genetic data to the question of the
origin of modern humans took place in the early 1980s, but
not until 1987 did it become highly visible in this realm. The
initial work, conducted first in Douglas Wallace’s laboratory
at Emory University and later in the University of California,
Berkeley, laboratory of Allan Wilson, focused on mitochon-
drial DNA. It inspired the so-called mitochondrial Eve
hypothesis, which posited that the mitochondrial DNA in
all living people could be traced back to a single female who
lived in Africa approximately 200,000 years ago (hence the
inclusion of the term “Eve”). This female was a member of a
population of an estimated 10,000 individuals, all of whom
were related to the founding population of modern humans;
descendants of this population spread into the rest of the Old
World, and replaced existing populations of various species
of archaic sapiens and Homo erectus. Thus, the mitochondrial
Eve hypothesis was consistent with the recent, single-origin
(out of Africa) model and gave no support for the multi-
regional evolution model (see unit 28).
A decade after the Berkeley group’s conclusions were pub-
lished, it was recognized that the analysis had been less than
adequate, and that the conclusion was not as solid as had
been supposed. Recent work has concentrated on two lines
of inquiry. First, evidence from other forms of DNA, includ-
ing nuclear genes and the Y chromosome, has been added to
the mitochondrial work of attempting to elucidate the origin
of modern humans. Second, genetic data have been used
to infer the population dynamics of early populations of
modern humans. Although less clear cut than the original
GENETIC
EVIDENCE
29
half will have a boy and a girl, and one-fourth will have two
girls. If family names are passed only through males, one-
fourth of the family names will be lost in the first generation.
With each succeeding generation, more losses will occur,
albeit at a slower rate. After approximately 10,000 genera-
tions (twice the number of original females), only one family
name will remain (see figure 29.3). The same pattern holds
for the loss of mitochondrial DNA types, except that the
transmission flows through the female line.
In the decade since the initial publication of the Berkeley
results, a massive effort has been channeled into testing their
validity. Two conclusions stand out. First, the claim for iden-
tifying an African origin of modern humans is not statistically
significant, as was once stated, although it still remains the
most likely case. Second, in the more than 5000 individual
samples tested to date, not a single example of an ancient
(that is, deriving from a deep Homo erectus lineage) mitochon-
drial DNA has been detected, which is contrary to what
would be expected if the multiregional evolution hypothesis
were correct.
The inability to wrest a statistically significant answer from
the mitochondrial DNA data prompted examination of other
forms of genetic evidence.
A spectrum of genetic evidence
The multiregional hypothesis suggests that the roots of all
modern human populations go back to Homo erectus, which
on the rate of accumulation of mutations of mitochondrial
DNA gave a time of origin of 140,000 to 280,000 years ago.
An alternative explanation holds that modern humans
passed through a population bottleneck recently, which
reduced genetic variation. These explanations are not mutu-
ally exclusive: modern humans may have evolved recently
and experienced a population bottleneck. Another scenario
would involve the evolution of modern humans in ancient
times, followed by a recent population bottleneck. (See
figure 29.2.)
A second finding from the early work was that Africans
display the greatest degree of variation in their mitochondrial
DNA. This discovery was taken to indicate that this popu-
lation was oldest, and therefore represented the population
of origin of modern humans. An alternative explanation,
however, is that the early African population was larger than
other populations, and its greater size promoted the accumu-
lation of more extensive genetic variation.
Colorful though it is, the term “Eve” in the hypothesis title
is misleading, and it originally led to widespread misunder-
standing of the implication of the study. The mitochondrial
DNA types in today’s human population can be traced back
to a single female, not because she was the only woman
living at the time, but because of the dynamics of loss of the
DNA. This process is best explained by analogy. Imagine a
population of 5000 mating pairs, each with a different family
name. As time passes, the population remains stable (each
couple produces only two offspring). In each generation, on
average, one-fourth of the couples will have two boys, one-
29: Genetic Evidence
201
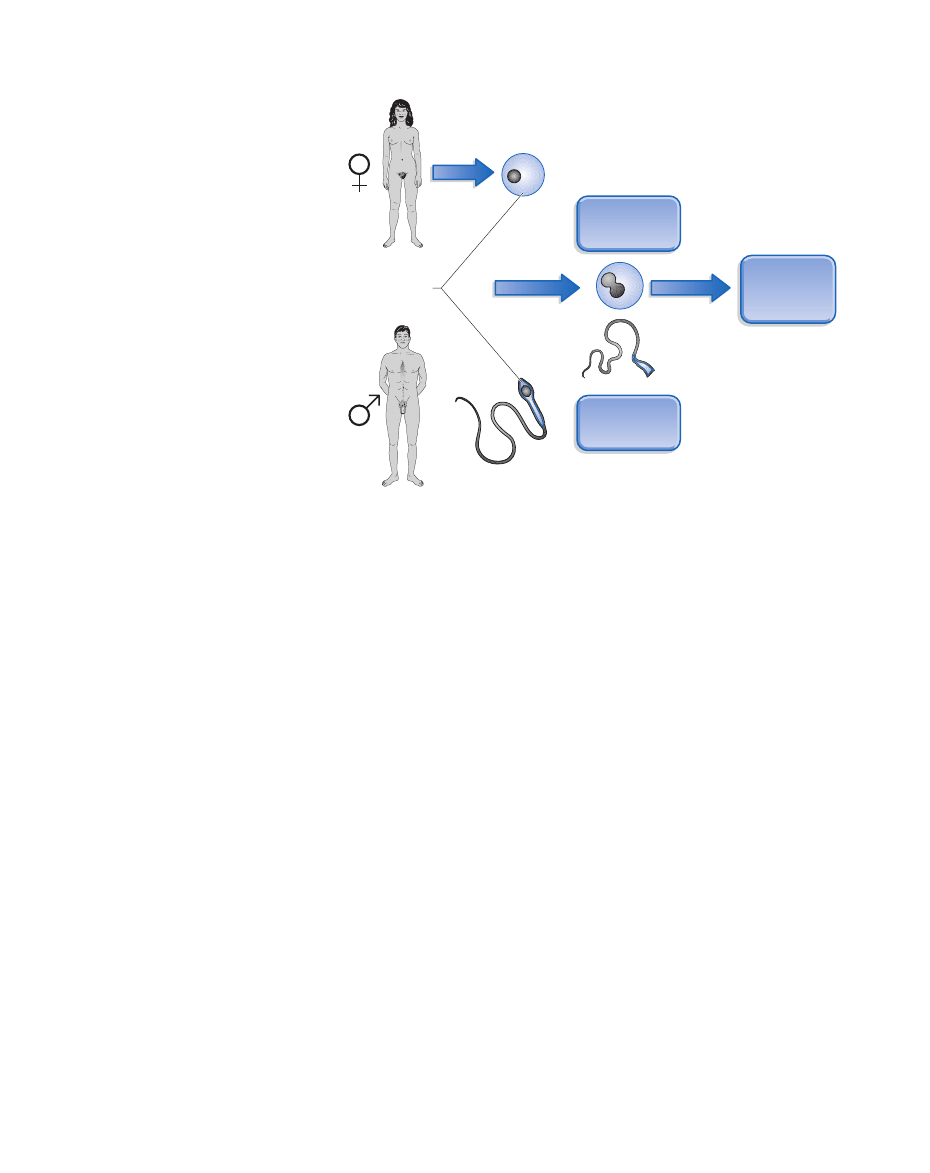
Fertilized ovum,
with mother’s
mitochondria
Discarded sperm,
still carrying
mitochondria
Offspring – male
and female –
with mother’s
mitochondria
Mitochondria
Ovum
Sperm
Figure 29.1 Patterns of inheritance:
Unlike nuclear DNA, for which we inherit
half from our mother and half from our
father, mitochondrial DNA is passed on only
by females. When the sperm fertilizes the
egg, it leaves behind all of its mitochondria;
the developing fetus therefore inherits
mitochondria only from the mother’s egg.
cannot differentiate between the hypotheses, because both
claim an African origin. Instead, the time of origin distin-
guishes between them. The question is, How can the molecu-
lar data best be used to test the two hypotheses in terms of
time of origin?
As we saw in unit 4, many genes accumulate mutations at
a rather regular rate, giving a potential molecular clock. With
a living population, the history of many different genetic
variants of a gene, or alleles, can be traced by successive,
inclusive steps, until a single ancestral type is reached. This
ancestral type is known as the coalescent, and the time in
history at which it is reached is called the coalescence time.
If, when a new species is established, the population contains
only a single allele of a particular gene, then the coalescence
time for that gene may serve as a good indicator of the time
of the speciation event. In other words, the gene tree is the
same as the population (or species) tree (see unit 8).
Frequently, however, the founding population of a new
species will contain a subset of the existing genetic variation,
so that the gene tree will show a more ancient divergence
than the population tree. In this case, the coalescence time
predates the time of the origin of the species. Under certain
circumstances, the coalescence times may be substantially
older than the time of origin of a species; in other (unusual)
202
Part Seven: The Origin of Modern Humans
130
*
120
*
*
110
100
90
80 *
70
60
*
*
50
40
30
*
20
10
1
Africa
Asia
Australia
New Guinea
Europe
Sequence divergence (%)
0
0.2
0.4
0.6
0.6
0.4
0.2
0
Ancestor
h
g
f
e
d
c
b
j
i
a
14
12
5
0
13
1
2
3
10
11
15
One mother
4
6
7
8
9
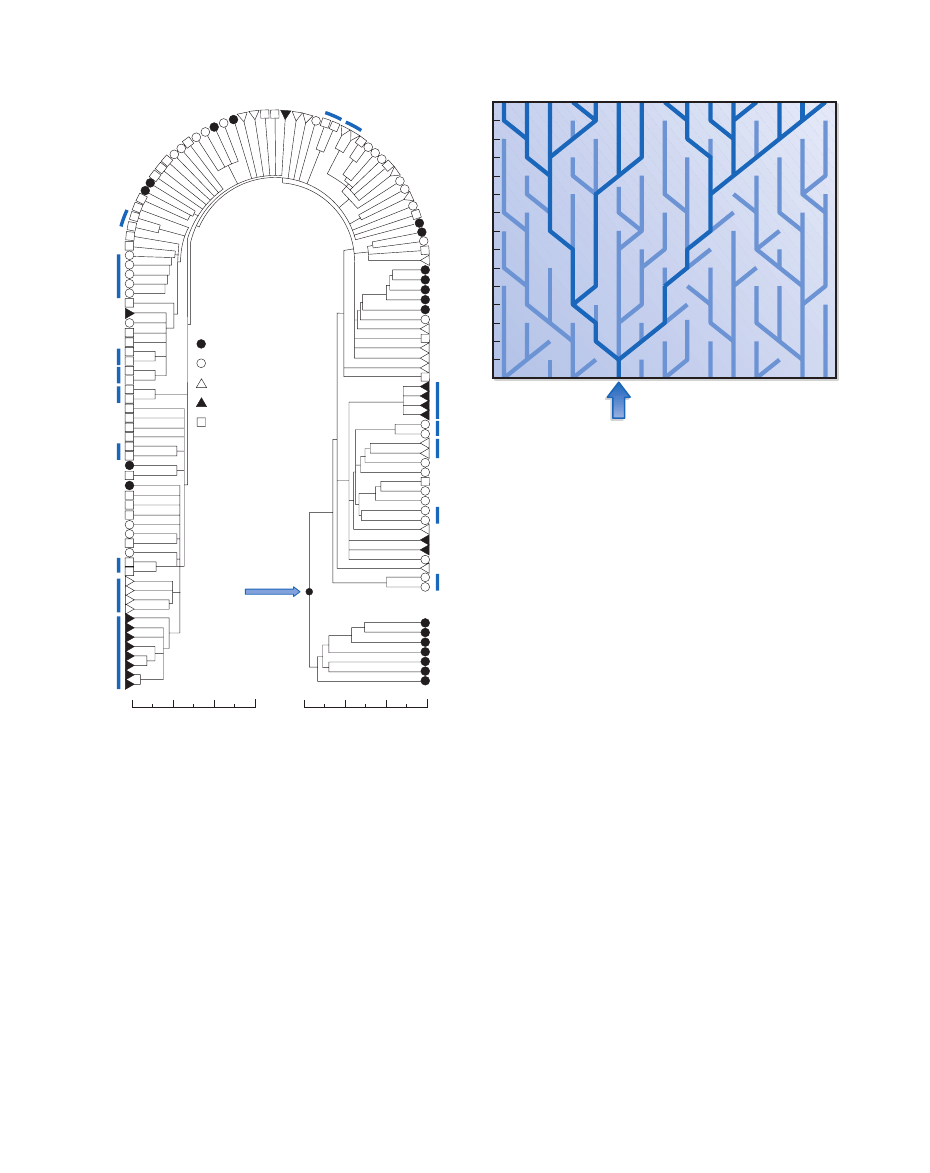
Figure 29.2 Patterns of relatedness: The classic “Christmas
tree” genealogy produced by Wilson and his colleagues in 1987
shows the genetic divergence among 147 individuals from different
geographic populations, whose mitochondrial DNA was tested. The
tree shows a split between African and non-African populations.
The African population is the longest established, indicating the
origin of modern humans in that continent. The different degrees of
sequence divergence among the non-African populations give some
indication of when different parts of the Old World were colonized.
Recent analysis has shown that this tree, one of many possible, may
not be the optimum interpretation. (Courtesy of Rebecca L. Cann
et al. Nature.)
Figure 29.3 Life of a lucky mother: An illustration of the
concept that all maternal lineages in a population trace back to a
single lineage in an ancestral population. At each generation one-
fourth of the mothers will have two male offspring, one-fourth will
have two female offspring, and one-half will have one female and
one male offspring. The mitochondrial lineages of mothers bearing
only male offspring will come to an end, leading eventually to
one lineage dominating the entire population. (Courtesy of
Allan Wilson.)
originated in Asia or Africa almost 2 million years ago. By
contrast, the single-origin hypothesis states that modern
humans originated less than 200,000 years ago, probably in
Africa. Molecular evidence that indicates an African origin
times of 188,000 and 270,000 years.) (See figure 29.6.)
Remember that clustering of coalescence times is the most
important criterionanot the position of individual times. The
results clearly favor the recent origin model.
Genetic data used in human origin analyses include two
types that are particularly interesting: one is derived from
microsatellite DNA and the other involves so-called Alu
sequences. Although they may appear to represent arcane
elements of modern molecular biology, these data sets offer
important practical tools for anthropologists. The results of
circumstances, the coalescence time may be younger. (See
figure 29.4.)
For any particular species, a distribution of coalescence
times of its various genes will exist. Some will coincide with
the age of the species; many will be slightly older; some will
be very much older; and a small number will be younger.
Maryellen Ruvolo, of Harvard University, has recently pro-
posed that hypotheses of the time of modern human origins
may be tested by examining the distribution of coalescence
times of a range of genes in modern populations. If the multi-
regional model is correct, then those times should cluster
around 1.8 million years ago (close to the time of origin of
Homo erectus); if the recent, single-origin model is correct,
those times will cluster around, for example, 200,000 years
ago (the coalescence time of modern mitochondrial lin-
eages). (See figure 29.5.) Ruvolo points out that, because
only the distribution of coalescence times is informative, a
single coalescence time cannot prove or disprove either
hypothesis. Even with a recent origin, more ancient coales-
cence times are expected; likewise, a certain probability of
recent coalescence times arises with an ancient origin as well.
In the initial research, 14 coalescence times were calcu-
lated for various genetic loci, including 4 different measures
in mitochondrial DNA and 10 in different genes in nuclear
DNA. If the 4 mitochondrial results are counted as a single
data point (to reflect their common inheritance), then the
remaining independent coalescence times are as follows: 6
cluster around 200,000 years ago, while the rest are scattered
at 0.5, 1.2, 1.3, 3.0, and 35 million years ago. (Two independ-
ent studies on different regions of the Y chromosome, the
male equivalent of mitochondrial DNA, gave coalescence
29: Genetic Evidence
203
Many genes
Many coalescence
times
Distribution
of CTs
Hypothesis
testing
G1
CT1
G2
CT2
G3
CT3
Gn
CTn
250,000 years
Multiregional model
1.8 million years
Rapid replacement model
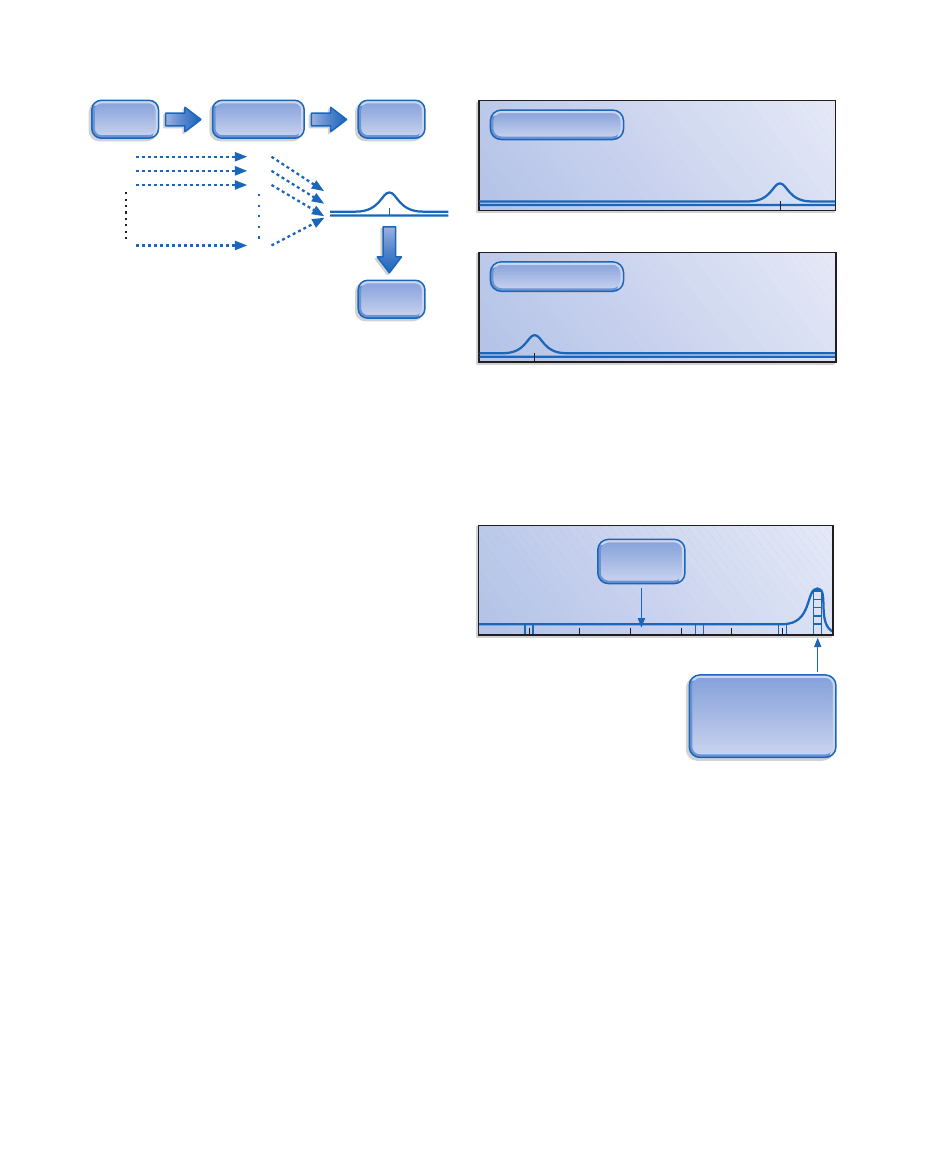
Figure 29.4 Method of testing a hypothesis: When a
population splits, it leads to a distribution of coalescence times from
many genes (denoted as G1, G2, and so on). Coalescence times
(CTs) can be expected to cluster around the time of population
division, thereby indicating the time of origin of new species. No
single coalescence time is a reliable indicator because some genes
will have an older coalescence time than the population split, while
others will be younger. (Courtesy of Maryellen Ruvolo.)
Figure 29.5 Coalescence times and the origin of modern
humans: If modern humans originated close to 250,000 years ago,
as implied by the mitochondrial DNA hypothesis, then the
distribution of coalescence times would show a peak at that time
(top). If the multiregional evolution model is correct, then
coalescence times would cluster around 1.8 million years ago
(bottom). (Courtesy of Maryellen Ruvolo.)
5’
δ-globin
0
3
million years
2
million years
1
million years
1,
ψη
-globin
apo CII
Homo erectus
out of Africa
Mitochondrial DNA
Y chromosome
Protein polymorphisms
Microsatellites (chr 13,15)
Microsatellites/Alu (chr 12)
Figure 29.6 Hypotheses tested: The distribution of coalescence
times from mitochondrial and nuclear genes supports the recent,
single-origin model of modern humans. (Courtesy of Maryellen
Ruvolo.)

The conclusion of this work is that, early in their history,
the population of modern humans suffered a relatively
severe bottleneck. Following that bottleneck, the population
expanded explosively. These data imply that the multi-
regional evolution model cannot explain modern human
origins. Rather, a modified form of the recent, single-origin
model, known as the weak Garden of Eden hypothesis, is
more likely to be correct.
Henry Harpending and his colleague Alan Rogers, of the
University of Utah, developed a hypothetical model of a popu-
lation that expanded within a brief period of time. Genetic
data culled from the modern descendants of this population
gave information about both the extent and timing of such
an event. (See figure 29.7.)
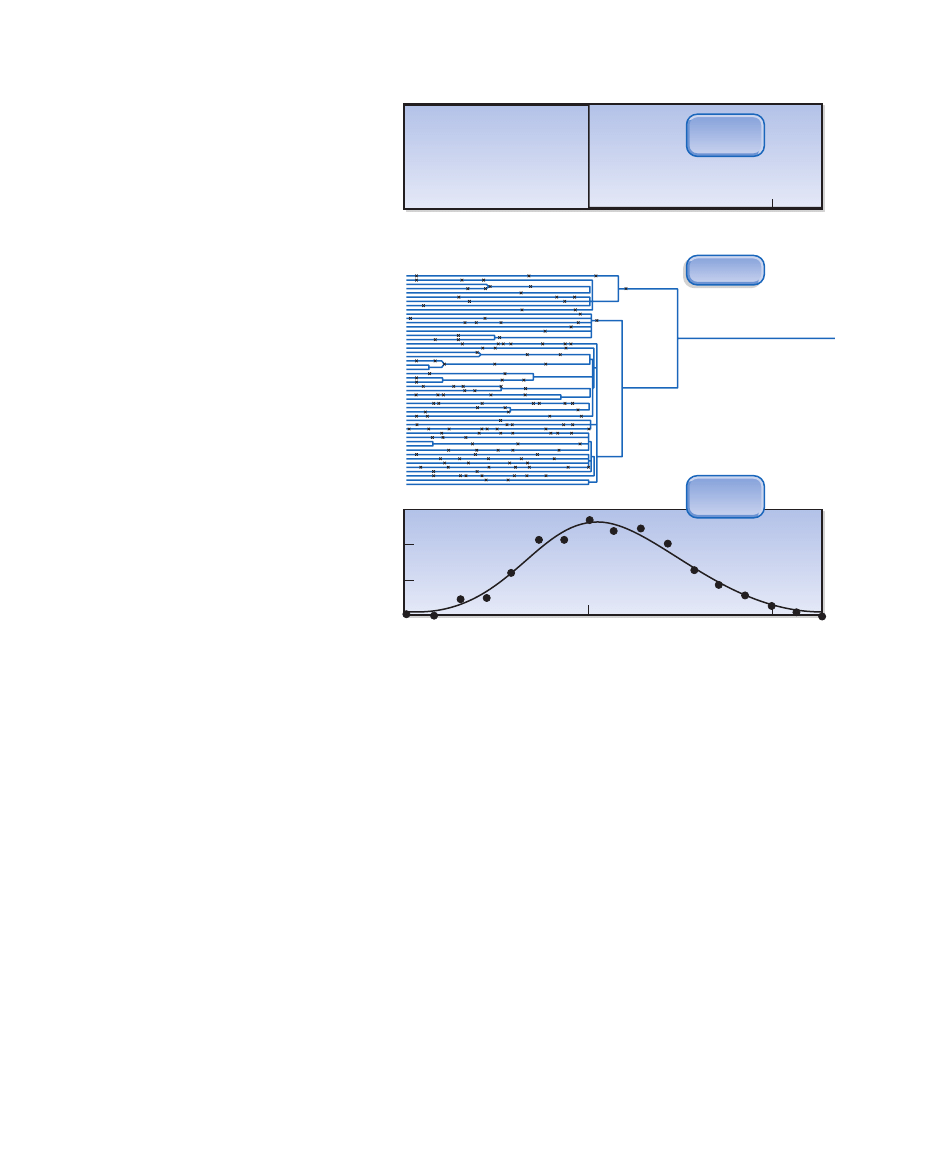
In their model, Harpending and Rogers assumed that
mutations accumulate regularly in all lineages (mutations
are shown as crosses on the horizontal lines in the middle
panel of figure 29.7). They then compared DNA sequences
between all pairs of lineages in a sample of this population,
and counted the number of mutational differences between
each pair (a sample of 50 individuals gives 435 pairs for com-
parison). The time scale is measured in terms of mutational
time, in which one unit represents the time needed for a
single mutational difference to accumulate between two
lineages; two units are sufficient for two mutational differ-
ences; and so on. The rate at which mutations accumulate is
determined by both the rate of mutation at all sites in the
DNA and the generation time. In this case, one mutational
unit equates to 8333 years, given the known rate of mutation
of certain mitochondrial sequences in humans.
Because the population underwent expansion at seven
mutational units of time in the past, a large proportion of
lineages in the current population will include seven muta-
tional differences between them. Some lineages split after
the expansion event of course, and these lineages will differ
by fewer than seven mutations. When all pairs of lineages
have been compared and mutational differences counted,
these numbers are then arrayed on a histogram, with the
horizontal axis representing the mutational time, going from
zero in the present to ever-increasing numbers as one moves
back in time. The histogram shows a peak at seven mutational
differences, with fewer points at older and younger times,
forming a wave pattern (see the bottom panel of figure 29.7).
Harpending and Rogers describe this pattern as “the signa-
ture of an ancient population expansion,” which is calculated
to have occurred almost 60,000 years ago. The position of the
crest of the wave indicates when population expansion
occurred; the shape of the wave shows its magnitude (the
sharper the peak, the more rapid was the expansion).
When Harpending and Rogers applied the mismatch distri-
bution analysis to real mitochondrial DNA data from modern
human populations from around the globe, they found the
same wave pattern. This discovery implies that the modern
human population underwent a rapid expansion of num-
204
Part Seven: The Origin of Modern Humans
analyses of microsatellites and Alu sequences appear to sup-
port the recent, single-origin model.
Microsatellites, which are short stretches of DNA that
contain many repeats of two- to five-nucleotide segments,
evolve very rapidly. Unlike the rates of mutation for most
genetic elements, which often must be calculated by cali-
bration against the fossil record, the rate of mutation of
microsatellites can be determined by laboratory observation.
This certainty adds some weight of confidence to the coales-
cence time calculated with this technique, which is 156,000
years.
Alu elements are sequences of DNA approximately 300
base pairs in length, which become inserted in large numbers
over the nuclear genome. Once inserted, they are never
removed (or at least not completely) and thus remain im-
mune to the kinds of homoplastic changes that may obscure
point mutations (see unit 4). A recent, multiauthored study
on Alu elements in a large sample from around the world
gave a coalescence time of 102,000 years.
Debate continues to swirl over the mutational dynamics
of microsatellite sequences and Alu elements, just as the
interpretation of coalescence times has inspired controversy.
In particular, population history may influence coalescence
times in ways unrelated to the establishment of a species,
usually leading to an erroneously young date. The fact that
the inferences drawn from the mitochondrial DNA data are
matched closely by a significant proportion of those from
nuclear data, however, encourages the view that they are
collectively providing insight into species events rather than
identifying population events. For example, population
crashes and explosions would affect mitochondrial DNA
variation to a greater extent than nuclear DNA variation.
While most observers accept the apparent implications of this
body of work, a minority of critics remain unconvinced. As
always, more data are required.
Finally, the genetic analysis of Neanderthal DNA, described
in unit 27, showed that this form of archaic human could not
have been ancestral to modern human populations in Europe.
A SECOND PATH OF INVESTIGATION:
POPULATION HISTORY
Two factors play into the new line of investigation followed
in population history analyses. The first stems from the
difficulty that has been experienced in deriving an unequivo-
cal phylogenetic tree from the mitochondrial DNA data. The
low phylogenetic resolution in the data prompted certain
researchers to seek other kinds of information that might be
inferred from them, using a technique known as mismatch
distribution. The insight gained with this technique can be
applied to address the second factoranamely, the puzzle of
the unusually low level of genetic diversity of mitochondrial
DNA in modern populations. (See figure 29.7.)
founding population of modern humans fragmented into
separate populations; these groups later spread out geograph-
ically to form the modern populations of Africa, Europe, and
Asia. The genetic distinctiveness of these populations was
therefore established prior to the expansion; the mismatch
and intermatch distribution data indicate that these separate
expansions took place at different times. Thus, replacement
of archaic sapiens populations would still have occurred, but
would not have involved the same dynamics as envisaged
with the original Garden of Eden hypothesis. (See figure 29.8.)
According to this new line of investigation, the low level of
mitochondrial DNA diversity reflects a population bottleneck
after the establishment of the modern human population;
this bottleneck was followed by sequential population
expansions in different parts of the world. Several questions
arise here, the most important of which is, What was the
severity of the bottleneck?
The complicated calculation required to answer this ques-
tion is based on the current genetic diversity of mitochondrial
bers, the timing of which was centered around 60,000 years
ago. Further analysis revealed that the expansion took place
at different times for different geographical populations. The
African population expanded first, followed later by expan-
sions in the European and Asian populations. This conclu-
sion came from a mismatch distribution analysis conducted
within each geographical population, followed by a similar
analysis performed between pairs of populations (this latter
technique is termed intermatch distribution).
Several possible scenarios exist to explain what happened
here, the most persuasive of which is the weak Garden of
Eden hypothesis. Remember that the recent, single-origin
hypothesis posits that modern humans arose as a small,
isolated population, and that descendants of this population
spread throughout the Old World, replacing existing popu-
lations of archaic sapiens. This concept is also called the Garden
of Eden hypothesis. The intermatch distribution analysis
implies a little more complicated history. According to this
hypothesis, once established (some 100,000 years ago), the
29: Genetic Evidence
205
Fr
equency of pair
-wise
diff
er
ences
0
7
Site differences
0.00
0.05
0.10
0.15
14
Mismatch
distribution
Eff
ectiv
e
population size
0
7
Mutational time before present
1
500
14
Population
size
2uN
F
Fi
Genealogy
Figure 29.7 Mismatch distribution:
This method uses genetic variation in
modern populations to infer population
events in the past. (See text for details.)
(Courtesy of Alan Rogers and Lynn Jorde.)
KEY QUESTIONS
• Why is mitochondrial DNA a potentially useful tool for tracking
recent evolutionary and population events?
• What are the limitations of mitochondrial DNA in inferring phylo-
genetic history?
• What is the significance of the coincidence of coalescence times
of mitochondrial and nuclear genes?
• What further genetic evidence might clarify the validity of com-
peting hypotheses for the origin of modern humans?
KEY REFERENCES
Ayala FJ. The myth of Eve: molecular biology and human origins.
Science 1995;270:1930 –1936.
Cann RL. Tangled genetic routes. Nature 2002;416:32–33.
Erlich H, et al. HLA sequence polymorphism and the origin of mod-
ern humans. Science 1996;274:1552–1554.
Gibbons A. The mystery of humanity’s missing mutations. Science
1995;267:35 –36.
———. Y chromosome shows that Adam was an African. Science
1997;278:804 – 805.
———. Calibrating the mitochondrial clock. Science 1998;279:28 –29.
Goldstein DB, et al. Genetic absolute dating based on microsatellites
and the origin of modern humans. Proc Natl Acad Sci USA
1995;92:6723 – 6727.
Hammer MF, Zegura SL. The role of the Y chromosome in human
evolutionary studies. Evol Anthropol 1996;5:116 –134.
Harpending HC, et al. Genetic traces of ancient demography. Proc Natl
Acad Sci USA 1998;95:1961–1967.
Harris EE, Hey J. Human demography in the Pleistocene: do mito-
chondrial and nuclear genes tell the same story? Evol Anthropol
1999;8:81– 86.
206
Part Seven: The Origin of Modern Humans
DNA in the world and on the mutation rate of these DNA
sequences. The simplest answer indicates the existence of
some 3500 breeding females, which would give a total popu-
lation of approximately 10,000 individuals. (Similar numbers
have been obtained from other data, including nuclear
DNA data.) In fact, population genetics equations show that
if this population was distributed in discrete geographical
populations over the Old World, as required by the multire-
gional hypothesis, the number of females would have been
smalleraclose to 1500. This figure creates a fatal problem for
the hypothesis because, as Harpending and Rogers note, “It is
difficult to imagine that a population this small could have
populated all of Europe, Africa, and Asia. . . . Knowledge
that Eve lived recently would imply that the human popu-
lation was . . . too small to have populated three continents.”
In other words, the numbers that flow from this analysis (if
correct) make the multiregional hypothesis untenable. Some
form of a recent, single-origin model would seem much more
reasonable.
Most recently, Alan Templeton, of Washington University,
St. Louis, has analyzed 11 different human genes in popu-
lations in the Old World. Long a critic of the out-of-Africa
model, he nevertheless concludes that Africa has played a
dominant role in the history of early modern humans. But he
also identifies two major population expansions from that
continent after the expansion of Homo erectus. One was
around 600,000 years ago, and another at 95,000 years ago.
This, and other work, shows that the picture of human his-
tory at this stage was more complex than had been thought.
Nevertheless, the recent-origin scenario remains the most
strongly supported by genetic analyses.
Population
bottleneck
African
populations
expand 65,000
years ago
Further global
expansion
Asian and European
populations expand
55,000
years ago
~70,000
years ago
Population
fragmentation
100,000+
years ago
Origin of
modern humans
100,000+
years ago
European
Asian
African
Proto-
European
Proto-
Asian
Proto-
African
Figure 29.8 The weak Garden of
Eden hypothesis: Developed from
mismatch distribution analysis, this
hypothesis represents a variant of the
single-origin model. It posits the origin
of modern humans in Africa, prior to
100,000 years ago. This population
fragmented (within Africa), and the
separate populations subsequently
developed genetic distinctiveness. A
population bottleneck reduced population
size, and genetic variation within them. The
African population was the first to expand,
followed by the proto-Asian and proto-
European populations, which migrated into
these geographical regions. Population
expansion then continued.

———. In defense of “Eve” — a response to Templeton’s critique. Am
Anthropol 1994;96:131–141.
Takahata N. A genetic perspective on the origin and history of
humans. Annu Rev Ecol Systematics 1995;26:343 –372.
Templeton AR. The “Eve” hypothesis: a genetic critique and reana-
lysis. Am Anthropol 1993;95:51–72.
———. “Eve”: hypothesis compatibility versus hypothesis testing.
Am Anthropol 1994;96:141–155.
———. Out of Africa again and again. Nature 2000;416:45 –51.
Tishkoff SA, et al. Global patterns of linkage disequilibrium at the CD4
locus and modern human origins. Science 1996;271:1380 –1387.
Wilson AC, Cann RL. The recent African genesis of humans. Sci Am
April 1992:68 –73.
Krings M, et al. Neanderthal DNA sequences and the origin of mod-
ern humans. Cell 1997;90:19 –30.
Manderscheid EJ, Rogers AR. Genetic admixture in the late
Pleistocene. Am J Physical Anthropol 1996;100:1–5.
Pritchard JK, Feldman MW. Genetic data and the African origin of
humans. Science 1996;274:1548 –1549.
Rogers AR, Jorde LB. Genetic evidence on modern human origins.
Human Biol 1995;67:1–36.
Ruvolo M. A new approach to studying modern human origins. Mol
Phylogen Evol 1996;5:202–219.
Stoneking M. DNA and recent human evolution. Evol Anthropol
1993;2:60 –73.
29: Genetic Evidence
207

40,000 years and 40,000 to 10,000 years, respectively. The
equivalent stages in Europe, Asia, and North Africa are
known as the Middle Paleolithic and Upper Paleolithic.
The end of the Lower Paleolithic, 250,000 years ago,
saw the end of innovation-poor, long-lasting stone-tool
industries. With the beginning of the Middle Paleolithic, the
number of identifiable tool types quadrupled, reaching per-
haps 40. The Middle Paleolithic (mode III) and Middle Stone
Age technologies were characterized by the predominance of
the prepared core technique, such as the Levallois technique
(see unit 25). Flakes produced by this method may then be
further fashioned to give what some archeologists identify as
approximately 40 different implements, each with its own
putative cutting, scraping, or piercing function. Some vari-
ation exists in Middle Paleolithic assemblages throughout
the Old World, which has encouraged the development of
a plethora of local names. The most generally applied name,
however, is Mousterian, after the Neanderthal site of Le
Moustier, in the Perigord region of France. (See figure 30.1.)
With the Upper Paleolithic, beginning 40,000 years ago,
the number of tools more than doubled again, to as many as
100. Moreover, European tool industries cascade through at
least four identifiable traditions in less than 30,000 yearsaa
pace of innovation and change unprecedented in the arche-
ological record. (See figure 30.2.) In addition to new forms of
tools, raw materials that were only infrequently used earlier,
such as bone, ivory, and antler, became very important in the
Upper Paleolithic industries.
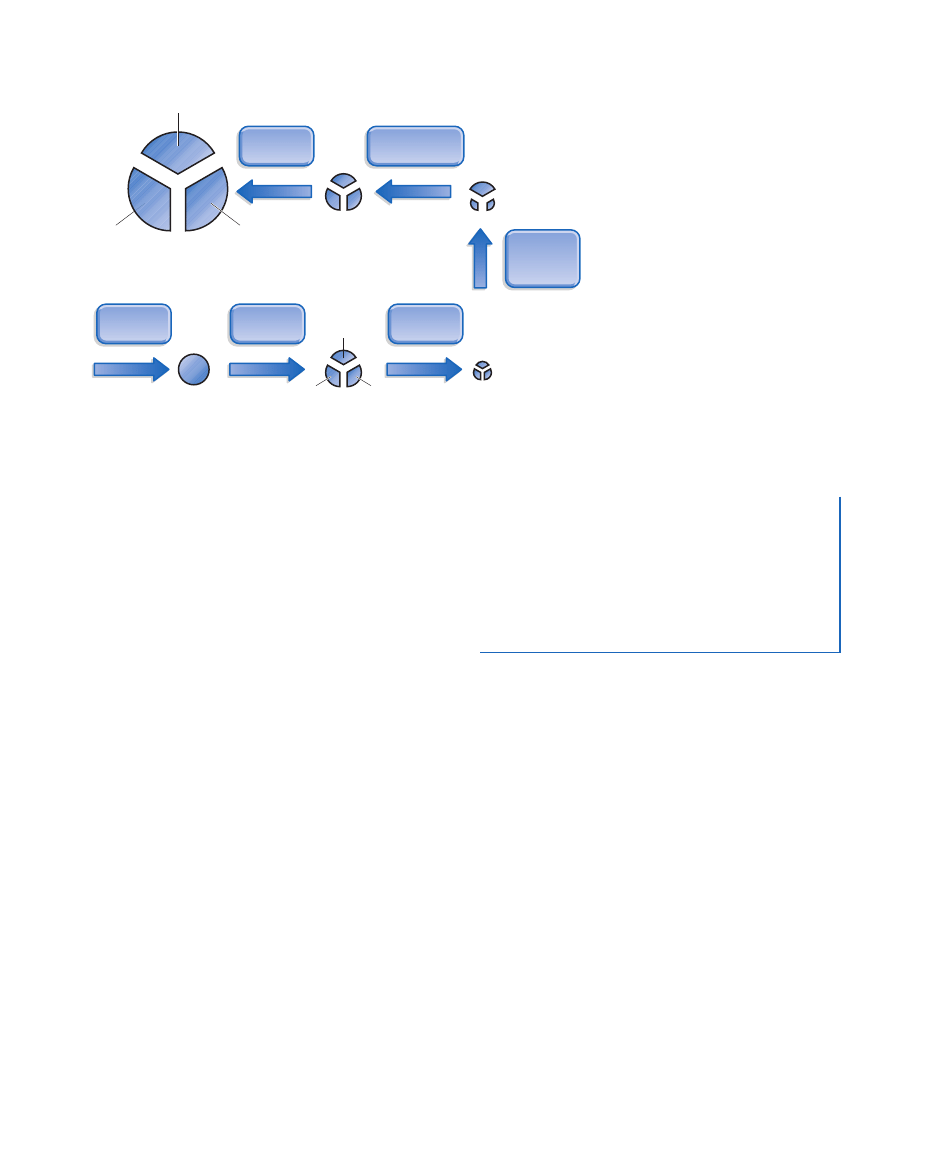
Just as flakes from prepared cores characterize Mousterian
(and Mousterian-like) industries in the Middle Paleolithic,
blades produced from prepared cores constitute something of
a signature for the many industries in the European Upper
Paleolithic (mode IV). (See figures 30.3 –30.5.) Blades are
defined as flakes that are at least twice as long as they are
wide. The preparation of the cores used for their manufac-
ture requires great skill and time. Many blades may then
be detached sequentially using a pointed object, such as the
end of an antler, hammered by a hammerstone. The blades,
often small and delicate, may be functional without further
As we saw from the two previous units, anatomical and genetic
evidence strongly favor the recent-origin, out-of-Africa model for
modern humans. Here, we explore the archeological evidence of the
behavior of the earliest Homo sapiens, to see how it meshes with the
other evidence. An important question arises here: Does modern
human anatomy equate with modern human behavior, such as the
manufacture of fine tools and the elaboration of art? For a long time,
modern human behavior has been viewed as a recent phenomenon, a
“cultural explosion” that took place in Europe some 40,000 years ago.
Recent evidence is beginning to question this scenario.
Although the archeological evidence related to the origin of
modern humans is relatively good in Europe and western
Asia, it is poor in East Asia and, unfortunately, in Africa.
For instance, while more than 100 sites dating between
250,000 and 40,000 years old have been carefully excavated
in southwestern France (and many more are known in less
detail), only about a dozen such sites have been studied in
East Africa, a region almost 100 times larger in geographical
extent. This disparity has led inevitably to a distinctly Euro-
centric interpretation of the archeological record, which
gives the impression that the pertinent behavioral changes
principally took place in Europe. Several important dis-
coveries have been made in Africa in recent years, however,
and their interpretation is leading some archeologists to favor
a different view of our behavioral evolution. Put simply, the
rival hypotheses are as follows. The first posits a recent, rapid
change in behavior, presumably based on a genetic mutation
that enhanced cognitive function. The second argues for a
more gradual evolution of elements of modern behavior,
beginning with the first anatomically modern humans in
Africa.
The archeological background
In looking for signs of modern human behavior, we are con-
cerned with a shift from the Middle Stone Age (MSA) to the
Later Stone Age (LSA) in Africa, dated at some 250,000 to
ARCHEOLOGICAL
EVIDENCE
30
ence reveals “the most dramatic behavioral shift that arche-
ologists will ever detect.” For this reason, the transition has
been regarded as revolutionary, not gradual. If true, then it
would imply that the evolution of modern morphology
(which appeared more than 130,000 years ago) occurred
separately from the evolution of modern behavior (40,000
years ago). Recent discoveries in Africa may raise questions
about this interpretation, however.
European evidence
The European archeological evidence for the stages in ques-
tion is extensive, and it does appear to give a clear signal of
a revolutionary change some 40,000 years ago. For this
reason, the transition in Europe has been dubbed the Upper
Paleolithic revolution. It coincides with the first appearance
of modern humans in the region, carrying the cultural tradi-
tion known as the Aurignacian. Aurignacian sites through-
out Europe show the typical blade-based technology and use
of bone, ivory, and antler, not only to make points but also
to create beads as body ornamentation. The sites are also
associated with other characteristics of the Upper Paleolithic:
they are larger than those of the Middle Paleolithic; open-air
(as opposed to rock shelter or cave) sites are more distinctive
and organized; artifacts indicate the existence of long-
distance contact and even trade (shells and exotic stone that
must have come from afar); and musical instruments, spe-
cifically simple flutes made from bone, are present.
preparation, or they may merely serve as the starting point
for specifically shaped implements. In addition to the sig-
nature blade, Upper Paleolithic tool makers also made exten-
sive use of bone, ivory, and antler as raw material for some of
the most delicate implements. Thus, a strong sense of directed
design and elaborate use characterize Upper Paleolithic tool
assemblages.
An important issue in the context of the origin of modern
humans is the dynamics of the shift between the Middle
Paleolithic (and MSA) and the Upper Paleolithic (and LSA).
For Stanford University archeologist Richard Klein, the evid-
30: Archeological Evidence
209
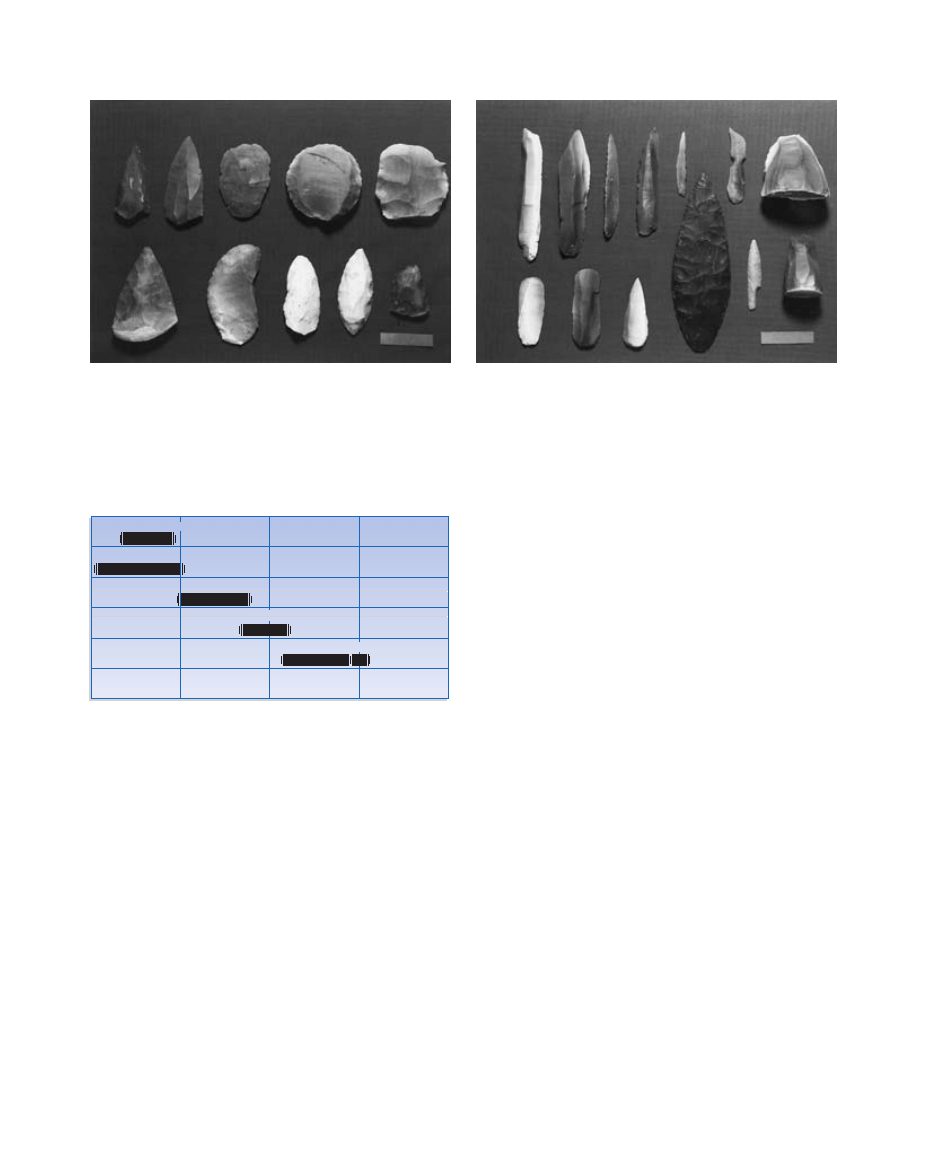
Figure 30.1 Middle Paleolithic artifacts: These typically
retouched flakes of various types were made between 250,000 and
40,000 years ago. (top row, left to right) Mousterian point, Levallois
point, Levallois flake (tortoise), Levallois core, disc core. (bottom row,
left to right) Mousterian handaxe, single convex side scraper, Quina
scraper, limace, denticulate. Scale bar is 5 cm. (Courtesy of Roger
Lewin and Bruce Bradley.)
Magdalenian Azilian
Solutrean
Gravettian
Aurignacian
40,000 years
before present
30,000 years
before present
20,000 years
before present
10,000 years
before present
Chatelperronian
Figure 30.2 Tool industries of the Upper Paleolithic: The
pace of change of tool technologies becomes almost hectic from
40,000 years onward. In addition, the tool industries themselves
take on a complexity and refinement unmatched in earlier periods.
A distinct sense of fashion and geographic variation is also well
developed.
Figure 30.3 Upper Paleolithic artifacts: These artifacts are
typically formed from retouched blades and are finer than Middle
Paleolithic tools. (top row, left to right) Burin on a truncated blade,
dihedral burin, gravette point, backed knife, backed bladelet,
strangulated blade, blade core. (bottom row, left to right) End scraper,
double end scraper, end scraper/dihedral burin, Solutrean laurel
leaf blade, Solutrean shouldered point, prismatic blade core. Scale
bar is 5 cm. (Courtesy of Roger Lewin and Bruce Bradley.)
As the Upper Paleolithic progressed, substantial temporal
and spatial variability of style developed in artifact assem-
blages; the sense of cultural traditions in the way we would
mean today was strongly present for the first time. Although
sculpting and engraving appeared from the Aurignacian
onward, evidence of cave painting did not become strong
until the Gravettian, some 30,000 years ago.
The contrast between the Middle Paleolithic in Europe
(specifically, the Mousterian) and the Upper Paleolithic is
striking. Although not every aspect of Upper Paleolithic
culture, especially technological advances and artistic tradi-
tions, was present from the beginning, overall it surely offers
evidence of a revolutionary change. Agreement on this latter
pointarevolution or notais divided, in terms of both its
dynamics and its explanation.
The match between archeological and fossil evidence in
Europe is quite good. For instance, wherever hominin
remains have been found with Mousterian assemblages, they
have been Neanderthal. Virtually all hominin fossils asso-
ciated with Upper Paleolithic assemblages have been modern
humans. Two exceptions to the latter generalization have
been identified, at the French sites of Arcy-sur-Cure and
Saint-Césaire. Although the fossil evidence at Arcy-sur-
Cure is fragmentary, a classic Neanderthal partial skeleton
has been found at Saint-Césaire. These sites are interest-
ing because the tool assemblages represent an intermedi-
ate form between Mousterian and Aurignacian, termed
Chatelperronian.
Some scholars have argued that the intermediate nature of
the Chatelperronian technology indicates the presence of a
population in biological transitionathat is, changing from
210
Part Seven: The Origin of Modern Humans
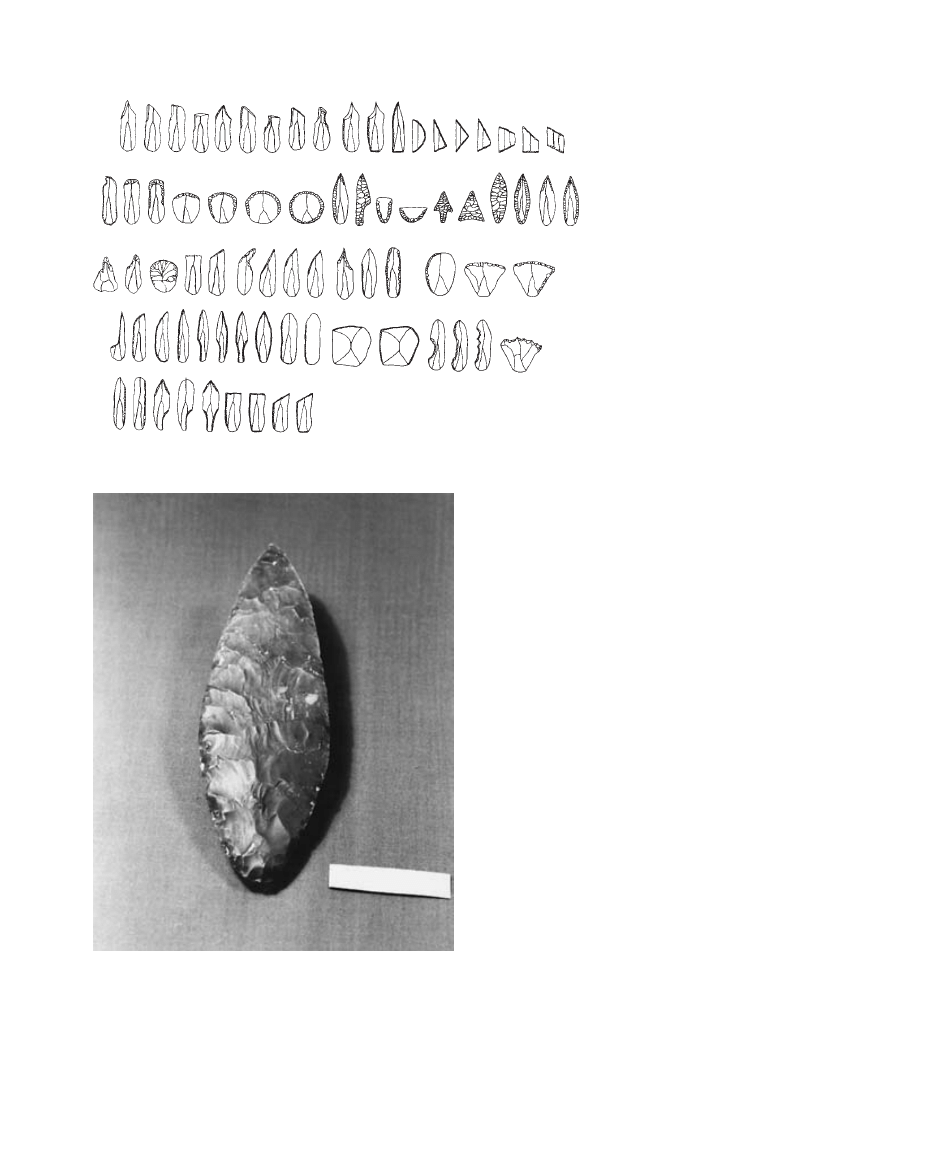
Figure 30.4 Upper Paleolithic range
of forms: The French archeologist G.
Laplace produced this typology of Upper
Paleolithic tools in the late 1950s and early
1960s. It forms the basis of all Upper
Paleolithic typologies. The intricacy as well
as the variety of production can be seen.
Figure 30.5 Solutrean laurel leaf blade: Some examples of
these blades are so thin as to be translucent. They were probably
used in rituals rather than in practical affairs. Scale bar is 5 cm.
(Courtesy of Roger Lewin and Bruce Bradley.)

human anatomy evolved long before modern behavior or
that the modernity of the Skhu¯l and Qafzeh remains has
been overstated. Recent analyses have implied that the two
populations used different hunting strategies, with modern
humans being more efficient.
Klein points out that the Skhu¯l/Qafzeh specimens are
extremely variable anatomically and that they possess some
archaic features, such as prominent brow ridges and large
teeth. “Both cranially and postcranially, they clearly make
far better ancestors for later modern humans than the
Neanderthals do,” he says. “However, it seems reasonable to
suppose that they were not yet fully modern biologicallya
perhaps, above all, neurologically.” Clark and Lindly’s read-
ing of the evidence differs from Klein’s interpretation, with
the duo arguing for continuity between the archaic and the
modern species, in both the fossils and the archeology.
The interpretation of eastern Asian evidence poses a chal-
lenge because of the scarcity of sites and uncertain dating.
There does appear to be a continuity of chopping-tool assem-
blages from Homo erectus times through approximately 10,000
years ago, with no dramatic shift equivalent to that seen in
the European Upper Paleolithic. One site in Sri Lanka,
Batadomba Iena cave, contains a microlithic tool assemblage
that has been radiocarbon dated at 28,500 years old. In addi-
tion, sites in Siberia, dated between 35,000 and 20,000 years
old, contain Upper Paleolithic-like artifacts and art objects,
suggesting a more European-like pattern. The migration
from Southeast Asia to Australia between 60,000 and 45,000
years ago implies the evolution of modern human behavior
by at least this date (see unit 34).
The Asian evidence is therefore equivocal at best, but
offers little to suggest the appearance of modern human
behavior early in the record.
African evidence
For the past two decades, the Middle Stone Age of Africa
has been viewed as equivalent to the Middle Paleolithic in
Europe, both chronologically and technologically. The pre-
vailing view of the Middle to Later Stone Age transition was
that it resembled the Middle to Upper Paleolithic transitiona
that is, it was revolutionary, reflecting the sudden appear-
ance of modern behavior. This view is now being questioned
by some prehistorians, particularly by Alison Brooks and
Sally McBrearty, of George Washington University and the
University of Connecticut, respectively.
Brooks and McBrearty point out that evidence of blade
production, such as that found in Ethiopia, dated at 180,000
years ago, and South Africa (the Howieson’s Poort industry),
dated at 80,000 years ago, has been assigned too little import-
ance. Recently, McBrearty has reported blade production at
a site in central Kenya (the Kapthurin formation), which is
some 240,000 years old. These tools are 125,000 years older
Neanderthal to modern humans. The anatomy of the Saint-
Césaire individual shows no such characteristics, however
(see unit 27). The age of the skeleton, recently dated at
36,000 years, leaves little or no time for an evolutionary
transition to local modern human populations. In any
case, the site postdates the earliest Aurignacian sites, which
have no local precursors. One possible explanation of the
Chatelperronian is that it was developed by late Neanderthal
populations that had cultural contact with incoming modern
human populations.
Although no consensus has been reached on the meaning
of the European archeological evidence, a strong case can be
made for its support of revolutionary change as a result of
population replacement. It does not, however, address the
issue of the origin of modern humans.
Asian evidence
The archeological evidence in Asia is open to even more
diverse interpretation than in Europe, partly because the
data are fewer and partly because some apparent paradoxes
exist. Great differences are also noted between western Asia
and eastern Asia, where the evidence is sparsest of all.
Western Asia, which includes the Middle East, is closely
allied to Africa geographically and provides a natural migra-
tion route out of Africa. Between 200,000 and 50,000 years
ago, this region was variously occupied by Neanderthal and
early modern humans, while the Far East was inhabited by
populations that were neither Neanderthal nor modern.
The archeological transition from archaic to modern in the
Middle East is typologically very similar to the Mousterian to
Upper Paleolithic transition in Europe, and apparently occurs
about the same time (40,000 years ago). If the transition
tracks the migration of modern humans out of Africa, through
the Middle East, and finally into western Europe, then the
evidence for it in the Middle East might be expected to pre-
date the evidence gleaned further west. Tentative confirma-
tion of this movement might come from the site of Boker
Tachtit in Israel, which dates to between 47,000 and 38,000
years ago. Evidence of Upper Paleolithic human remains in
the Middle East is scarce, but is essentially that of modern
humans.
Where western Asia differs from Europe is in the occur-
rence of anatomically modern humans with classic Mouster-
ian assemblages, at the Israeli sites of Skhu¯l and Qafzeh (see
unit 28), which have been dated to approximately 100,000
years. These fossil remains are either equal in age to or pre-
date Neanderthals of the region, and thus would seem to pre-
clude an evolutionary transformation of Neanderthals into
modern humans. Nevertheless, the occurrence of modern
human anatomy with Mousterian assemblages some 60,000
years before Upper Paleolithic assemblages appear in the
region represents a puzzle. It implies either that modern
30: Archeological Evidence
211
processing pigments have been found in many regions of
Africa, dating from at least 80,000 years ago. If such pigments
were used for body decoration, for example, rather than
treating hide, it would be significant in the context of the cur-
rent question. It is impossible to prove which of these possib-
ilities is correct, however. Evidence of personal adornment,
such as ostrich eggshell beads, appears in the record relat-
ively late, about 60,000 years ago. Are these artifacts to be
taken as evidence of absence of early symbolic behavior that
is so often considered as reflecting the modern human mind
at work? Not necessarily so, argues Brooks, given the very
unfavorable conditions of preservation in the African envir-
onment and the paucity of sites investigated.
Recent discoveries at the Blombos Cave, South Africa,
however, indicate that modern humans there were produc-
ing symbolic objects 77,000 years ago, or more than twice as
long ago as in Europe. Christopher Henshilwood, of the Iziko
Museum in Cape Town, and his colleagues reported in early
2002 the discovery of pieces of ochre that are inscribed with
criss-crossed triangles and horizontal lines. The researchers
interpret these markings to be notations of the sort that are
seen in the European Upper Paleolithic. Moreover, Alison
Brooks and her colleagues have discovered harpoonlike
points and worked bone in Zaire, dated to at least 80,000
years. Again, these are typical of what is found in the Euro-
pean Upper Paleolithic. (See figure 30.6.)
For an increasing number of archeologists, these separate
lines of evidence tell us something about a gradual emer-
gence of modern human behavior. Once it passed a certain
threshold, that behavior appears to have exploded, produc-
ing the rich fabric of social complexity associated with the
212
Part Seven: The Origin of Modern Humans
than the oldest known blades from the European Middle
Paleolithic and more than 200,000 years older than those
from the European Upper Paleolithic. If the production of
such blades represents a signature for modern human beha-
vior, then evidence of this behavior clearly has a long history.
One explanation for this production could be that the
earlier blades were made by a less sophisticated technique.
According to this theory, by themselves the blades do not
constitute an unequivocal signal of modern human beha-
vior. Instead, other behaviors must be considered as well,
such as production of tools made from materials other than
stone, artistic behavior, and other complex social behavior,
such as long-distance trade or exchange of objects.
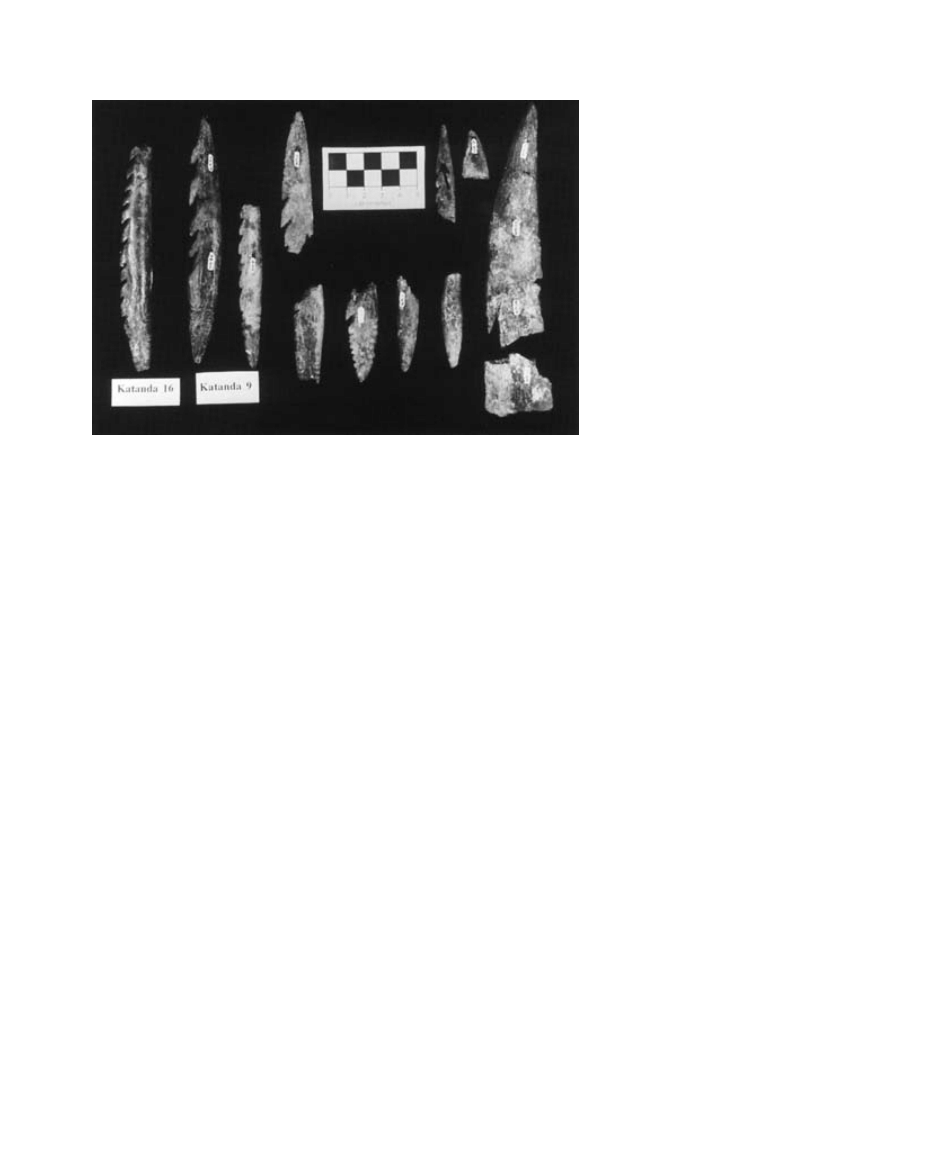
For instance, tools made from bone are common in the
Upper Paleolithic, but are almost unknown earlier. A striking
exception is a collection of barbed bone points (like harpoon
heads) found at the Katanda site in eastern Zaire, and
reported by Brooks and her colleagues in 1995. These arti-
facts have been dated by thermoluminescence and electron
spin resonance techniques at between 90,000 and 160,000
years old, or 135,000 years older than the previously oldest
known artifacts of this kind. This discovery has encouraged
archeologists to reconsider claims for other bone tools at
several Middle Stone Age sites, though none is said to be as
old as those found at Katanda.
Nothing discovered in Africa has matched the artistic
expression for which the Upper Paleolithic of western
Europe is so famous. The oldest, reliably dated rock painting
in Africa appears in the Apollo cave, Namibia, dated at
27,000 years, which is equivalent to the oldest examples of
art in Europe. In contrast, pigments and grinding stones for
Figure 30.6 Middle Stone Age bone
tools: Discovered recently in Zaire, these
harpoonlike bone points are the earliest
known examples of worked bone, dated
at between 90,000 and 160,000 years
old. (Courtesy of Alison Brooks and
John Yellen.)
Hypotheses tested
As a test of competing hypothesesathe “out of Africa” and
multiregional evolution hypothesesathe archeological evid-
ence is equivocal, and certainly not as strong as the anatom-
ical and genetic evidence. Nevertheless, it can be argued that
a signal of modernity appears first in Africa, representing a
chronological precursor of what later appears in Eurasia. The
appearance of modern cultural activities in Europe seems to
coincide with the first appearance of anatomically modern
Upper Paleolithic and Later Stone Age. That explosion was a
cultural change, however, not a biological one. By contrast,
Klein and others have argued that only with a critical biolo-
gical changeasuch as facilitation of linguistic abilityadid
modern human behavior become possible; they define
modern human behavior as including the ability to produce
the entire range of activities, not just one of them at different
times and different places. Undoubtedly this issue will con-
tinue to inspire debate for some time to come. (See figure
30.7.)
30: Archeological Evidence
213
Europe
O-isotope
stages and
climate
stratigraphy
10
20
30
40
50
60
70
80
90
100
110
120
130
10
20
30
40
50
60
70
80
90
100
110
120
130
190
Western
Asia
Eastern
Asia
Africa
Mousterian and
Neanderthal
Mousterian and
Neanderthal
Flake/chopper industry
and archaic
H. sapiens
Howieson's Poort,
Aterian, and early
modern H. sapiens
Mousterian and
Neanderthal
Mousterian and
early modern
H. sapiens
Middle Stone Age/
Mousterian and
early modern
H. sapiens
Mousterian
and ???
Middle Stone Age/
Mousterian and ?
early modern
H. sapiens
Aurignacian and
modern H. sapiens
Later Upper
Paleolithic
Upper Paleolithic
and modern
Upper and "Epi-"
Paleolithic
Modern H. sapiens
???
???
???
???
???
???
"Late Paleolithic"
Modern H. sapiens
Later Stone
Age and
Upper Paleolithic
Neolithic, etc.
Mesolithic
Neolithic, etc.
Chatelperronian and
Neanderthal
H. sapiens
Acheulean,
etc.
Acheulean,
etc.
Neolithic, etc.
Neolithic,
etc.
Y
ears ag
o
(x 1000)
Y
ears ag
o
(x 1000)
1
2
3
4
5a
5b
5c
5d
5e
P
e
n
ultimate
glaciation
Last interglaciation
Last glaciation
Holocene
6
190
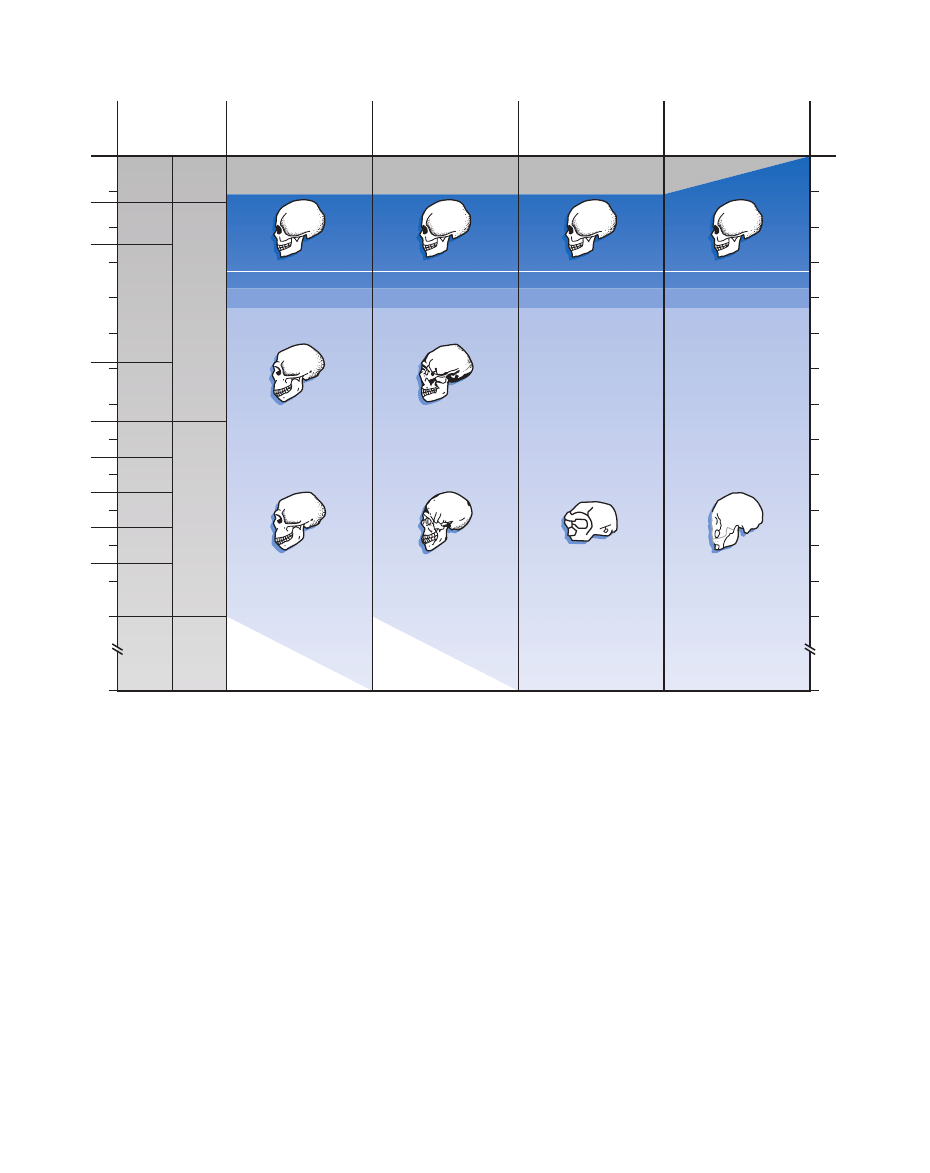
Figure 30.7 Continents compared: The picture of modern
human origins derived from archeological evidence is at best
incomplete. In Europe, where the evidence is most plentiful, the
picture is quite sharp, showing a sharp transition approximately
40,000 years ago that reflects the inward migration of anatomically
modern humans carrying modern cultural behavior. In Asia, the
picture is less clear. In Africa, new evidence suggests that modern
human behavior begins to appear early in the Middle Stone Age,
congruent with the early appearance of anatomically modern
humans in that continent. (Courtesy of Richard Klein/Evolutionary
Anthropology.)

Foley RA, Lahr MM. Mode 3 technologies and the evolution of mod-
ern humans. Cambridge J Archeol 1997;7:3 –32.
Harrold FB. Mousterian, Chatelperronian, and early Aurignacian:
continuity or discontinuity? In: Mellars P, Stringer CB, eds. The
human revolution. New Haven: Princeton University Press,
1989:677–713.
Henshilwood CS, et al. Emergence of modern human behavior:
Middle Stone Age engraving from South Africa. Science
2002;295:1278 –1280.
Klein RG. The archeology of modern humans. Evol Anthropol
1992;1:5 –14.
———. Anatomy, behavior, and modern human origins. J World
Prehistory 1995;9:167–198.
Lieberman DE, Sea JJ. Behavioral differences between archaic and
modern humans in the Levantine Mousterian. Am Anthropol
1994;96:300 –332.
McBrearty S, Brooks SB. The revolution that wasn’t: a new interpre-
tation of the evolution of modern human behavior. J Human Evol
2000;39:453 –563.
Mellars P. Major issues in the emergence of modern humans. Curr
Anthropol 1989;30:349 –385.
Straus LB. The Upper Paleolithic of Europe: an overview. Evol
Anthropol 1995;4:4 –16.
Thieme H. Lower Pleistocene hunting spears from Germany. Nature
1997;385:807– 810.
Yellen JE, et al. A Middle Stone Age worked bone industry from
Katanda, Upper Semliki Valley, Zaire. Science 1995;268:553 –556.
214
Part Seven: The Origin of Modern Humans
humans thereaa culture brought by migrants, not developed
locally. Thus, the “out of Africa” model is more strongly sup-
ported than the multiregional evolution model.
KEY QUESTIONS
• Which model of modern human origins does the present archeo-
logical evidence most strongly support?
• Under what circumstances might the Chatelperronian industry
have arisen?
• Is it reasonable to assume a tight coupling between modern mor-
phology and modern behavior?
• What kind of archeological evidence would be most valuable in
addressing the question of the tempo and mode of the origin of
modern humans?
KEY REFERENCES
Brooks AS. Behavior and human evolution. In: Meikle WE, et al.,
eds. Contemporary issues in human evolution. San Francisco:
California Academy of Sciences, Memoir 21, 1996.
Clark GA, Lindly JM. The case for continuity: observations on the
biocultural transition in Europe and western Asia. In: Mellars P,
Stringer CB, eds. The human revolution. New Haven: Princeton
University Press, 1989:626 – 676.
D’Errico F. The invisible frontier: A multiple species model for the
origin of behavioral modernity. Evol Anthropol 2003;12:188 –202.
Wyszukiwarka
Podobne podstrony:
30 rozdzial 29 r7vsk3gxbnas2q7g Nieznany (2)
29 30 ROZ w spr wzorow i spo Nieznany (2)
wyklad 29 i 30 tech bad
DGP 2014 12 29 rachunkowosc i a Nieznany
Mikrokontrolery F Marecki id 30 Nieznany
nauki human w med id 315728 Nieznany
29 30
ML5 Statecznosc statyczna id 30 Nieznany
29 30
29,30
Ćwiczenie 29 30, teoria 30, Gorzycka Marzena
27,28,29,30
29 30
sem6 testy(29,30,31)
opracowania 2010 (pytania które będą 1, 8, 9, 14, 22, 23, 24, 28, 29, 30 )
29 30
więcej podobnych podstron