ANALIZA STRUKTURY - MIARY KLASYCZNE
Szereg szczegółowy |
Szereg punktowy |
Szereg przedziałowy |
|
Średnia arytmetyczna |
|||
|
|
|
|
Dominanta |
|||
|
|||
Mediana |
|||
n - nieparzyste
n - parzyste
|
n - nieparzyste
n - parzyste
|
|
|
WARIANCJA |
|||
s2 = |
s2 = |
s2 = |
|
ODCHYLENIE STANDARDOWE |
|||
s = |
|||
WSPÓŁCZYNNIK ZMIENNOŚCI |
|||
Vs = |
|||
TYPOWY OBSZAR ZMIENNOŚCI |
|||
|
|||
Miary asymetrii |
|||
|
|||
Miary KONCENTRACJI |
|||
|
|||
współczynnik klasyczno - pozycyjny asymetrii |
|||
|
|
|
|
ANALIZA STRUKTURY - MIARY POZYCYJNE
dominanta |
D = xD + |
|
|
M =
|
M = |
kwartyl 1 |
|
Q1 = |
kwartyl 3 |
|
Q3 = |
Pozycyjne miary zmienności |
||
rozstęp |
R = Xmax - Xmin |
|
odchylenie ćwiartkowe |
Q = |
|
typowy obszar zmienności |
M - Q < Xtyp < M + Q |
|
współczynniki zmienności |
VQ =
|
|
Pozycyjne miary asymetrii |
||
|
As =
|
|
![]()
![]()
![]()
![]()
![]()
2![]()
= 3 M - D
Indeksy indywidualne
Jednopodstawowe |
Łańcuchowe |
|
|
Zależność między indeksami indywidualnymi i przyrostami względnymi
Jednopodstawowe |
Łańcuchowe |
|
|
Zamiana indeksów indywidualnych
łańcuchowe na jednopodstawowe |
|
jednopodstawowe na łańcuchowe |
|
zmiana roku bazowego |
|||
- |
|
|
1,0 |
- |
|
1,0 |
|
|
|
|
|
|
|
|
|
|
1,0 |
|
|
|
|
|
1,0 |
|
|
|
|
|
|
|
|
|
|
|
|
|
|
|
|
|
|
|
|
|
|
|
|
Średni przyrost absolutny i średnie tempo zmian
|
AGREGATOWE INDEKSY DYNAMIKI |
||
agregatowy indeks cen formuły Laspeyresa |
agregatowy indeks ilości formuły Laspeyresa |
agregatowy indeks wartości |
|
|
|
|
agregatowy indeks ilości formuły Paaschego
|
|
|
|
|
|
|
indeksy Fischera |
w = ![]()
wn = ![]()
wo = ![]()
![]()
ANALIZA WSPÓŁZALEŻNOŚCI
współczynnik korelacji rang Spearmana |
rs = 1 - |
||
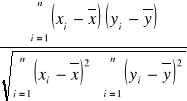
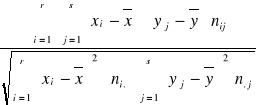
współczynnik korelacji Pearsona |
rxy =
|
rxy =
|
|
II. TRENDY I SEZONOWOŚĆ
-
-
D
x
n
n
2 n
n
n
c
o
D
D
D
1
D
D
1
D
1
D
M
M
1
sk
M
o
c
n
n
2
n
x
M
Równość indeksowa
Wyszukiwarka


