
Faculty of Economics and Business Administration
Development and Management of
Green
in European Cities:
A Comparative Analysis
Research Memorandum
Tuzin Baycan-Levent
Eveline van Leeuwen
Caroline Rodenburg
Peter
vrije Universiteit
Development and Management of Green
in European Cities:
A Comparative Analysis’
Tuzin
Eveline van Leeuwen
Caroline Rodenburg
Peter Nijkamp
of
Economics
Free
Amsterdam
De
1105
1081 HV Amsterdam
email:
Abstract
T h e p r o v i s i o n , d e s i g n , m a n a g e m e n t a n d p r o t e c t i o n o f u r b a n g r e e n
a r e a t t h e t o p o f t h e
agenda of “sustainability” and “liveability” of
settlements for improving the quality of
environments. Quality of urban green
is a key factor in
cities
and viable
to live in. Urban green
play an important role in improving the
liveability of towns and cities. The present paper considers urban green
as an
i m p o r t a n t c o n t r i b u t i o n t o a s u s t a i n a b l e d e v e l o p m e n t o f c i t i e s .
F r o m t h i s p e r s p e c t i v e , t h i s p a p e r
aims to investigate and
the present
and availability of urban green
in
various European cities.
The
results of a multidimensional factor enalysis and a spider model
applied to a database gathered by
of extensive survey questionnaires show interesting
links and
between and in European cities. Factor analysis shows that the availability
of
green”
is relatively high in metropoles and big cities, whereas the availebility of
green”
is relatively high in medium sized and
cities. On the other hand, spider
models show that the availability of green
per inhabitant is
in
and
m e d i u m - s i z e d c i t i e s t h a n i n m e t r o p o l e s a n d b i g c i t i e s . T h i s
f r a m e w o r k s h o w s t h a t
the
conditions
in terms of the green
available to the inhabitants are
more problematic
f o r m e t r o p o l e s a n d b i g c i t i e s .
Paper presentad at
38’”
Planning Congress on ‘The Pulsar Effect” Planning with Peaks,
Greece, September 21-26, 2002.
is
with
of Urban and Regional
Technical Univarsity, e-mail:
Introduction
In the history of urban developments urban planners have tried to create urban
that
elements from
1971). Several models, some utopian,
influence “green city” advocates. Charles Fourier’s fantasy
called ‘phalansteries’,
Callebach’s novel ‘Ecotopia’ and the most famous Ebenezer Howard’s ‘Garden City’
h a d a m a j o r i n f l u e n c e o n g r e e n c i t y a d v o c a t e s ( R o e l o f s , 1 9 9 9 ) . T h i s i n t e r e s t i n g r e e n i n g c i t i e s
h a s i n c r e a s e d w i t h t h e c o n c e p t o f “ s u s t a i n a b l e d e v e l o p m e n t ” w h i c h i s d e v e l o p e d i n t h e r e p o r t
called “Our Common Future” (Brundtland Report) published by the World Commission on
Environment and Development in 1987 (WCED, 1987). The concept of sustainability has
become an important paradigm in urban planning since a high proportion of the world’s
production, consumption and waste generation is
in cities. Therefore, a
concern for quality of life and sustainability, with a particular focus on the city, has emerged.
S o c i e t i e s h a v e b e c o m e c o n c e r n e d w i t h t h e b u i l t e n v i r o n m e n t a n d w i t h s h a p i n g
i n u r b a n
and this has led to
landscape patterns in the countryside and to the creation of
parks and gardens in urban
(Goede et al., 2001). Today, development and
management of urban green
are at the top of the agenda of sustainability.
urban green
are under a permanent pressure on the one hand, and the potential of
green
is not always being realised, as current management
are sometimes
sub-optimal on the other hand. Therefore, it is of
to create an analytical
and
framework for
the
of green
in cities.
T h i s p a p e r i s p a r t o f t h e p r o j e c t “ D e v e l o p m e n t o f U r b a n G r e e n
t o I m p r o v e t h e Q u a l i t y
of Life in Cities and Urban Regions” (URGE’) and considers urban green
as an
important contribution to a sustainable development of cities. The URGE project aims to
develop interdisciplinary
for scientists as well as for planners
over Europe for the
planning and management of urban green
The
question of the project is
urban green
(both in a qualitative and a quantitative sense)
be developed from
ecological,
and planning perspectives, and which tools and instruments are
h e l p f u l i n t h i s r e s p e c t . T h e p r o j e c t i n c l u d e s t h e e l a b o r a t i o n a n d t e s t i n g o f a n i n t e r d i s c i p l i n a r y
of methods and measures, based on experience from various European cities. This
of methods will be validated by comparing case studies in several European
“partner cities” and various European
cities”. The knowledge gained
be used
to improve existing green
and to optimise urban green
in Europe (URGE,
2 0 0 2 ) .
This study analyses several European cities, including reference cities, in order to obtain
and policy relevant information on the key features of urban green. We
the present
and availability of urban green
in these European cities by
of
factor-analytic methods and the so-called spider model. In the next
we wilt describe
“urban green” from a conceptual perspective and
the
of urban green for
the quality of urban
In Seotion 3 we
give a description of our study and the data
obtained from the extensive survey questionnaires and
and evaluate the present
and availability of urban green
based on the application of a factor-analytic
method and a spider model. In the
we will
the policy
for the
d e v e l o p m e n t a n d m a n a g e m e n t o f u r b a n g r e e n
This project is funded under
4 ‘The City of Tomorrow and
of the Programme
Environment and Sustainable Development” of the 5th Framework Programme of the European
2
2 .
Urban Green
and
for
of Life
Since this paper is related to the URGE project, the definition of urban green space that is
used here is
to the one that is used within the URGE project, and has been
formulated by ecologists, economists, social scientists and planners. They agreed on the
f o l l o w i n g d e f i n i t i o n :
urban green
we understand public and
open
in urban
by vegetation,
are
(e.g., active or passive recreation)
(e.g., positive
on
urban environment)
for
users.
Urban green
play a key role in improving the liveability of our towns and cities. The
q u a l i t y a n d v i a b i l i t y o f c i t i e s l a r g e l y
o n t h e d e s i g n , m a n a g e m e n t a n d m a i n t e n a n c e o f
g r e e n a s w e l l a s o p e n a n d p u b l i c
i n o r d e r t o f u l f i l t h e i r r o l e a s a n i m p o r t a n t s o c i a l a n d
visual focus. Urban green
are not only an important component in housing
but
i n b u s i n e s s , l e i s u r e , r e t a i l a n d o t h e r c o m m e r c i a l d e v e l o p m e n t s .
The quality of green
helps to
the identity of towns and cities, which
enhance their attractiveness for living, working, investment and tourism. Therefore,
positively to the competitiveness of cities. From a social
types of green space
offer a bigger diversity of land uses and opportunities for a wide
range of activities, help to foster active lifestyles, and
be of
to health.
managed and maintained green
to social
by creating opportunities
for people of
ages to interact (Scottish
2001). Urban green
emphasise
the diversity of urban
by reflecting the different communities they serve and meeting
their varying
They enhance cultural life by providing venues for local festivals, civic
celebrations and theatrical performances. Urban green
safe play space for
children
1961,
in Haughton and
to children’s physical,
a n d s o c i a l d e v e l o p m e n t ( H a r t , 1 9 9 7 ) a n d p l a y a n i m p o r t a n t r o l e i n t h e
e d u c a t i o n
of schoolchiidren with
to the environment and
From a planning
a
n e t w o r k o f h i g h q u a l i t y g r e e n
l i n k i n g r e s i d e n t i a l
w i t h b u s i n e s s , r e t a i l a n d l e i s u r e
developments
help to improve the accessibility and attractiveness of local facilities and
employment
networks of green
help to
people to
travel safely by foot or by bicycle for recreation or commuting (Scottish
2001).
Furthermore,
urban green
a barrier to noise and
function as
a visual screen (Dole, 1989,
in Haughton and
1994). From an
a green space might deliver
as wood or fruits and
compost
and energy as a
of urban green production. Their presence
an increase in
the
value of an area and
new jobs. From an
urban green
moderate the impact of
activities by, for example, absorbing
pollutants and releasing oxygen (Hough, 1984,
in Haughton and
to the maintenance of a healthy urban environment by providing clean air, water
and soil (De Groot,
improve the urban climate and maintain the balance of the city’s
urban environment
and Bourdeau, 1995). They
the
and
heritage by providing habitats for a diversity of urban wildlife and
a
diversity of urban resources. Despite the
benefits that urban green
there is a serious
of information about the quantity and quality of urban green
w i t h t h e n e w i n t e g r a t e d a p p r o a c h e s t o c o m b i n e
p l a n n i n g f o r g r e e n
w i t h i n n o v a t i v e d e s i g n a n d d e l i v e t y a n d t h e a c t i v e i n v o l v e m e n t o f t h e c o m m u n i t y a t
stages,
urban green
be part of an ‘urban
2001).
3
3. A Comparative Framework for Urban Green
A Case Study on European
Cities
This paper aims to
the present
and availability of urban green
in
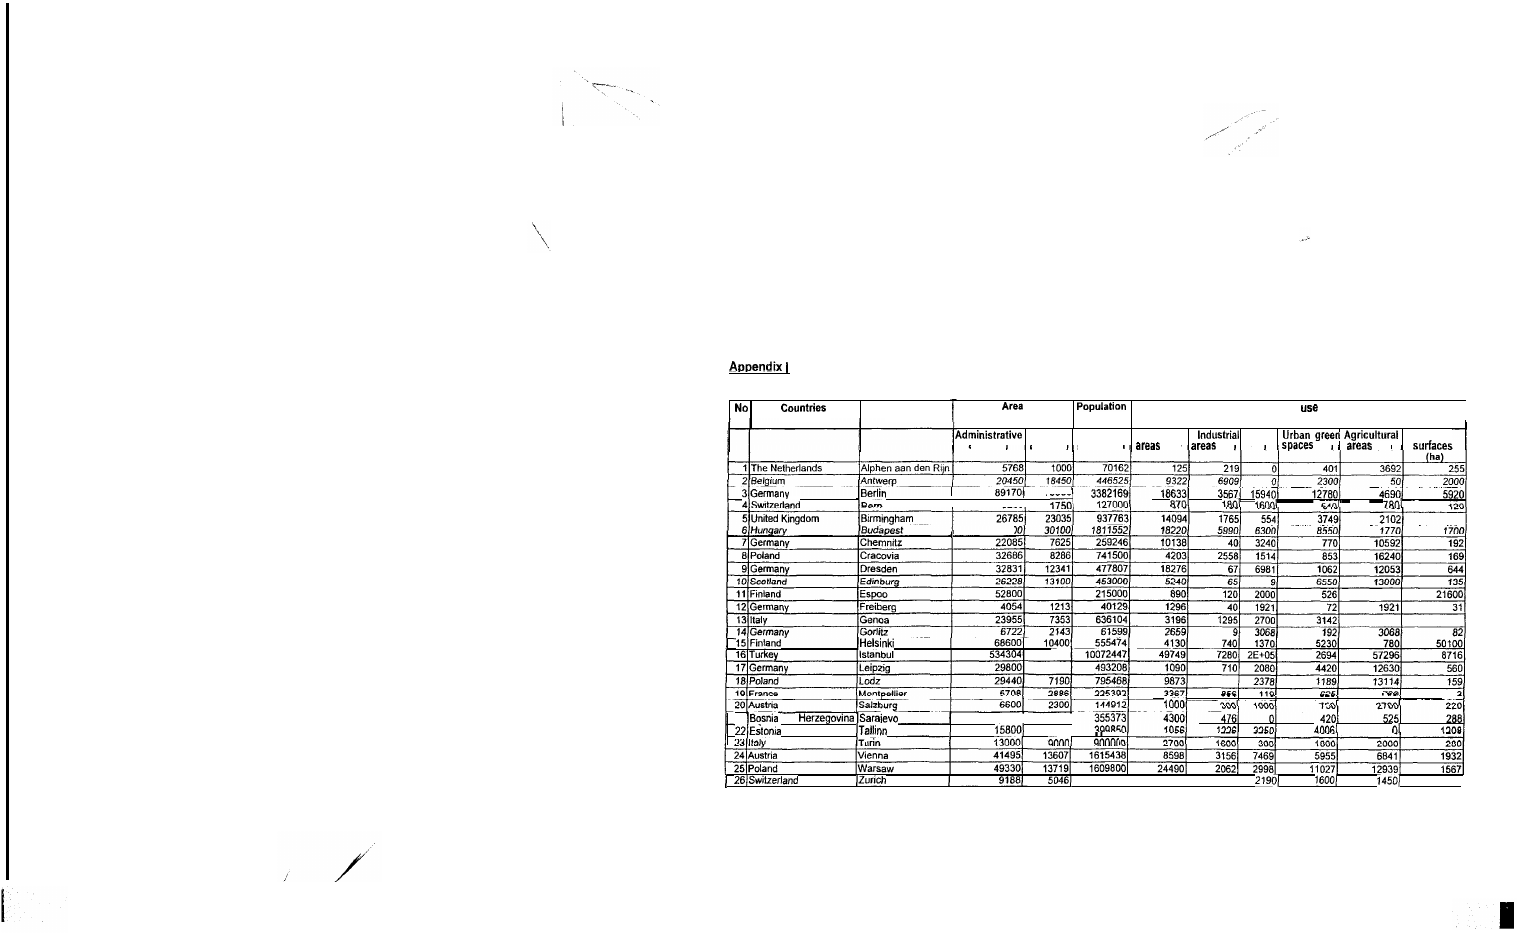
various European cities. The sample contains 26 cities from 15 countries that aim to share
their experience in innovative green
and strategies. The data and information
used for comparison and evaluation are based on extensive survey questionnaires filled
by experts of relevant city departments (see Appendix For the data concerning land use
and population, factor
methods and spider models are applied to show interesting
l i n k s a n d p a t t e r n s i n E u r o p e a n c i t i e s .
3.1. Land use and urban green
in European cities : A factor-analytic approach
Factor Analysis is a multivariate statistical technique that
be used to analyse
i n t e r r e l a t i o n s h i p s b e t w e e n a l a r g e n u m b e r o f v a r i a b l e s a n d t o e x p l a i n t h e s e v a r i a b l e s i n t e r m s
of their common underlying dimensions. The
is
find a way of condensing the
information
in a large number of original variables into a smaller set of
or
with a minimum loss of information. With help of factor analysis, separate
dimensions of the
be identified and the extent to which
variable is
explained by
dimension
be determined. Factor Analysis is an interdependence
technique in which
variables are considered as
relates to others, and the concept
of the
the linear
of variables, is employed (Hair et al. 1998). In this paper
we use
component
which transforms the set of originally
correlated variables into a new set of independent variables. is a non-stochastic approach
and it only deals with the common
of the original variables. first derives the first
factor or the
component, which is supposed to account for the greatest part of
the common
The
factor is supposed to account for the next greatest part of
the common
and so on. A minimum part of the common
is set, and
b e l o w t h i s c r i t i c a l
a r e e l i m i n a t e d .
For this factor analysis,
groups of data were used. One group contains data concerning
land use”
as residential
or industrial
whereas the
group
contains data concerning “green land use”
as urban green
or (urban) forests. For
t h e e v a l u a t i o n o f t h e r e s u l t s o f t h e f a c t o r a n a l y s i s , o u r 2 6 c i t i e s w e r e d i v i d e d i n t o f o u r g r o u p s :
M e t r o p o l e s
B i g C i t i e s
M e d i u m - S i z e d C i t i e s ( 1 2 ) a n d
C i t i e s ( 3 ) a c c o r d i n g t o t h e i r
p o p u l a t i o n
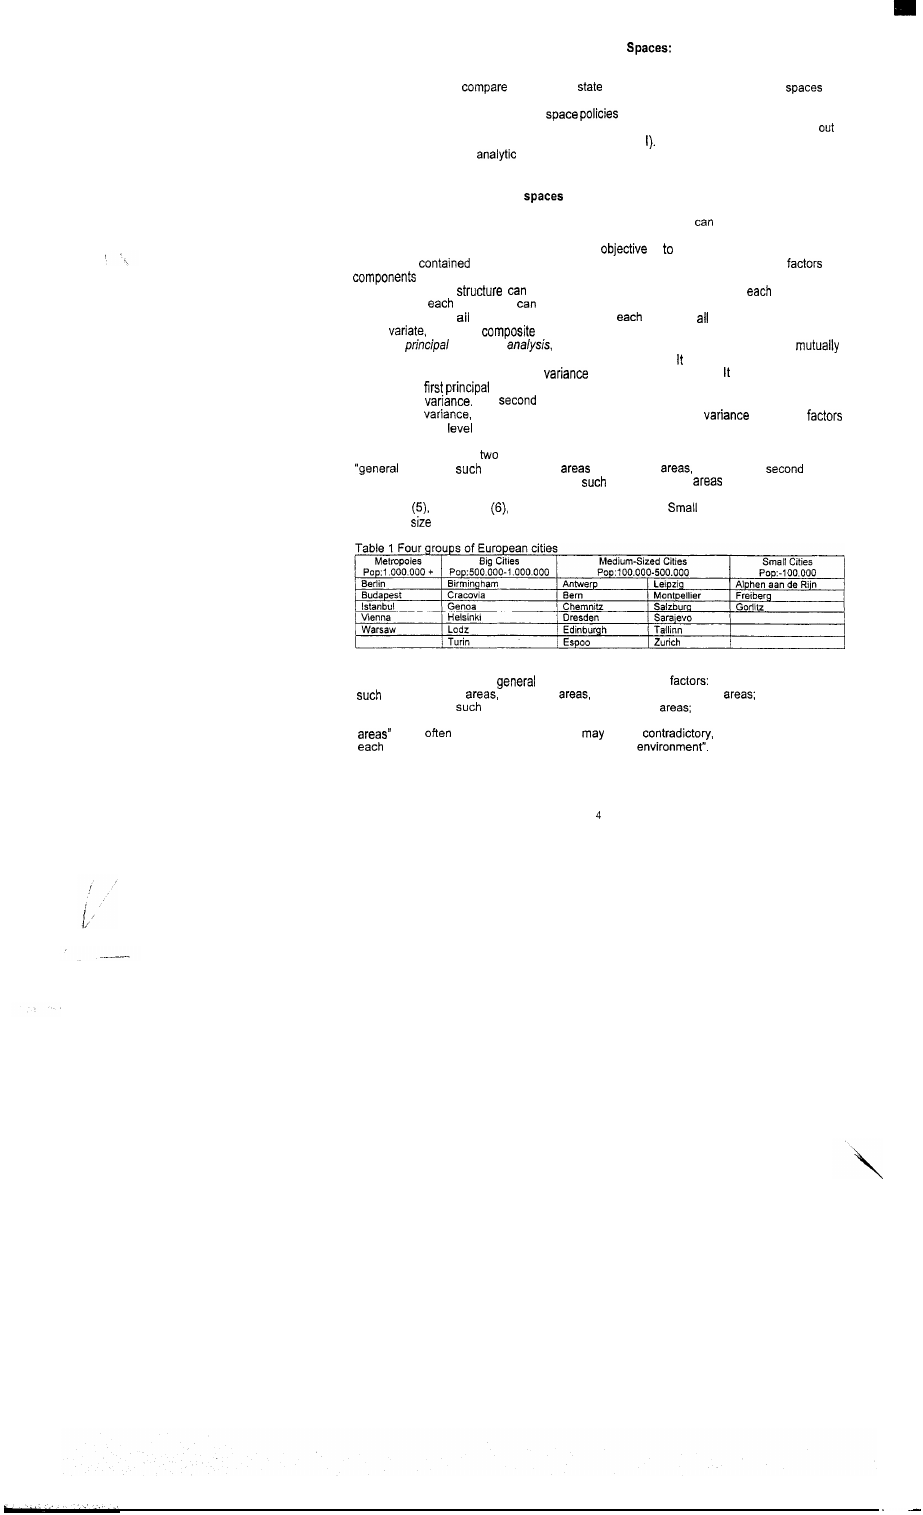
( s e e T a b l e 1 ) .
T o p e r f o r m t h e f a c t o r a n a l y s i s , s e v e n t y p e s o f l a n d u s e w e r e d i s t i n g u i s h e d ( s e e T a b l e 2 ) . T h e
factor analysis concerning
land use identified three
(1) “Mixed Land Use” (X),
as residential
industrial
forest and agricultural
(2) “Man Made
Environment” (M),
as built-up area and urban green
and (3) “Water” (W). Several
factor analyses have been performed, showing that the variables “urban green” and “built-up
were
grouped together. This
sound
but they are related to
other since both of them describe “man-made
The city scores show that
especially metropoles have a high score on man-made environmenf. The other city groups
s h o w h i g h s c o r e s f o r m i x e d l a n d u s e o r w a t e r ( s e e T a b l e 3 ) .
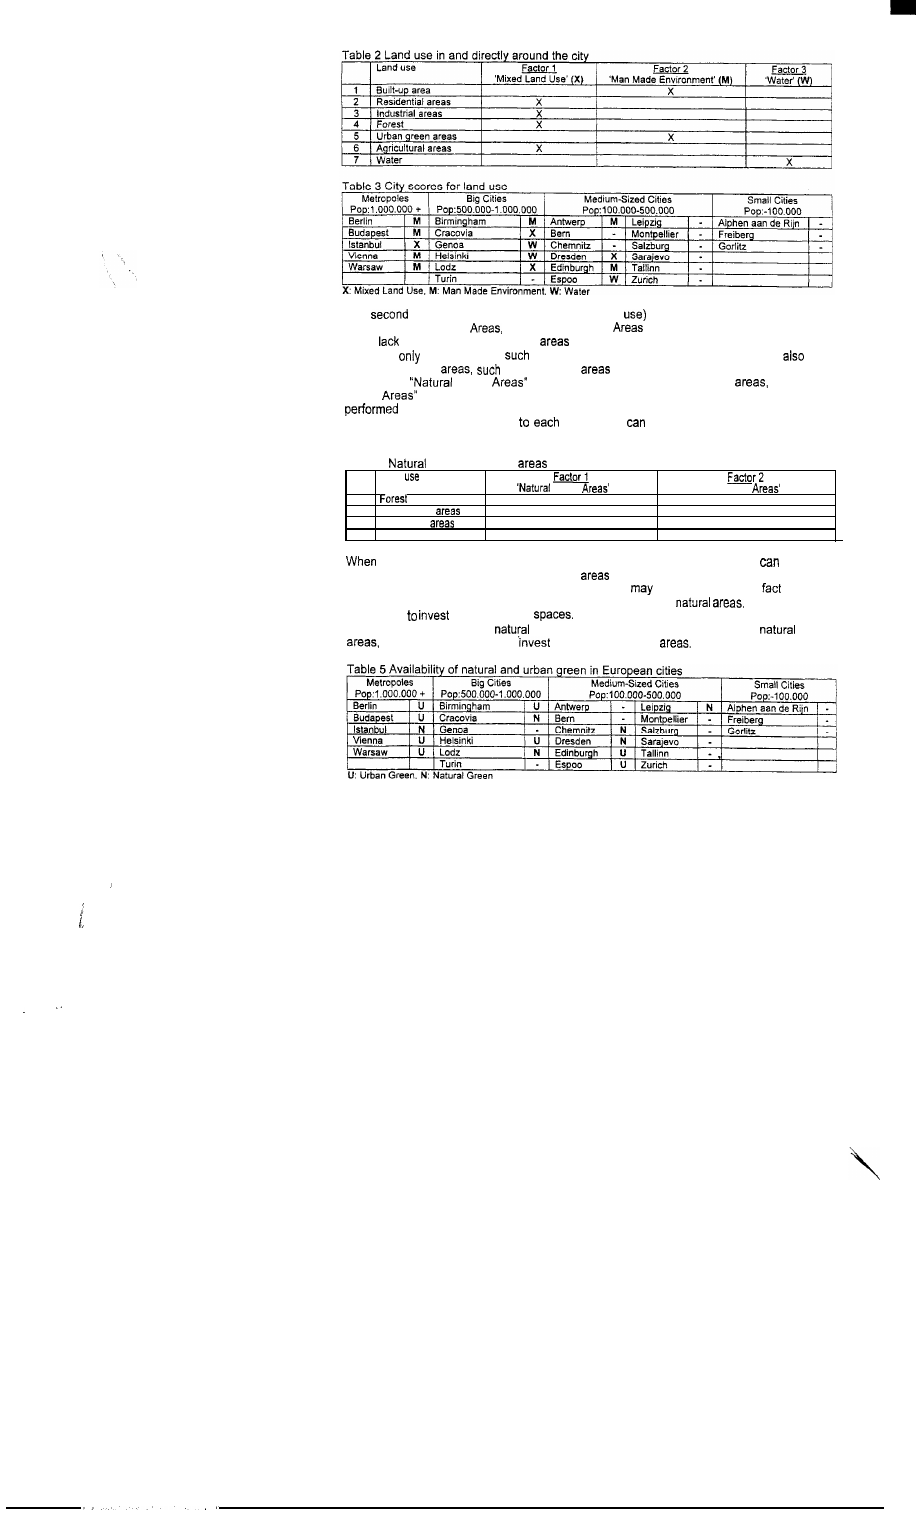
The
factor analysis (concerning green land
was performed for four groups of
variables: Urban Green
Forests, Agricultural
and Water (see Table 4). Because
of the
of detailed data on green
and in order to evaluate the green image of the
cities, not
green land
use
as forest and urban green have been used,
but
the
o t h e r n o n b u i l t - u p
a s a g r i c u l t u r a l
a n d w a t e r s u r f a c e s . T h e a n a l y s i s i d e n t i f i e d
two factors:
Green
(N), containing forest and agricultural
and “Urban
Green
(U), containing urban green and water. Several factor analyses that have been
with variables describing green land use showed that the variables urban green
and water were clearly related
other. This
be explained by the recreational
f a c i l i t i e s t h a t b o t h t y p e s o f l a n d u s e o f f e r .
T a b l e 4
a n d u r b a n g r e e n
Land
Green
(N)
1
X
2
Urban green
3
Agricultural
X
4
W a t e r
‘Urban Green
(U)
X
X
the factors are compared with the scores per city, some conclusions
be drawn
about
t h e c i t i e s a n d t h e a v a i l a b i l i t y o f g r e e n
( s e e T a b l e 5 ) . T h e m e t r o p o l e s a n d t h e b i g
c i t i e s h a v e a h i g h s c o r e o n t h e u r b a n g r e e n f a c t o r . T h i s
b e e x p l a i n e d b y t h e
t h a t t h e y
are older cities with high population densities or by the loss of
Therefore, these
cities have
in urban green
On the other hand, medium-sized cities have a
relatively high score on the
green factor. Because of the availability of
green
m e d i u m - s i z e d c i t i e s m i g h t
l e s s i n u r b a n g r e e n
5
!
The results of the factor analysis for the availability of urban green
in European cities
show
similarities with the results of a case study research on Dutch cities (van Leeuwen
et al., 2002). This study shows that big Dutch cities have a high score in terms of the urban
recreation factor, whereas new cities have
scores on the daily leisure factor, and
peripheral cities show high scores on the
recreation
The (similar)
results of these
studies
the attention towards big cities. Although the availability of
urban green
is
in big cities than in medium-sized and
cities, it does not
that this
of green space is enough to facilitate inhabitants and a high urban
q u a l i t y o f l i f e . F o r a c l e a r e r p i c t u r e o f t h e a v a i l a b i l i t y o f u r b a n g r e e n
f u r t h e r i n f o r m a t i o n
a n d e m p i r i c a l t e s t i n g a r e r e q u i r e d , e s p e c i a l l y f o r m e t r o p o l e s a n d b i g c i t i e s .
3.2. Availability of urban green
in European cities: A spider model
Urban green
serve as either signposts for
or as quantified tools for
a n a l y s i s . A s a n a n a l y t i c a l t o o l f o r o u r
a n a l y s i s i n t e r m s o f t h e u s a b l e
public urban green space available to the inhabitants, we employed the so-called spider
model (see Rienstra, 1998). Spider models
be used visualise the relative strengths and
weaknesses of the
case studies or different
for various
factor is represented by an axis
from the interior towards the outer boundary of
the spider, in which the lowest scores are to be found in the
of the spider. The score of
factor is based on quantitative data, standardised on a ten-point
in which the
of the web represents a score of zero, whereas the outer edges represent the highest
score (10).
are
on this range under the assumption that e
score
represents a better performance. Nevertheless, there is no weighing between the
A
score of 7 on one factor does not necessarily
that is a better score than a score of 6
on another factor. The extreme points on
axis have only a qualitative meaning; they do
not present numerical information, but
a rank order (in terms of ‘more’ or
This is
important for scenario design or
analysis since experts are more concerned with
statements on which systems options and underlying
are likely to be viable than on
assessments of consequences of
options. The advantage of this visualisation
by
of the spider model is that it is easy to show the relative score of the various city
t y p e s c o n c e r n i n g u r b a n g r e e n .
For application of the spider model, we used the same data set as with the factor analysis
concerning
land use,
as
or industrial
and green land
use,
as urban green
or forests. The application of the spider model for
land use is based on a percentage of the total
of the city groups, whereas the
a p p l i c a t i o n f o r g r e e n l a n d u s e i s b a s e d o n g r e e n s p a c e ( i n h e c t a r e s ) p e r i n h a b i t a n t .
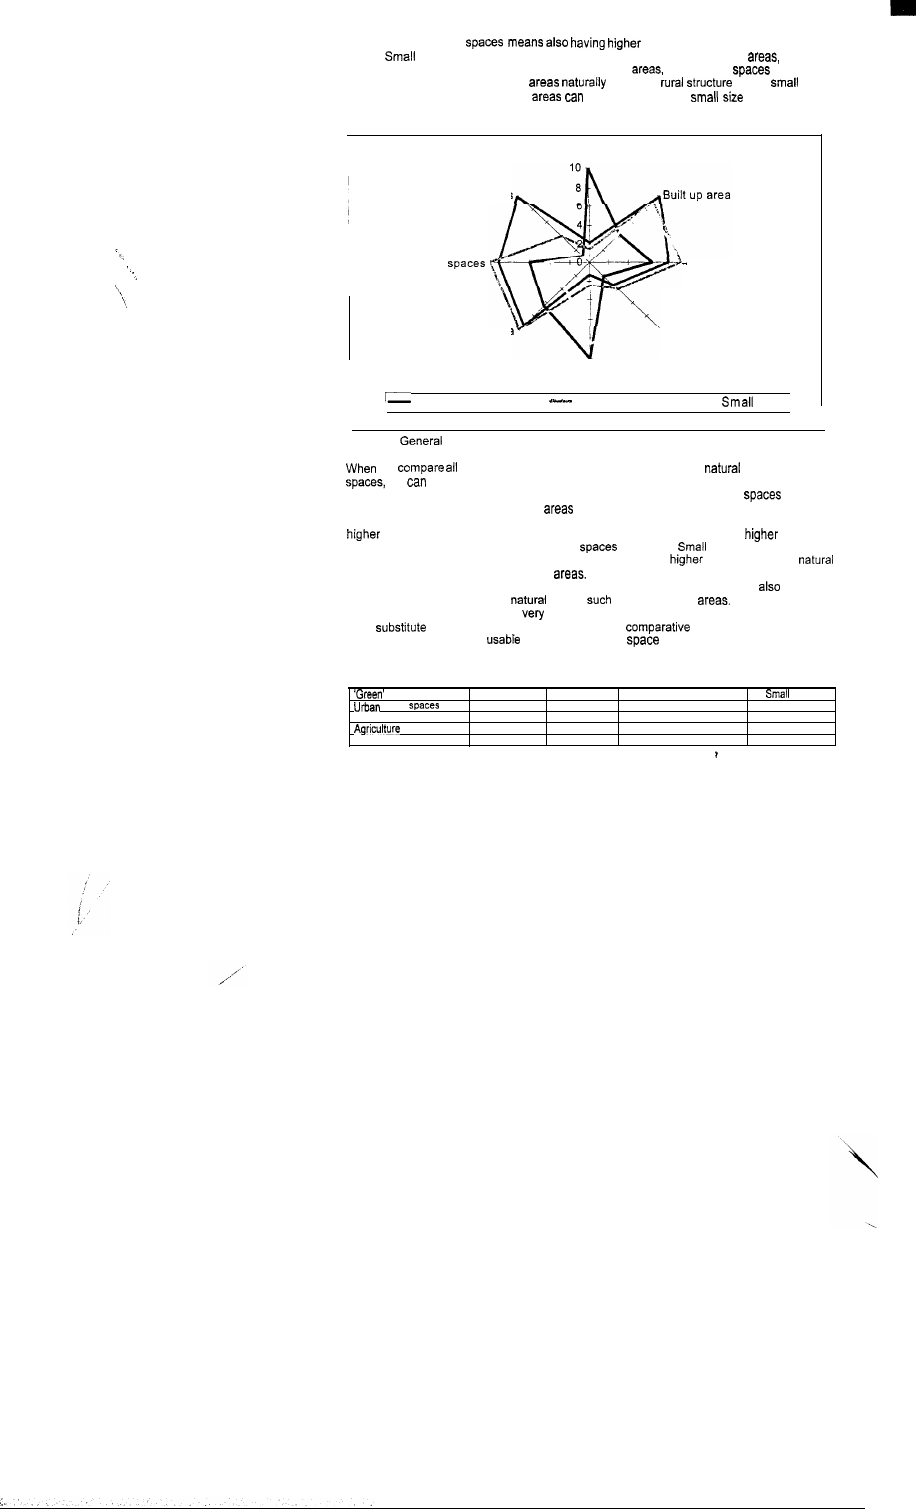
Figure 1 shows the different kinds of land use that
be found within the four city groups as
a percentage of the total surface of the city groups. Although metropoles have the highest
scores on total
they have the lowest scores on built-up and residential
This
b e e x p l a i n e d b y t h e
o f t h e c i t y s i n c e t h e y a r e c o n s i d e r e d h e r e a s a p e r c e n t a g e o f t h e
total
The other type of land use,
shows
a low score. This
be
explained by the loss of
for the growth and expansion of cities. While urban
green
show lower scores than big and medium-sized cities, contrary they have the
highest scores on forest. Big cities have the highest scores on built-up area and water, they
have
scores on urban green
medium-sized cities. But they have the
lowest scores on forest contrary to the metropoles. Parallel
in terms of built-up area
and urban green
are observed in big and medium-sized cities. Cities
scores on built-up area show
scores on urban green
This is the same
as that of the factor analysis. Medium-sized cities have
scores on
types of land use. They have the highest scores on urban green
and industrial
and they have
scores on water. Here, again the same
as with the factor
analysis is shown for the relationship between urban green
and water.
6
scores on urban green
scores on water in the same city
groups.
cities have the highest scores on agricultural and residential
whereas
they have the lowest scores on total surfaces, industrial
urban green
and water.
The highest scores on agricultural
show the
of the
cities
a n d t h e h i g h e s t s c o r e s o n r e s i d e n t i a l
b e e x p l a i n e d b y t h e
o f t h e c i t y .
Total surface
Water surfaces
Urban green
Residential area
I n d u s t r i a l a r e a
A g r i c u l t u r a l a r e a
Forest
Metropoles -Big Cities
Medium-Sized Cities
C i t i e s :
F i g u r e 1 :
l a n d u s e w i t h i n t h e f o u r c i t y g r o u p s
we
city groups together in terms of their scores on
and urban green
we
say that the most advantaged city group is the group of medium-sized cities
(see Table 6). Medium-sized cities have the highest scores on urban green
and the
second highest scores on agricultural
and water. Forest is at the third rank and this city
group has no lowest scores. The group of big cities is at the second rank with its relatively
scores. Both of these two groups (big and medium-sized cities) have
scores in
terms of urban green regarding urban green
and water.
cities on the other hand
have the lowest scores in terms of urban green but they have
scores in terms of
green regarding forest and agricultural
The most disadvantaged group within the four
c i t y g r o u p s i s m e t r o p o l e s . T h e y h a v e l o w e r s c o r e s i n t e r m s o f u r b a n g r e e n a n d
t h e y h a v e
the lowest scores in terms of
green
as agricultural
Therefore, from a
politica1 perspective it could be
interesting to analyse possibilities for the use of forests
as a
for urban green in metropoles. This
framework shows that the
conditions in terms of the
public urban green
available to the inhabitants are
m o s t p r o b l e m a t i c f o r t h e m e t r o p o l e s a n d t h e b i g c i t i e s .
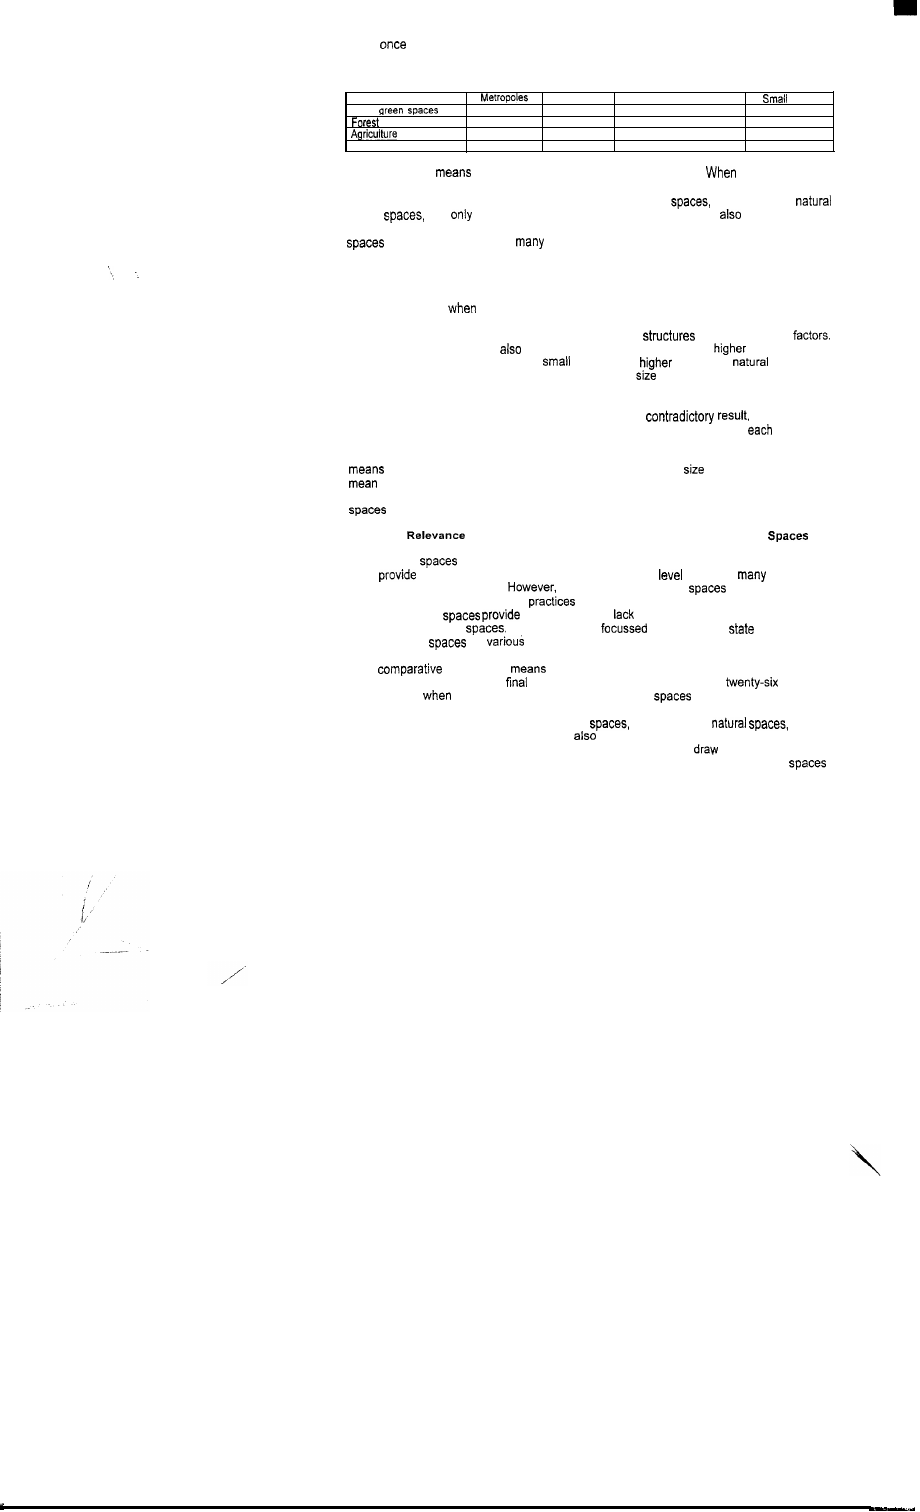
T a b l e 6 R a n k o r d e r o f ‘ g r e e n ’ l a n d u s e w i t h i n t h e f o u r c i t y g r o u p s
Land Use
Metropoles
Big Cities
Medium-Sized Cities
Cities
green
3
2
1
4
Forest
1
4
3
2
4
3
2
1
W a t e r
3
1
2
4
. .
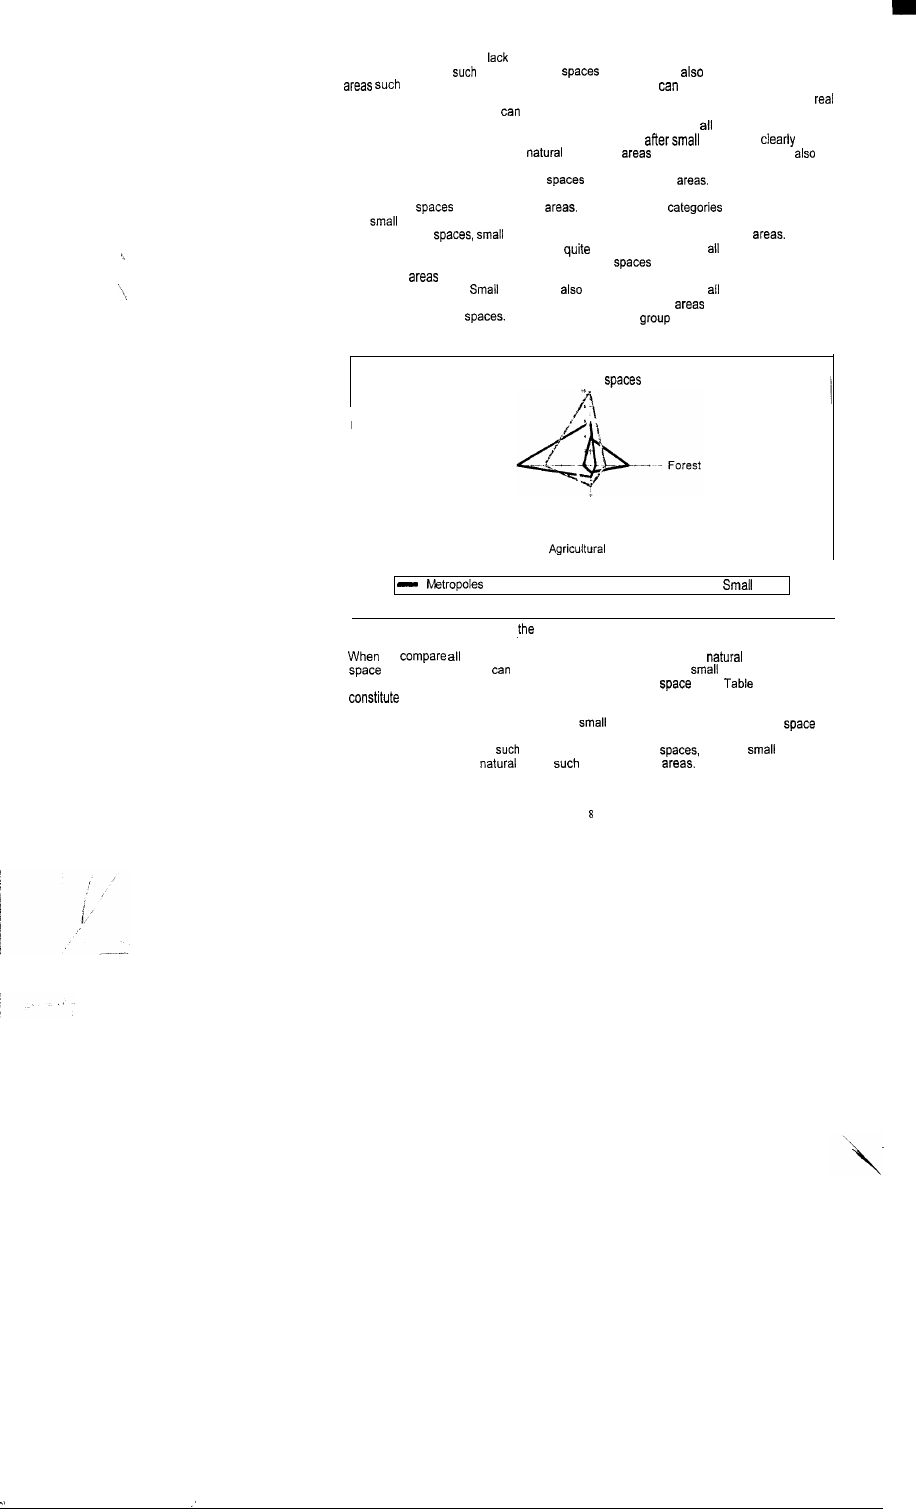
Figure 2 shows the types of green land use within the four city groups in hectares per
inhabitant. Because of the
of detailed data on green land use, we decided to show not
only green land use
as urban green
and forest, but
the other non built-up
as agriculture and water surfaces. Therefore, we
say that this figure presents
u r b a n g r e e n i n t e r m s o f n o n b u i l t - u p a r e a . A i t h o u g h a g r i c u l t u r e a n d w a t e r s u r f a c e s a r e n o t
g r e e n l a n d u s e s , o u r a p p r o a c h
b e s e e n a s a n e v a l u a t i o n o f t h e g r e e n i m a g e o f t h e c i t i e s .
Within the four city groups, metropoles have the lowest scores for
land use types except
the forest. They have the second highest scores on forest
cities. This
shows
that the metropoles have lost their
and green
except for forest. Big cities
do
not show a high performance. They have the lowest scores on forest and they have the
second lowest scores on urban green
and agricultural
The highest scores for
this group are on water. Metropoles and big cities, respectively, have the lowest scores on
urban green
and agricultural
For these same
medium-sized cities
and
cities have the highest scores. While medium-sized cities have the highest scores
on urban green
cities have the highest scores on agricultural
On the
other hand, medium-sized cities show a
high performance in
types of green land
uses. They have the highest score on urban green
and the second highest score on
agricultural
and water. Their lowest score is for forest but this score is at the third rank
in the four city groups.
cities show
a high performance in
types of green land
use. They have the highest scores on forest and agricultural
and the second highest
score on urban green
The lowest score of this
is on water but this score is at
t h e t h i r d r a n k i n t h e f o u r c i t y g r o u p s .
U r b a n g r e e n
Water sutfaces
a r e a
i
-Big Cities -- Medium-Sized Cities
Cities
F i g u r e 2 : G r e e n l a n d u s e w i t h i n
f o u r c i t y g r o u p s
we
city groups together in terms of their scores on
and urban green
per inhabitant. we
say that there is an order from
cities to metropoles
according to their performance on availability of green
(see
7). Metropoles
the most disadvantaged group in the four city groups, and the big cities follow
metropoles with their lowest scores. The most advantaged groups in terms of their
performance are medium-sized cities and
cities, The availability of green
per
i n h a b i t a n t i s r e l a t i v e l y h i g h i n t h e s e c i t y g r o u p s . M e d i u m - s i z e d c i t i e s s h o w a h i g h p e r f o r m a n c e
especially on urban green,
as forest and urban green
whereas
cities show
a high performance on
green
as agricultural
This second spider model
shows
again the conditions in terms of the usable public green space available to the
i n h a b i t a n t s . T h e s e a r e m o s t p r o b l e m a t i c f o r m e t r o p o l e s a n d t h e b i g c i t i e s .
T a b l e 7 R a n k o r d e r o f a v a i l a b l e ‘ g r e e n ’ p e r i n h a b i t a n t w i t h i n t h e f o u r c i t y g r o u p s
‘Green’ Land Use
Big
Cities
Medium-Sized Cities
Cities
Urban
4
3
1
2
4
1
2
3
2
4
3
1
W a t e r
4
3
2
1
The analysis by
of spider models shows interesting results.
we focus on the
availabiiity of green space in cities, metropoles and big cities show lower scores on the
availability of green space. They accommodate less green
especially less
green
not
as a percentage of the total land use, but
concerning the
availability per inhabitant. The results of the spider model for the availability of urban green
in European cities show
similarities with the results of a case study research on
D u t c h c i t i e s ( R o d e n b u r g e t a l . 2 0 0 2 ) . T h e r e s u l t s o f t h i s s t u d y s h o w t h a t B i g - D u t c h c i t i e s h a v e
the lowest scores on the availability of different types of urban green. The similarity between
the results of these two studies draws the attention towards big cities.
O n t h e o t h e r h a n d ,
t h e r e s u l t s o f t h e f a c t o r a n a l y s i s a n d t h e s p i d e r m o d e l a r e c o m p a r e d ,
a strong relationship between built-up area and urban green, and urban green and water is
observed in both of the analyses. Cities show parallel
in terms of these
Both of these analyses show
that metropoles and big cities have
scores on urban
green, whereas medium-sized and
cities have
scores on
green. Not
surprisingly there is a strong relationship between city
and the characteristics of green.
Besides these similar results, factor analysis shows that the metropoles and the big cities
h a v e a h i g h s c o r e o n t h e u r b a n g r e e n , w h e r e a s t h e s p i d e r m o d e l s h o w s t h a t t h e s e c i t i e s h a v e
the lowest scores. But this should not be seen as a
since different
i n d i c a t o r s o f l a n d u s e a r e u s e d i n t h e s e a n a l y s e s . W h i l e t o t a l a r e a i s u s e d f o r
l a n d u s e i n
t h e f a c t o r a n a l y s i s , a r e a a s a p e r c e n t a g e o f t h e t o t a l s u r f a c e a n d a r e a p e r i n h a b i t a n t a r e u s e d
in the spider models. Therefore, a high score on urban green in metropoles and big cities
a bigger amount of green space which is parallel to the
of the cities. It does not
that this amòunt of green space is enough to facilitate inhabitants and a high urban
quality of life. The results of the spider models clearly show that the availability of green
p e r i n h a b i t a n t i s m o r e p r o b l e m a t i c f o r m e t r o p o l e s a n d b i g c i t i e s .
4 .
Policy
for the Development and Management of Urban Green
Urban green
play an important role in improving the liveability of towns and cities.
T h e y
a r a n g e o f b e n e f i t s a t b o t h n a t i o n a l a n d l o c a l
a n d o f f e r
o p p o r t u n i t i e s
to people in different ways.
this potential of green
is not always being
realised, as current management
are sometimes sub-optimal. Despite the benefits
that urban green
there is a serious
of information about the quantity and
q u a l i t y o f u r b a n g r e e n
I n t h i s p a p e r , w e
o n t h e p r e s e n t
a n d a v a i l a b i l i t y
o f u r b a n g r e e n
i n
E u r o p e a n c i t i e s .
The
analyses by
of the factor-analytic methods and the spider models
showed interesting results. A
conclusion of the comparison on the
European
cities is that,
focussing on the availability of green
in and directly around the
cities, especially metropoles and big cities show lower scores on the availability of urban
green space. They accommodate less green
especially less
not only
as a percentage of the total land use, but
regarding the availability per inhabitant. The
(similar) results of this study and the case studies on Dutch cities
the attention towards
big cities. Therefore, more attention should be paid to the analysis of urban green
in
9
metropoies and big cities.
an
should not
focus on the availability of urban
g r e e n
b u t
o n t h e
o f u r b a n g r e e n
f o r t h e i n h a b i t a n t s o f c i t i e s .
the other hand, from a policy perspective, the
of several case studies showed
important
and priorities for the development and management of urban green
to improve the quality of urban green
an informative database is needed.
there is a serious
of information about the quantity and quality of urban green
Information on the quantity and quality of green
within urban
is
incomplete and fragmented. There is no single source and no single accurate set of
To improve current praciice an informative database and good
networks should be
c r e a t e d .
u r b a n g r e e n a n d o p e n s p a c e p l a n n i n g
s h o u l d b e d e t e r m i n e d l o c a l l y
and these
in development plans should aim at satisfying local
and assisting in
the achievement of national and international
more integrated approaches
f o r t h e d e v e l o p m e n t a n d m a n a g e m e n t o f u r b a n g r e e n
a r e n e e d e d . N e w a p p r o a c h e s t o
c o m b i n e
p l a n n i n g f o r g r e e n s p a c e w i t h i n n o v a t i v e d e s i g n a n d t h e d e l i v e r y a n d
i n v o l v e m e n t o f t h e c o m m u n i t y a t
s t a g e s s h o u l d b e d e v e l o p e d . A
a n d e n a b l i n g
p a r t n e r s h i p a m o n g l o c a l a u t h o r i t i e s , l o c a l b u s i n e s s e s a n d v o l u n t a r y g r o u p s s h o u l d b e f o r m e d .
C o m m u n i t y i n v o l v e m e n t i n c l u d i n g l o c a l r e s i d e n t s a n d t h e
u s e r s o f t h e
s h o u l d
be provided.
most development
adopt
a simple, population-based standard
approach to the need for green space in new housing developments and they largely ignore
the other green
as part of other developments
as industry, ieisure, etc. Planning
a u t h o r i t i e s s h o u l d d e v e l o p t h e i r o w n l o c a l s t a n d a r d s f o r g r e e n
n o t o n l y i n n e w h o u s i n g
developments but
in non-housing developments
as industry, and business.
quantity, quality and accessibility of green
should form the basis for a
for urban
green space. Planning
should give a high priority to ensuring that new green
are of sustainable high quality, if
at the expense of quantity. As a
research and poiicy
for improving the quality of life in cities and urban regions of
Europe will have an impact on the quality of locations both on a
and a large
Providing
and
green
benefits to the ccmpetitiveness of
t h e u r b a n l o c a t i o n i n a b r o a d e r p e r s p e c t i v e .
1 0
References
DTLR (2001) Green
Interim Report of the Urban Green
T a s k f o r c e , D e p a r t m e n t f o r T r a n s p o r t , L o c a l G o v e r n m e n t a n d t h e R e g i o n s , L o n d o n .
Goede, E., C.A. Rodenburg, ES. van Leeuwen, P. Nijkamp (2001)
of Urban
G r e e n
t h e
o f L i f e i n C i t i e s a n d U r b a n R e g i o n s ;
C r i t e r i a ,
and
Amsterdam.
Groot, R.S. de (1994) Environmental Functions and the
of
Ecosystems. In: Jansson, A.M., M. Hammer, C. Folke and R. Constanza (1994) Investing in
Natura/
The
Economics Approach to
Press,
W a s h i n g t o n .
Hair, J.F., R.E. Anderson, R.L. Tatham. W.C. Black (1998)
P r e n t i c e - H a l l I n t e r n a t i o n a l , L o n d o n .
Hart, R. (1997) Children’s Participation: The Theory and
of Involving Young Citizens
in Community Development and Environmental
In: Satterthwaite,
(1999)
R e a d e r i n
C i t i e s , E a r t h s c a n P u b l i c a t i o n s , L o n d o n .
H a u g h t o n , G . , C .
( 1 9 9 4 ) S u s t a i n a b l e C i t i e s , J K P , L o n d o n .
Leeuwen, E. van, C. Rodenburg, P. Nijkamp (2002) “Urban Green and Integrative Urban
Sustainability;
and their
in Dutch Cities”, European
for
R e s e a r c h
( s u b m i t t e d ) .
I.L. (1971) Design with
Doubleday, Garden City, New York.
Rienstra, S.A. (1996) Options and barriers for sustainable transport
Thesis, Vrije
U n i v e r s i t e i t , A m s t e r d a m .
R o d e n b u r g , C . A . , E . S . v a n L e e u w e n , P . N i j k a m p ( 2 0 0 2 ) E n v i r o n m e n t a l A s s e s s m e n t I n d i c a t o r s
for Urban Green
A
study on Dutch cities.
in
of
S p r i n g e r , B e r l i n ( s u b m i t t e d ) .
J. (1999)
and Designing with
Urban Design. In: Roelofs, J. (1996)
Greening Cities:
Just and Sustainable Communities, The Bootstrap Press, New
York. In: Satterthwaite, D. (1999) The
Reader in
Cities, Earthscan
P u b l i c a t i o n s , L o n d o n .
Scottish
(2001) Retbinking Open
The Stationery Office, Kit Campbell
E d i n b u r g h .
Stanners, D., P. Bourdeau (1995)
The
Assessment, Office for
O f f i c i a l P u b l i c a t i o n s o f t h e E u r o p e a n C o m m u n i t i e s , L u x e m b o u r g .
URGE (2002)
WCED
Common
Oxford University Press, Oxford, New York.
D a t a o n p o p u l a t i o n a n d l a n d u s e i n E u r o p e a n c i t i e s
Cities
Land
1
Built-up
Total
R e s i d e n t i a l
F o r e s t
Water
area (ha)
area (ha)
population
(ha)
(ha)
( h a )
(ha)
(ha)
49830
52001
5251
3615551
39101
4 9 4 )
546
21
and
3 5 4 9 0 ) 9 5 0 0
7 0 0 0
12
Wyszukiwarka
Podobne podstrony:
Greenshit go home Greenpeace, Greenland and green colonialism in the Arctic
ROLE OF THE COOPERATIVE BANK IN EU FUNDS
Erosion of Secular Spaces in the UK
Balancing Disappointment and Enthusiasm Developments in EU Balkans relations during 2003
Wheat bread enriched with green coffee – In vitro bioaccessibility and
Urban dystopias in US cities
The Green Revolution in Asia doc
BIBLIOGRAPHY #3 Bucer & the Reformation in the Cities
BIBLIOGRAPHY #3 Bucer & the Reformation in the Cities
Neural networks in non Euclidean metric spaces
Dance, Shield Modelling of sound ®elds in enclosed spaces with absorbent room surfaces
Nugent 5ed 2002 The Government and Politics in the EU part 1
EU enlargement in the Balkans
Contrastic Rhetoric and Converging Security Interests of the EU and China in Africa
G20 in Mexico – New Plans for EU
Neural networks in non Euclidean metric spaces
Dance, Shield Modelling of sound ®elds in enclosed spaces with absorbent room surfaces
więcej podobnych podstron