


BP-VA User Guide
0.-3
Business Process Visual ARCHITECT 2.0 User's Guide
The software and documentation are furnished under the Business Process Visual ARCHITECT license agreement and may be
used only in accordance with the terms of the agreement.
Copyright Information
Copyright c 1999-2007 by Visual Paradigm. All rights reserved.
The material made available by Visual Paradigm in this document is protected under the laws and various international laws
and treaties. No portion of this document or the material contained on it may be reproduced in any form or by any means
without prior written permission from Visual Paradigm.
Every effort has been made to ensure the accuracy of this document. However, Visual Paradigm makes no warranties with
respect to this documentation and disclaims any implied warranties of merchantability and fitness for a particular purpose. The
information in this document is subject to change without notice.
All examples with names, company names, or companies that appear in this document are imaginary and do not refer to, or
portray, in name or substance, any actual names, companies, entities, or institutions. Any resemblance to any real person,
company, entity, or institution is purely coincidental.
Trademark Information
Business Process Visual ARCHITECT is registered trademark of Visual Paradigm. Microsoft, Windows, and the Windows
logo are trademarks or registered trademarks of Microsoft Corporation. Other trademarks or service marks referenced herein
are property of their respective owners.
Business Process Visual ARCHITECT License Agreement
THE USE OF THE SOFTWARE LICENSED TO YOU IS SUBJECT TO THE TERMS AND CONDITIONS OF THIS
SOFTWARE LICENSE AGREEMENT. BY INSTALLING, COPYING, OR OTHERWISE USING THE SOFTWARE, YOU
ACKNOWLEDGE THAT YOU HAVE READ THIS AGREEMENT, UNDERSTAND IT, AND AGREE TO BE BOUNDED
BY ALL OF THE TERMS AND CONDITIONS OF THIS SOFTWARE LICENSE AGREEMENT.
1.
Limited License Grant. Visual Paradigm grants to you ("the Licensee") a personal, non-exclusive, non-transferable,
limited, perpetual, revocable license to install and use Visual Paradigm Products ("the Software" or "the Product").
The Licensee must not re-distribute the Software in whole or in part, either separately or included with a product.
2.
Restrictions. The Software is confidential copyrighted information of Visual Paradigm, and Visual Paradigm and/or
its licensors retain title to all copies. The Licensee shall not modify, adapt, decompile, disassemble, decrypt, extract,
or otherwise reverse engineer the Software. Software may not be leased, rented, transferred, distributed, assigned, or
sublicensed, in whole or in part. The Software contains valuable trade secrets. The Licensee promises not to extract
any information or concepts from it as part of an effort to compete with the licensor, nor to assist anyone else in such
an effort. The Licensee agrees not to remove, modify, delete or destroy any proprietary right notices of Visual
Paradigm and its licensors, including copyright notices, in the Software.
3.
Disclaimer of Warranty. The software and documentation are provided "AS IS," WITH NO WARRANTIES
WHATSOEVER. ALL EXPRESS OR IMPLIED REPRESENTATIONS AND WARRANTIES, INCLUDING ANY
IMPLIED WARRANTY OF MERCHANTABILITY, FITNESS FOR A PARTICULAR PURPOSE, TITLE OR
NON-INFRINGEMENT, ARE HEREBY EXCLUDED. THE ENTIRE RISK AS TO SATISFACTORY QUALITY,
PERFORMANCE, ACCURACY AND EFFORT IS WITH THE LICENSEE. THERE IS NO WARRANTY THE
DOCUMENTATION, Visual Paradigm's EFFORTS OR THE LICENSED SOFTWARE WILL FULFILL ANY OF
LICENSEE'S PARTICULAR PURPOSES OR NEEDS. IF THESE WARRANTIES ARE UNENFORCEABLE
UNDER APPLICABLE LAW, THEN Visual Paradigm DISCLAIMS SUCH WARRANTIES TO THE MAXIMUM
EXTENT PERMITTED BY SUCH APPLICABLE LAW.
4.
Limitation of Liability. Visual Paradigm AND ITS LICENSORS SHALL NOT BE LIABLE FOR ANY
DAMAGES SUFFERED BY THE LICENSEE OR ANY THIRD PARTY AS A RESULT OF USING OR
DISTRIBUTING SOFTWARE. IN NO EVENT WILL Visual Paradigm OR ITS LICENSORS BE LIABLE FOR
ANY LOST REVENUE, PROFIT OR DATA, OR FOR DIRECT, INDIRECT, EXEMPLARY, SPECIAL,
CONSEQUENTIAL, INCIDENTAL OR PUNITIVE DAMAGES, HOWEVER CAUSED AND REGARDLESS OF
THE THEORY OF LIABILITY, ARISING OUT OF THE USE OF OR INABILITY TO USE THE SOFTWARE,
EVEN IF Visual Paradigm HAS BEEN ADVISED OF THE POSSIBILITY OF SUCH DAMAGES.
5.
Termination. The Licensee may terminate this License at any time by destroying all copies of Software. Visual
Paradigm will not be obligated to refund any License Fees, if any, paid by the Licensee for such termination. This
License will terminate immediately without notice from Visual Paradigm if the Licensee fails to comply with any
provision of this License. Upon such termination, the Licensee must destroy all copies of the Software. Visual
Paradigm reserves all rights to terminate this License.
SPECIFIC DISCLAIMER FOR HIGH-RISK ACTIVITIES. The SOFTWARE is not designed or intended for use in high-
risk activities including, without restricting the generality of the foregoing, on-line control of aircraft, air traffic, aircraft
navigation or aircraft communications; or in the design, construction, operation or maintenance of any nuclear facility. Visual
Paradigm disclaims any express or implied warranty of fitness for such purposes or any other purposes.

BP-VA User Guide
0-4
NOTICE. The Product is not intended for personal, family or household use; rather, it is intended exclusively for professional
use. Its utilization requires skills that differ from those needed to use consumer software products such as word processing or
spreadsheet software.
GOVERNMENT RIGHTS. If the Software is licensed by or on behalf of a unit or agency of any government, the Licensee
agrees that the Software is "commercial computer software", "commercial computer software documentation" or similar terms
and that, in the absence of a written agreement to the contrary, the Licensee's rights with respect to the Software are limited by
the terms of this Agreement.
Acknowledgements
This Product includes software developed by the Apache Software Foundation (http://www.apache.org). Copyright© 1999 The
Apache Software Foundation. All rights reserved.

BP-VA User Guide
0-5
Table of Contents
Chapter 1 - Introduction to Business Process Visual ARCHITECT
What is Business Process Visual ARCHITECT™........................................................................................................... 1 -2
Intuitive User Interface ........................................................................................................................................... 1 -2
Complete BPMN Specification and Notation Support ........................................................................................... 1 -3
Intelligent Notation Validation and Modeling Assistance ...................................................................................... 1 -3
Installation ........................................................................................................................................................................ 1 -4
Installing Business Process Visual ARCHITECT .................................................................................................. 1 -4
Starting Business Process Visual ARCHITECT..................................................................................................... 1 -5
User Interface ................................................................................................................................................................... 1 -5
Diagram Pane.......................................................................................................................................................... 1 -6
Diagram Navigator ................................................................................................................................................. 1 -6
Model...................................................................................................................................................................... 1 -7
Property................................................................................................................................................................... 1 -7
Diagram Overview.................................................................................................................................................. 1 -7
Documentation........................................................................................................................................................ 1 -8
Chapter 2 - Drawing Business Process Diagram
Creating Business Process Diagram ................................................................................................................................. 2 -2
Creating Element .............................................................................................................................................................. 2 -3
Creating Element using Toolbar ............................................................................................................................. 2 -3
Creating Element using Context Menu ................................................................................................................... 2 -4
Creating Element using Mouse Gesture.................................................................................................................. 2 -5
Creating Element using Resource-Centric Interface ............................................................................................... 2 -6
Editing Element................................................................................................................................................................ 2 -7
In-Place Editing ...................................................................................................................................................... 2 -7
Specification Dialog Box ........................................................................................................................................ 2 -8
Property Pane.......................................................................................................................................................... 2 -8
Documentation........................................................................................................................................................ 2 -9
Advanced Diagramming Techniques ............................................................................................................................... 2 -9
Advanced Usages of Resource-Centric Interface ................................................................................................... 2 -9
Sweeper................................................................................................................................................................. 2 -10
Forming Sub-Process from Existing Elements ..................................................................................................... 2 -11
Creating Group for Existing Elements.................................................................................................................. 2 -11
Invalid Connections Detection.............................................................................................................................. 2 -12
Choosing Different Caption Placements............................................................................................................... 2 -12
Choosing Different Connector Styles ................................................................................................................... 2 -13
Changing Styles and Formatting........................................................................................................................... 2 -15
Incorporating User-Defined Images...................................................................................................................... 2 -20
Chapter 3 - Drawing Data Flow Diagram
Creating Data Flow Diagram............................................................................................................................................ 3 -2
Data Flow Diagram Elements .......................................................................................................................................... 3 -3
Process .................................................................................................................................................................... 3 -3
External Entity ........................................................................................................................................................ 3 -4
Data Store ............................................................................................................................................................... 3 -4
Data Flow................................................................................................................................................................ 3 -5
Decomposing a Process.................................................................................................................................................... 3 -5
Chapter 4 - Printing Diagram
Print Preview .................................................................................................................................................................... 4 -2
Printing Diagrams with Preview ...................................................................................................................................... 4 -3
Page Setup .............................................................................................................................................................. 4 -4
Adjusting Margins .................................................................................................................................................. 4 -4
Zooming Pages ....................................................................................................................................................... 4 -5
Selecting the Preview Layout ................................................................................................................................. 4 -5
Setting Paper Place Style ........................................................................................................................................ 4 -6
Fit to Ratio .............................................................................................................................................................. 4 -7
Fit to Pages ............................................................................................................................................................. 4 -7
Setting the Diagram Overlap Percentage ................................................................................................................ 4 -8

BP-VA User Guide
0-6
Showing/Hiding Clip Marks on Page ..................................................................................................................... 4 -8
Editing Header/Footer of the Pages ........................................................................................................................ 4 -9
The Multiple Page Mode....................................................................................................................................... 4 -10
Printing Diagrams with Quick Print ............................................................................................................................... 4 -10
Chapter 5 - Copying and Exporting Diagrams
Copy ................................................................................................................................................................................. 5 -2
Default Copy........................................................................................................................................................... 5 -2
Copying within BPVA ............................................................................................................................................ 5 -2
Copying to the Clipboard as OLE ........................................................................................................................... 5 -3
Copying to the Clipboard as Image (JPG) .............................................................................................................. 5 -3
Copying to the Clipboard as Image (EMF) ............................................................................................................. 5 -3
Paste ................................................................................................................................................................................. 5 -3
Pasting Copied Diagram Elements.......................................................................................................................... 5 -4
Pasting as Image Shape........................................................................................................................................... 5 -4
Exporting Diagram as Images .......................................................................................................................................... 5 -5
Exporting the Active Diagram as an Image ............................................................................................................ 5 -5
Exporting Diagrams as Images ............................................................................................................................... 5 -5
Exporting and Importing (Merging) of Project................................................................................................................. 5 -7
Exporting Project .................................................................................................................................................... 5 -7
Importing (Merging) a BP-VA Project ................................................................................................................... 5 -8
Chapter 6 - Business Process Diagram Samples
Retail Company ................................................................................................................................................................ 6 -2
Problem Statement .................................................................................................................................................. 6 -2
Business Process Diagram ...................................................................................................................................... 6 -2
Car Rental Process............................................................................................................................................................ 6 -2
Problem Statement .................................................................................................................................................. 6 -2
Business Process Diagram ...................................................................................................................................... 6 -3
Software Helpdesk............................................................................................................................................................ 6 -3
Problem Statement .................................................................................................................................................. 6 -3
Business Process Diagram ...................................................................................................................................... 6 -3
Online Store...................................................................................................................................................................... 6 -3
Problem Statement .................................................................................................................................................. 6 -3
Business Process Diagram ...................................................................................................................................... 6 -4

1
Introduction to Business Process Visual
ARCHITECT
Business Process Visual ARCHITECT (BP-VA) is a visual modeling tool that provides the
most extensive support for the Business Process Modeling Notation (BPMN) – a widely
used business process notation that is intuitive to business users yet able to represent
complex process semantics.
In this chapter:
What is Business Process Visual ARCHITECT?
Installation
User Interface
BP-VA User’s Guide
Chapter 1 – Introduction to Business Process Visual ARCHITECT
1-2
Chapter 1 - Introduction to Business Process
Visual ARCHITECT
What is Business Process Visual ARCHITECT™
Business Process Visual ARCHITECT (BP-VA) is a visual modeling tool that provides the most extensive support for the
Business Process Modeling Notation (BPMN) - a widely used business process notation that is intuitive to business users yet
able to represent complex process semantics.
More than just a BPMN diagramming tool, BP-VA offers the following key benefits to make business process modeling faster,
better and easier:
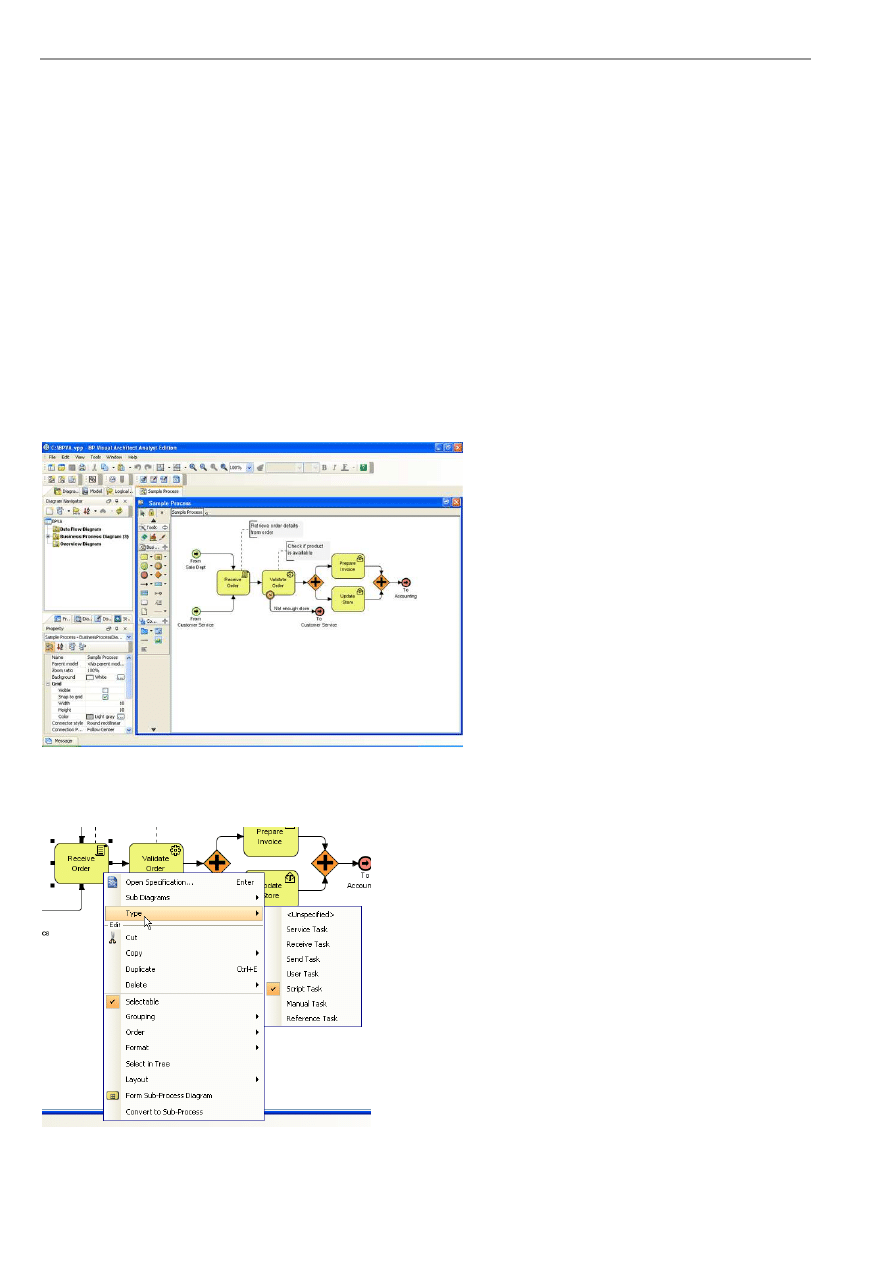
Intuitive User Interface
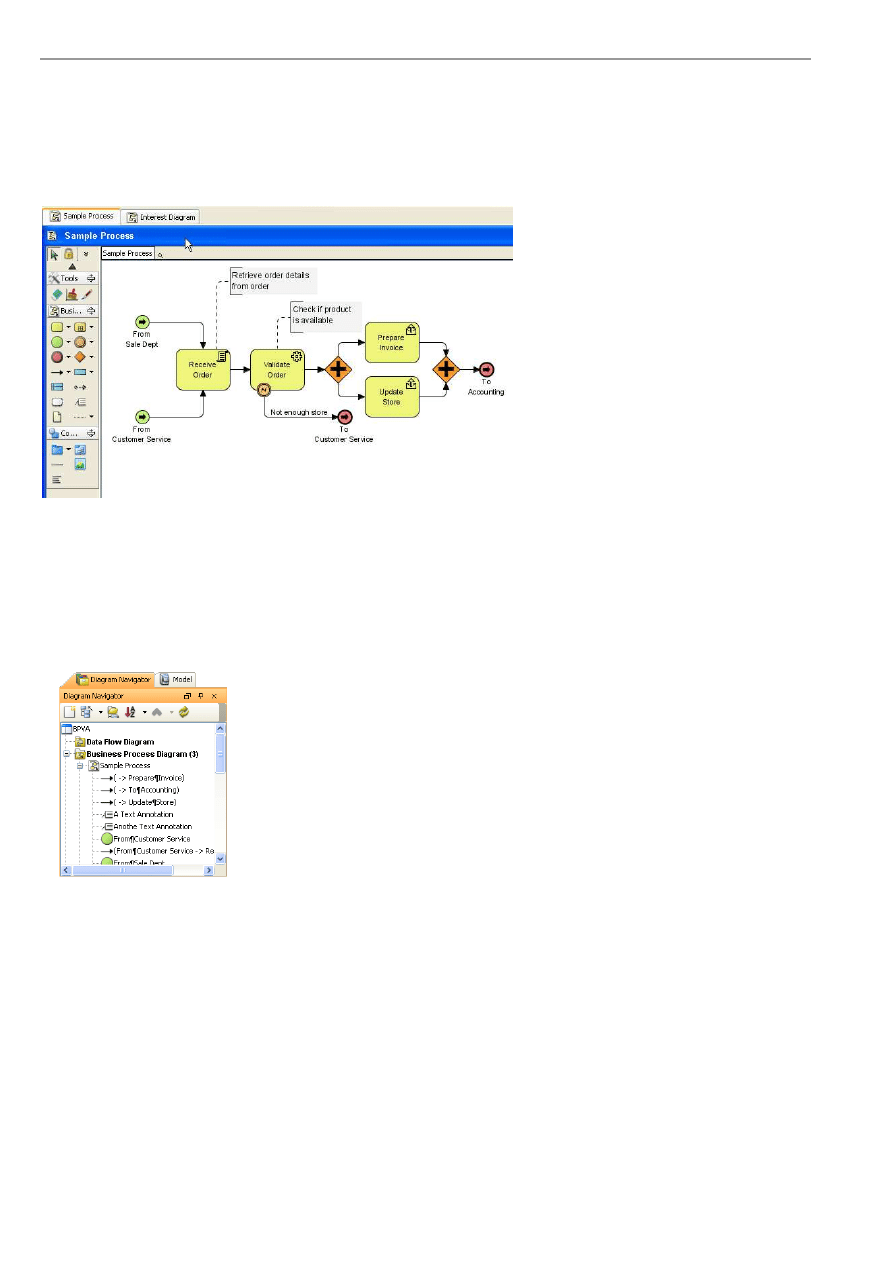
In BP-VA, project resources and modeling facilities are well-organized in dockable windows (Diagram Navigator, Model,
Property, etc), you can show/hide and re-arrange the windows to create your favorite modeling environment.
Figure 1.1 - User Interface of BP-VA
Most modeling or diagramming operations can be carried out quickly by in-place editing, context menu or through the property
table. This saves you a dramatic amount of time compared to using modal dialog boxes in traditional diagramming tools.
Figure 1.2 - Context menu
BP-VA User’s Guide
Chapter 1 – Introduction to Business Process Visual ARCHITECT
1-3
To make diagramming and modeling even more efficient, BP-VA adopts the resource-centric interface, where context-sensitive
shortcut buttons (hereafter referred as "resource" ) will be shown around the active diagram element. Each resource provides a
functionality that you would likely to perform frequently, like creating a connection to a new/existing shape, opening the model
specification, resizing a shape to fit. Since the resources are shown around the active diagram element, you can save
considerable time and mouse move to access the menu bar or toolbar for the desired functionality.
Figure 1.3 - Resource-centric interface
Complete BPMN Specification and Notation Support
BP-VA completely covers the latest Business Process Modeling Notation (BPMN), from model specification to graphical
notation, including different presentation options. You can easily model your business process by drawing Business Process
Diagrams and present them to your business partners that understand BPMN.
Figure 1.4 - Complete BPMN specification and notation support
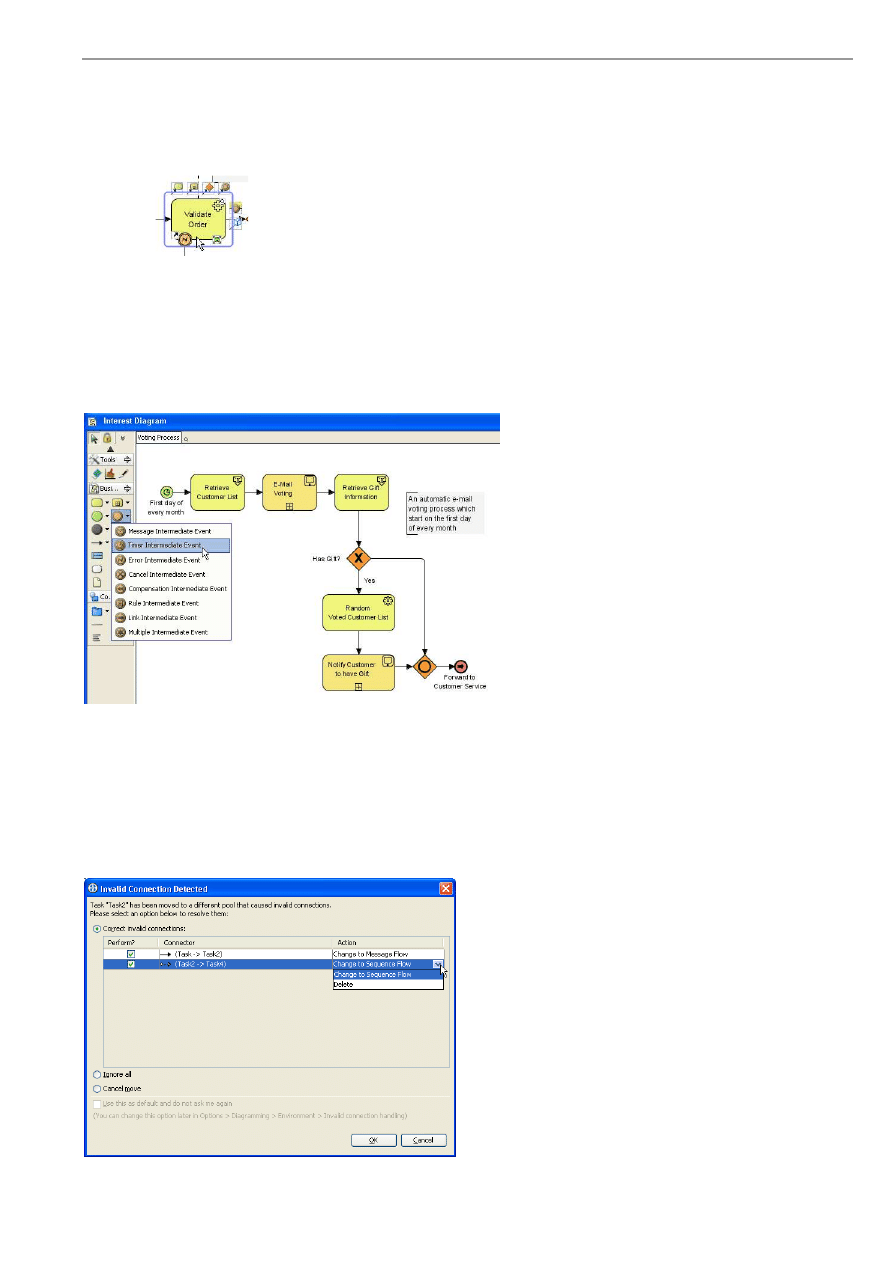
Intelligent Notation Validation and Modeling Assistance
To ensure you are always on the right track, BP-VA provides intelligent notation validation while you are editing the diagrams.
Warning sign will be shown on the diagram if you try to make an invalid connection between shapes. When shapes are moved
between pools that caused invalid business flows, those invalid flows are analyzed and displayed, with suggested quick fixes
for you to quickly correct the problems.
Figure 1.5 - Invalid Connection Detected dialog box
BP-VA User’s Guide
Chapter 1 – Introduction Business Process Visual ARCHITECT
1-4
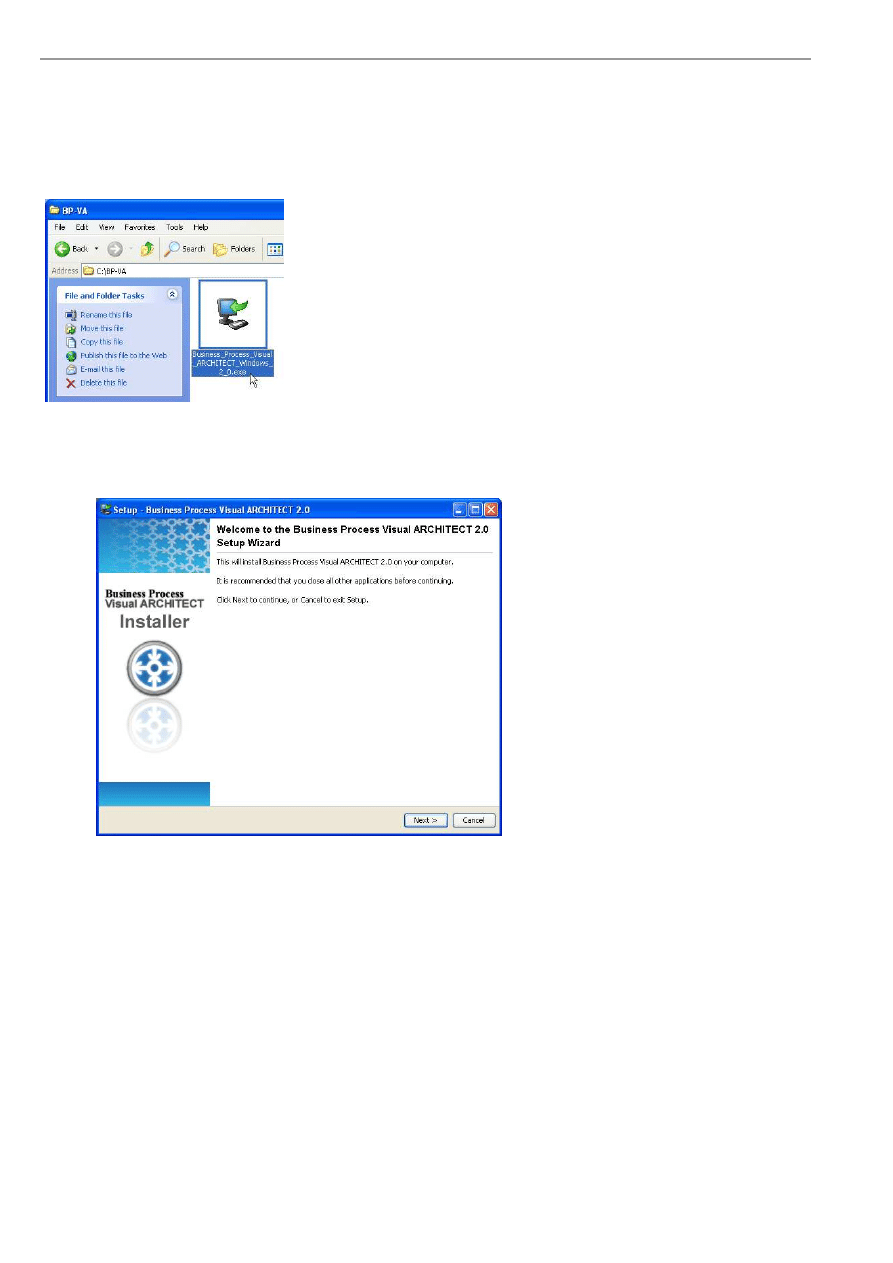
Installation
Installing Business Process Visual ARCHITECT
Run the BP-VA installer.
Figure 1.6 - The BP-VA installer
1.
In the welcome screen, click Next to continue.
Figure 1.7 - The BP-VA setup wizard
2.
In the License Agreement screen, read the BP-VA license agreement. Select I accept the agreement and click Next
if you agree with it, otherwise click Cancel to exit the installation.
3.
In the Select Destination Directory screen, select a directory for installing BP-VA. Click Next to continue.
4.
In the Select Start Menu Folder screen, select a new or an existing Start menu folder for BP-VA. Click Next to
continue.
5.
In the Select File Associations screen, select to associate files with extension .vpp if you want them to be opened with
BP-VA automatically. Click Next to continue.
6.
In the Products Configuration screen, enter the file path of your BP-VA license key. If the license key is not ready at
the moment, just leave it blank (you will be asked for the key again when you start BP-VA). Click Next to continue.
7.
When you see the Installing screen, the required files will be copied to your computer for installing BP-VA.
8.
When you see the installation completed screen, click Finish to finish the BP-VA installation.
BP-VA User’s Guide
Chapter 1 – Introduction to Business Process Visual ARCHITECT
1-5
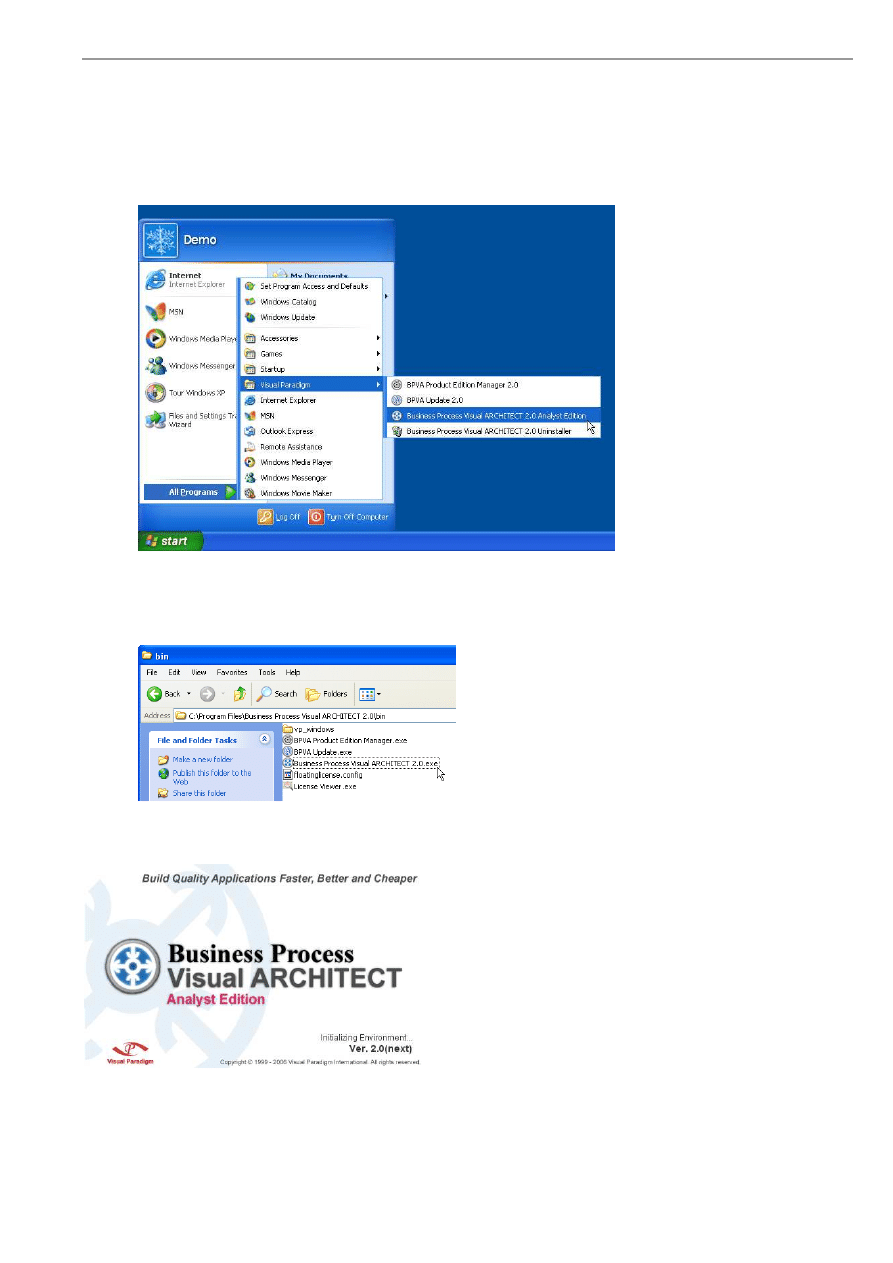
Starting Business Process Visual ARCHITECT
To start BP-VA, perform one of the following actions:
•
Click the Start menu > All Programs > Visual Paradigm > Business Process Visual ARCHITECT.
Figure 1.8 - Launching BP-VA on Windows menu
•
Open the BP-VA installation directory, go into the bin folder and open Business Process Visual ARCHITECT.exe.
Figure 1.9 - The executable of BP-VA
BP-VA will be started shortly.
Figure 1.10 - The BP-VA splash screen
User Interface
BP-VA User’s Guide
Chapter 1 – Introduction Business Process Visual ARCHITECT
1-6
The user interface of BP-VA comprises of the following panes:
Diagram Pane
The Diagram Pane is a tabbed view of all opened diagrams. You can click on the tab of a diagram to make it the active diagram
for viewing or editing. You can arrange the windows so you can view more than one diagram at the same time.
Figure 1.11 - Diagram Pane
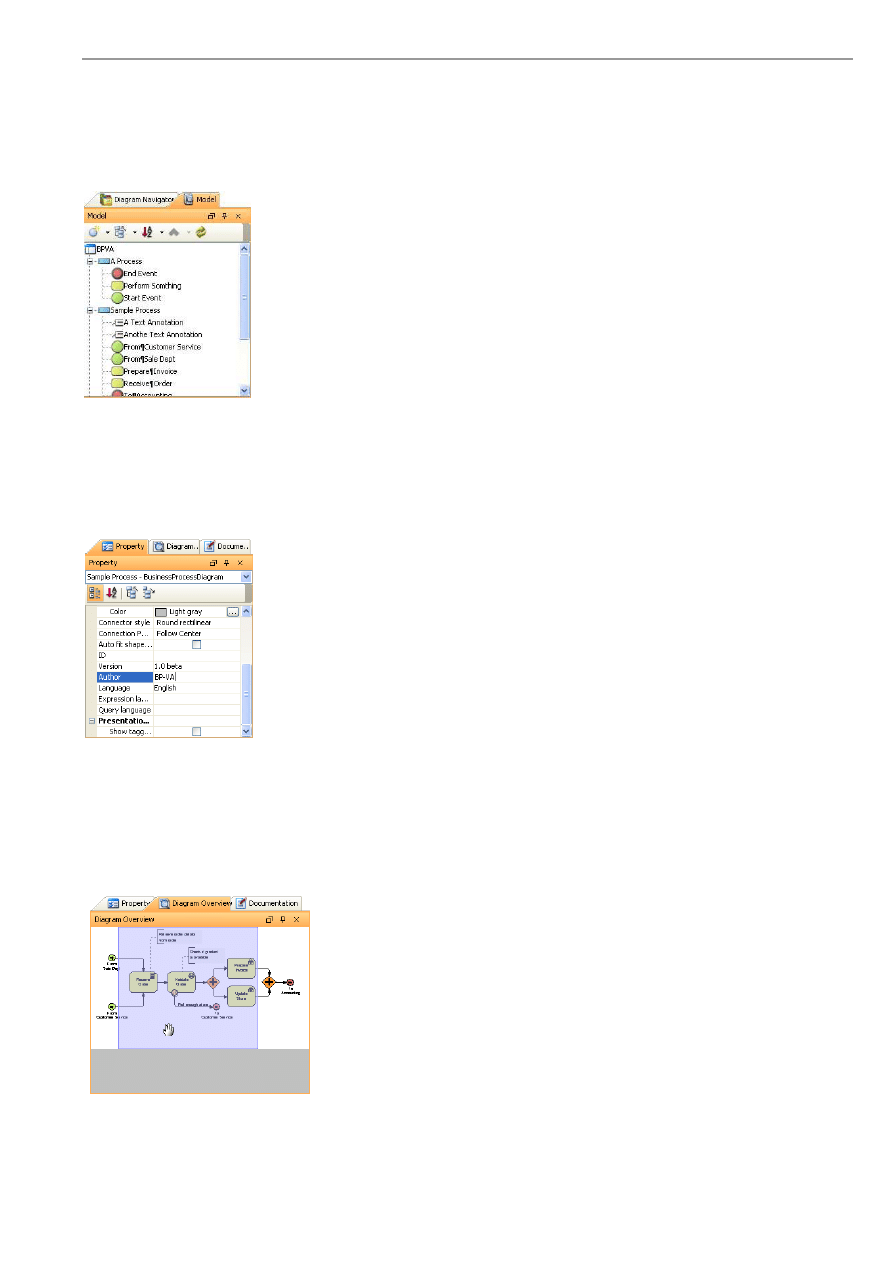
Diagram Navigator
In the Diagram Navigator, diagrams are listed under their corresponding diagram type, and diagram elements are listed under
their owner diagrams. You can open a diagram/diagram element by double-clicking on its node in the Diagram Navigator.
Other operations like open specification, rename, delete can be performed by right-clicking on the node to invoke its context
menu.
Figure 1.12 - Diagram Navigator
BP-VA User’s Guide
Chapter 1 – Introduction to Business Process Visual ARCHITECT
1-7
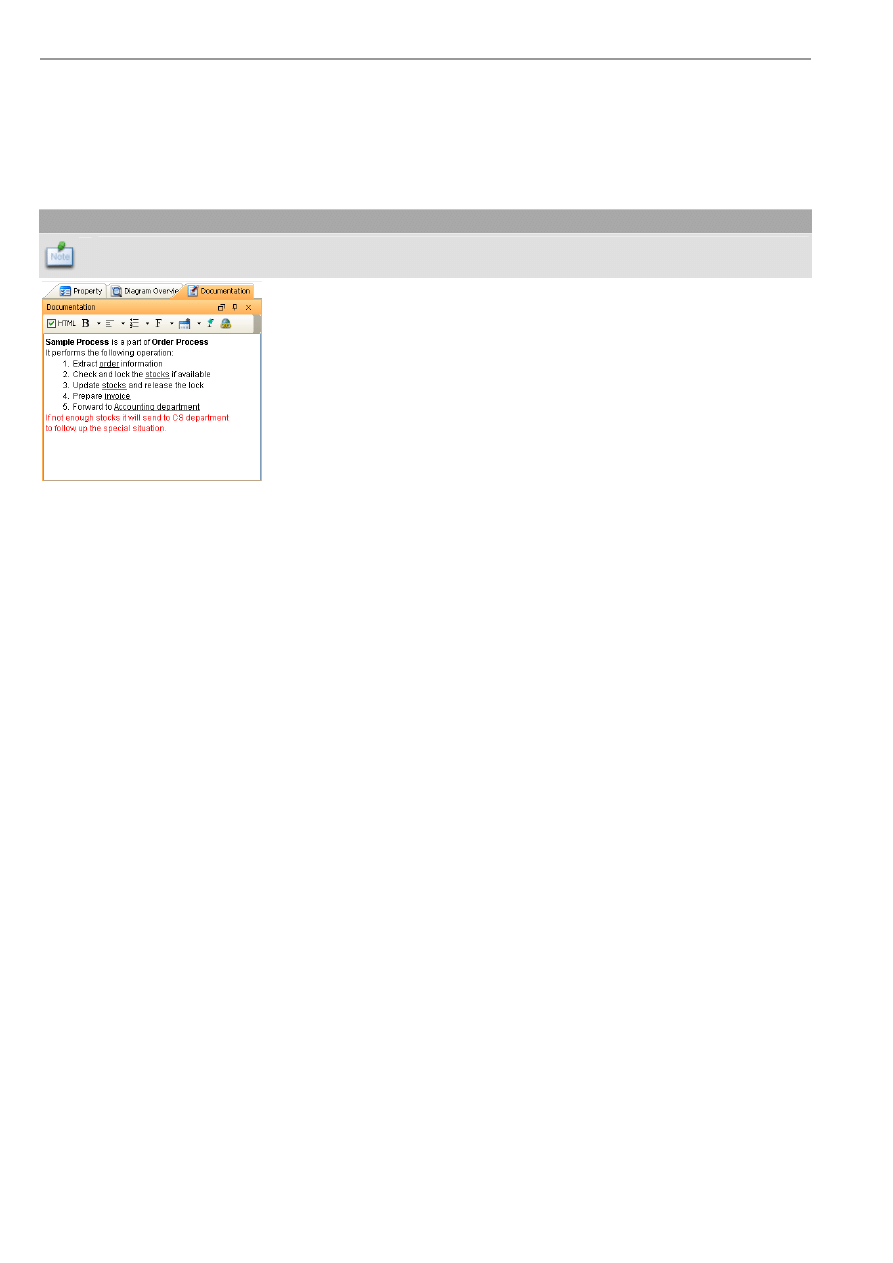
Model
The Model pane shows the model elements in the project. Elements are arranged according to their parent-child hierarchy.
Operations on model like open specification, rename, delete can be performed by right-clicking on the node to invoke
its context menu.
Figure 1.13 - Model pane
Property
The Property pane shows the properties of the active diagram or the currently selected diagram elements. You can view or edit
the properties here.
Figure 1.14 - Property pane
Diagram Overview
The Diagram Overview shows the entire diagram zoomed to fit the overview display area. The actual visible bounds are
indicated by the blue rectangle. To scroll the diagram to a desired location, move the mouse over the Diagram Overview and
drag (you will notice the mouse cursor changed to a "hand" ).
Figure 1.15 - Diagram Overview pane
BP-VA User’s Guide
Chapter 1 – Introduction Business Process Visual ARCHITECT
1-8
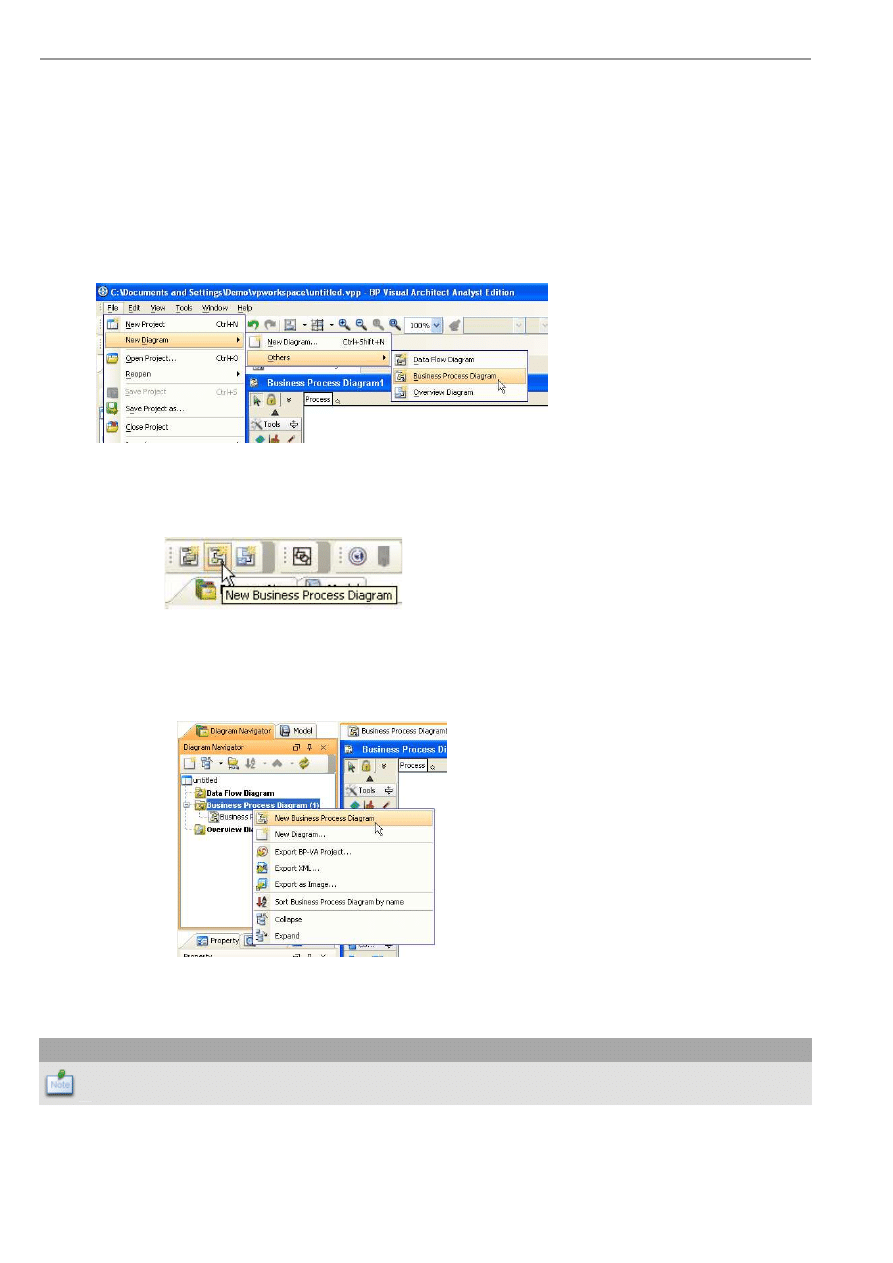
Documentation
The Documentation pane shows the documentation of the active diagram or the currently selected diagram element. You can
view or edit the documentation here. Documentation can be edited in rich text or plain text by selecting/deselecting the HTML
checkbox.
Note
The documentation format (rich text or plain text) is a project-wide option. You cannot apply rich text
documentation to one element while apply plain text documentation to another element in the same project.
Figure 1.16 - Documentation pane

2
Drawing Business Process Diagram
In this chapter, you will first learn the basic skills to draw business process diagrams in BP-
VA. Then you will move on to a more advanced level to get the most of BP-VA to streamline
and accelerate your business modeling routine.
In this chapter:
Creating Business Process Diagram
Creating Element
Editing Element
Advanced Diagramming Techniques
BP-VA User’s Guide
Chapter 2 – Drawing Business Process Diagram
2-2
Chapter 2 - Drawing Business Process Diagram
Creating Business Process Diagram
To create a Business Process Diagram, perform one of the following actions:
•
Select menu File > New Diagram > Others > Business Process Diagram
Figure 2.1 - Creating Business Process Diagram from menu
•
Click on the New Business Process Diagram button on the toolbar.
Figure 2.2 - Creating Business Process Diagram from toolbar
•
In the Diagram Navigator, right-click Business Process Diagram and select Create Business Process Diagram
from the context menu.
Figure 2.3 - Creating Business Process Diagram in Diagram Navigator
A blank Business Process Diagram will be created and opened in the Diagram Pane.
Note
A blank Business Process Diagram will be created by default when you create a new project.
BP-VA User’s Guide
Chapter 2 – Drawing Business Process Diagram
2-3
Creating Element
BP-VA allows you to create diagram elements (shapes and connectors) in many different ways, you can choose to create them
in the traditional way using toolbar or context menu, or you can take advantage of BP-VA's unique visual modeling features
like mouse gestures and resource-centric interface.
Creating Element using Toolbar
On the diagram toolbar (the toolbar that resides on the left of the diagram), click on the button of the element that you want to
create.
Figure 2.4 - Creating element from diagram toolbar
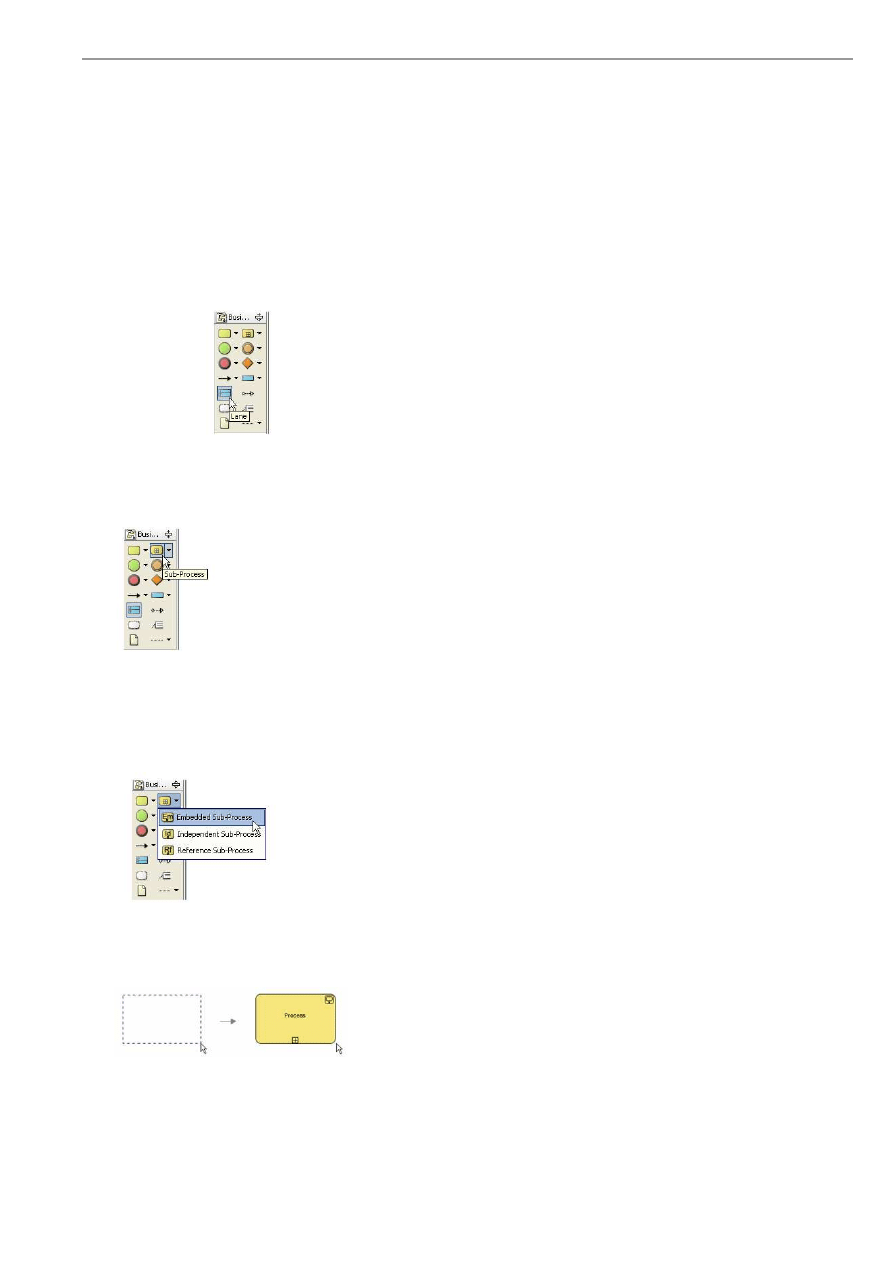
Some elements of similar nature (like different kinds of process) may be organized in a button group (indicated by a small
black triangle on the right of the button). Within a button group, only the last selected button will be visible.
Figure 2.5 - A button group
If you cannot find the desired element on the diagram toolbar, locate its button group, then click on its drop-down button. The
button group will be expanded with its elements shown in a popup menu. Just click the desired element from the popup menu
to select it. You will notice the element you have just selected from the group become the active element of the group
automatically. This means you don't have to expand the group again in order to select this element next time.
Figure 2.6 - An expanded button group
If the element to create is a shape, click once on the diagram to create it in its default size. If you want to assign an initial size
to the new shape, click on the diagram and drag the desired bounds before releasing the mouse.
Figure 2.7 - Creating an element with initial size
BP-VA User’s Guide
Chapter 2 – Drawing Business Process Diagram
2-4
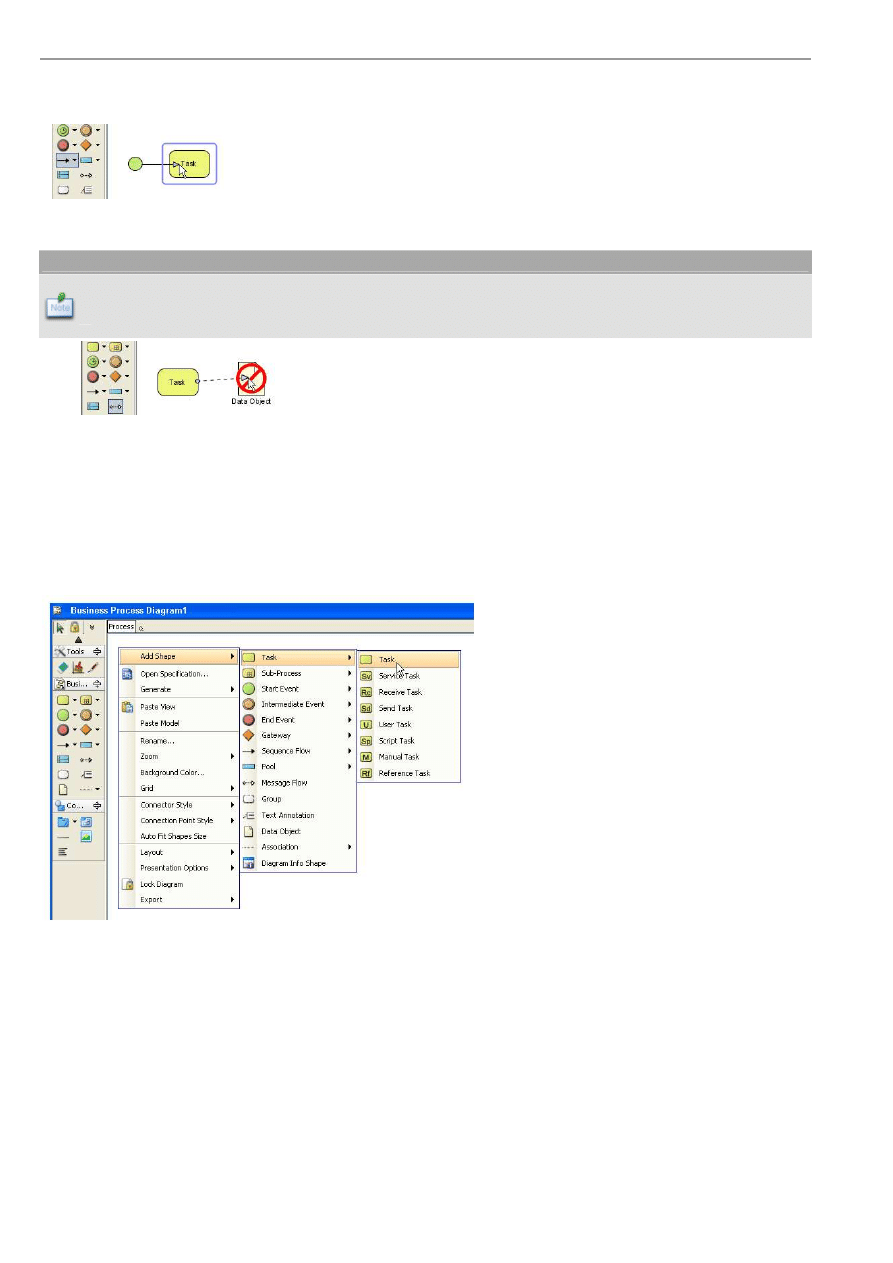
If the element to create is a connector, click on the source shape on the diagram, then drag the connector to the target shape and
release the mouse.
Figure 2.8 - Create a connector
Note
Sometimes you may notice a stop sign shows when you mouse over certain shapes while creating the
connection, this is BP-VA's connection validation on-the-fly in action, preventing you from making
connections that violate the Business Process Modeling Notation.
Figure 2.9 - Connection validation on-the-fly
Creating Element using Context Menu
Right-click on the diagram, a context menu is shown. Select the Add Shape menu to expand it. You will see a list of elements
that you can create.
Elements of similar nature are organized in a group, indicated by a sub-menu of that group (like Task, Process). You need to
expand the group sub-menu in order to select its elements.
Figure 2.10 - Creating element from context menu of diagram
For element that is not grouped (like Data Object), you can simply select its menu to create the corresponding element.
If the element selected is a shape, the shape will be created in its default size at the location you right-clicked on the diagram.
If the element selected is a connector, the corresponding button on the diagram toolbar will be selected. Then you can click on
the source shape on the diagram, drag the connector to the target shape and release the mouse to create the connection.
BP-VA User’s Guide
Chapter 2 – Drawing Business Process Diagram
2-5
Creating Element using Mouse Gesture
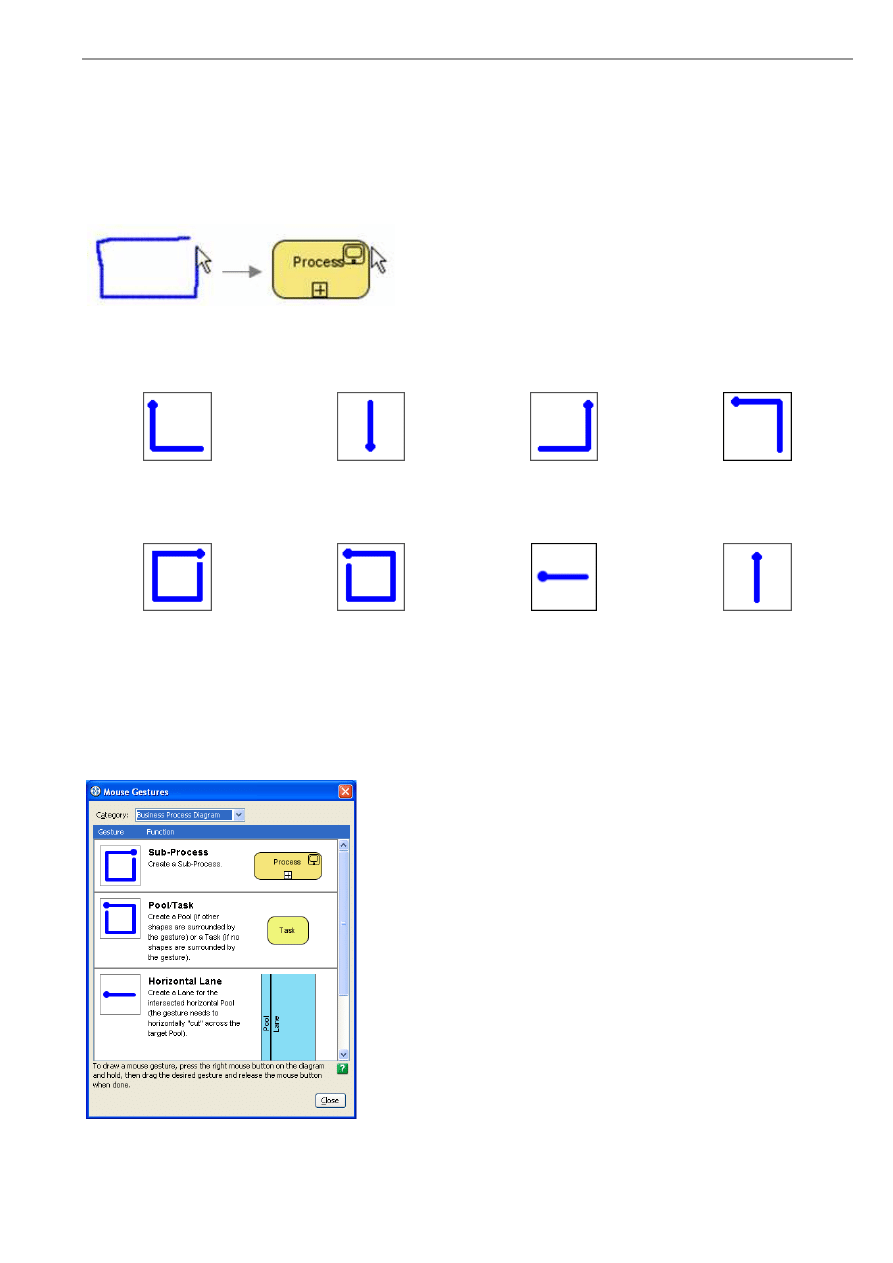
Mouse gesture allows you to create shapes quicker and more naturally by drawing gestures on the diagram to create the desired
elements. You can also invoke commands other than shape creation using mouse gestures.
To draw a mouse gesture, press the right mouse button on the diagram and hold, then drag the desired gesture and release the
mouse button when done.
Figure 2.11 - Creating element using mouse gesture
The following tables show the supported mouse gestures in BP-VA:
General Commands
Layout Diagram
Open Diagram Specification
Close Diagram
Show Diagrams Thumbnail
View
Business Process Diagram
Sub-Process
Pool/Task
Create a Pool (if other shapes
are surrounded by the gesture)
or a Task (if no shapes are
surrounded by the gesture)
Horizontal Lane
Create a Lane for the
intersected horizontal Pool
(the gesture needs to
horizontally "cut" across the
target Pool)
Vertical Lane
Create a Lane for the
intersected vertical Pool (the
gesture needs to vertically
"cut" across the target Pool)
If you forget the mouse gestures mentioned here, you can always view the supported gestures again inside BP-VA by selecting
the menu Help > Mouse Gestures....
Figure 2.12 - The Mouse Gestures dialog box
BP-VA User’s Guide
Chapter 2 – Drawing Business Process Diagram
2-6
Creating Element using Resource-Centric Interface
To make diagramming and modeling more efficient, BP-VA adopts the resource-centric interface, where context-sensitive
shortcut buttons ("resource" ) will be shown around the active diagram element. Each resource provides a functionality that
you would likely to perform frequently, like creating a connection to a new/existing shape, opening the model specification,
resizing a shape to fit.
Figure 2.13 - Resources of a shape
Mouse over on a resource, you will see its tool tip that briefly describes its functionality.
Connection Resources
For resource that is used to create a connection to a new/existing shape, its tool tip will appear in the form CONNECTOR ->
SHAPE.
Figure 2.14 - The connection resources
To create the connection, click on the resource and drag. If you release the mouse over an existing shape, the connector will be
connected to it. If you release the mouse over the empty space of the diagram, a new shape will be created.
Figure 2.15 - Creating a connection using resource
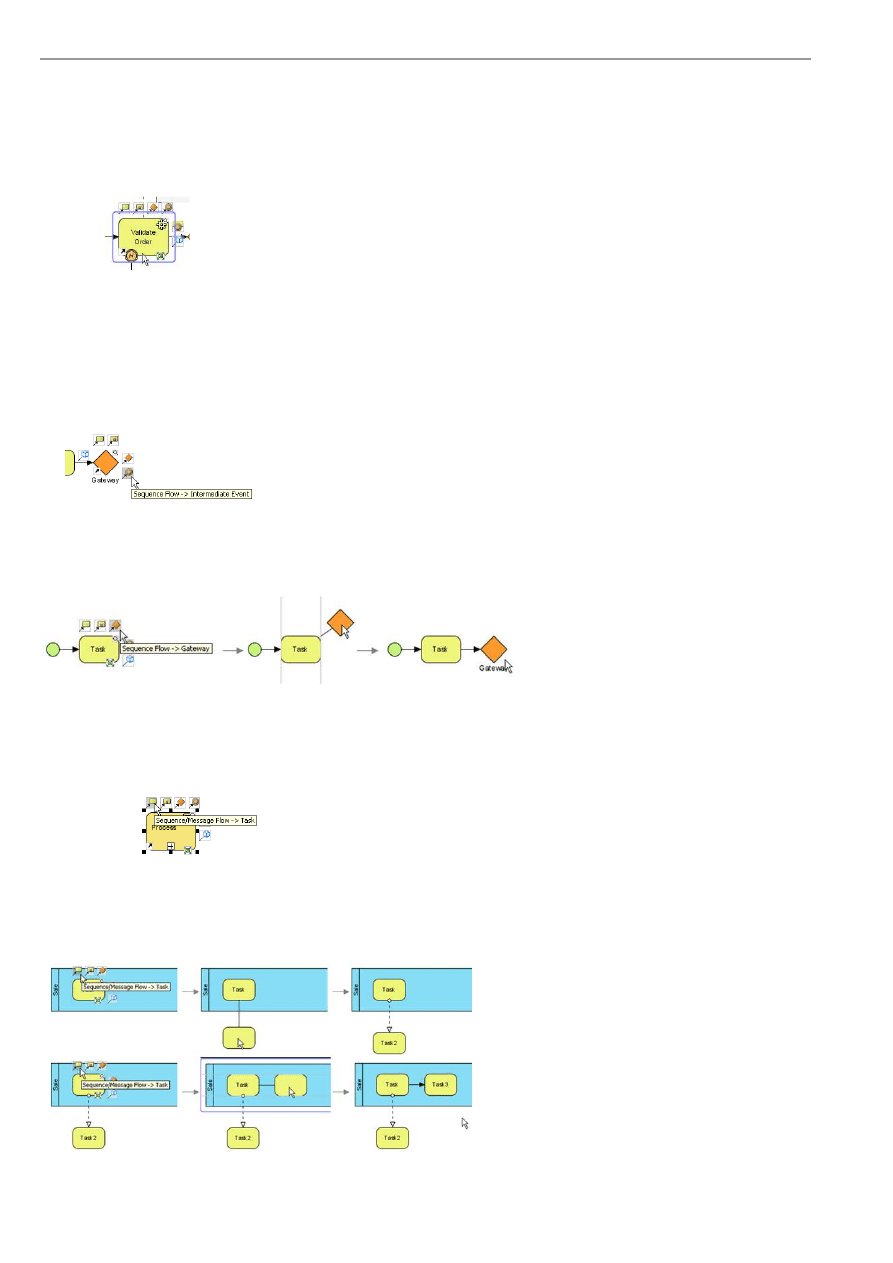
In BP-VA, resources have the intelligent to determine what kind of flow connectors (Sequence Flow/Message Flow) should be
created for the associated flow objects (Sub-Process/Task/Event/Gateway). Those resources are indicated by the tool tip
Sequence/Message Flow - > FLOW_OBJECT_NAME.
Figure 2.16 - The Sequence/Message Flow resource
Use the resource to create a connection to a new or an existing shape. If the source shape and destination shape reside on the
same Pool, a Sequence Flow will be created, or else a Message Flow will be created. This connection rule is specified by
Business Process Modeling Notation and is enforced by BP-VA resource-centric interface automatically.
Figure 2.17 - Automatic Sequence/Message Flow creation determination
BP-VA User’s Guide
Chapter 2 – Drawing Business Process Diagram
2-7
Action Resources
Some resources perform standalone actions. Examples are the Fit Size resource (resize the shape to fit) and the Open
Specification resource (open the specification dialog box of the shape). To use an action resource, single-click on it and the
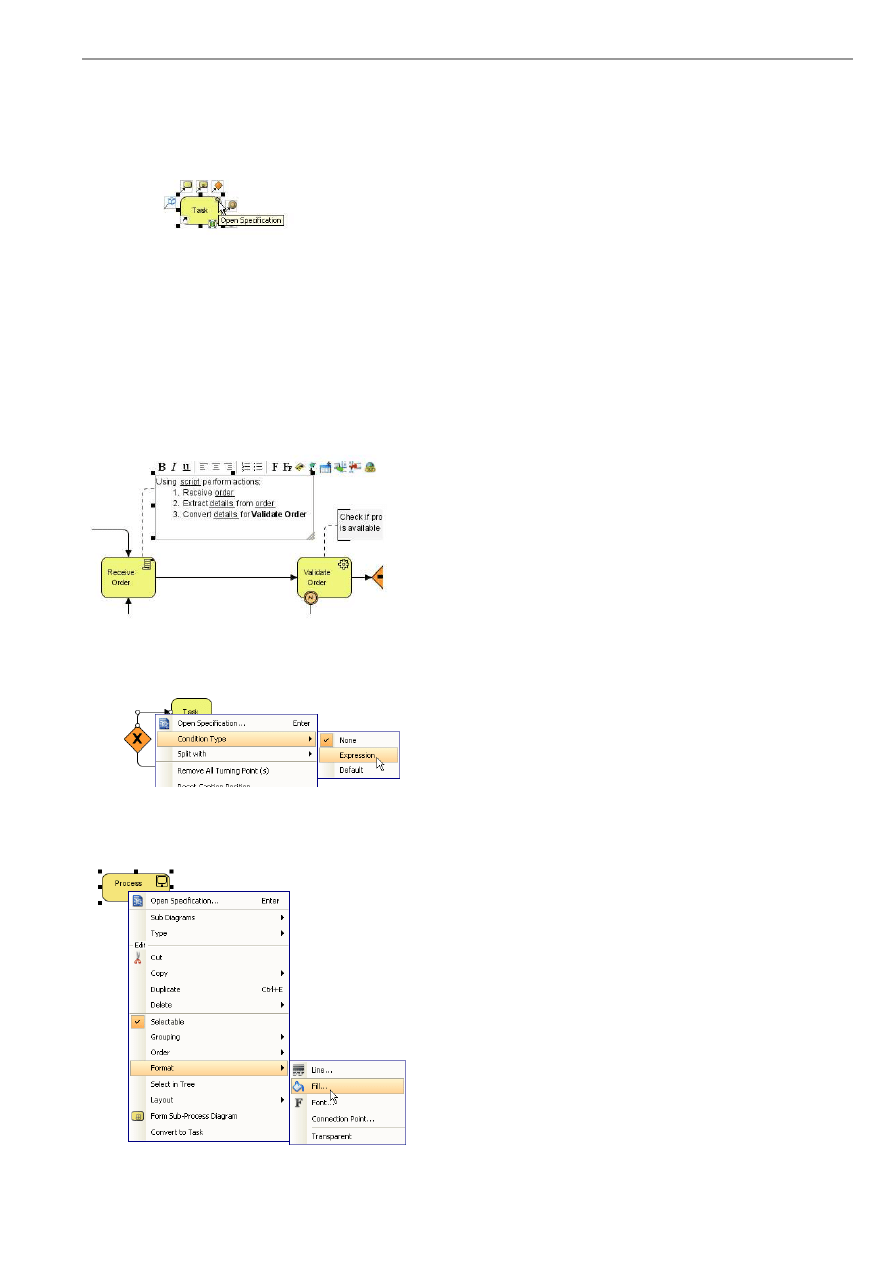
corresponding action will be performed.
Figure 2.18 - The Open Specification resource
Editing Element
In-Place Editing
In BP-VA, the renaming of all shapes can be performed directly in the diagram. Just select a shape and press
F2
, or double-
click on the shape to bring it into in-place edit mode. The diagram below shows the in-place editing of a Text Annotation.
Figure 2.19 - In-place editing of Text Annotation
Frequently modified model properties can be accessed through the element's context menu.
Figure 2.20 - Setting the condition type of a Sequence Flow
Formatting options can be changed through the context menu as well.
Figure 2.21 - Setting the Fill format of shape
BP-VA User’s Guide
Chapter 2 – Drawing Business Process Diagram
2-8
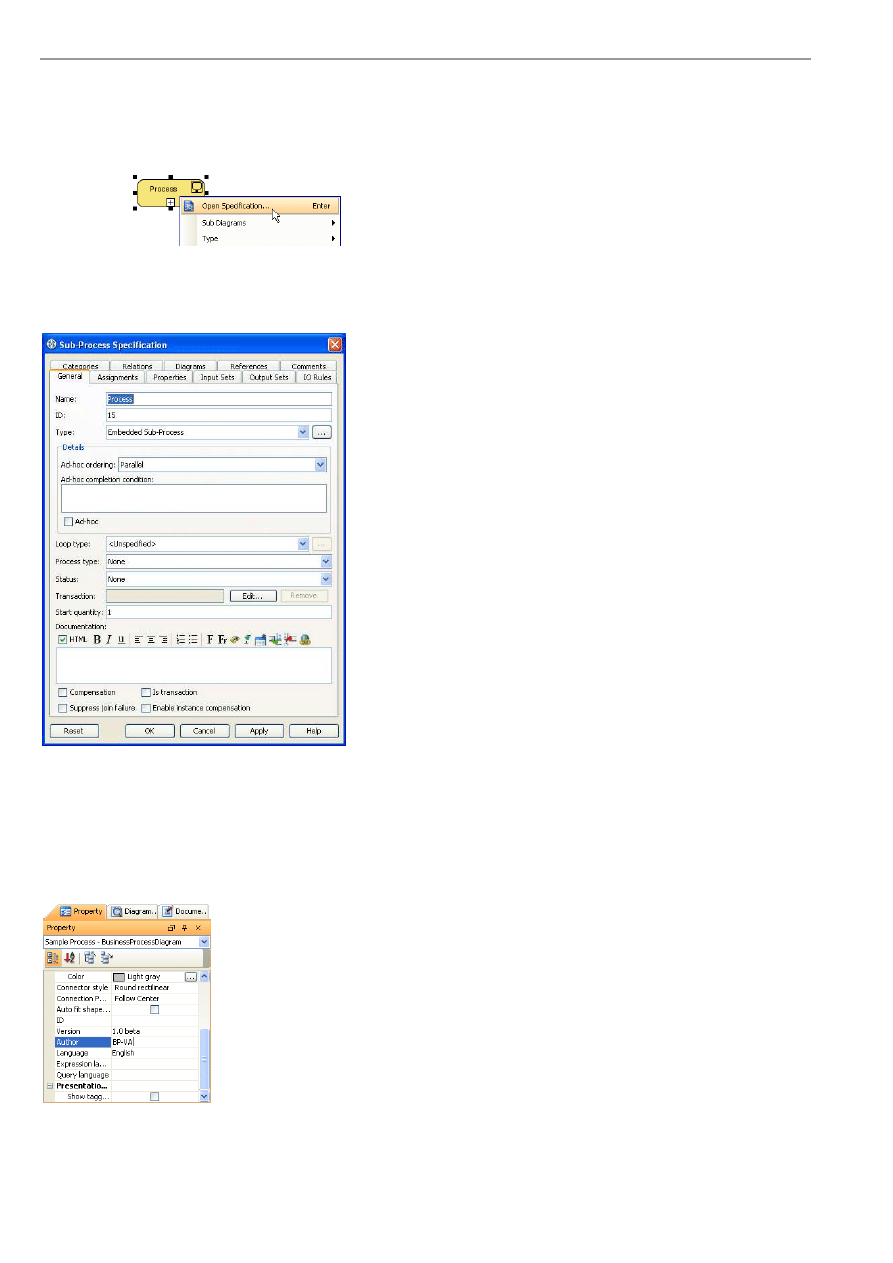
Specification Dialog Box
For detailed specification of model or diagram, right-click on the element and select Open Specification...from the context
menu.
Figure 2.22 - Opening the specification dialog box of an element
The open specification dialog box of model is organized in a tabbed view, categorizing the properties in groups. To apply the
edited properties, click Apply or OK. Click Reset if you want to revert the changes you have made.
Figure 2.23 - The Sub-Process specification
Property Pane
The Property pane shows the properties of the active diagram or the currently selected diagram elements. You can view or edit
the properties here. Both the model properties and the style or formatting of the element can be edited directly in the Property
pane.
Figure 2.24 - Property pane
BP-VA User’s Guide
Chapter 2 – Drawing Business Process Diagram
2-9
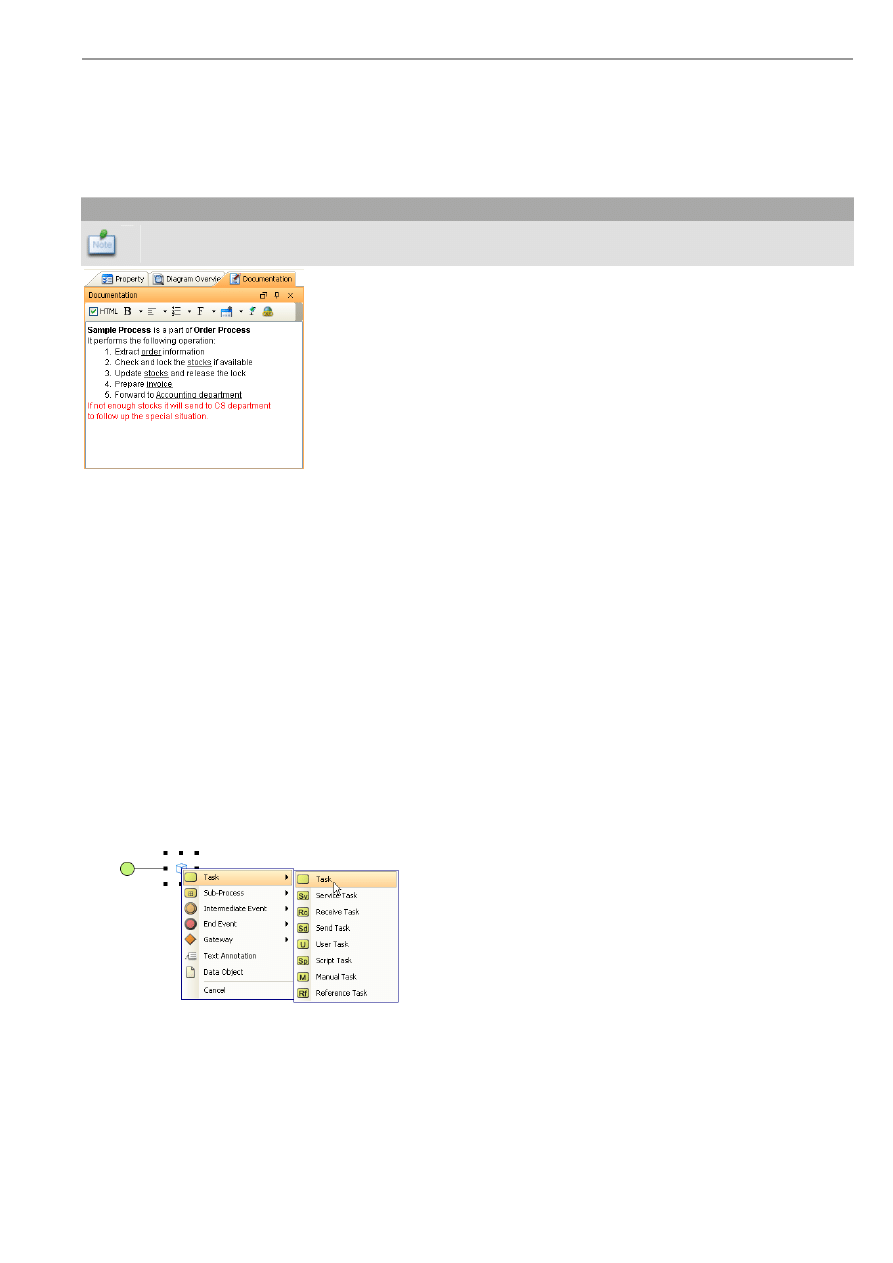
Documentation
The Documentation pane shows the documentation of the active diagram or the currently selected diagram element. You can
view or edit the documentation here. Documentation can be edited in rich text or plain text by selecting/deselecting the HTML
checkbox.
Note
The documentation format (rich text or plain text) is a project-wide option. You cannot apply rich text
documentation to one element while apply plain text documentation to another element in the same project.
Figure 2.25 - Documentation pane
Advanced Diagramming Techniques
Advanced Usages of Resource-Centric Interface
Generic Resource
Generic Resource is similar to the connection resources that we mentioned earlier in this chapter. The difference is the actual
type of the new connector and/or the new shape is not yet unknown during creation. When you release the mouse, a popup
menu will be shown for you to select the desired connector/shape type to create.
If you release the mouse over the empty space of the diagram, the possible connector types and destination shape types are
listed for selection. If the source and destination shapes are both flow objects (Sub-Process/Task/Event/Gateway), the
connector types will not be listed because the BPMN connection rule will automatically determine the correct type of Flow for
you. For example, dragging the Generic Resource of a Task, release it on the empty space of the diagram and select Task from
the popup menu, a Sequence Flow will be created if both Tasks reside on the same Pool, or else a Message Flow will be
created.
Figure 2.26 - Creating new shape using Generic Resource
If you release the mouse over an existing shape, the possible connector types between the source and the destination shapes are
shown.
BP-VA User’s Guide
Chapter 2 – Drawing Business Process Diagram
2-10
Figure 2.27 - Creating new connector using Generic Resource
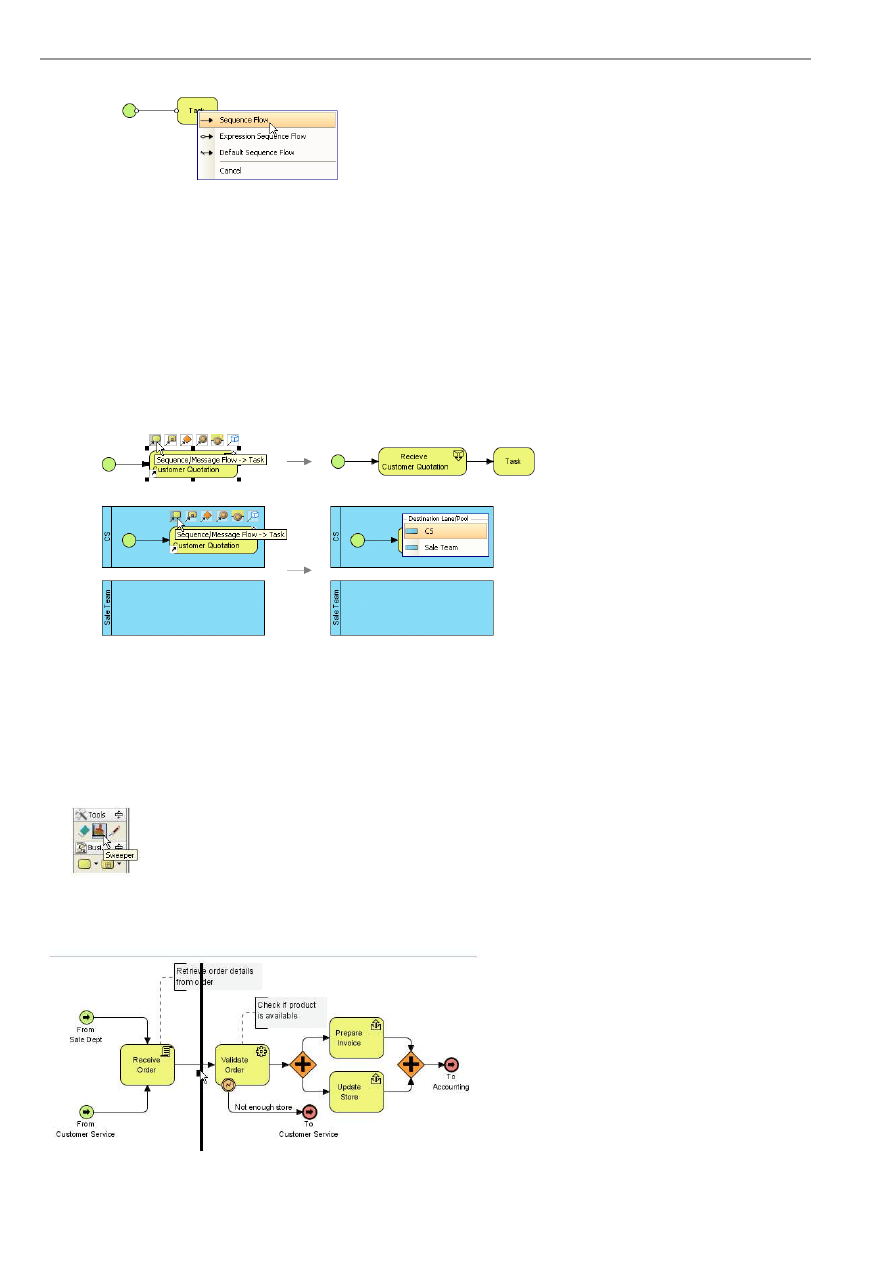
Single-Click on Connection Resource
If you click on a connection resource of a flow object (Sub-Process/Task/Event/Gateway) without dragging, there are two
possible outcomes:
•
If there is no Pool in the diagram, a new shape together with a new connector will be created whose positions are
determined by BP-VA automatically.
•
If there are one or more Pools in the diagram, a popup will be shown for selecting a Lane or Pool as the parent of the
new shape. The new shape together with a new connector will be created and positioned at the selected Lane/Pool.
Figure 2.28 - Single-click on connection resource
Sweeper
The sweeper tool allows you to align shapes interactively in the diagram, and you can use it to sweep shapes aside to make
room for new shapes without messing up the current diagram structure.
To select the sweeper tool, click on the Sweeper button on the diagram toolbar.
Figure 2.29 - Sweeper
Click on the diagram and drag to either the north, east, south or west direction, depending on what shapes you want to sweep
and where you want them to be swept to.
Figure 2.30 - Sweeping shapes
BP-VA User’s Guide
Chapter 2 – Drawing Business Process Diagram
2-11
The shapes will be swept to the direction you dragged and automatically aligned with the sweeper. If you are not satisfied with
their positions, you can drag the sweeper in the opposite direction to roll back (provided that you have not released the mouse
yet), the shapes will gradually be moved back until they reached their original positions.
Forming Sub-Process from Existing Elements
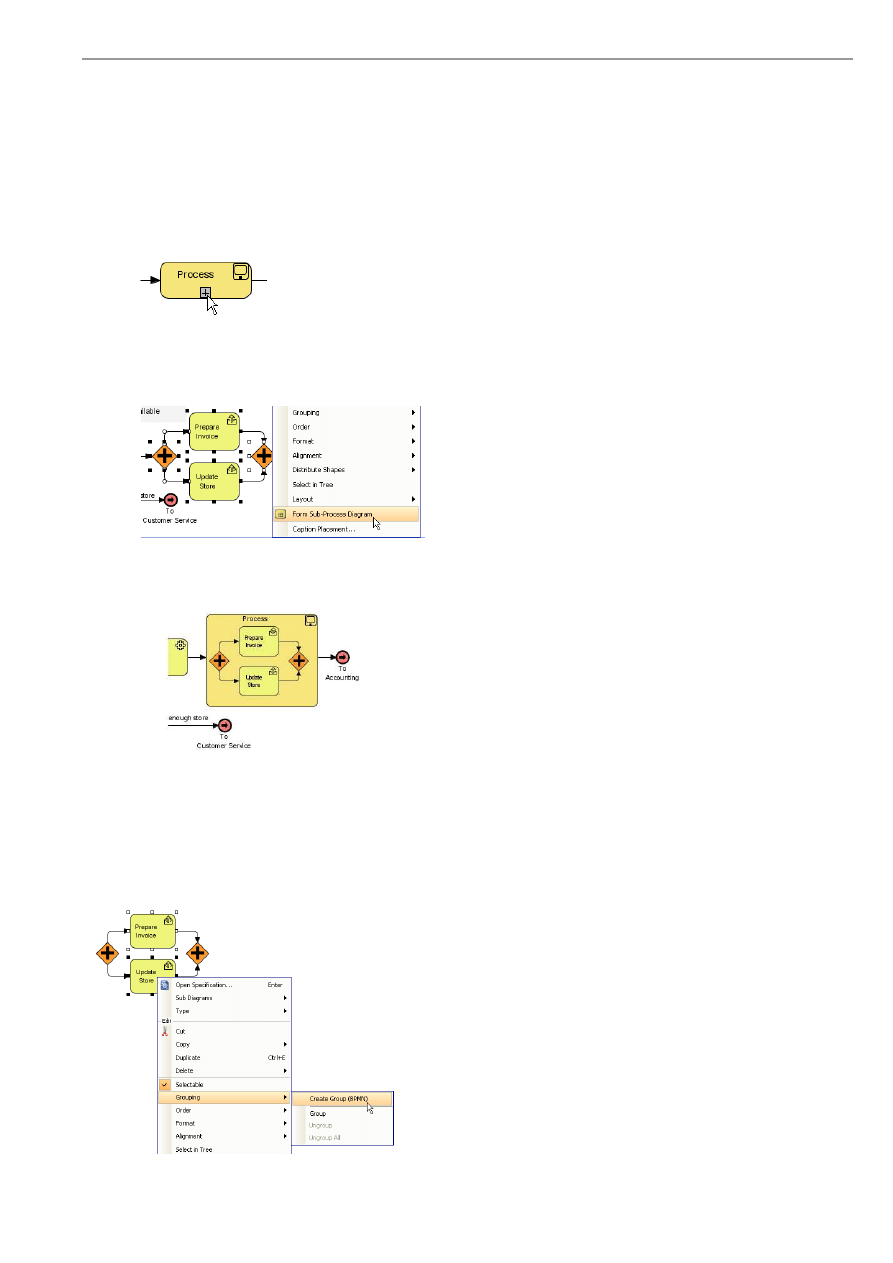
To break down a Sub-Process into lower level, normally you would create a Sub-Process and click its "+" button to expand it,
and then draw the Sub-Process Diagram.
Figure 2.31 - Expanding a Sub-Process
You can also do it in a reversed manner - create the elements first and then form a Sub-Process from it. To do this, select the
desired elements, right-click on the selection and select Form Sub-Process Diagram from the context menu.
Figure 2.32 - Forming Sub-Process diagram from selected shapes
The selected elements will be transformed to a Sub-Process diagram.
Figure 2.33 - Shapes transformed to a Sub-Process diagram
Creating Group for Existing Elements
To create group for existing elements, select the elements and right-click on the selection, select Create Group from
the context menu. The selected elements will be grouped together by a new Group shape.
Figure 2.34 - Creating group for exist elements
BP-VA User’s Guide
Chapter 2 – Drawing Business Process Diagram
2-12
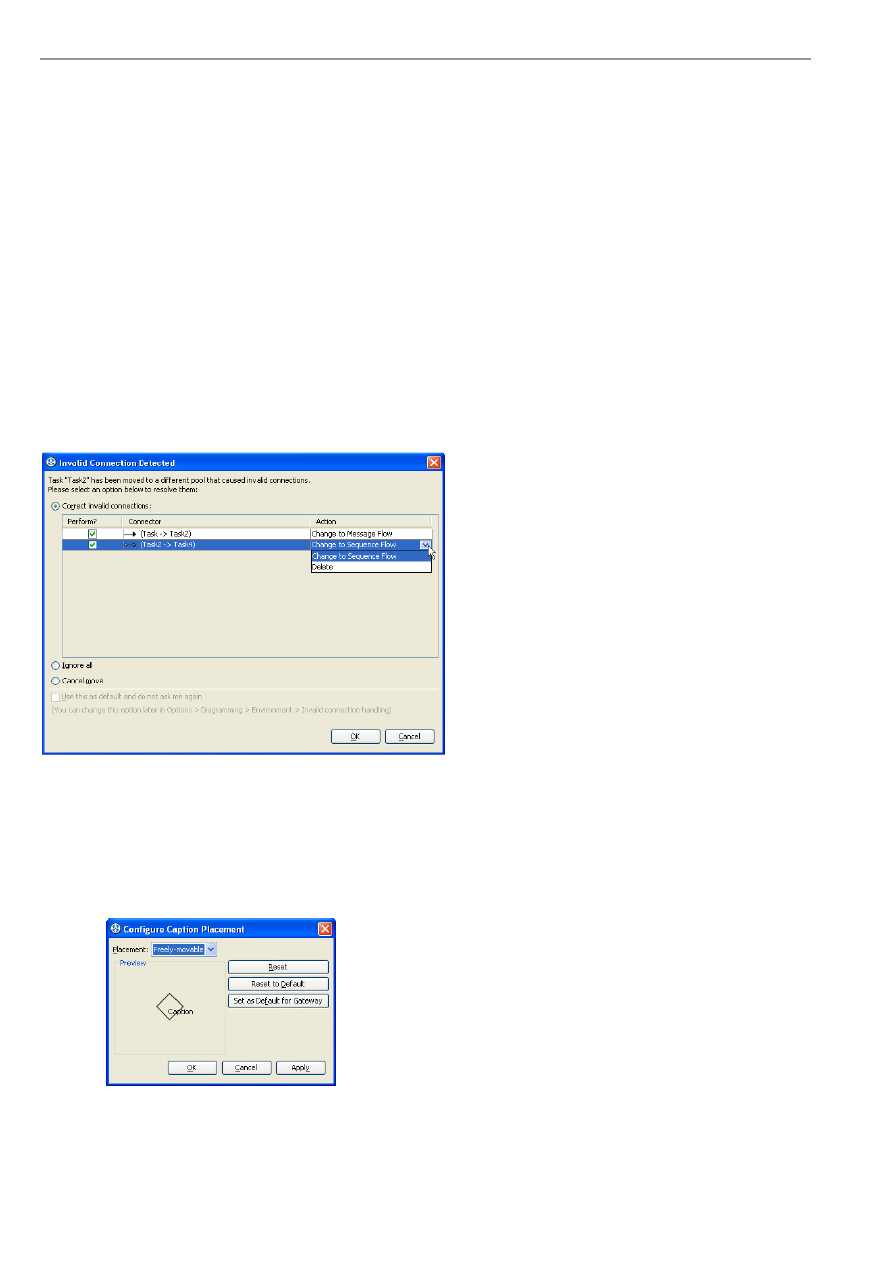
Invalid Connections Detection
To ensure you are always on the right track, BP-VA provides intelligent notation validation while you are editing the diagrams.
When shapes are moved between pools that caused invalid business flows, those invalid flows are analyzed and displayed in
the Invalid Connection Detected dialog box. To handle the problems, you can choose from one of the three options provided:
•
Correct invalid connections
The invalid connections are listed with a suggested fix beside each. Just select the desired fix in the Action column to
correct it. If you do not want a particular connection to be corrected, deselect its Perform? checkbox.
•
Ignore all
Ignore all invalid connections detected.
•
Cancel move
Cancel the move that caused the invalid connections.
After selected an option, click OK to confirm. If you click Cancel the result will be same as selected the Ignore all option.
Figure 2.35 - The Invalid Connection Detected dialog box
Choosing Different Caption Placements
In BP-VA, Events, Gateways and Data Objects can be set to have different caption placement styles.
To change the caption placement of a shape, right-click on it and select Caption Placement... from the context menu. The
Configure Caption Placement dialog box shows.
Figure 2.36 - The Configure Caption Placement dialog box
Select the desired caption placement in the Placement combo box, the shape in the Preview pane will be updated accordingly.
Click OK or Apply to apply the change, or click Reset to revert.
BP-VA User’s Guide
Chapter 2 – Drawing Business Process Diagram
2-13
If you want new shapes of the same type to apply the currently selected caption placement from now on, click Set as Default
for SHAPE_TYPE. To restore the caption placement back to the default value that you have set before, click Reset to
Default.
Note
You can click and drag to move the caption of an Event/Gateway/Data Object only when its caption
placement is set to Freely-movable.
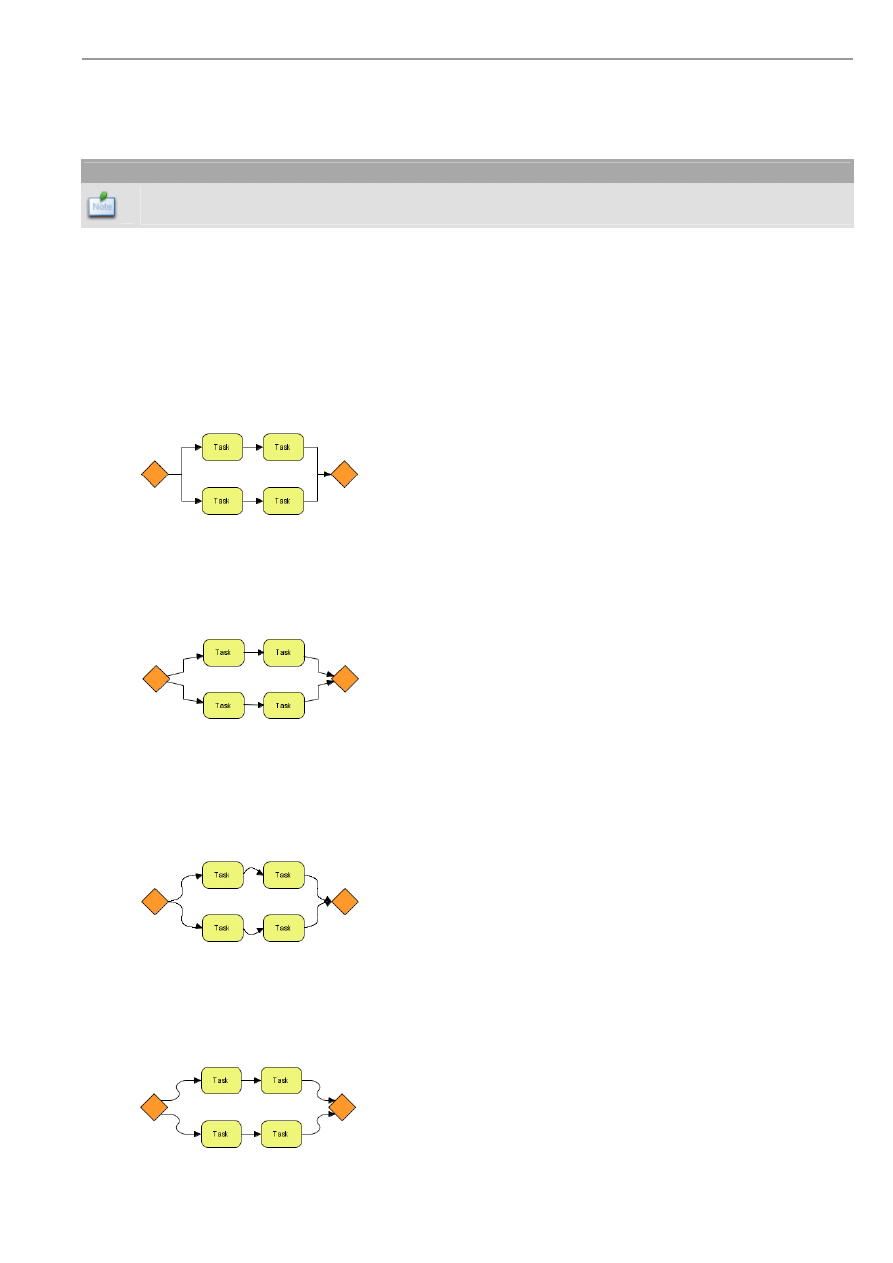
Choosing Different Connector Styles
BP-VA comes with a wide range of connector styles that you can choose from.
•
Rectilinear
With the Rectilinear connector style, connectors always remain either horizontal or vertical. After you drag the
connector to reshape it, the connector style will re-calculate the required turning points to keep the lines in horizontal
or vertical position.
Figure 2.37 - Rectilinear
•
Oblique
With the Oblique connector style, connectors can be dragged freely to create the desired turning points.
Figure 2.38 - Oblique
•
Curve
With the Curve connector style, the intermediate lines between points will be calculated as smooth curves. You can
drag its turning points to change the style of the curve.
Figure 2.39 - Curve
•
Round Oblique
Similar to the Oblique connector style, with the different that the corners of the turning points will appear rounded.
Figure 2.40 - Round Oblique
BP-VA User’s Guide
Chapter 2 – Drawing Business Process Diagram
2-14
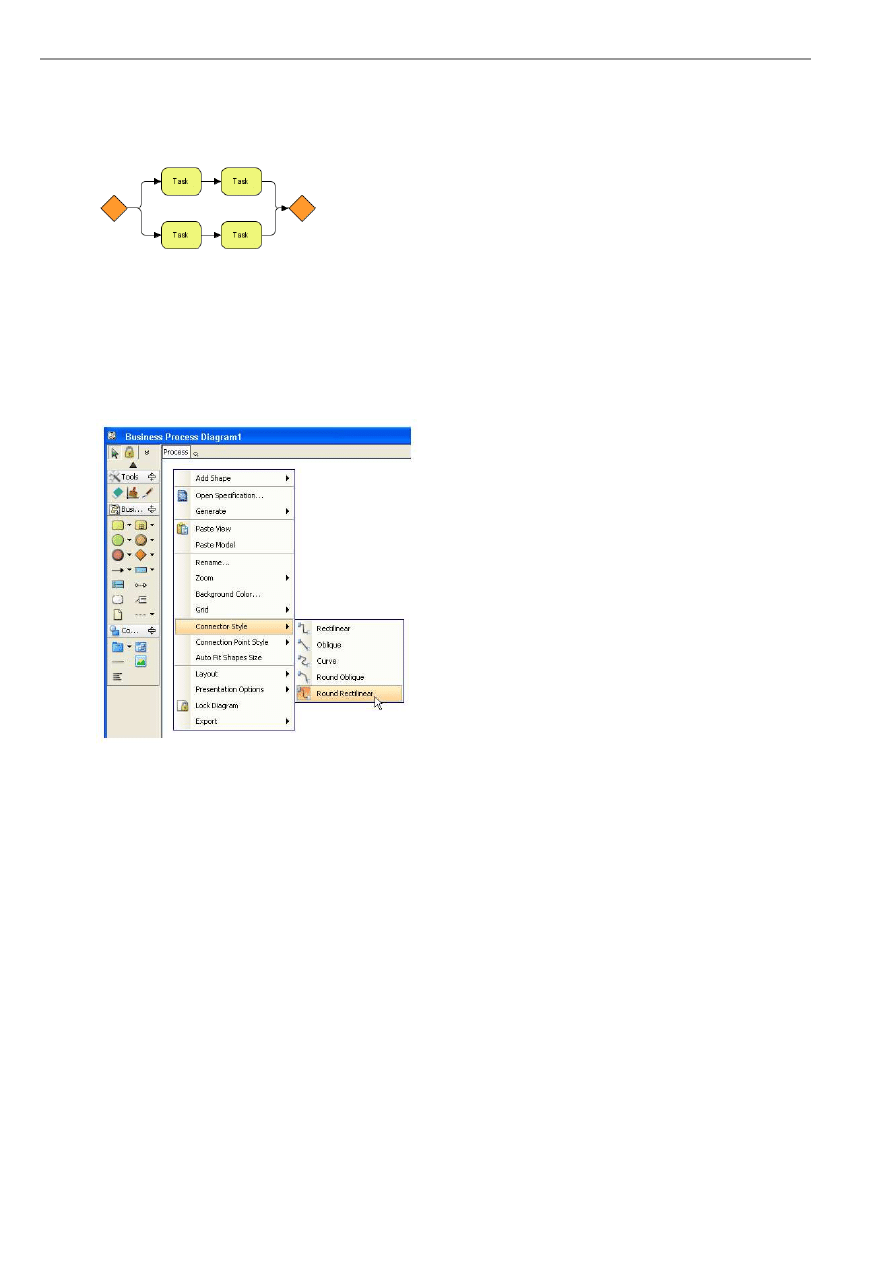
•
Round Rectilinear
Similar to the Rectilinear connector style, with the different that the corners of the turning points will appear rounded.
This is the default connector style for Business Process Diagram.
Figure 2.41 - Round Rectilinear
Choosing Connector Style for Diagram
To choose a connector style for diagram, perform one of the following actions:
•
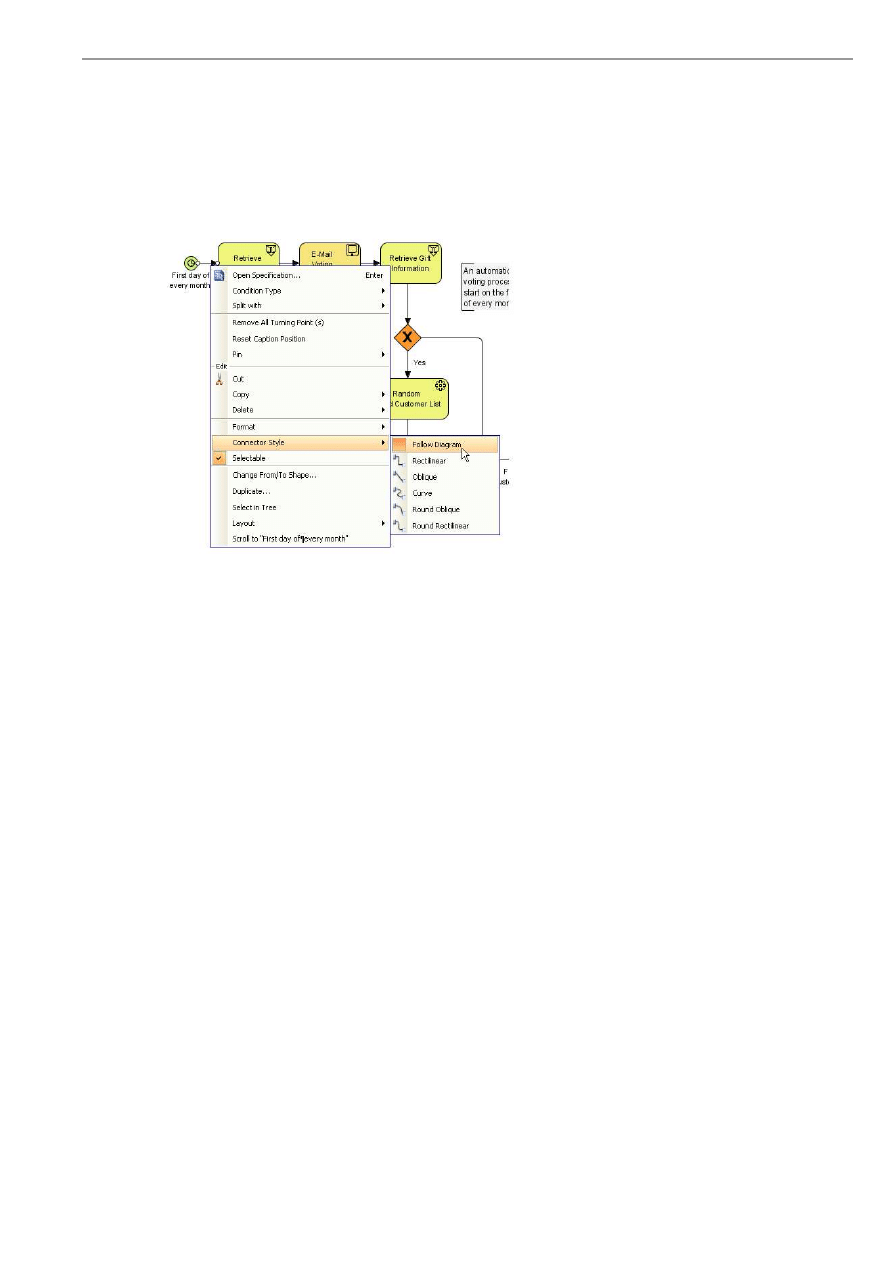
Right-click on the diagram and select Connector Style from the context menu.
Figure 2.42 - Setting the connector style of diagram
•
Click on the empty space of the diagram, click on the value cell of the Connector style property in the Property pane.
After the connector style of a diagram is changed, all connectors whose connector styles that set to Follow Diagram
will follow.
BP-VA User’s Guide
Chapter 2 – Drawing Business Process Diagram
2-15
Choosing Connector Style for Connector
To choose a connector style for connector, perform one of the following actions:
•
Right-click on the connector and select Connector Style from the context menu.
•
Select the connector, click on the value cell of the Connector style property in the Property pane.
Figure 2.43 - Setting the connector style of the selected connector
This overrides the connector style of its diagram. To let the connector follows the connector style of its diagram, select the
Follow Diagram connector style.
Changing Styles and Formatting
Fill Color
All of the shapes have a fill color property, which allows you to select a solid fill color or a gradient fill color and you can
define its transparency as well.
To format fill color for shapes, select the desired shapes and perform one of the following actions:
•
Right-click on the selection and choose Format > Fill...from the context menu.
•
From the Property pane, click on the ...button of the Fill property to invoke the Format Fill Color dialog box.
In both cases, the Format Fill Color dialog box will be displayed.
BP-VA User’s Guide
Chapter 2 – Drawing Business Process Diagram
2-16
Format Fill Color Dialog Box
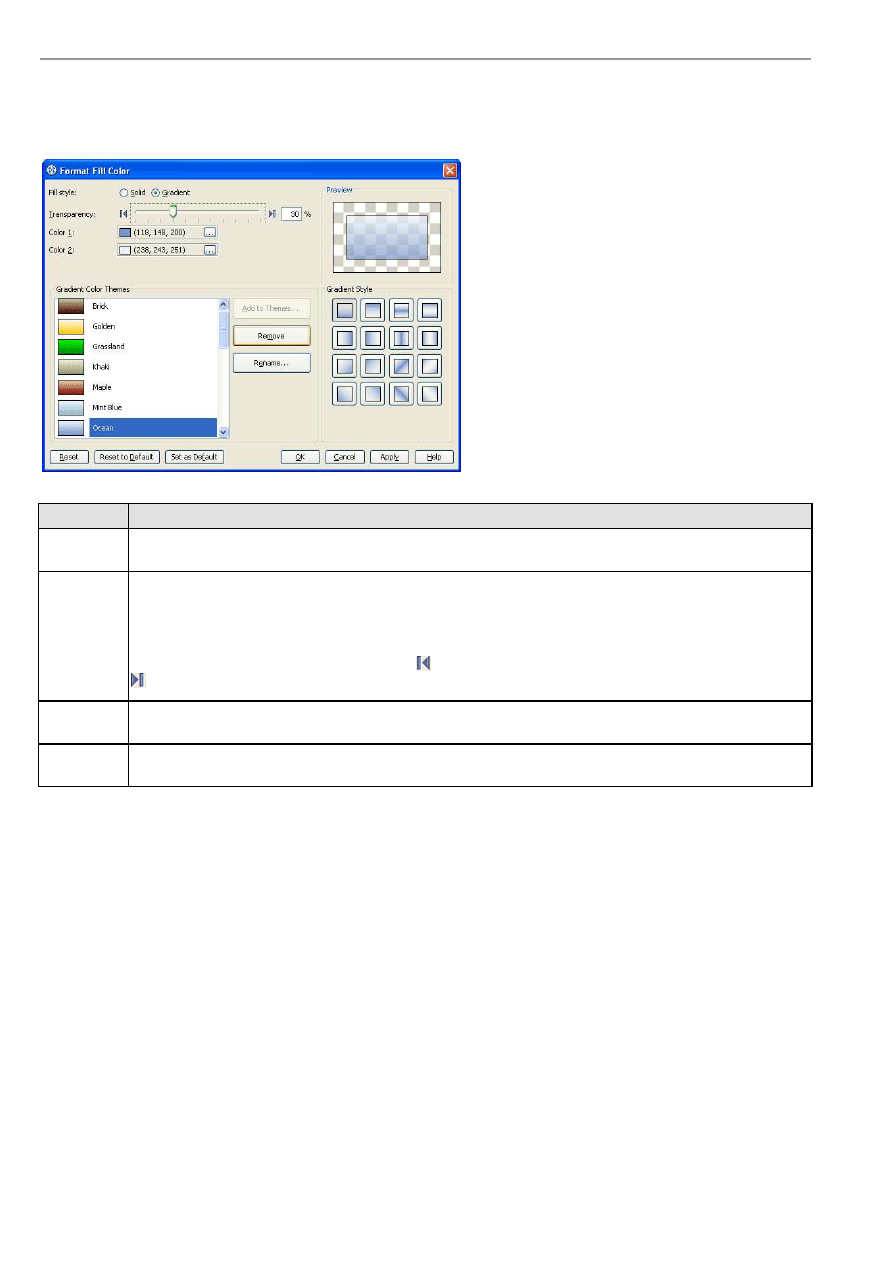
The Format Fill Color dialog box allows you to select the fill color type (solid or gradient) and you can create your own fill
color by configuring the transparency, gradient style and colors.
Figure 2.44 - The Format Fill Color dialog box
Field
Description
Fill style
Select the fill style of the fill color. It can either be Solid (a single color) or Gradient (a fill color that is mixed
by two colors).
Transparency
Specify the transparency of the fill color. The greater the value, the more transparent is the shape. A
transparency of 0 (zero) makes the fill color completely opaque, while a transparency of 100 makes the fill color
completely transparent.
You can adjust the transparency by dragging the slider, or by typing the value in the text field.
Alternatively, you can click the Opaque button
to set the fill color to opaque, or click the Transparent button
to set the fill color to transparent.
Preview
The Preview pane displays a rectangle that is filled with the editing fill color. The background is filled with
checkers so that you can preview the transparency of the fill color as well.
Set as
Default
Save the current fill color as the default fill color for new shapes.
Table 2.1
BP-VA User’s Guide
Chapter 2 – Drawing Business Process Diagram
2-17
Formatting a Solid Fill Color
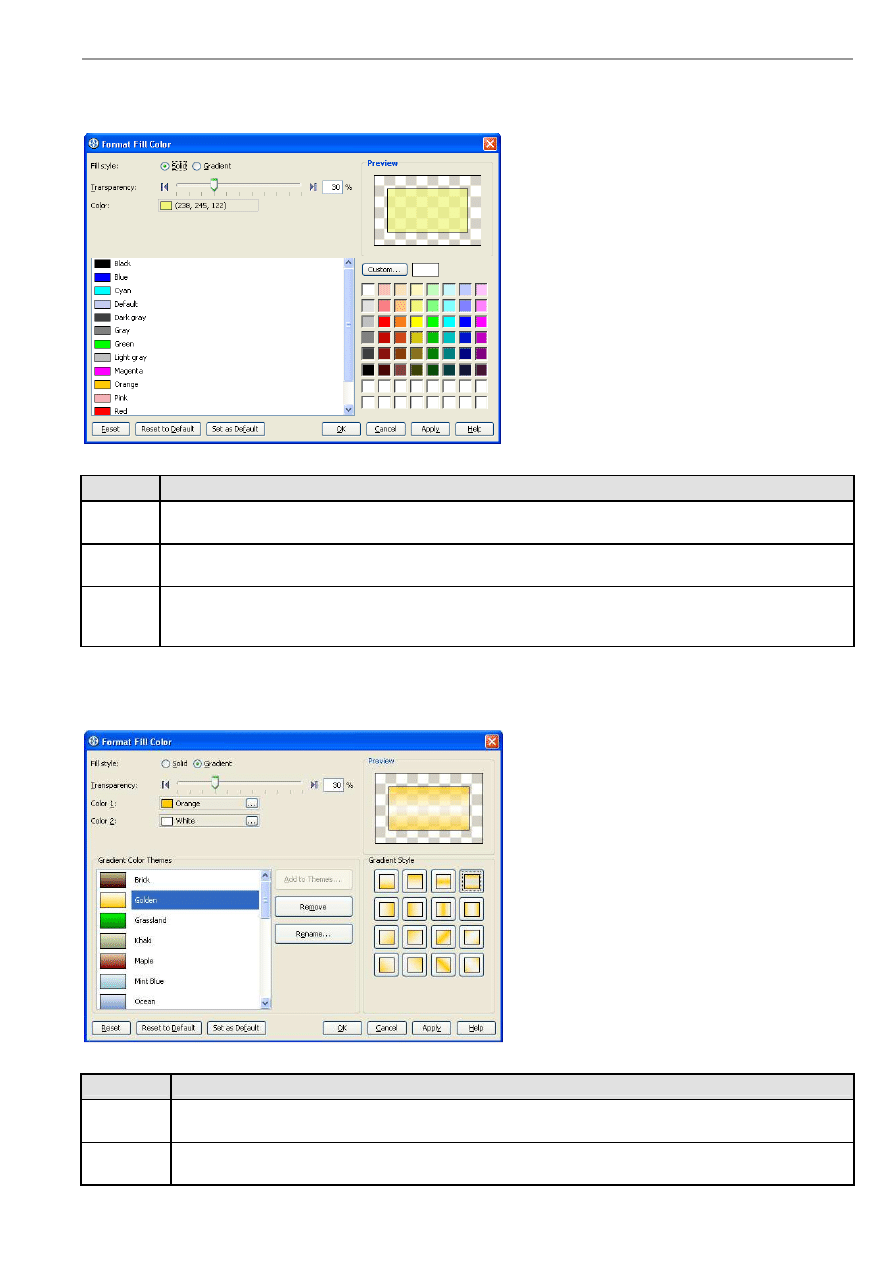
Upon selecting Solid from the Fill style field, you will see the detail pane for formatting a solid fill color.
Figure 2.45 - Formatting a solid fill color
Field
Description
Color
This field displays the currently selected color. It will display the color name if the selected color is a default color
(Black, White, Yellow, etc); otherwise the RGB value of the selected color will be displayed.
Default
Color List
The default color list displays a list of pre-defined colors. Each color is displayed with a color preview and a color
name. You can view the RGB value of a color by moving the mouse pointer over the color.
Custom
Color Pane
The custom color pane display a wider range of colors that you can select from. And you can define a new custom
color by clicking on the Custom... button. The newly defined color will be added to the recent color list (located
at the bottom two rows of the custom color pane) for later reuse.
Table 2.2
Formatting a Gradient Fill Color
Upon selecting Gradient from the Fill style field you will see the detail pane for formatting a gradient fill color.
Figure 2.46 - Formatting a gradient fill color
Field
Description
Color 1
You can select the first color of the gradient from the Color 1 field. To select a color click the ...button or
double-click on the color editor. A color chooser will appear for you to select a color.
Color 2
You can select the second color of the gradient from the Color 2 field. To select a color click on the ...button or
double-click on the color editor. A color chooser will appear for you to select a color.
BP-VA User’s Guide
Chapter 2 – Drawing Business Process Diagram
2-18
Gradient
Color
Themes
The Gradient Color Themes pane displays a list of pre-defined gradient color themes.
To add a new color theme select Color 1 and Color 2 then click the Add to Themes... button. Please note that
you must select a combination of colors that does not already exist in the color themes.
To rename a theme click on the Rename... button or double-click on the desired theme. An input dialog box
will appear for you to enter a new name.
To remove a theme select the theme and click on the Remove button, or press the Delete key.
Gradient
Style
The Gradient Style pane allows you to select the gradient style of the gradient fill color (the angle of how the
gradient color is drawn). There are sixteen pre-defined gradient styles, which are shown as toggle buttons in the
Gradient Style pane. To select a gradient style to use click on one of the styles.
Table 2.3
Shape Line Format
You can format the line of a shape so that you can adjust its stroke style, weight (thickness), color and transparency.
To format the line of a shape, select the desired shapes and perform one of the following actions:
•
Right-click on the selection and choose Format > Line... from the context menu.
•
From the Property pane, click on the ... button of the Line property to invoke the Format Line dialog box.
In both cases, the Format Line dialog box will be displayed.
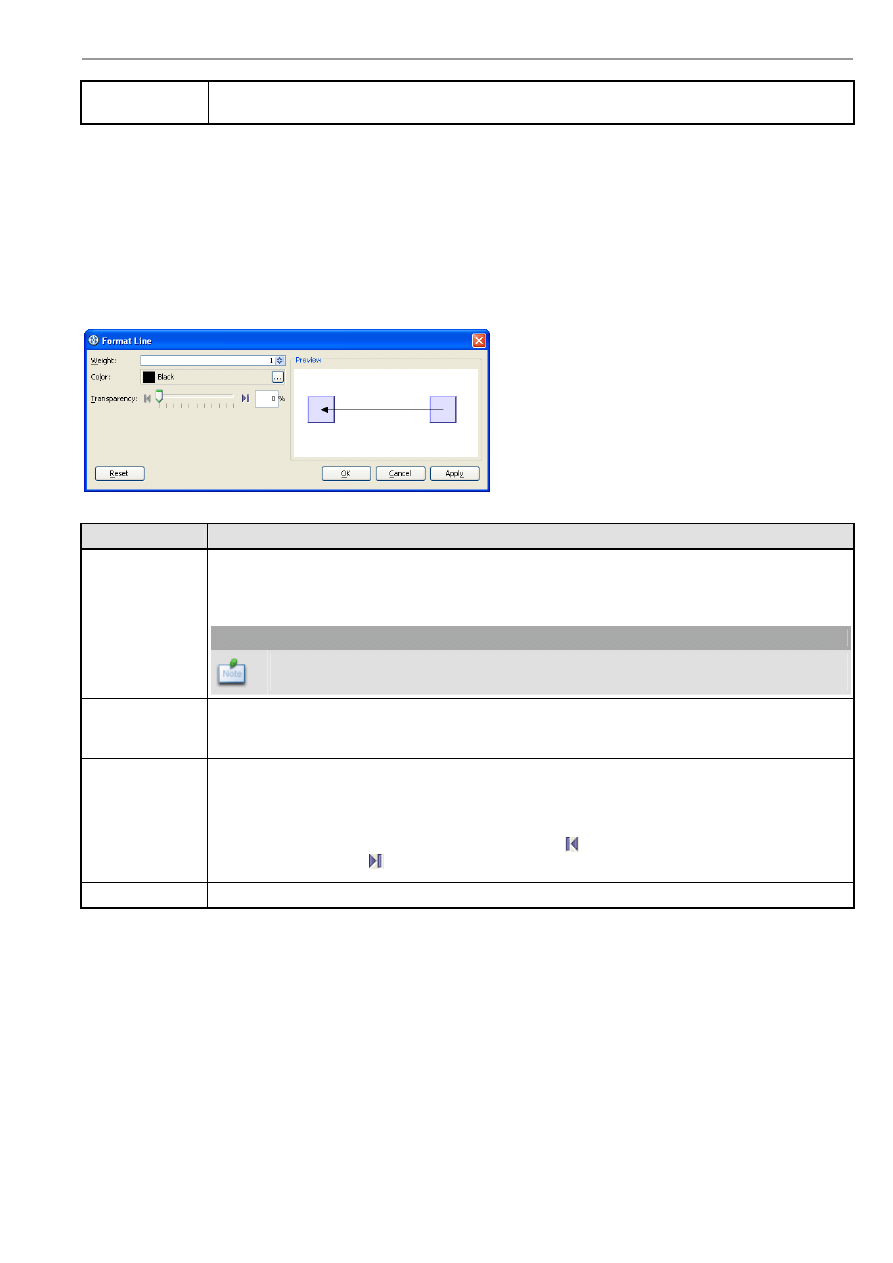
Format Line Dialog Box
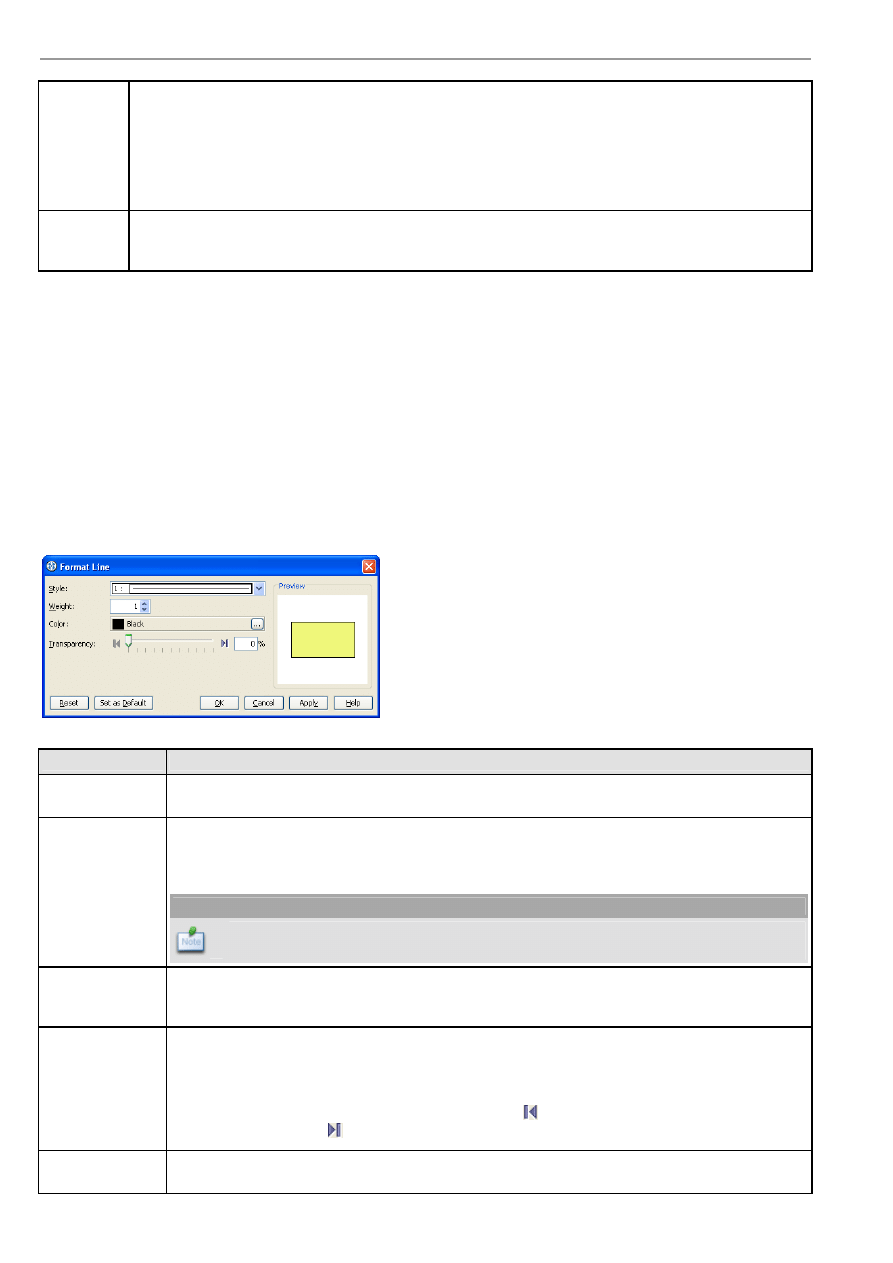
The Format Line dialog box allows you to format the line of a shape.
Figure 2.47 - The Format Line dialog box
Field
Description
Style
Select the style (stroke) of the line. You can select from one of the 23 styles (including "None" , which
means no line) to apply in the combo box, a preview will be shown for each of the style item.
Weight
Adjust the weight (thickness) of a line. The greater the value, the thicker is the line. You can use the
up/down button to increase/decrease the line weight, or you can type directly in the text field. The
allowable line weight ranges from 1 to 20.
Note
Only integer values can be used for line weight. If you type 2.8 in the text field, 2 will
be applied instead.
Color
Specify the line color. Just click on the ...button beside the Color field to select a color either from
the Default page (which shows predefined colors) or from the Custom page (which shows a larger
variety of colors, and allows you to define any custom colors).
Transparency
Specify the transparency of the line. The greater the value, the more transparent is the shape. A
transparency of 0 (zero) makes the fill color completely opaque, while a transparency of 100 makes
the fill color completely transparent.
You can adjust the transparency either by dragging the slider, or by typing the value in the text
field. Alternatively you can click on the Opaque button
to set the line color to opaque, or click on
the Transparent button
to set the line color to transparent.
Preview
The Preview pane displays a rectangle that is surrounded by the line with the selected line format
applied.
BP-VA User’s Guide
Chapter 2 – Drawing Business Process Diagram
2-19
Set as
Default
Save the current line format as the default line format for new shapes.
Table 2.4
Connector Line Format
You can format the line of a connector so that you can adjust its weight (thickness), color and transparency.
To format the line of a connector, select the desired connector, right-click on the selection and choose Format > Line...from
the context menu. The Format Line dialog box will be displayed.
Format Line Dialog Box
The Format Line dialog box allows you to format the line of a connector.
Figure 2.48 - The Format Line dialog box
Field
Description
Weight
Adjust the weight (thickness) of a line. The greater the value, the thicker is the line. You can use the
up/down button to increase/decrease the line weight, or you can type directly in the text field. The
allowable line weight ranges from 1 to 20.
Note
Only integer values can be used for line weight. If you type 2.8 in the text field, 2 will
be applied instead.
Color
Specify the line color. Just click on the ...button beside the Color field to select a color either from
the Default page (which shows predefined colors) or from the Custom page (which shows a larger
variety of colors, and allows you to define any custom colors).
Transparency
Specify the transparency of the line. The greater the value, the more transparent is the shape. A
transparency of 0 (zero) makes the line completely opaque, while a transparency of 100 makes the
line completely transparent.
You can adjust the transparency either by dragging the slider, or by typing the value in the text
field. Alternatively you can click on the Opaque button
to set the line color to opaque, or click on
the Transparent button
to set the line color to transparent.
Preview
The Preview pane displays how the connector will look like with the selected line format applied.
Table 2.5
BP-VA User’s Guide
Chapter 2 – Drawing Business Process Diagram
2-20
Incorporating User-Defined Images
Image Shape is a utility for displaying an image on any diagrams, and it can also act as a link to a file. With Image Shape, you
can easily add images to document and annotate important ideas in the diagram.
Figure 2.49 - Image Shape
Like standard shapes in BP-VA, an Image Shape can be connected to other shapes (via Generic Connector) and can have a
caption.
Note
•
The caption of Image Shape is empty by default; just double-click on it to edit the caption.
•
The caption of Image Shape is freely movable.
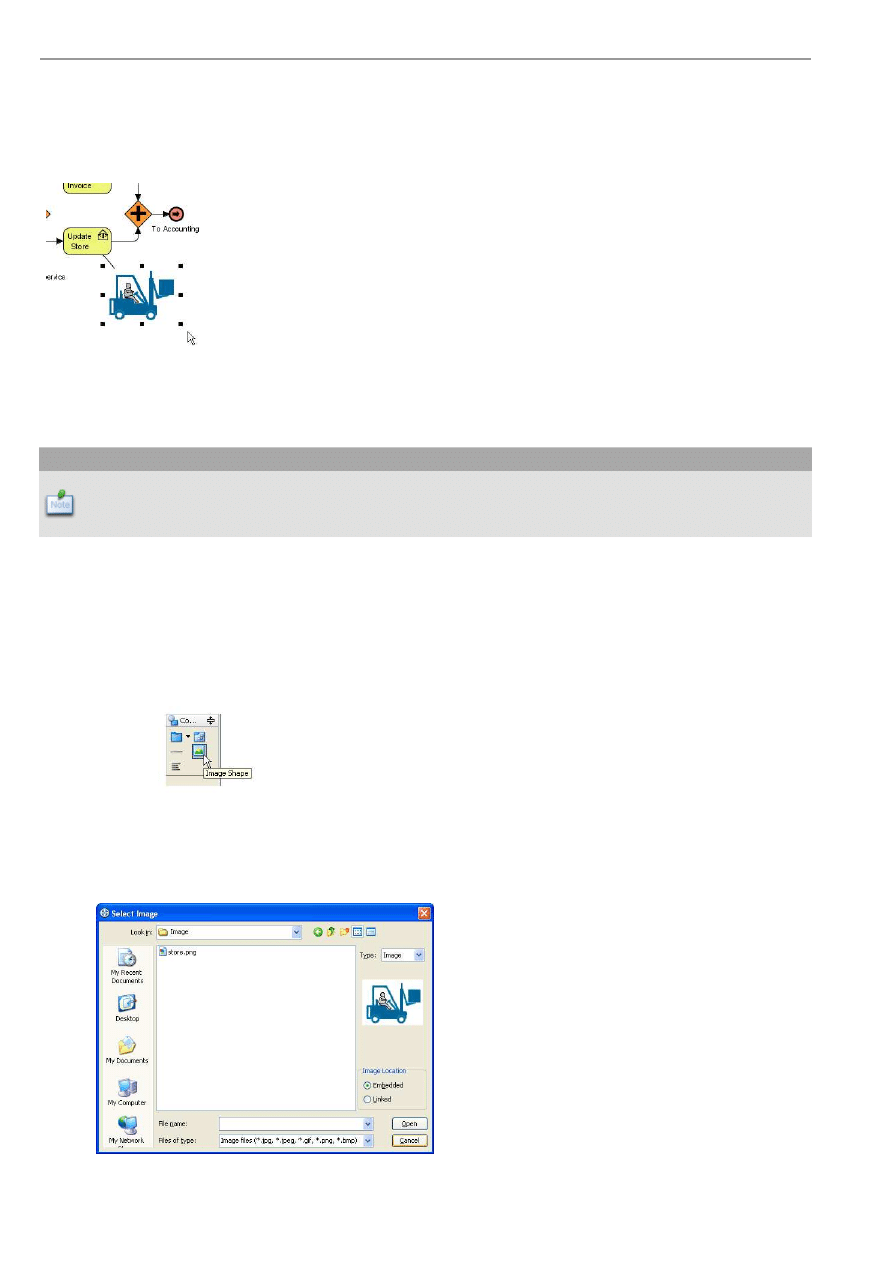
Creating Image Shapes
You can either create an Image Shape using the diagram toolbar, by copy and paste, or by drag and drop.
Creating Image Shapes using Diagram Toolbar
1.
Click on the Image Shape button on the diagram toolbar.
Figure 2.50 - The Image Shape button
2.
Click on the diagram, an Image Shape is created and a file dialog shows for selecting an image. Upon selecting an
image, its preview is shown on the right of the dialog box.
Figure 2.51 - Selecting image for an Image Shape
BP-VA User’s Guide
Chapter 2 – Drawing Business Process Diagram
2-21
3.
In the Image Location group, select an option:
Embedded - The source image will be copied and embedded into the project, which means any modification to or
removal of the source image will not affect the image in this Image Shape.
The advantage of using embedded image is the image remains even when the source image no longer exists; while the
disadvantage is the project file size will grow since images are copied to the project, and the embedded image cannot
update when the source image is updated.
Linked - The Image Shape links the source image for display, which means any modification to or removal of the
source image will also be reflected in this Image Shape.
The advantage of using linked image is the project file size will not grow since images are just linked but not copied
to the project, and the image in the Image Shape will update when the source image is updated; while the
disadvantage is the image will lost when the source image no longer exists.
4.
After selecting the image location option, click Open to confirm.
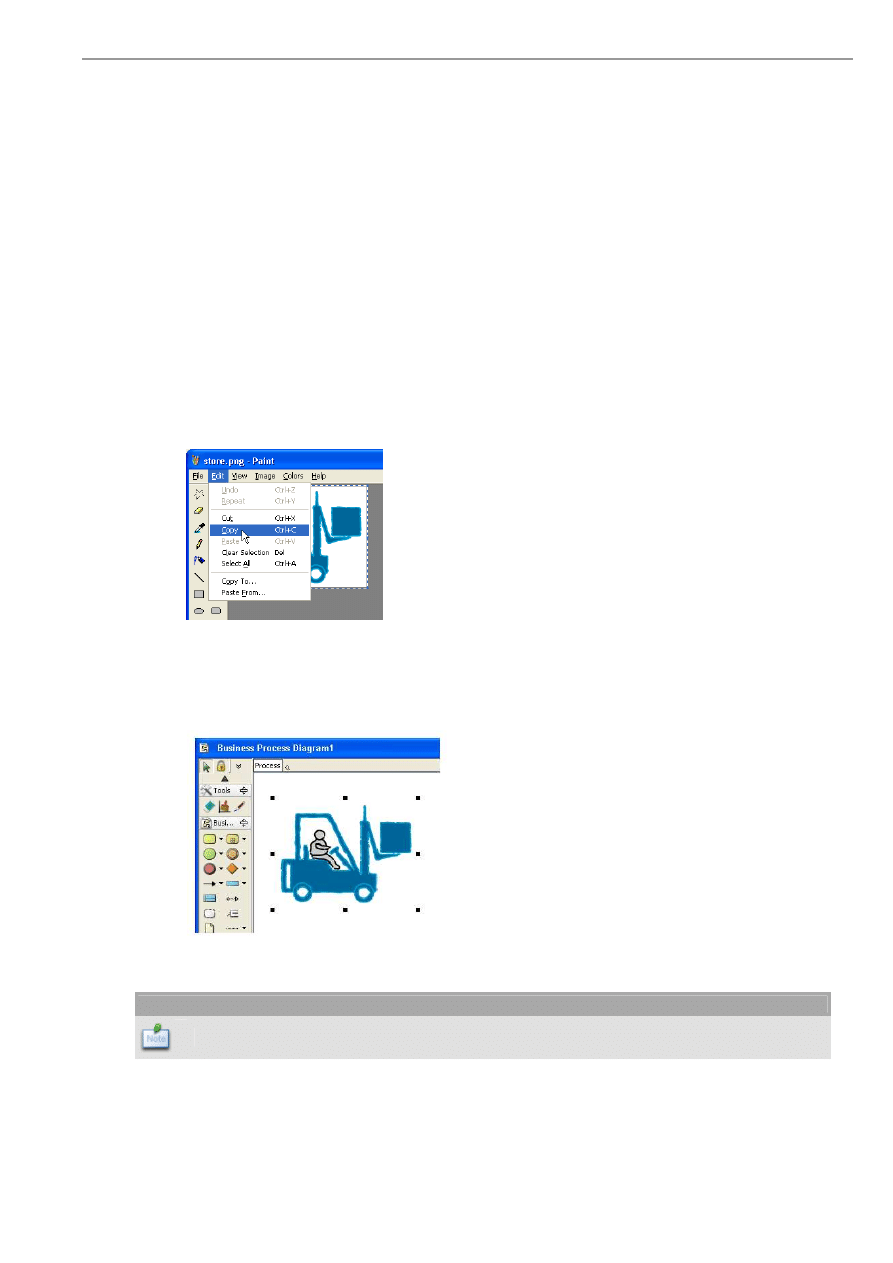
Creating Image Shapes by Copy and Paste
1.
Copy an image to the clipboard
Figure 2.52 - Copying an image to the clipboard
2.
Switch to BP-VA, open a diagram, select menu Edit > Paste or use hotkey
Ctrl+V
. An image shape is created with
the copied content.
Figure 2.53 - Image Shape created by paste from clipboard
Note
The image location of the Image Shape created by copy and paste will be set to Embedded.
BP-VA User’s Guide
Chapter 2 – Drawing Business Process Diagram
2-22
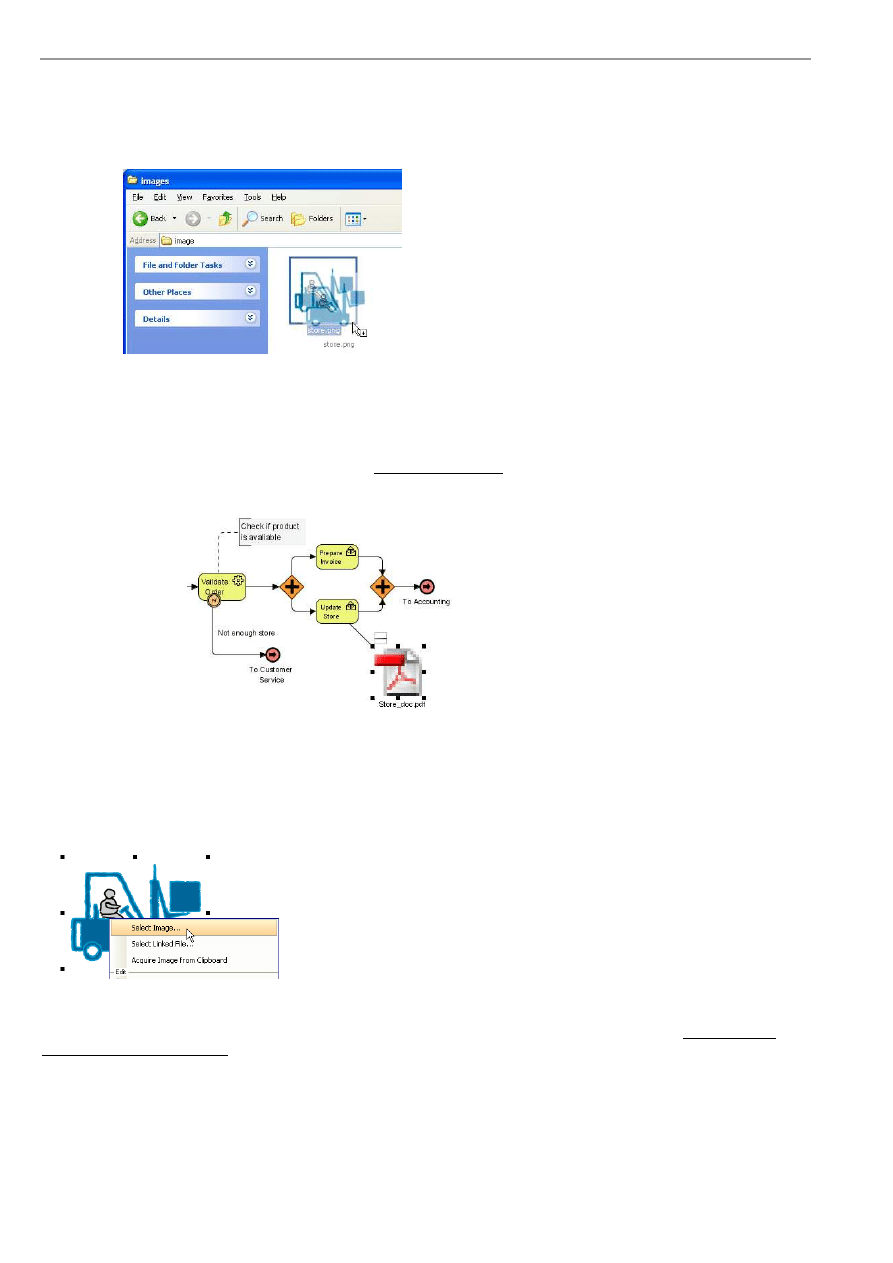
Creating Image Shapes by Drag and Drop
1.
Drag one or more files from your computer and drop to a diagram in BP-VA
Figure 2.54 - Dragging an image from the file explorer
2.
An image shape will be created for each dropped file.
3.
If you dropped an image file to the diagram, an image shape will be created that embed the dropped image.
4.
If you dropped a non-image file to the diagram, an image shape will be created that links to this file. And it shows the
system icon of the file for indication. Refer to Selecting Linked File for more information on how to link the image
shape to file.
Figure 2.55 - Image Shape created by dragging non-image file to diagram
Selecting Image
No matter what method you used to create an Image Shape, you can change its source image later on. To selecting an image,
right-click on an Image Shape and select Select Image... from the context menu.
Figure 2.56 - Selecting image
A file dialog shows for selecting an image. For details on the options in selecting an image, please refer to Creating Image
Shapes using Diagram Toolbar earlier in this chapter.
BP-VA User’s Guide
Chapter 2 – Drawing Business Process Diagram
2-23
Selecting Linked File
An Image Shape can act as a link to a file. To select the linked file, perform one of the following actions:
1.
Right-click on an Image Shape and select Select Linked File... from the context menu.
2.
Select an Image Shape, click on the button next to the Linked File property in the Property pane.
A file dialog shows for selecting a linked file. Once an Image Shape is linked to a file, you can double-click it to open the
linked file.
Figure 2.57 - Selecting linked file
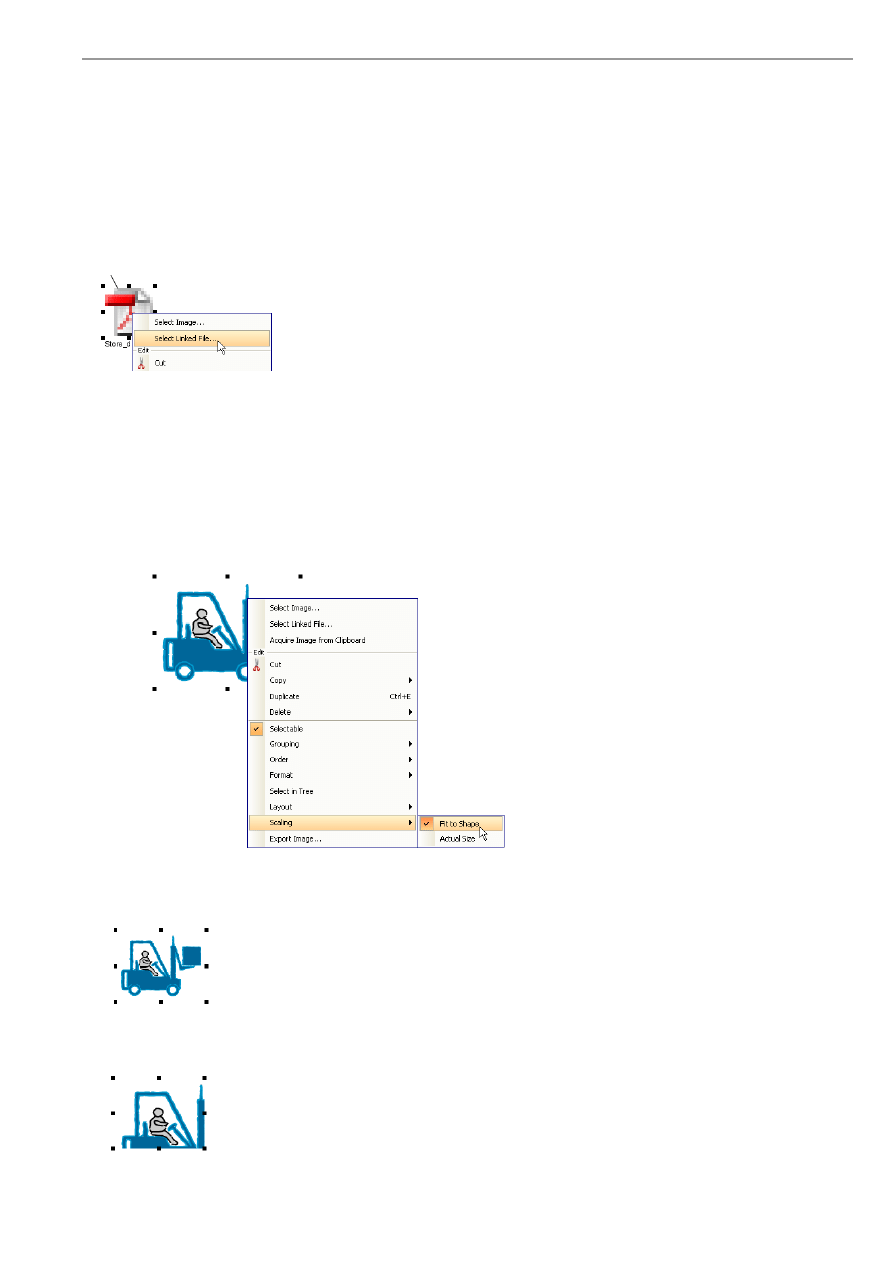
Image Scaling Option
Image Shape has two image scaling options which determine how an image will be displayed when the Image Shape changes it
size.
1.
To select an image scaling option, right-click on the Image Shape and select Scaling from the context menu.
Figure 2.58 - Image scaling options
Fit to Shape - The image will be expanded or shrunk to fit the shape when the Image Shape changes its size.
Figure 2.59 - Fit to shape
Actual Size - The image will always be displayed in its actual size no matter how large the Image Shape is.
Figure 2.60 - Actual size
BP-VA User’s Guide
Chapter 2 – Drawing Business Process Diagram
2-24
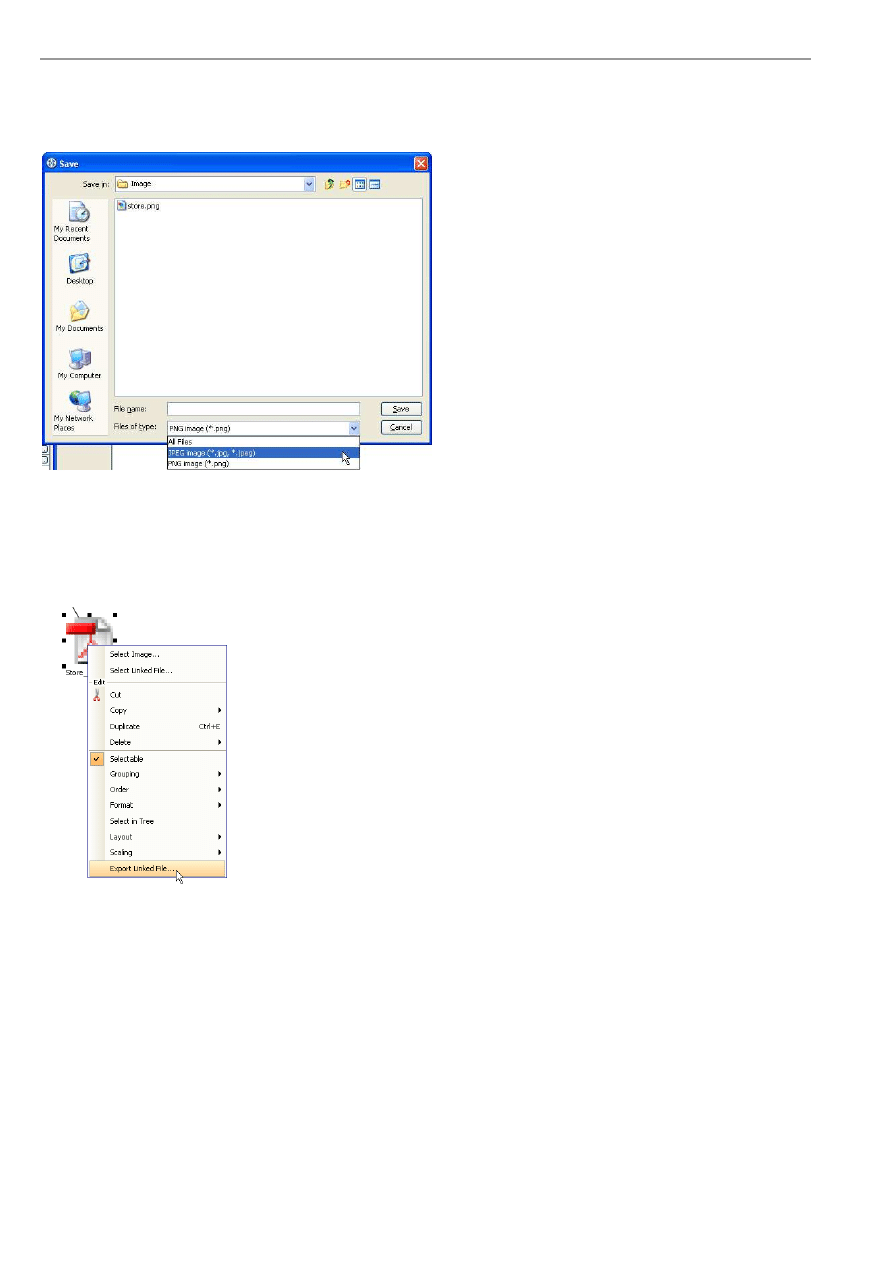
Exporting Image
To export image from an Image Shape, right-click on it and select Export Image...from the context menu. A file dialog will
show for selecting the path of the exported image. You may also choose the exported image format as either JPG or PNG.
Figure 2.61 - Exporting image
Exporting Linked File
To export the linked file from an Image Shape, right-click on it and select Export Linked File...from the context menu. A file
dialog will show for selecting the path of the exported file.
Figure 2.62 - Exporting linked file

3
Drawing Data Flow Diagram
In this chapter, you will first learn the basic skills to draw data flow diagrams in BP-VA.
Then you will move on to a more advanced level to get the most of BP-VA to streamline
and accelerate your business modeling routine.
In this chapter:
Creating Business Process Diagram
Data Flow Diagram Element
Decomposing a Process
BP-VA User’s Guide
Chapter 3 – Drawing Data Flow Diagram
3-2
Chapter 3 - Drawing Data Flow Diagram
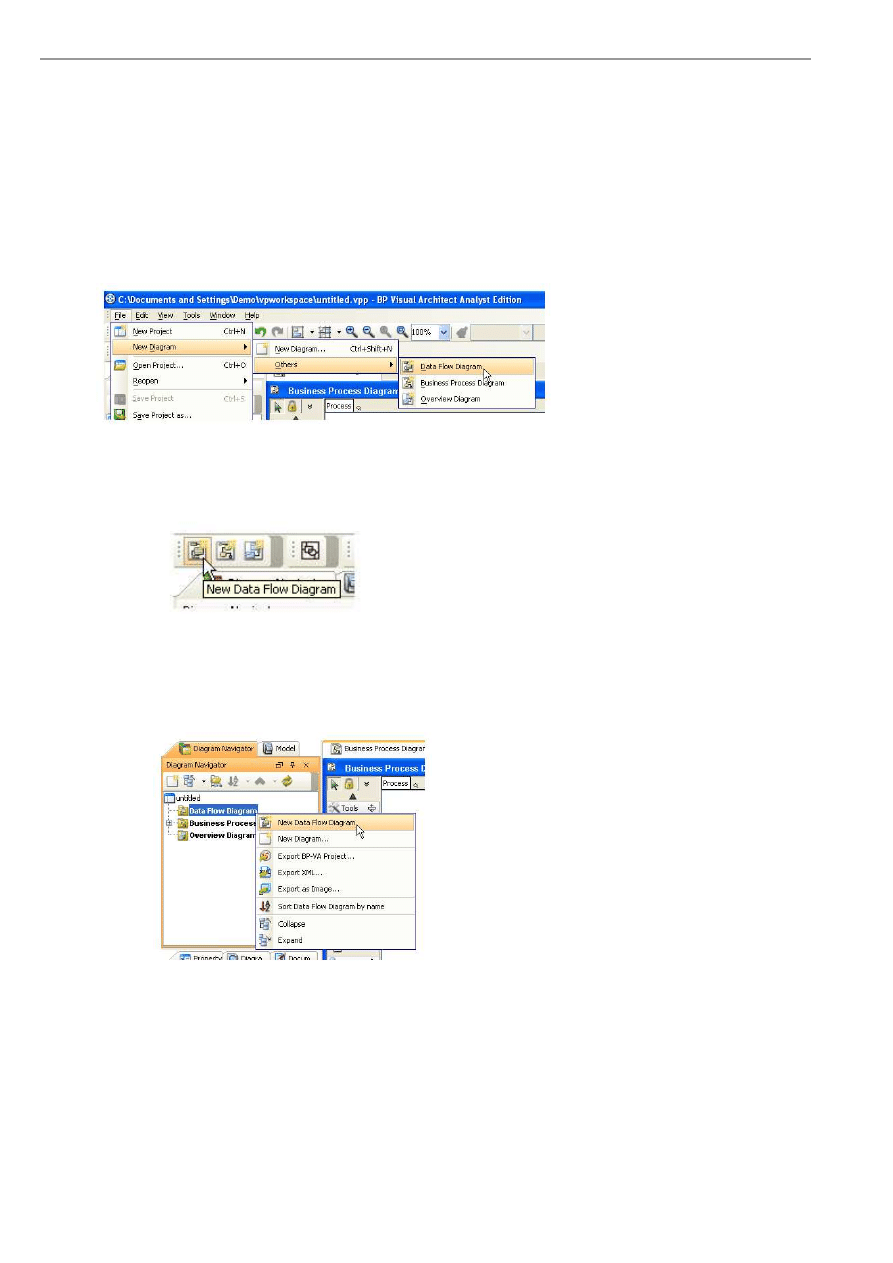
Creating Data Flow Diagram
To create a Data Flow Diagram, perform one of the following actions:
•
Select menu File > New Diagram > Others > Data Flow Diagram
Figure 3.1 - Creating Data Flow Diagram from menu
•
Click on the New Data Flow Diagram button on the toolbar.
Figure 3.2 - Creating Data Flow Diagram from toolbar
•
In the Diagram Navigator, right-click Data Flow Diagram and select Create Data Flow Diagram from the context
menu.
Figure 3.3 - Creating Data Flow Diagram in Diagram Navigator
A blank Data Flow Diagram will be created and opened in the Diagram Pane.
BP-VA User’s Guide
Chapter 3 – Drawing Data Flow Diagram
3-3
Data Flow Diagram Elements
This section describes the elements in Data Flow Diagram of BP-VA.
Note
For basic diagramming techniques, please refer to Chapter 2 - Drawing Business Process Diagram.
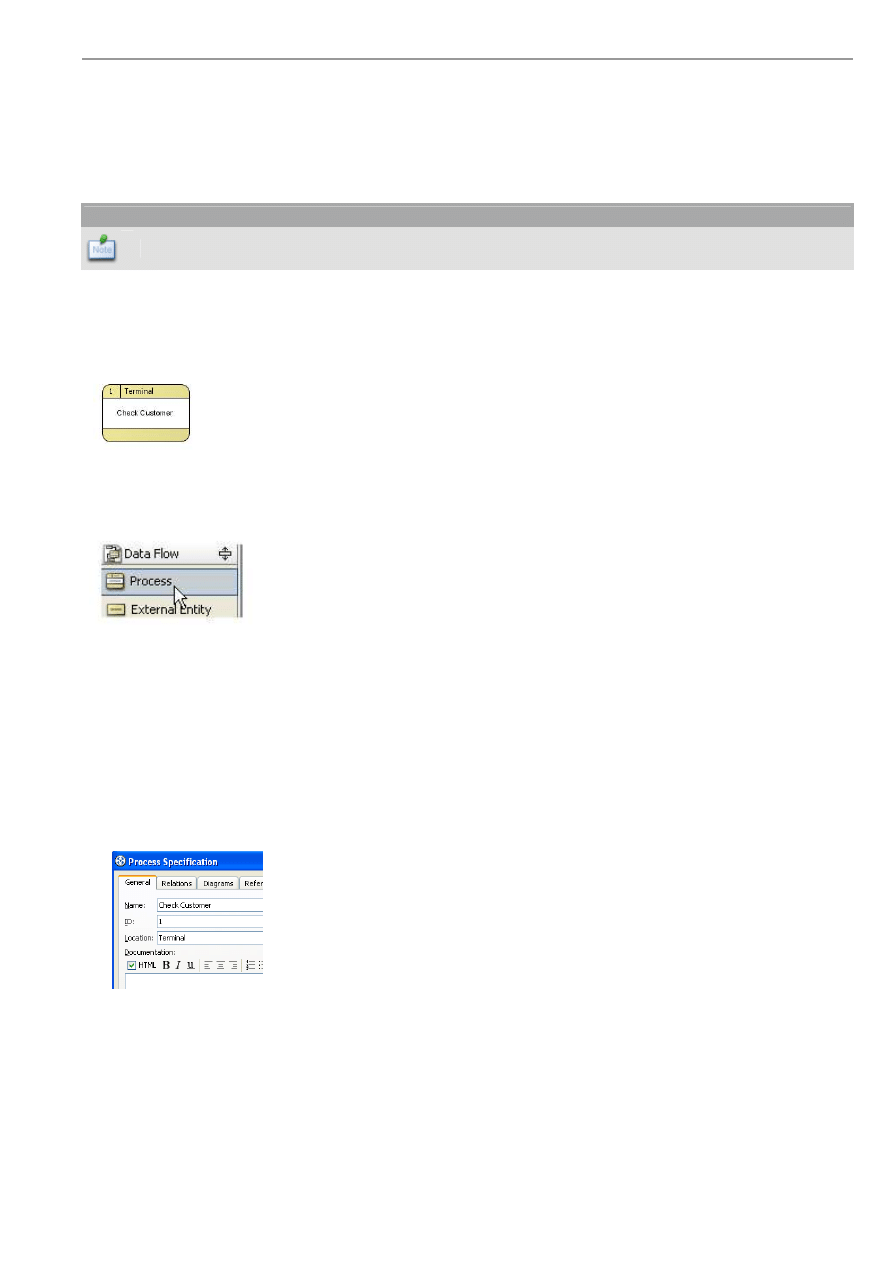
Process
A Process manipulates the input data.
Figure 3.4 - Process
To create a Process, click on the Process button on the toolbar and then click on the diagram.
Figure 3.5 - Creating a Process
The Process symbol comprises of:
ID - The unique identifier, located at top-left of the symbol
Location - Where/by whom the process is done, located at top-right of the symbol
Name - The name of the Process, located at the center of the symbol
To edit these properties, open the specification dialog box of the Process. The name of the Process can also be edited in-place
in the diagram.
Figure 3.6 - Process Specification
BP-VA User’s Guide
Chapter 3 – Drawing Data Flow Diagram
3-4
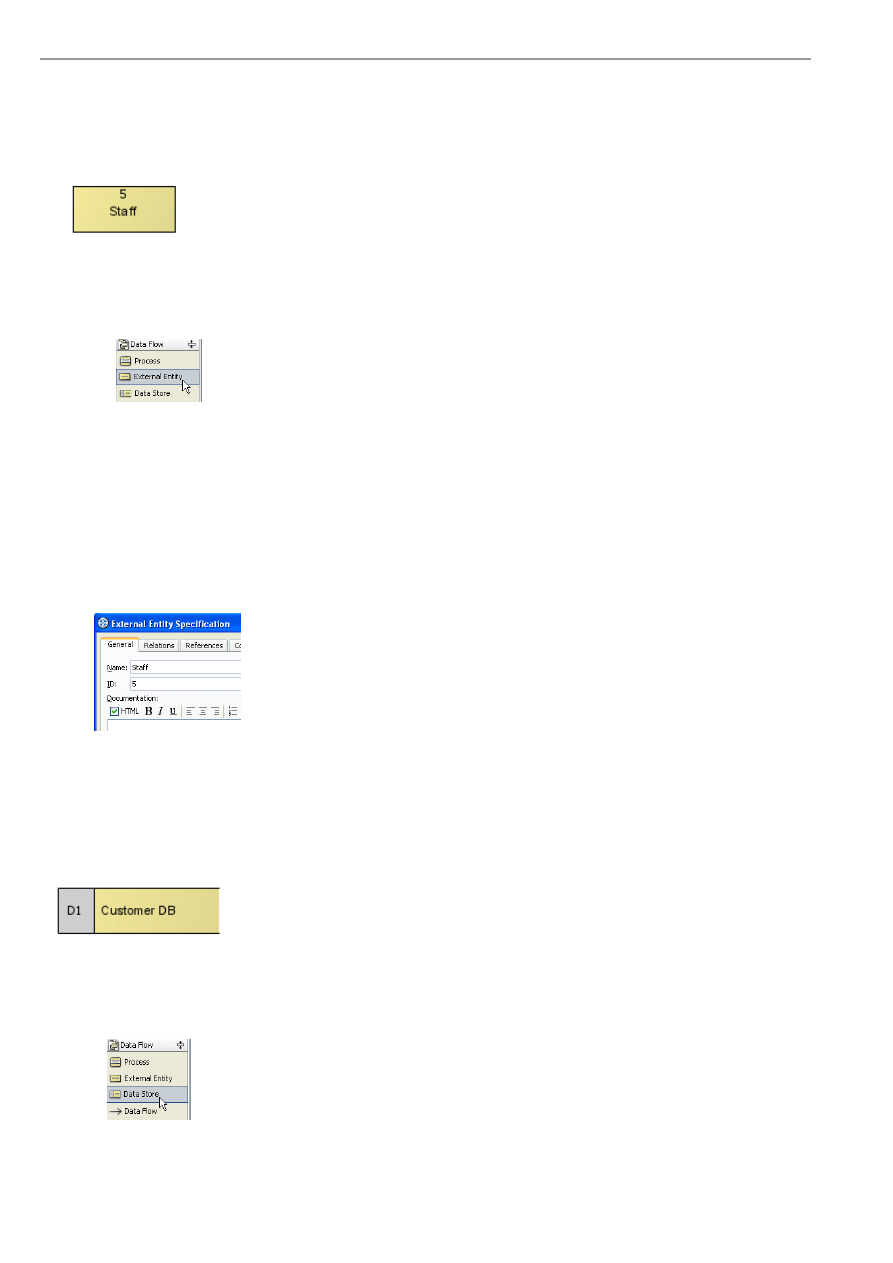
External Entity
An External Entity provides data/information to the system, or receive data/information from it.
Figure 3.7 - External Entity
To create an External Entity, click on the External Entity button on the toolbar and then click on the diagram.
Figure 3.8 - Creating an External Entity
The External Entity symbol comprises of:
ID - The unique identifier, located at the top of the symbol
Name - The name of the External Entity, located at the center of the symbol
To edit these properties, open the specification dialog box of the External Entity. The name of the External Entity can also be
edited in-place in the diagram.
Figure 3.9 - External Entity Specification
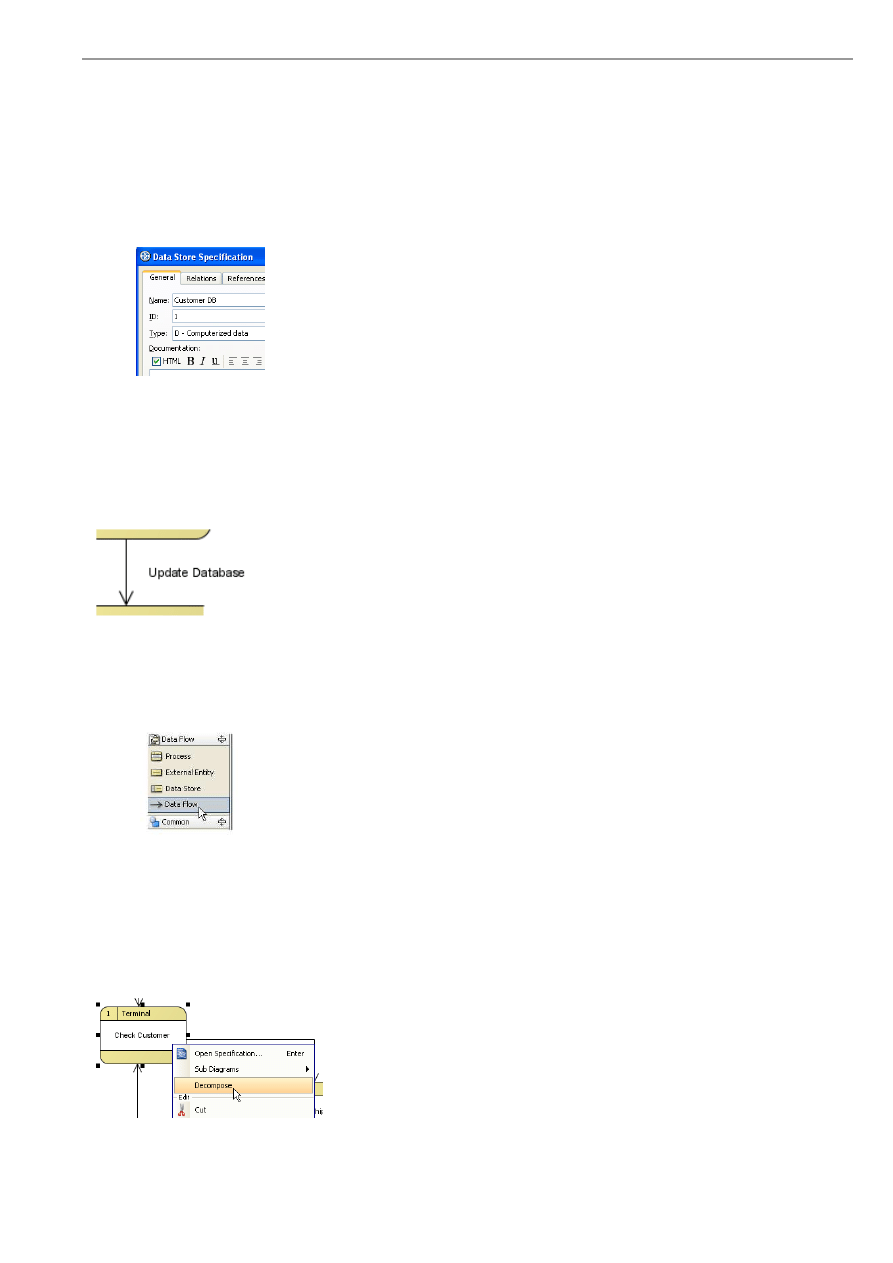
Data Store
A Data Store is the location where data is held temporarily or permanently.
Figure 3.10 - Data Store
To create a Data Store, click on the Data Store button on the toolbar and then click on the diagram.
Figure 3.11 - Creating a Data Store
BP-VA User’s Guide
Chapter 3 – Drawing Data Flow Diagram
3-5
The Data Store symbol comprises of:
Type + ID - The type and the unique identifier of the Data Store, both located at the left of the symbol
Name - The name of the Data Store, located at the center of the symbol
To edit these properties, open the specification dialog box of the Data Store. The name of the Data Store can also be edited in-
place in the diagram.
Figure 3.12 - Data Store Specification
Data Flow
A Data Flow represents the data/information that flows to/from a Process.
Figure 3.13 - Data Flow
To create a Data Flow, click on the Data Flow button on the toolbar, and then drag from the source shape to the destination
shape.
Figure 3.14 - Creating a Data Flow
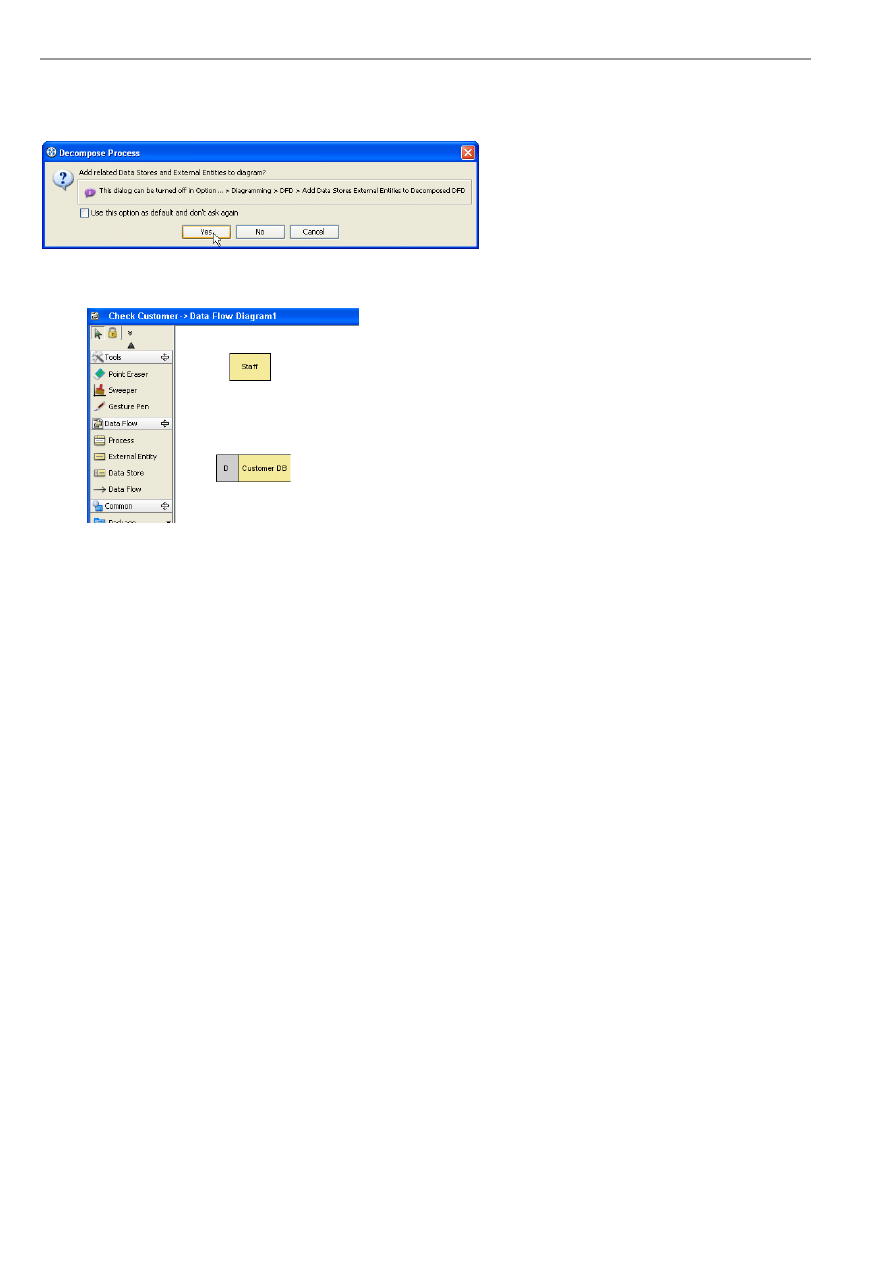
Decomposing a Process
To decompose a Process, right-click on it and select Decompose from the context menu.
Figure 3.15 - Decomposing a Process
BP-VA User’s Guide
Chapter 3 – Drawing Data Flow Diagram
3-6
If the Process connects with Data Stores and External Entities, you will be asked whether to add those shapes to the
decomposed diagram.
Figure 3.16 - Prompt for adding related shapes to decomposed diagram
If you selected Yes, the related shapes will be added to the decomposed diagram. Otherwise the diagram will be blank.
Figure 3.17 - Data Flow Diagram of a decomposed Process

4
Print Diagrams
BP-VA provides a sophisticated yet user-friendly printing facility that you can use to
create professional and highly customizable printouts for your Business Process
Diagrams.
In this chapter:
Print Preview
Printing Diagrams with Preview
Printing Diagrams with Quick Print
BP-VA User’s Guide
Chapter 4 – Printing Diagrams
4-2
Chapter 4 - Printing Diagram
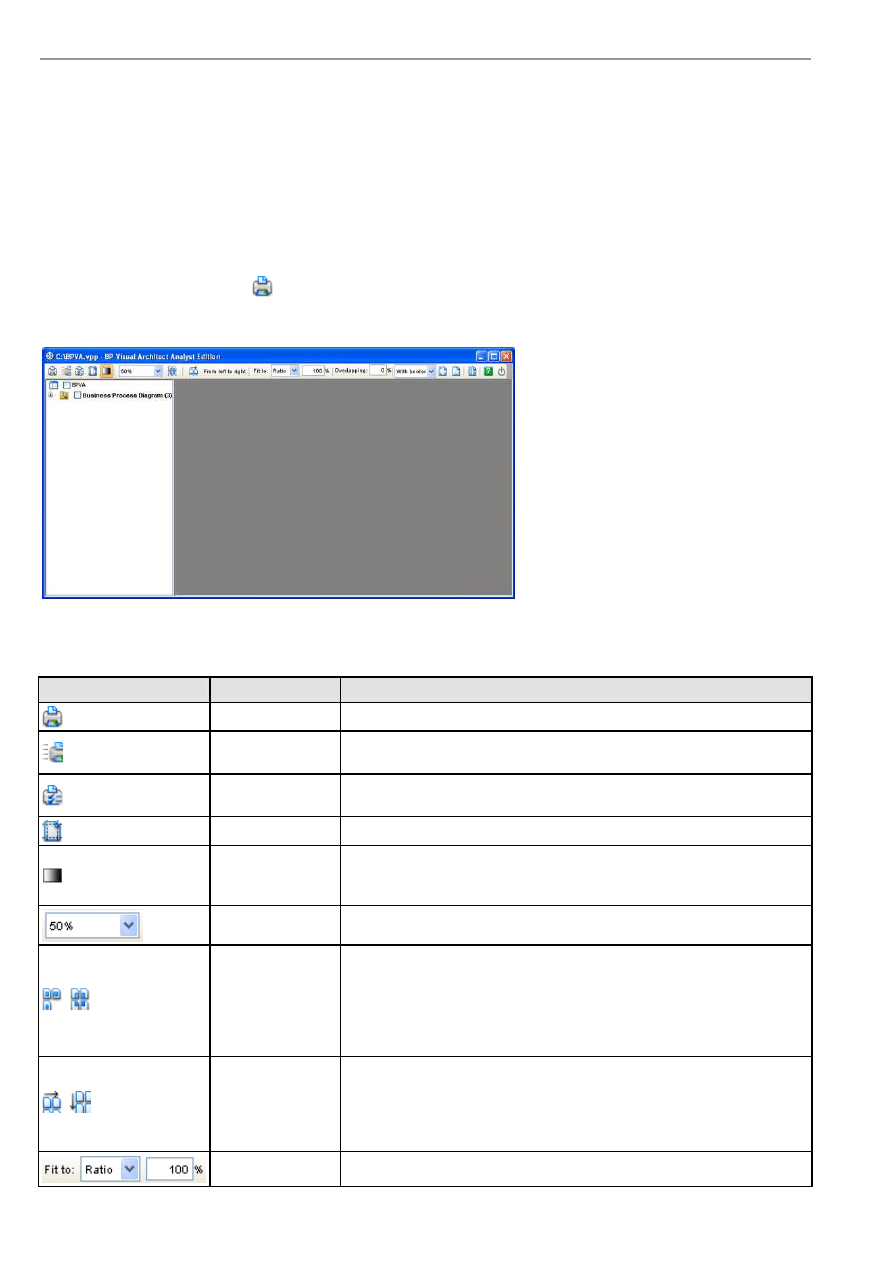
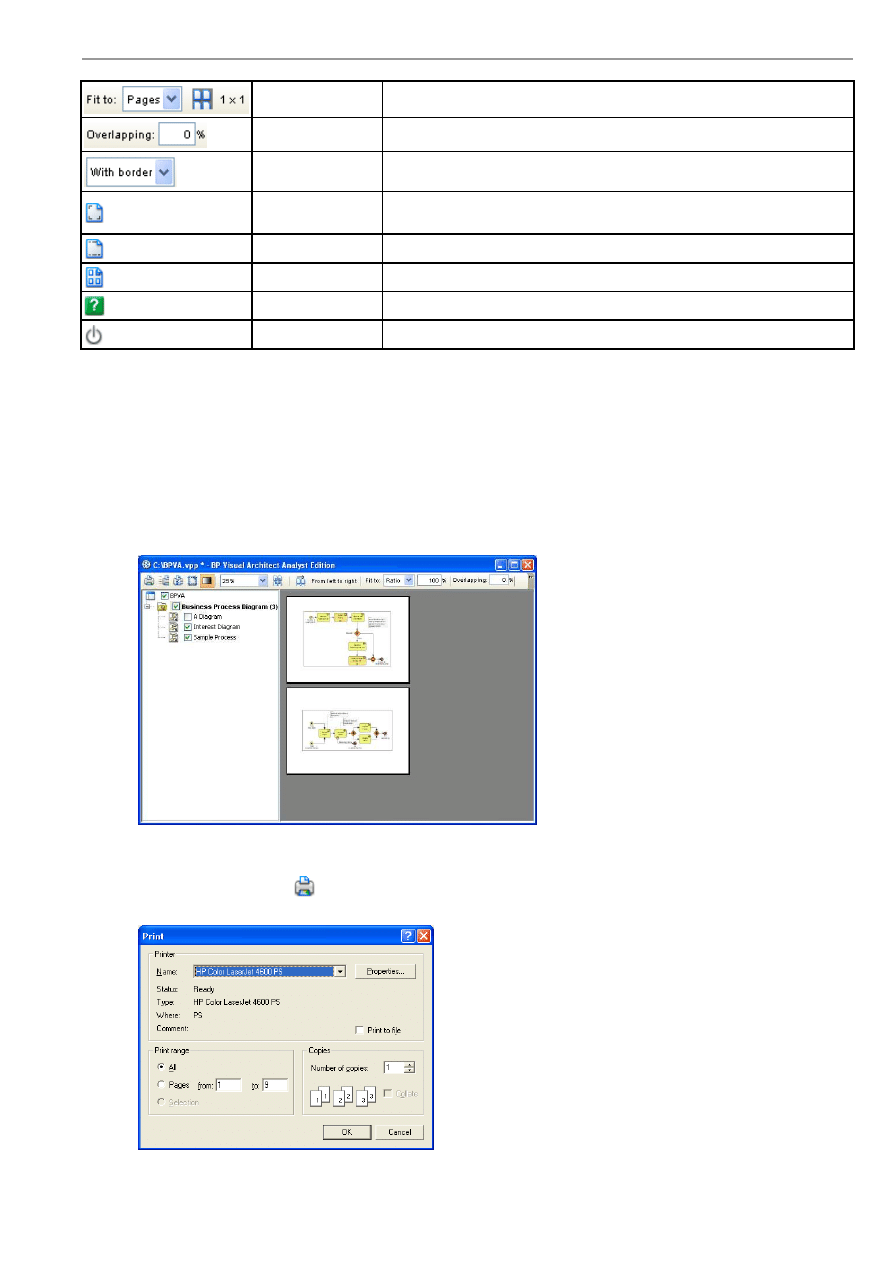
Print Preview
The Print Preview pane allows you to preview the printouts and provides a set of options for changing the printout style. To
display the print preview, perform one of the following actions:
•
Select File > Print... from main menu.
•
Click on the Print button
on the toolbar.
In both cases, the Print Preview pane will be displayed.
Figure 4.1 Print preview
The toolbar of the print preview pane allows you to configure the print settings. The buttons and their descriptions are shown in
the table below:
Icon
Button
Function
Print the diagram(s). The Print dialog box will be opened.
Quick Print
Print diagrams without previewing them. The Quick Print dialog box will
be opened.
Page Setup
Set up the page properties for the diagrams to be printed such as paper size
and orientation.
Adjust Margins
Adjust the margins of the pages to be printed.
Use Gradient Color
Select to use gradient color in printout. Since printing gradient color will use
up lots of memory, it is recommended to turn this option off for better
performance.
Zoom
Select the percentage to reduce/enlarge the print preview of diagrams.
/
Paper Base
Layout/Diagram
Base Layout
If the Fit to Pages option is selected, and there are multiple pages in the
printout, selecting Paper Base Layout will cause the distribution of pages to
be paper-oriented (the diagram size is ignored in arranging the preview);
while selecting Diagram Base Layout will cause the distribution of pages to
be diagram-oriented. Note that this option affects the preview only; the order
of the printout remains unchanged.
/
Paper Place Style
To change the order of the printout. Consider a large diagram is divided into
many pages, selecting From left to right will arrange the printout order
from the pages on the left to the pages on the right, while selecting From top
to bottom will arrange the print order from the pages on the top to the pages
on the bottom.
Fit to Ratio
Set the diagram size to fit to the specified ratio.
BP-VA User’s Guide
Chapter 4 – Printing Diagrams
4-3
Fit to Pages
Set the diagram to be printed on the number of pages specified.
Overlapping
Set the percentage of the margins to overlap among adjacent pages.
Border Option
Select to print the diagrams with or without borders.
Show/Hide Clip
Marks on Page
Select/deselect to show/hide the clip marks on the printout.
Edit Header/Footer Edit the header and the footer of the printout.
Multiple Page Mode Switch to the Multiple Page Mode to set the multiple page options.
Help
Open the BP-VA help.
Close Print Preview Close the print preview pane and return to the design area.
Table 4.1
Printing Diagrams with Preview
You can use the Print command to select the printer, set the range of pages and number of copies to be printed. The Print
command is available once a project is open.
1.
Select the desired diagrams for printing. The selected diagrams will be shown at the preview area.
Figure 4.2 - Printing diagrams with preview
2.
Click on the Print button
on the Print Preview toolbar. The Print dialog box appears.
Figure 4.3 - The Print dialog box
BP-VA User’s Guide
Chapter 4 – Printing Diagrams
4-4
3.
Select the printer to use, the page range and the number of copies to be printed. You may click on the
Properties...button to configure the printer-specific properties as well.
4.
Click OK to start printing.
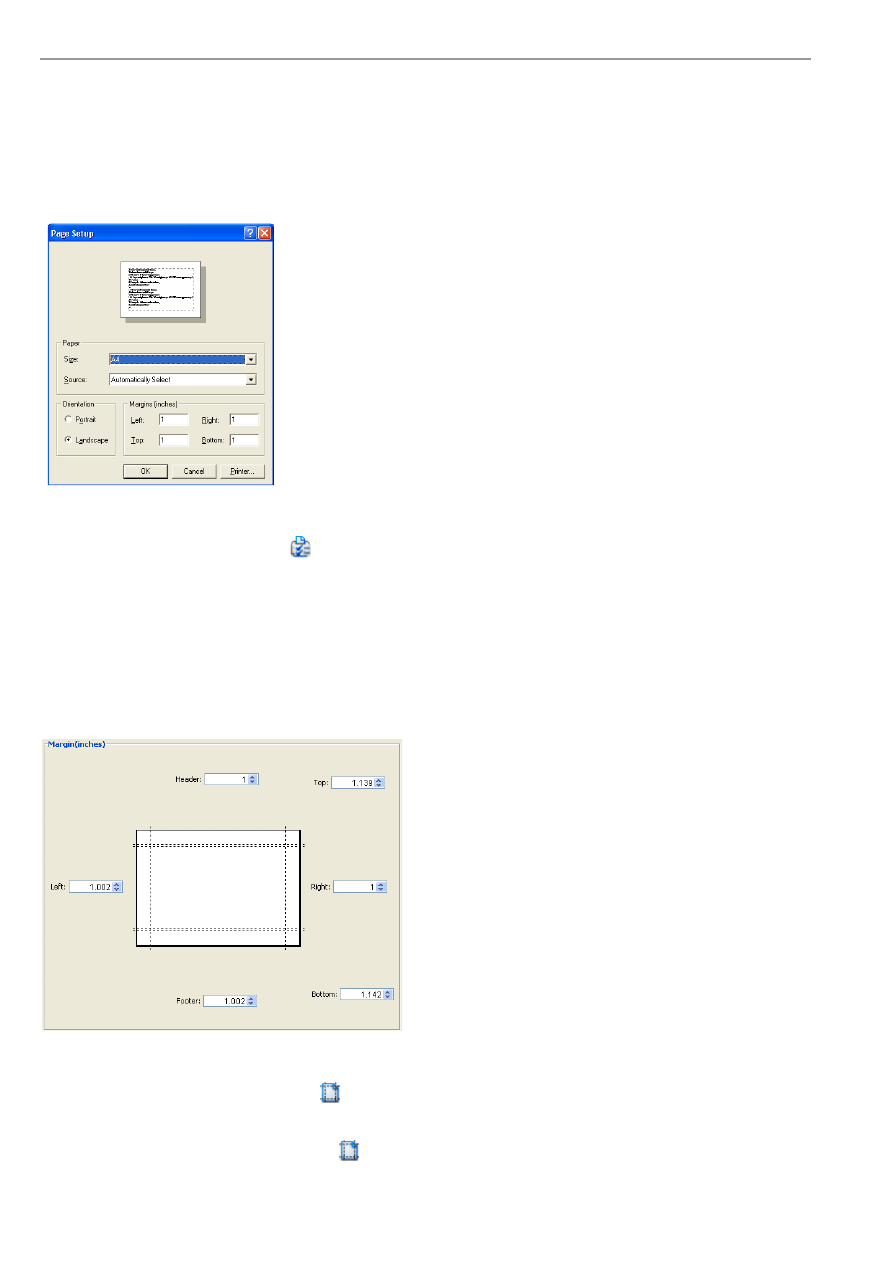
Page Setup
Page Setup allows user to specify the page size, the orientation as well as the margins of the pages.
Figure 4.4 - The Page Setup dialog box
1.
Click on the Page Setup button
on the toolbar. The Page Setup dialog box appears.
2.
You can click on the Size drop-down menu to select the paper size to use.
3.
You can select the orientation for the page(s) to be printed (either Portrait or Landscape) in the Orientation field.
4.
You can enter the value into the Left, Right, Top and Bottom text fields to adjust the size of the corresponding
margin.
5.
Click OK to apply the settings.
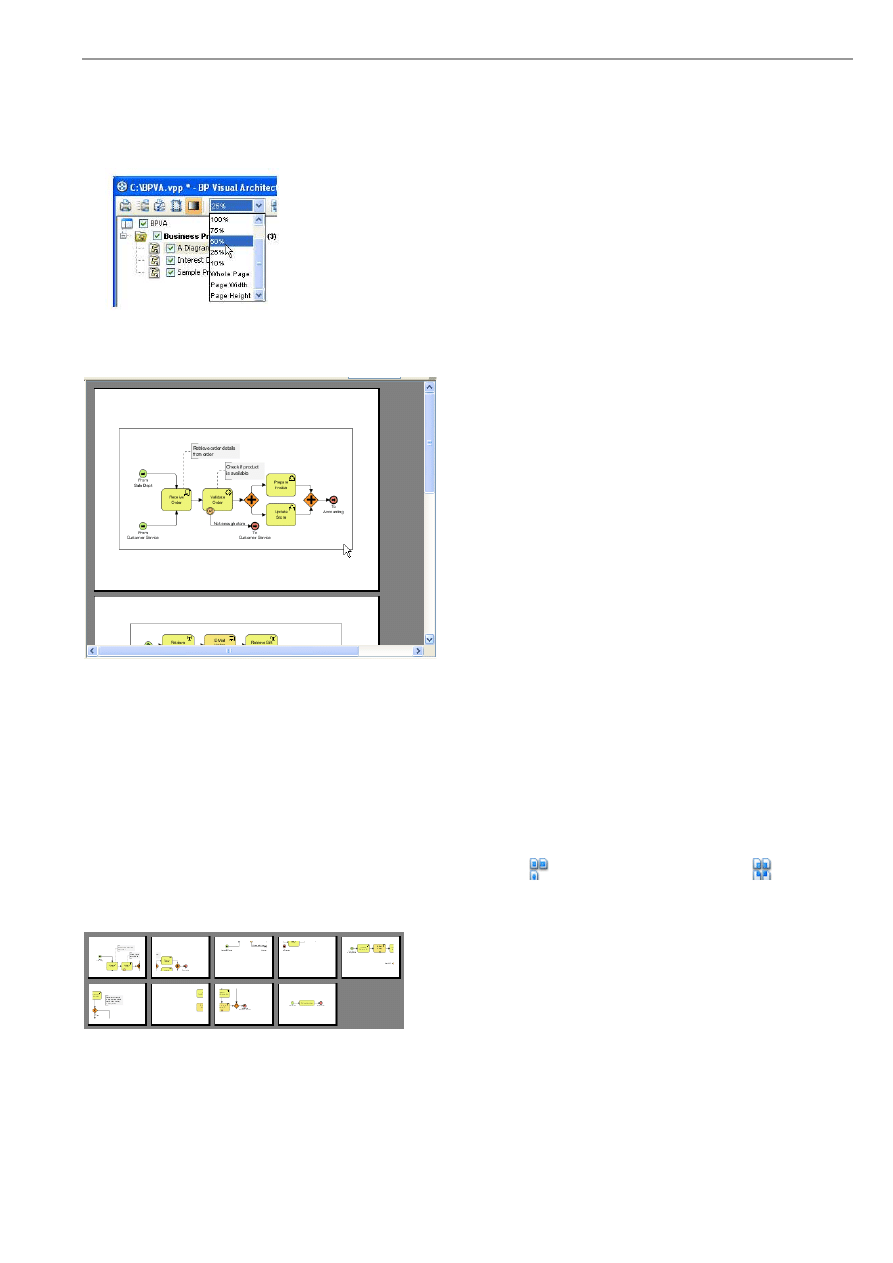
Adjusting Margins
The Margins pane allows user to specify the margins of the pages, header and footer.
Figure 4.5 - Adjusting margins
1.
Click on the Adjust Margins button
on the toolbar. The preview area shows the margin setting page.
2.
You can edit the margins sizes by entering the sizes into the text fields. Alternatively, click on the spinner buttons to
increase/decrease the margin sizes.
3.
Click the Finish Adjust Margin button
when you have finished configuring the margin settings. The margin sizes
will then be updated.
BP-VA User’s Guide
Chapter 4 – Printing Diagrams
4-5
Zooming Pages
Diagrams can be zoomed in or zoomed out according to user preference.
Click on the Zoom drop-down menu to select the desired zoom ratio.
Figure 4.6 - Selecting the zoom ratio
The preview area will show the diagrams in the zoom ratio that you have selected.
Figure 4.7 - The zoomed print preview
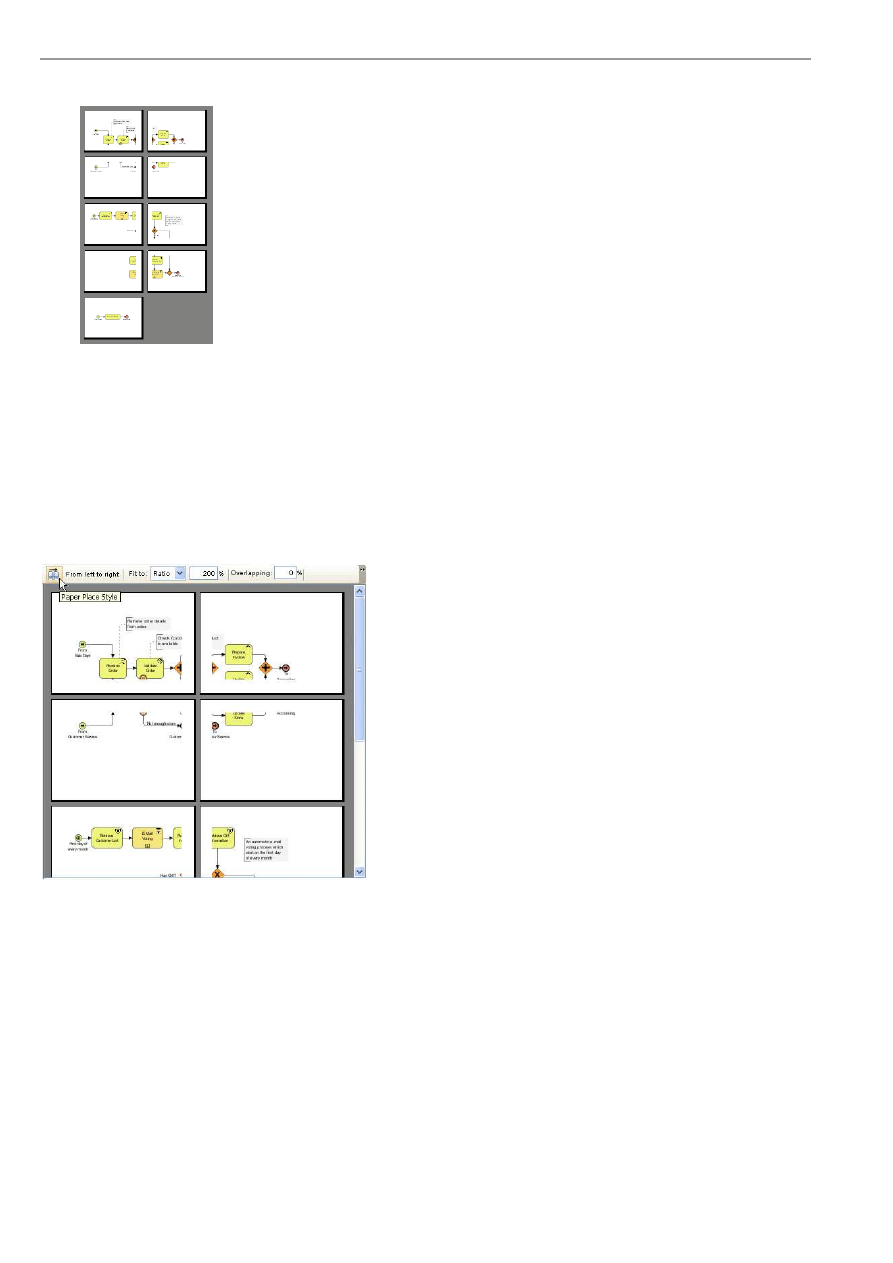
Selecting the Preview Layout
There are two layouts that you can select for the print preview, the Paper Base Layout and the Diagram Base Layout.
If the Fit to Pages option is selected, and there are multiple pages in the printout, selecting Paper Base Layout will cause the
distribution of pages to be paper-oriented (the diagram size is ignored in arranging the preview); while selecting Diagram Base
Layout will cause the distribution of pages to be diagram-oriented.
Note that this option affects the preview only; the order of the printout remains unchanged
To select a layout of the preview, click on the Paper Base Layout button
or Diagram Base Layout button
on the
toolbar, a popup menu appears where you can select the layout to use.
The preview after applying the Paper Base Layout:
Figure 4.8 - Paper Base Layout
BP-VA User’s Guide
Chapter 4 – Printing Diagrams
4-6
The preview after applying the Diagram Base Layout:
Figure 4.9 - Diagram Base Layout
Setting Paper Place Style
You can select the paper place style to change the order of the printout. To select the paper place style, click on the Paper
Place Style button on the toolbar. A popup menu appears where you can select a paper place style.
Consider a large diagram is divided into many pages, selecting From left to right will arrange the printout order from the
pages on the left to the pages on the right, while selecting From top to bottom will arrange the print order from the pages on
the top to the pages on the bottom.
The order of the printout after selecting From left to right.
Figure 4.10 - Selecting the Paper Place Style
BP-VA User’s Guide
Chapter 4 – Printing Diagrams
4-7
Fit to Ratio
Fit to Ratio is used to resize the diagrams in the printout to a specific ratio.
Click on the Fit to drop-down menu and select Ratio.
You can enter the ratio into the textbox. For example, enter 150 to set the ratio to 150%. After you have edited the ratio, the
diagrams in the printout will be resized to the new ratio.
Figure 4.11 - Fit to ratio
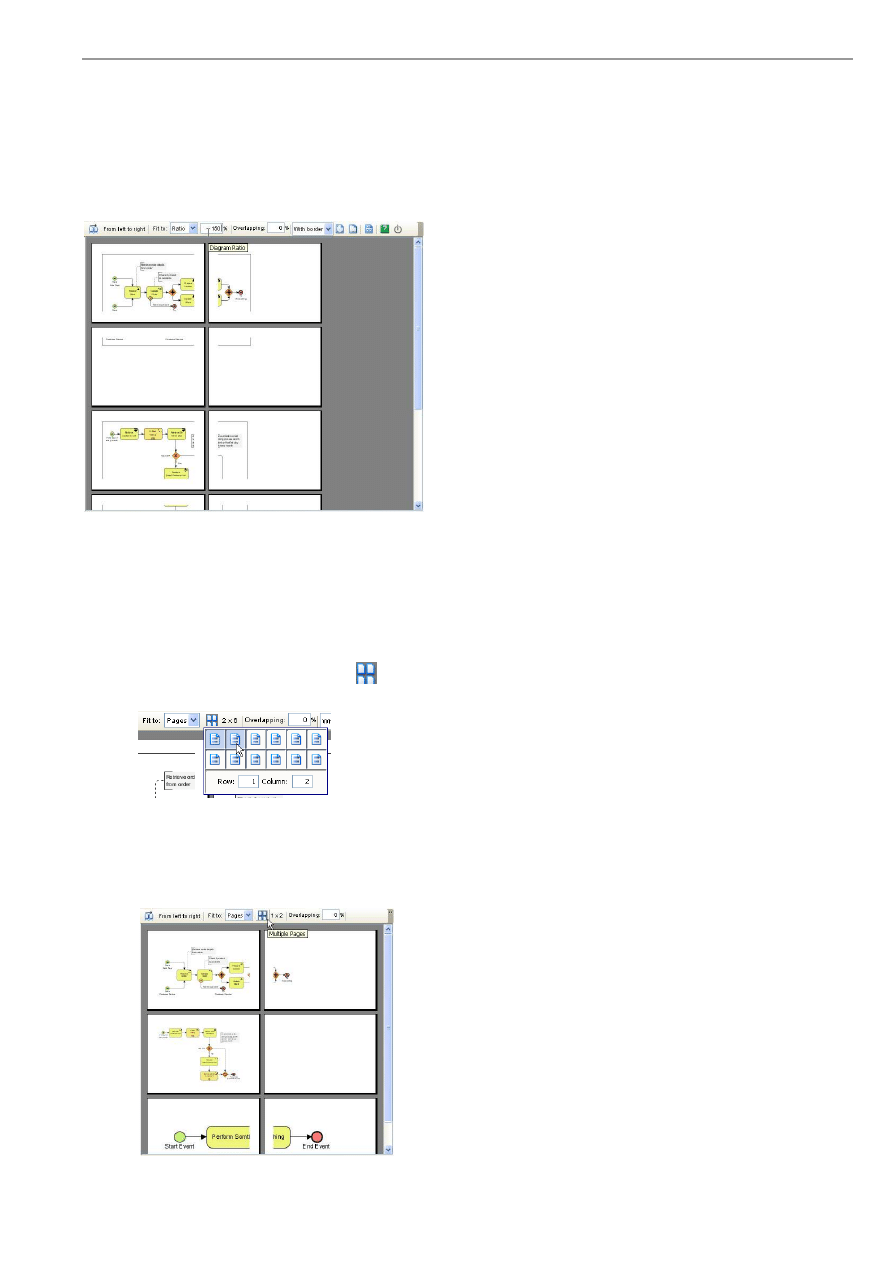
Fit to Pages
Fit to Pages is used to split the diagram to desired number of pages when printing.
1.
Click on the Fit to drop-down menu and select Pages.
2.
Click on the Multiple Pages button
on the toolbar. The page selector appears.
Figure 4.12 - Fit to Pages
3.
Click on the row-column combination to select it (note that you can click and drag on the page selector to extend the
selection). The diagram will be split into multiple pages by the rows and columns that you have selected.
Figure 4.13 - Printing to fit multiple pages
BP-VA User’s Guide
Chapter 4 – Printing Diagrams
4-8
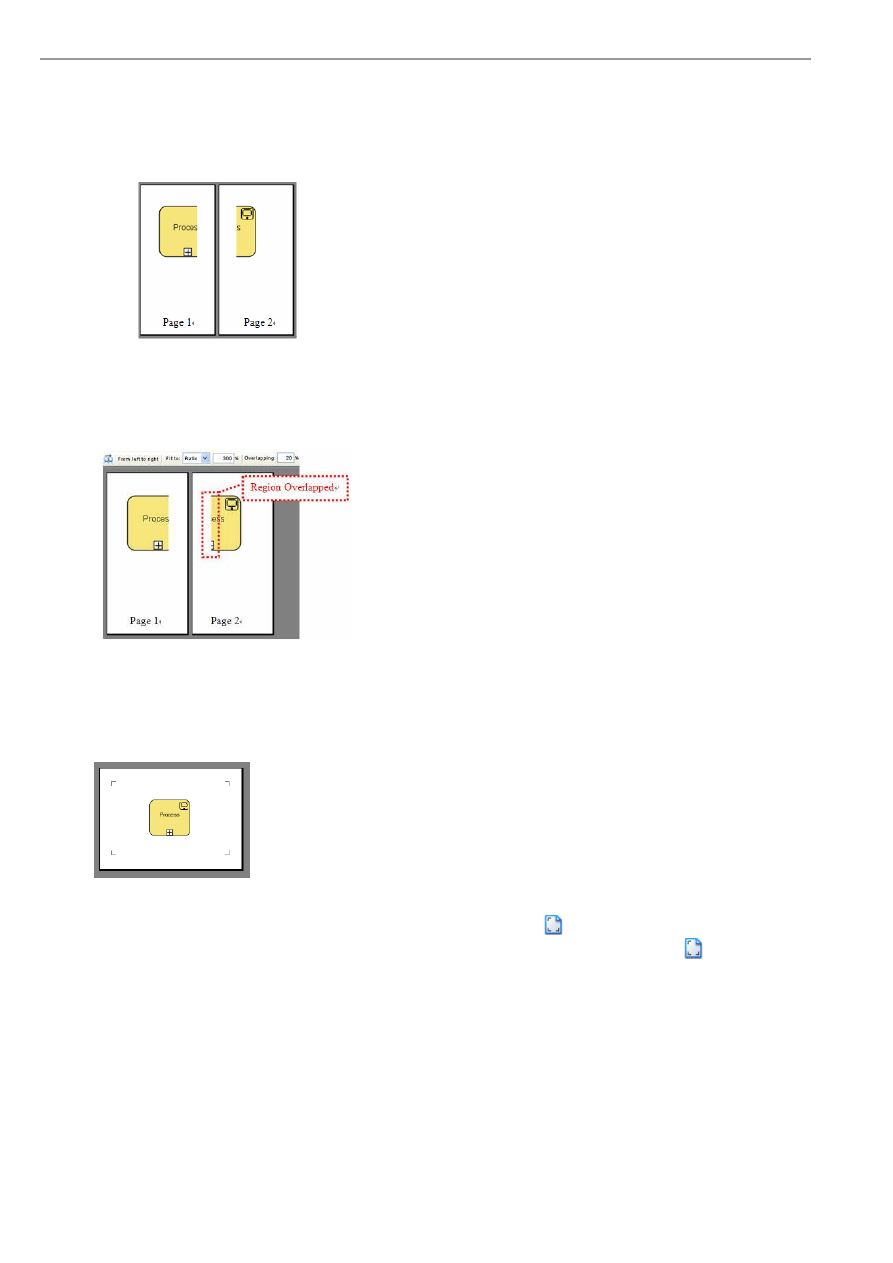
Setting the Diagram Overlap Percentage
Overlapping is used when users want the diagrams to have overlapping at the boundaries between pages. This is particularly
useful when you have a large diagram that span multiple pages and you want to stick the pages of the printout together; the
overlapping area can then be used as a hint when sticking the pages.
Figure 4.14 - Printing with no overlapping between pages
1.
Click on the Overlapping textbox to input the overlapping percentage and press the Enter key.
2.
The printing area near the boundaries of the pages will be duplicated by the overlapping percentage inputted.
Figure 4.15 - Printing with overlapping percentage specified
Showing/Hiding Clip Marks on Page
Clip marks act as an indication of the boundary of a page.
Figure 4.16 - Showing clip marks on pages
To show clip marks on the printout click on the Show Clip Marks on Page button
. You will see the boundaries of the
pages are surrounded by clip marks. To hide the clip marks click on the Hide Clip Marks on Page button
again.
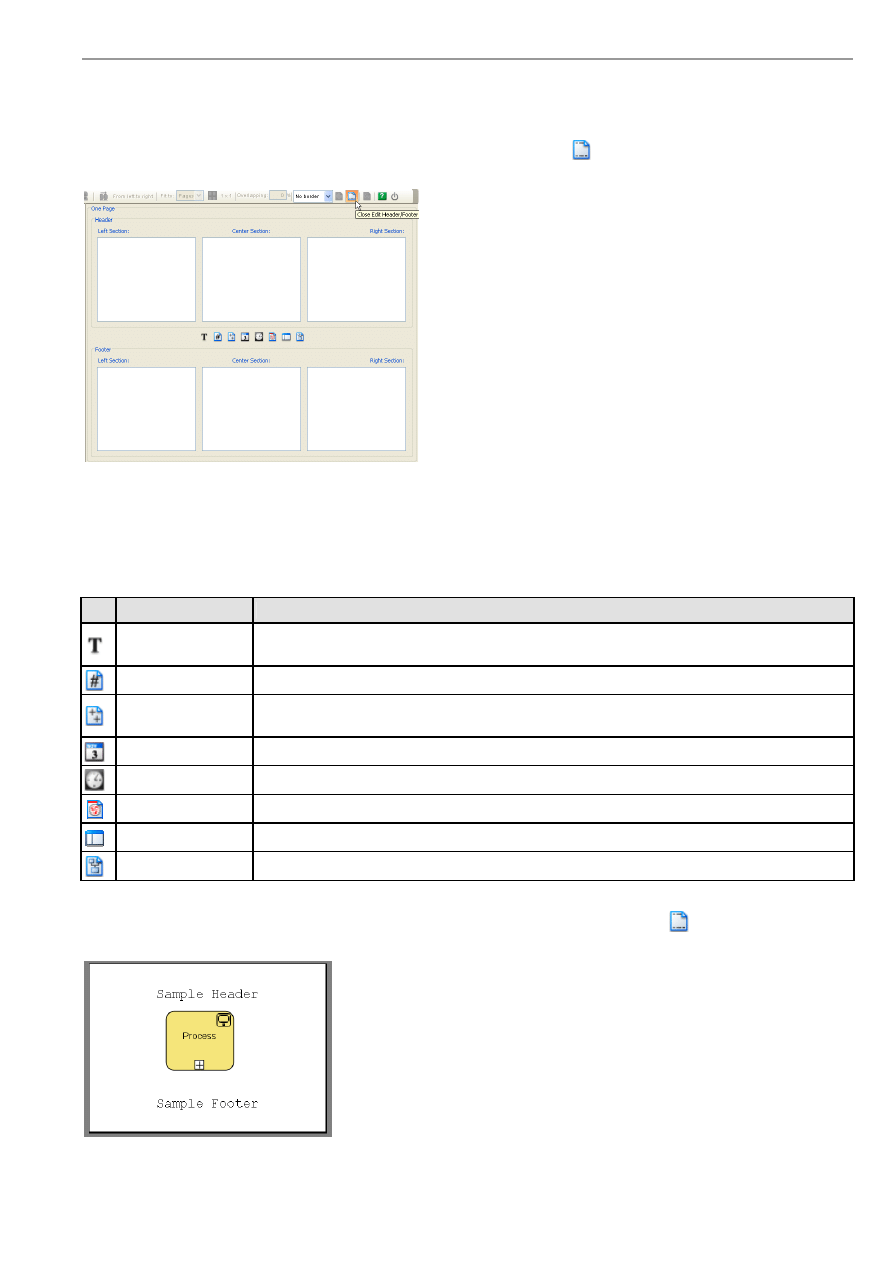
BP-VA User’s Guide
Chapter 4 – Printing Diagrams
4-9
Editing Header/Footer of the Pages
To edit the header/footer of the printout click on the Edit Header/Footer button
on the toolbar. It will then switch to the
edit header/footer pane.
Figure 4.17 - Editing header/footer of pages
You can edit the header and the footer in the Header panel and the Footer panel respectively. Each of the panel consists of the
Left Section, Center Section and the Right Section, which represents the position that the content will be located in the
header/footer.
There is a toolbar between the Header panel and the Footer panel, which facilitates the editing of header/footer. The
description of the buttons in the toolbar can be found in the following table:
Icon
Name
Description
Select Font
Select the font to use for the selected section. Note that the section must be active (focused) in
order to select font for it
Insert Page Number Insert the page number in the selected section
Insert Number of
Pages
Insert the total number of pages in the selected section
Insert Date
Insert the date that the printing starts in the selected section
Insert Time
Insert the time that the printing starts in the selected section
Insert File Name
Insert the file name of the BP-VA project in the selected section
Insert Project Name Insert the name of the BP-VA project in the selected section
Insert Diagram Name Insert the diagram name in the selected section
Table 4.2
After you have finished editing the header/footer, click on the Close Edit Header/Footer button
to switch to the print
preview mode. A sample page that has the header and footer formatted is shown in the picture below:
Figure 4.18 - Preview with header/footer
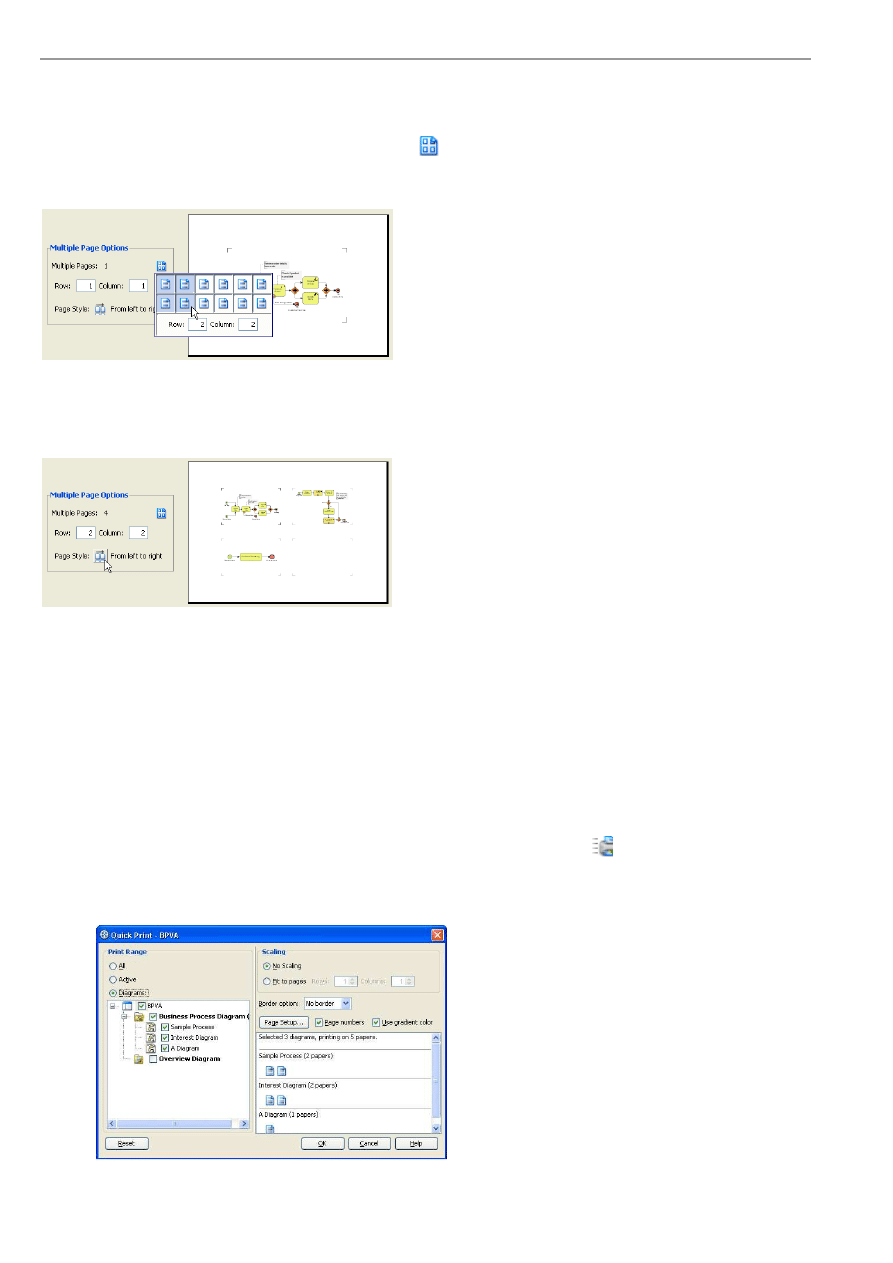
BP-VA User’s Guide
Chapter 4 – Printing Diagrams
4-10
The Multiple Page Mode
The Multiple Page Mode allows users to configure how the diagrams should be distributed in multiple pages. To switch to the
Multiple Page Mode click on the Multiple Page Mode button
on the toolbar.
Click on the button beside the Multiple Pages field will invoke the page selector, where you can select the row-column
combination for the printout. Alternatively, you can type in the Row and Column text field directly.
Figure 4.19 - Multiple page options
Click on the button beside the Page Style field to change the printout order. Consider a large diagram is divided into many
pages, selecting From left to right will arrange the printout order from the pages on the left to the pages on the right, while
selecting From top to bottom will arrange the print order from the pages on the top to the pages on the bottom.
Figure 4.20 - Selecting page style
After you have finished configuring the multiple page settings click on the Close Multiple Page Mode button to close the
Multiple Page Mode.
Printing Diagrams with Quick Print
The Quick Print feature allows you to print diagrams without previewing them, hence speed up the print job. To perform quick
print, perform one of the following actions:
•
Select File > Quick Print...from main menu
•
Select File > Print...from main menu. This displays the Print Preview pane. Click
on the toolbar of the Print
Preview pane.
In both cases, the Quick Print dialog box will appear. Configure the options and click OK to start printing.
Figure 4.21 - The Quick Print dialog box
BP-VA User’s Guide
Chapter 4 – Printing Diagrams
4-11
Field
Description
Print Range
Click on either of the options below to specify the print range.
All - Print all the diagrams within the current project
Active - Print only the active diagram
Diagrams - Check from the diagram tree to select the diagram(s) for printing
Scaling
Select No scaling to print with diagram's original size. Number of pages used on each diagram is
subject to the scale of diagrams. Select Fit to pages to print with specified number of pages per
diagram with respect to the specified number of rows and columns.
Border
option
Select to print the diagrams with or without borders.
Page
Setup...
Page Setup allows you to specify the page size, the orientation as well as the margins of the pages.
Page
numbers
Check to print diagrams with page number on it.
Use
gradient
color
Select to use gradient color in printout. Since printing gradient color will use up lots of memory, it is
recommended to turn this option off for better performance.
Table 4.3

BP-VA User’s Guide
Chapter 4 – Printing Diagrams
4-12

5
Copying and Export Diagrams
Beside standard diagramming and modeling features, BP-VA supports the copying of
diagrams within the tool, or as images or OLE to other applications including Microsoft®
Office. You may also make use of BP-VA export function to export diagrams as images of
as another BP-VA project.
In this chapter:
Copy
Paste
Exporting Diagram as Images
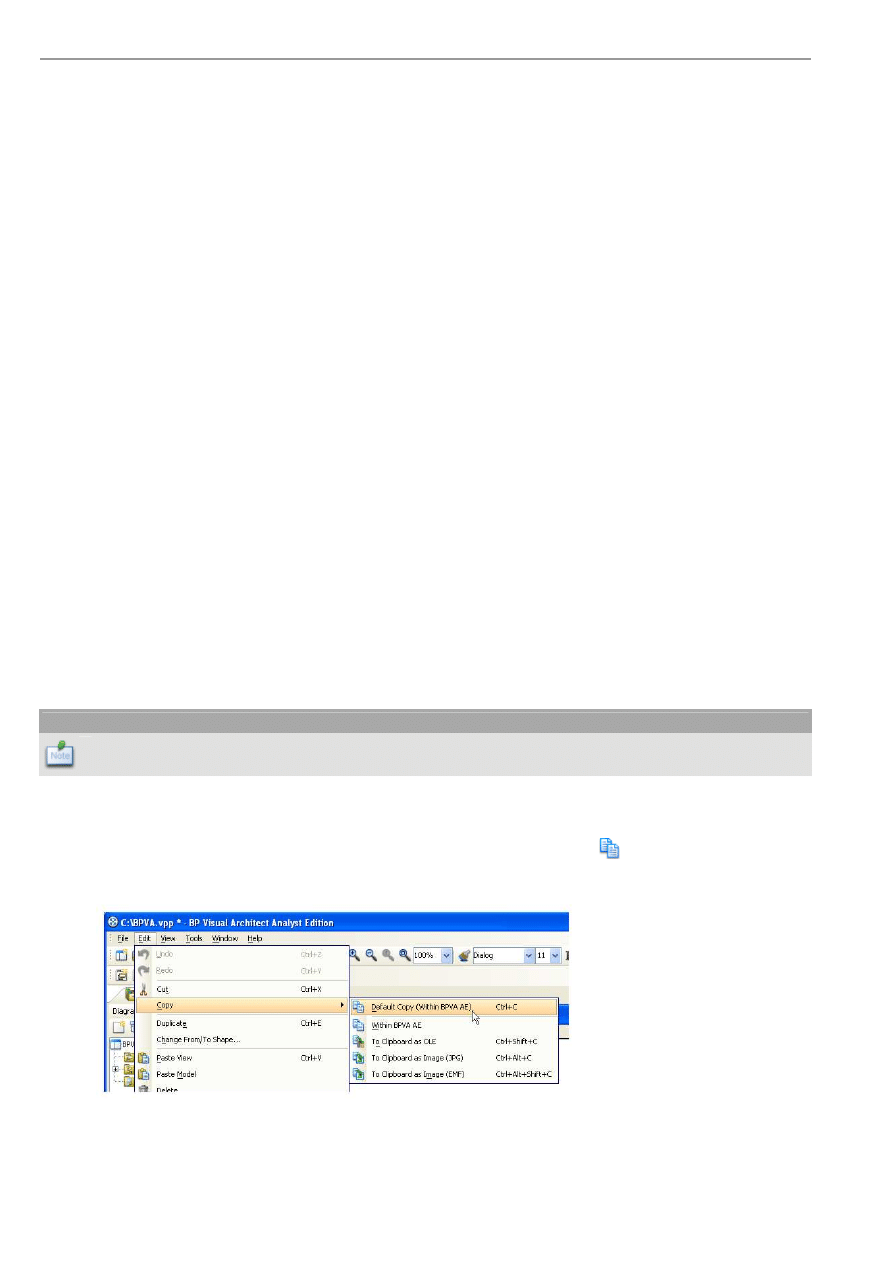
BP-VA User’s Guide
Chapter 5 – Copying and Export Diagrams
5-2
Chapter 5 - Copying and Exporting Diagrams
Copy
You can select and copy diagram element(s) and reuse it later on. There are five kinds of copy available in BP-VA.
•
Default Copy
•
Copying within BPVA
•
Copying to Clipboard as OLE
•
Copying to Clipboard as Image (JPG)
•
Copying to Clipboard as Image (EMF)
Default Copy
The default copy is triggered when the hotkey
Ctrl + C
is pressed. The actual action performed by default copy follows the BP-
VA application option (as configured in the Options dialog box - > Diagramming category - > Environment page). The default
copy action can be set to one of the following:
•
Copying within BPVA
•
Copying to Clipboard as OLE
•
Copying to Clipboard as Image (JPG)
•
Copying to Clipboard as Image (EMF)
The default "default copy" action is Copying with BPVA.
Copying within BPVA
Copying diagram elements within BPVA allows you to copy selected diagram elements to the application clipboard. You can
paste the diagram elements to diagrams of the current project or to those of a different project.
Note
You cannot paste the selected content to other applications.
To copy selected diagram elements within BPVA, perform one of the following actions:
•
Select Edit > Copy > Within BPVA from main menu.
•
Click on the Copy drop down button on the toolbar and select Copy within BPVA
from the drop down menu.
•
Right-click on the selected diagram elements and choose Copy > Copy within BPVA from the context menu.
Figure 5.1 - Copying within BP-VA

BP-VA User’s Guide
Chapter 5 – Copying and Exporting Diagrams
5-3
Copying to the Clipboard as OLE
Copying diagram elements to the system clipboard as OLE will copy the content as an OLE object, which can be pasted to any
OLE containers like Microsoft® Word, Excel and PowerPoint. You can edit the copied content directly within the document.
Note
The copy to system clipboard as OLE feature is available on Windows platforms only.
To copy selected diagram elements to the system clipboard as OLE, perform one of the following actions:
•
Select Edit > Copy > To Clipboard as OLE from main menu.
•
Click on the Copy drop down button on the toolbar and select Copy to Clipboard as OLE
from the drop down
menu.
•
Right-click on the selected diagram elements and choose Copy > Copy to Clipboard as OLE from the context menu.
•
Press
Ctrl-Shift-C
.
Copying to the Clipboard as Image (JPG)
Copying diagram elements as JPG image will copy the selected diagram element as a JPG image to the system clipboard. This
feature is available on any platforms.
To copy selected diagram elements to the system clipboard as JPG image, perform one of the following actions:
•
Select Edit > Copy > To Clipboard as Image (JPG) from main menu.
•
Click on the Copy drop down button on the toolbar and select Copy to Clipboard as Image (JPG)
from the drop
down menu.
•
Right-click on the selection and choose Copy > Copy to Clipboard as Image (JPG) from the context menu.
•
Press
Ctrl-Alt-C
.
Copying to the Clipboard as Image (EMF)
Copying diagram elements as EMF image will copy the selected diagram element as an EMF image to the system clipboard.
Unlike copy as JPG image, the copied content is in EMF (Enhanced Metafile) format, which is a more scalable format that
image quality can remain even being resized/zoomed.
To copy selected diagram elements to the system clipboard as EMF image, perform one of the following actions:
•
Select Edit > Copy > To Clipboard as Image (EMF) from main menu.
•
Click on the Copy drop down button on the toolbar and select Copy to Clipboard as Image (EMF)
from the drop
down menu.
•
Right-click on the selection and choose Copy > Copy to Clipboard as Image (EMF) from the context menu.
•
Press
Ctrl-Alt-Shift-C
.
Paste
You can select different paste methods according to what you have copied.
•
Most commonly you will paste copied diagram elements obtained using the "Copy within BPVA" command, in that
case you can choose whether the pasted diagram elements will share the same model as the source elements.
•
If you have copied an image to the clipboard, either within BP-VA or using external applications, you can paste the
copied content as an image shape in the diagram.
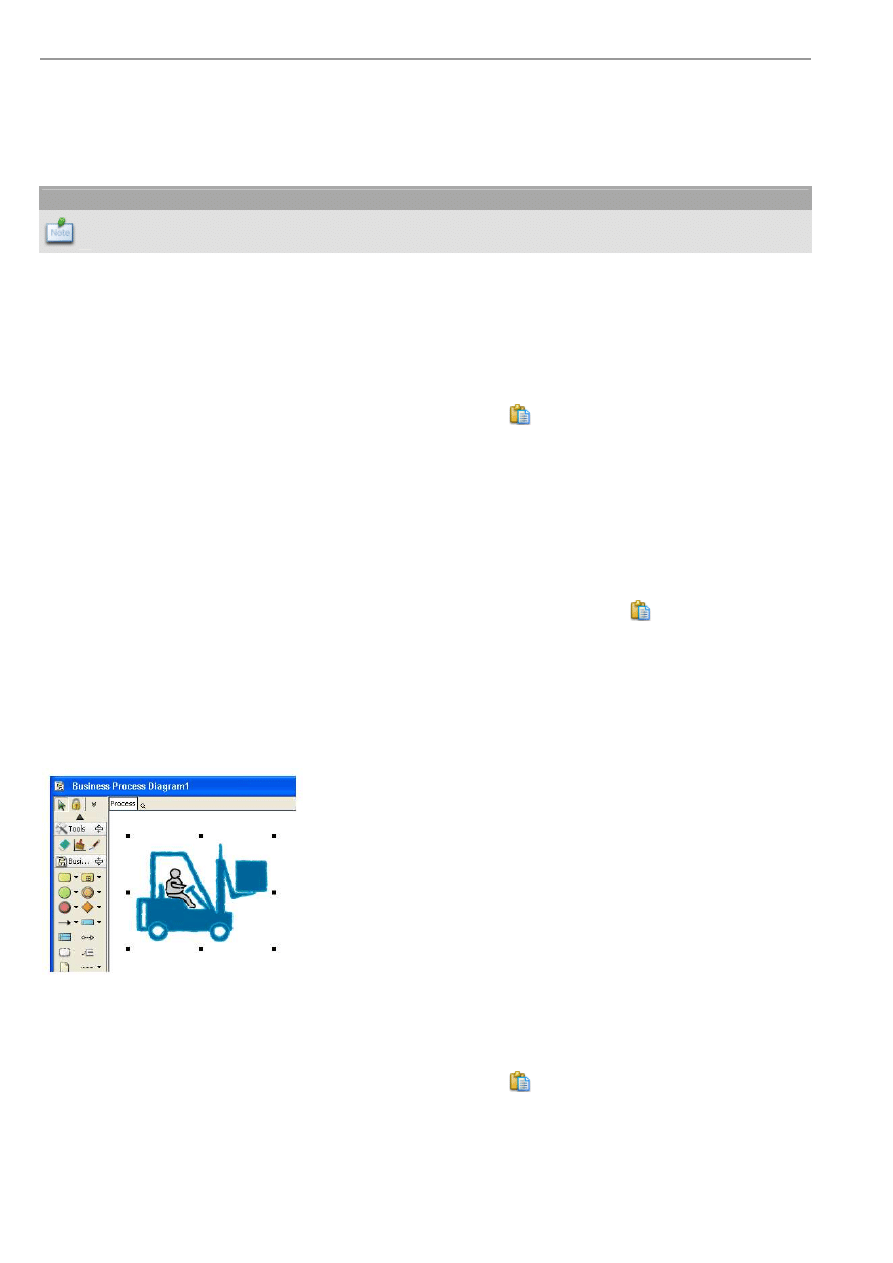
BP-VA User’s Guide
Chapter 5 – Copying and Exporting Diagrams
5-4
Pasting Copied Diagram Elements
You can paste the copied diagram elements to the current diagram or another one. There are two ways in pasting diagram
elements. One is to paste with model sharing and another one is to paste without model sharing.
Note
You can only paste the content that is copied using the "Copy within BPVA" command.
Pasting with Model Sharing
The pasted diagram elements share the same model of the copied diagram elements. Any changes made on the model of pasted
elements will result in the same changes appearing on the model of the elements copied.
To paste diagram element with model sharing, perform one of the following actions:
•
Select Edit > Paste from main menu.
•
Click on the Paste drop down button on the toolbar and select Paste
from the drop down menu.
•
Right-click on the target diagram and choose Paste from the context menu.
•
Press
Ctrl-V
Pasting without Model Sharing
It clones a copy of the copied diagram elements, including their model, and pastes them to the diagram.
To paste diagram elements without model sharing, perform one of the following actions:
•
Select Edit > Paste (not Share Model) from main menu.
•
Click on the Paste drop down button on the toolbar and select Paste (not Share Model)
from the drop down
menu.
•
Right-click on the target diagram and choose Paste (not Share Model) from the context menu.
Pasting as Image Shape
With image shape, you can easily annotate and document your diagrams with related images, Instead of creating an image
shape manually, you can copy an image from any application to the clipboard and then paste it to the diagram as a new shape.
Figure 5.2 - Image Shape
To paste an image shape, perform one of the following actions:
•
Select Edit > Paste from main menu.
•
Click on the Paste drop down button on the toolbar and select Paste
from the drop down menu.
•
Right-click on the target diagram and choose Paste from the context menu.
•
Press
Ctrl-V
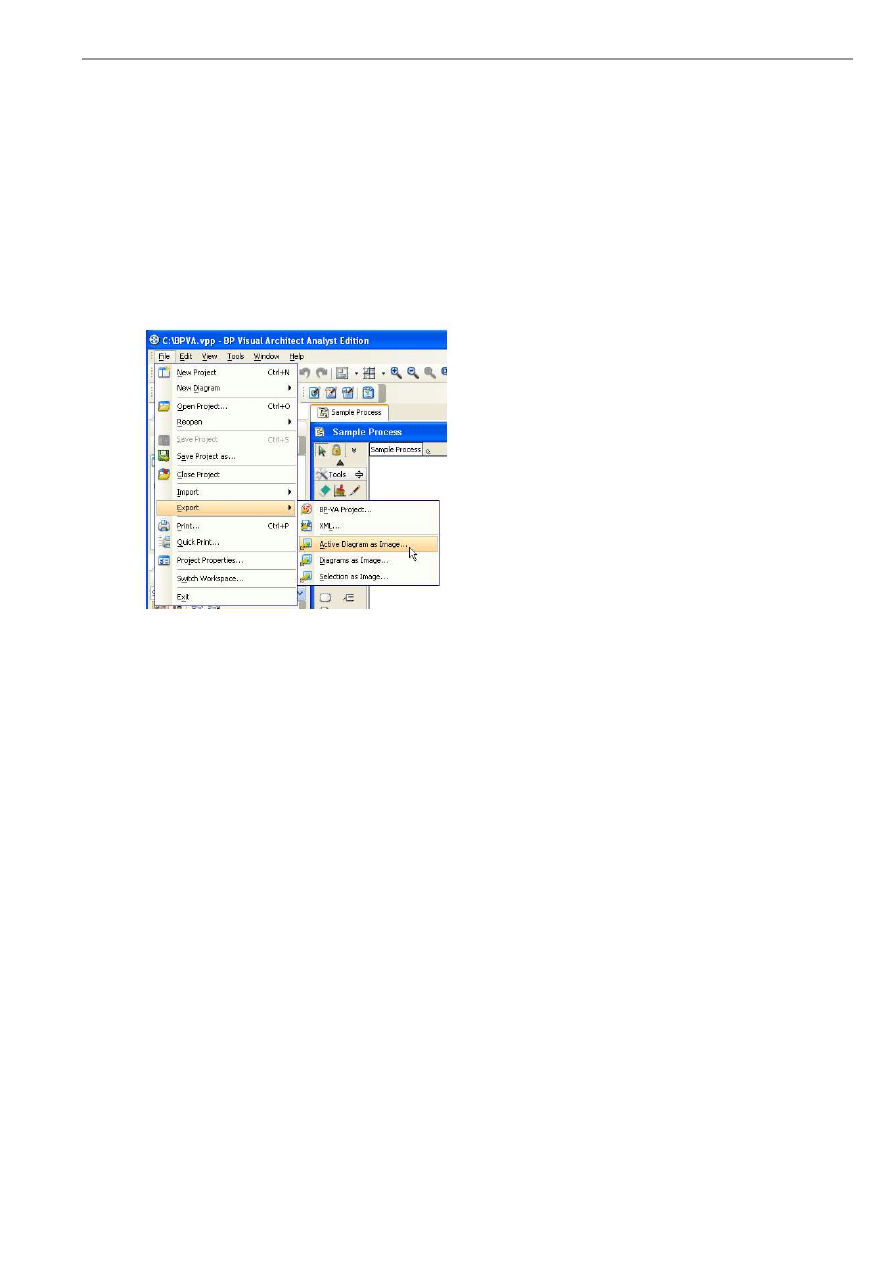
BP-VA User’s Guide
Chapter 5 – Copying and Exporting Diagrams
5-5
Exporting Diagram as Images
Exporting the Active Diagram as an Image
This feature is to export the active diagram as image file. To export the active diagram as image file, perform one of the
following actions:
•
Select File > Export > Active Diagram as Image...from main menu.
•
Click on the Export Image drop down button on the toolbar and select Export Active Diagram as Image from the
drop down menu.
Figure 5.3 - Exporting the active diagram as image
In both cases, a file chooser dialog box will appear where you can specify the destination file path of the image, and you can
select the image format of the exported image.
Exporting Diagrams as Images
This feature is to export one or more diagrams as images. To export the active diagram as image file, perform one of the
following actions:
•
Select File > Export > Diagrams as Image... from main menu.
•
Click on the Export Image drop down button on the toolbar and select Export Diagram as Image from the drop
down menu.
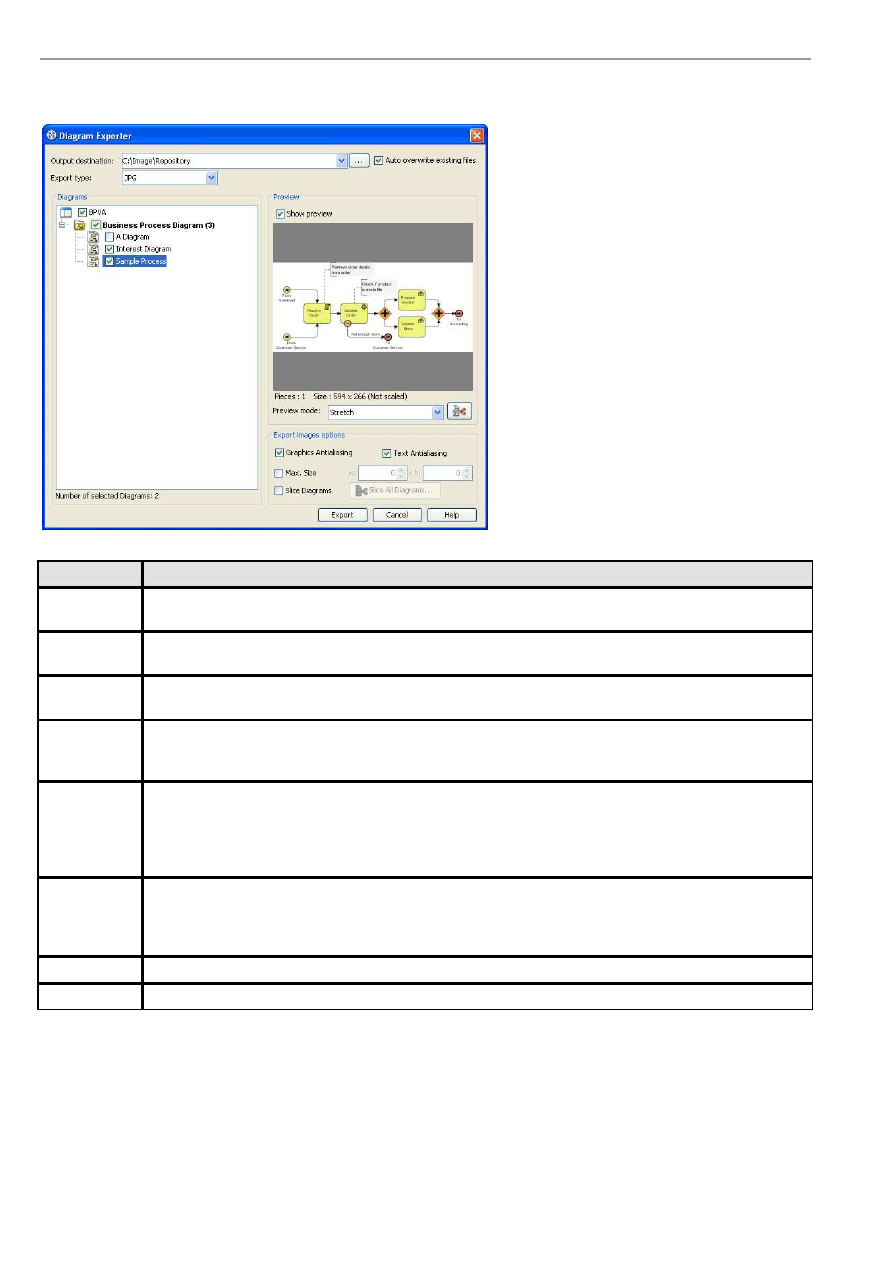
BP-VA User’s Guide
Chapter 5 – Copying and Exporting Diagrams
5-6
In both cases, the Diagram Exporter dialog box will be displayed. You can specify the diagrams to export, and preview the
exported image. After you have configured the export settings click Export to export the diagrams.
Figure 5.4 - Diagram Exporter
Field
Description
Output
destination
The Output destination is the directory where all the exported images are saved to. You can enter the path in
the text field directly, or you can click on the ... button to browse for the directory.
Auto overwrite
existing files
You can check the Auto overwrite existing files checkbox to allow overwrite of files in the export process.
Export type
To select the image format of the exported image click on the pull-down box beside the Export type field
and select the format you want to use.
Diagrams
The Diagrams pane shows the diagrams in the current project. Check the checkbox beside the diagram that
you want to export. The number of selected diagrams is displayed at the bottom of the Diagrams pane.
Besides, the Preview pane allows you to preview the exported image of the selected diagram.
Preview
The Preview pane shows the preview of the exported image of the selected diagram in the Diagrams pane.
You can check/uncheck the Show preview checkbox to enable/disable the preview.
You can select the size of the preview image by selecting from the pull-down box beside the Preview mode
field. Selecting Stretch will show the image in scaled size that fits to the preview area, while selecting Real
size will show the image in its actual size.
Anti-aliasing
Anti-aliasing is a method which handles the staircase pixels of slanted lines and curves to make them look
smoother. You can apply anti-aliasing to the exported images. To apply anti-aliasing to graphics, check the
Graphics Antialiasing checkbox. Likewise, you can check the Text Antialiasing checkbox to apply anti-
aliasing to text.
Max. Size
Specify the maximum size of the exported images.
Slice Diagram
Split exported images as slices.
Table 5.1
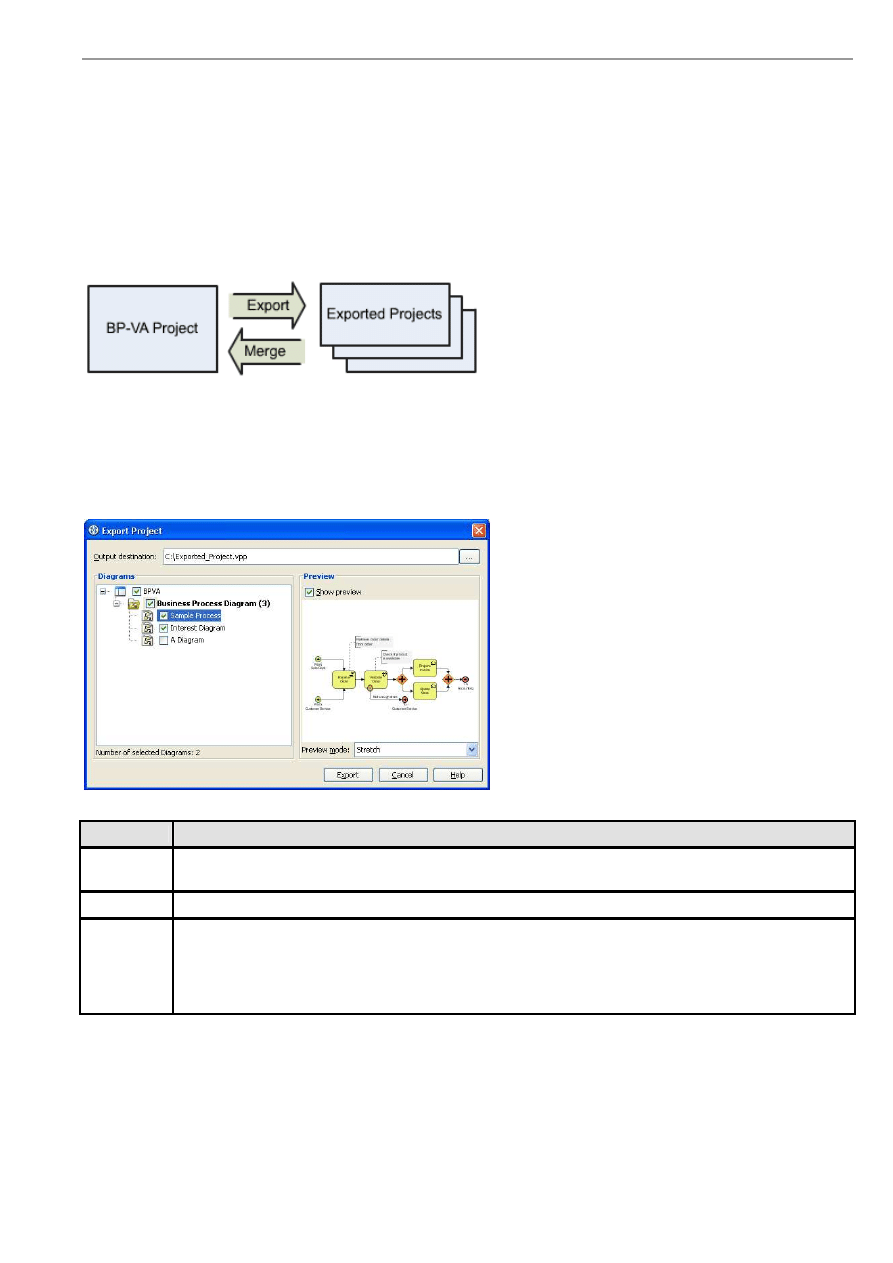
BP-VA User’s Guide
Chapter 5 – Copying and Exporting Diagrams
5-7
Exporting and Importing (Merging) of Project
If you are maintaining a large BP-VA project that contains many diagrams, you can use the export project facility to split it into
smaller projects by selecting the desired diagrams. Each exported project is self-contained, which means it has all the diagrams
and model elements of the selected diagrams, and the modification of the project does not affect the original project that it is
derived from.
After you have modified the exported project, you can merge the changes to the original project using the merge project
facility. The project export and merge facilities together facilitate the sharing of a project among collaborative workers.
Figure 5.5 - Export/Import projects
Exporting Project
To export the current project into a new project, choose File > Export > BP-VA Project... from main menu. This displays the
Export Project dialog box. Specify all the relevant information and click Export.
Figure 5.6 - The Export Project dialog box
Field
Description
Output
destination
The Output destination is the file path where the exported project is saved to. You can enter the path in the
text field directly, or you can click on the ... button to browse for a BP-VA project file.
Diagrams
Check the diagrams for exporting. Models inside those diagrams will also be exported.
Preview
The Preview pane shows the preview of the exported image of the selected diagram in the Diagrams pane.
You can check/uncheck the Show preview checkbox to enable/disable the preview.
You can select the size of the preview image by selecting from the pull-down box beside the Preview mode
field. Selecting Stretch will show the image in scaled size that fits to the preview area, while selecting Real
size will show the image in its actual size.
Table 5.2

BP-VA User’s Guide
Chapter 5 – Copying and Exporting Diagrams
5-8
Importing (Merging) a BP-VA Project
To import a project, open the master project in BP-VA (the project where the exported projects are derived from). After that,
select File > Import > BP-VA Project... from main menu. This displays the Open dialog box. In the dialog, locate the BP-VA
project file (with extension .vpp) and click Open to open the project file. The changes in the selected project will be merged to
the master project.
Note
You can select a project to be imported even it is not created using project export. However, the merging
process will update every model elements in the project, instead of only the modified elements.

6
Business Process Diagram Samples
To have better understanding of modeling business process from problem statement to
business process diagram. We are providing some samples:
In this chapter:
Retail Sales
Car Rental
Software Helpdesk
Online Store
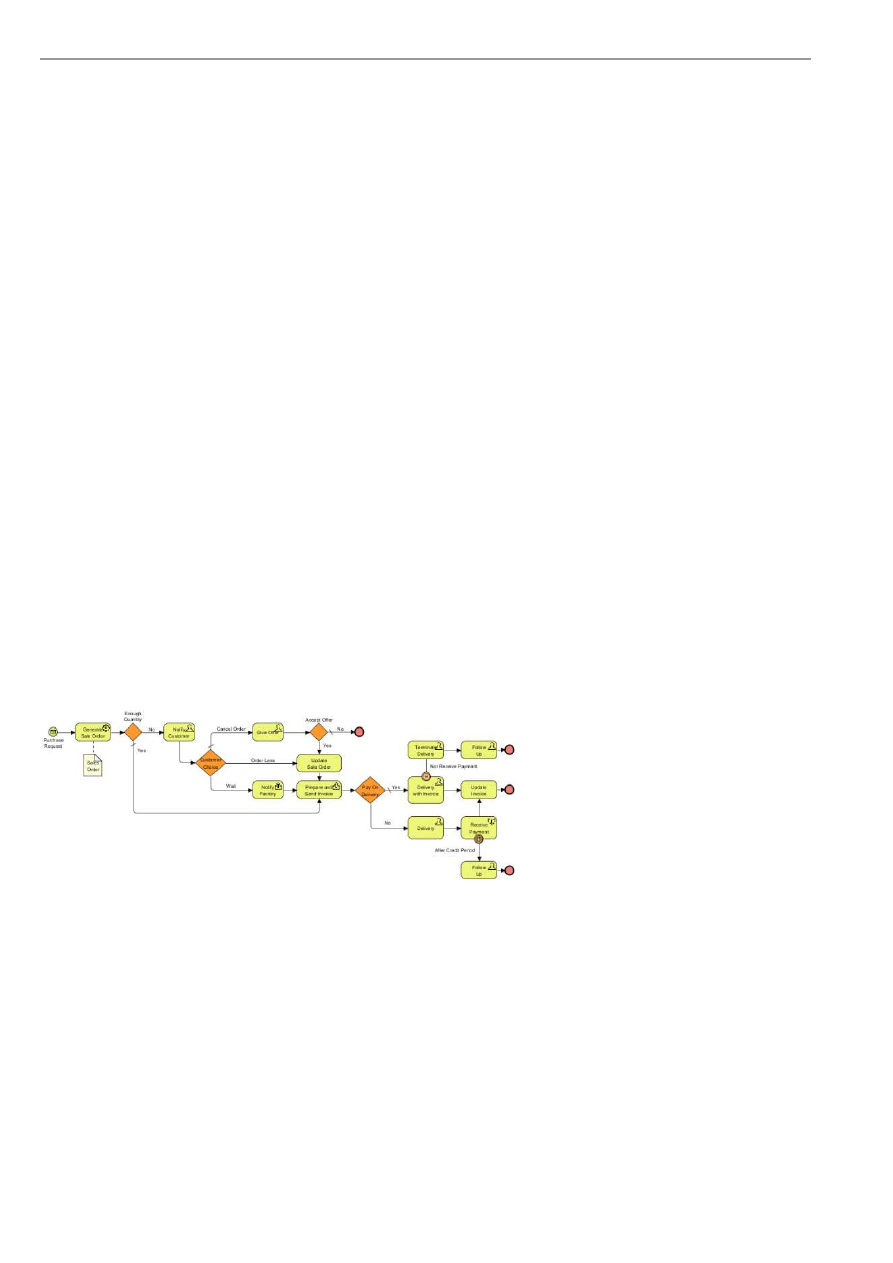
BP-VA User’s Guide
Chapter 6 – Business Process Diagram Samples
6-2
Chapter 6 - Business Process Diagram Samples
Retail Company
ABC is a retail company. The following problem statement and business process diagram describe the flow of sales order with
delivery and payment arrangement. In addition, it mentions some of exception handling within the process.
Problem Statement
ABC retail sales company wants to keep track of its sale. Purchase requests from customer will automatic generate a sale order
with a generated unique number and a calculated total amount. Each sale order contains a unique number, a set of ordered
products, a total amount, a payment arrange, a state and an invoice. Each order product contains order product identify and
order quantity. If one or more purchasing product is not containing enough quantity for the sales order, the sales order then will
hand over to customer service for notify customer about the particular situation. Otherwise, the sales order is approved and
continue with delivery part.
In the situation of not enough quantity, customer service will ask customer to choose one of possible solution which are wait,
order less and cancel order. If wait is chosen, an urgent production request is sent to factory. If order less is chosen, the sale
order will be updated. Otherwise, cancel order is default chosen. Customer service will try to give special offer to customer.
Sales order will be update is customer accept the offer or the sales order will be cancelled. After customer choosing wait or
order less solution and performed the relative actions, the sales order is approved and continue with delivery part.
In delivery part, an invoice will be prepared and sent for the approved sales order. Then the ordered products will wait for
payment and delivery. There are two kinds of receiving payment arrange, POD and credit period. By default, sales orders are
POD (Pay on delivery) ignores special offer aspects. In case of POD, the payment must receive on or before the ordered
products delivery or the delivery will be terminated and the sales order will forward to customer service with follow up action.
In the other arrange credit period, ordered products will delivery first and the payment is accepted for delay within a period. If
the period is past and the payment is not yet received, the sales order will forward to customer service with follow up action. In
addition, when a payment is received no matter which kind of receiving payment arrange, the invoice will be updated and the
sales order will be completed.
Business Process Diagram
Figure 6.1 - Business Process Diagram (Retail Company)
Car Rental Process
Car rental Process is a business process about the flow of renting car to public of a car rental agency. It describes the main flow
of rent car contract with some business constraints.
Problem Statement
A car rental agency rents cars to the public. A customer can rent a car if they have a valid driver's license and can pay for the
rental. A rental contract is drawn up to reflect the details. There are 3 classifications of cars based on size. Within each
classification, both wagons and sedans and both automatic and manual transmission versions are maintained. A contract is
terminated once the rental is complete. Rental of trucks is being considered.
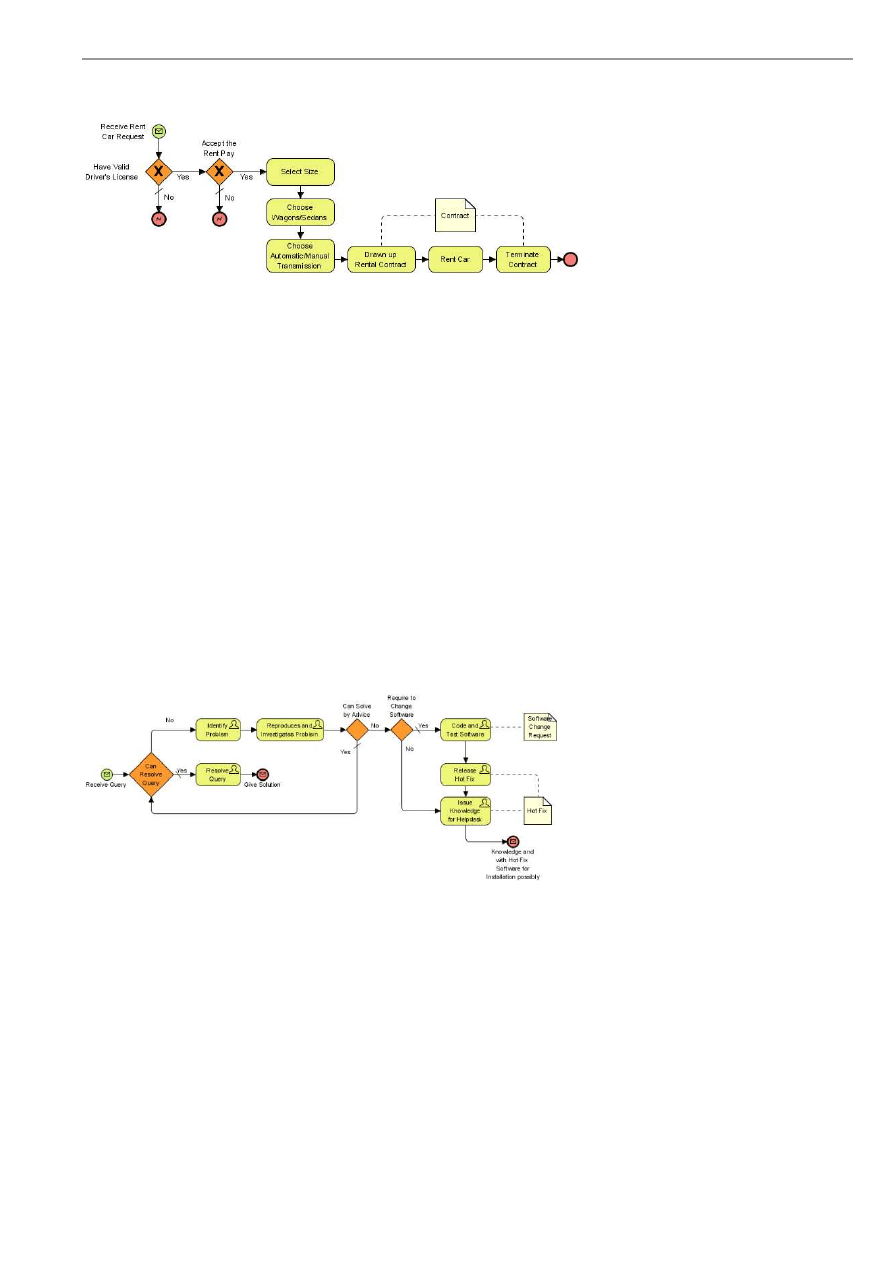
BP-VA User’s Guide
Chapter 6 – Business Process Diagram Samples
6-3
Business Process Diagram
Figure 6.2 - Business Process Diagram (Car Rental Process)
Software Helpdesk
Software Helpdesk is a process about technical support of ABC Software Helpdesk. It describes the flow of customers' queries
with the follow up actions.
Problem Statement
ABC Software Helpdesk received customers' queries related to the software products they supported. If the helpdesk staff can
resolve the queries, they do so and give the customer a solution; otherwise they identify a problem and refer this to Second-line
Support. Second-line Support then reproduces and investigates the problem. If it can be solved by advice, they refer it back to
Helpdesk staff; otherwise, if there is a software defect which required a change to the software, they raise a software change
request to the Software Development Team. After the software is coded and tested, the hot fix will be released and hand over to
Second-line Support to follow the outstanding case. Whatever the software has changed or not, Second-line Staff will issue the
knowledge for the Helpdesk staff to inform the customers. The Customer will then receive the knowledge and the hot fix
software for installation if exist.
Business Process Diagram
Figure 6.3 - Business Process Diagram (Software Helpdesk)
Online Store
Online Store is a process about sales of an online store. It describes the flow of sales order with its creation and payment
arrangement. In addition, it includes some business rule within the process.
Problem Statement
A customer can place one or more orders from an online store. Each customer has a credit rating. If the credit rating is good,
the customer can make the payment either with a credit card or a bank check. However, if the credit rating is poor, the
customer has to pay in cash. Each order is an aggregate of different order items. A customer's order can have multiple items
with varying quantities. Draw a Business Process Diagram for the above online store transaction.
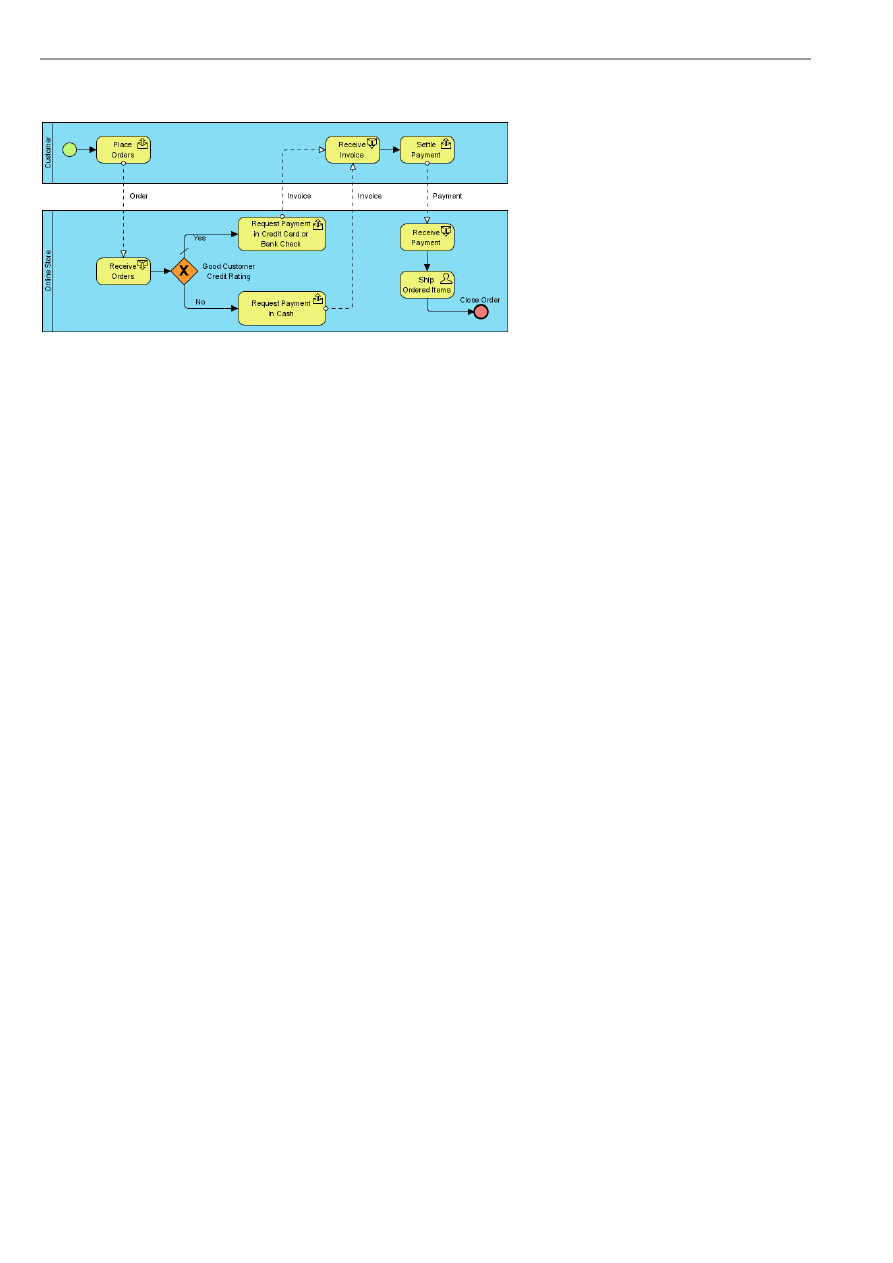
BP-VA User’s Guide
Chapter 6 – Business Process Diagram Samples
6-4
Business Process Diagram
Figure 6.4 - Business Process Diagram (Online Store)
Wyszukiwarka
Podobne podstrony:
01 bpva user guide
01 vpuml user guide
01 vpuml user guide
iR Shell 3 9 User Guide
FX2N 422 BD User's Guide JY992D66101
NoteWorthy Composer 2 1 User Guide
BlackBerry 8820 User Guide Manual (EN)
intel fortran user guide 2
06 User Guide for Artlantis Studio and Artlantis Render Export Add ons
Flash Lite User Guide Q6J2VKS3J Nieznany
Active HDL 63SE User Guide
ACCU Check compact user guide products
Proc SQL User's Guide
arduino mini user guide id 6826 Nieznany (2)
cinestyle profile user guide v1 Nieznany
ANSYS LS Dyna User's Guide
AE CS3 USER GUIDE EPIC TRAILER TEMPLATE
PayPal Virtual Terminal User’s Guide
iR Shell 3 8 User Guide
więcej podobnych podstron