Chapter 17: Thermodynamics 17-1
Chapter 17: Thermodynamics
‘We can express the fundamental laws of the universe which correspond to the two
fundamental laws of the mechanical theory of heat in the following simple form. 1. The
energy of the universe is a constant. 2. The entropy of the universe tends toward a
maximum.” Rudolf Clausius
17.1 Introduction
Thermodynamics is the study of the relationships between heat, internal energy, and the mechanical work
performed by a system. The system considered is usually a heat engine of some kind, although the term can also
be applied to living systems such as plants and animals. There are two laws of thermodynamics. The first law of
thermodynamics is the law of conservation of energy as applied to a thermodynamic system. We will apply the
first law of thermodynamics to a heat engine and study its ramifications. The second law of thermodynamics tells
us what processes are, and are not, possible in the operation of a heat engine. The second law is also responsible
for telling us in which direction a particular physical process may go. For example a block can slide across a desk
and have all of its kinetic energy converted to thermal energy by the work the block does against friction as it is
slowed to a stop. However, the reverse process does not happen, that is, the thermal energy in the block does not
convert itself into mechanical energy and cause the block to slide across the desk. Using the thermal energy in the
block to cause mechanical motion is not a violation of the law of conservation of energy but it is a violation of the
second law of thermodynamics.
17.2 The Concept of Work Applied to a Thermodynamic System
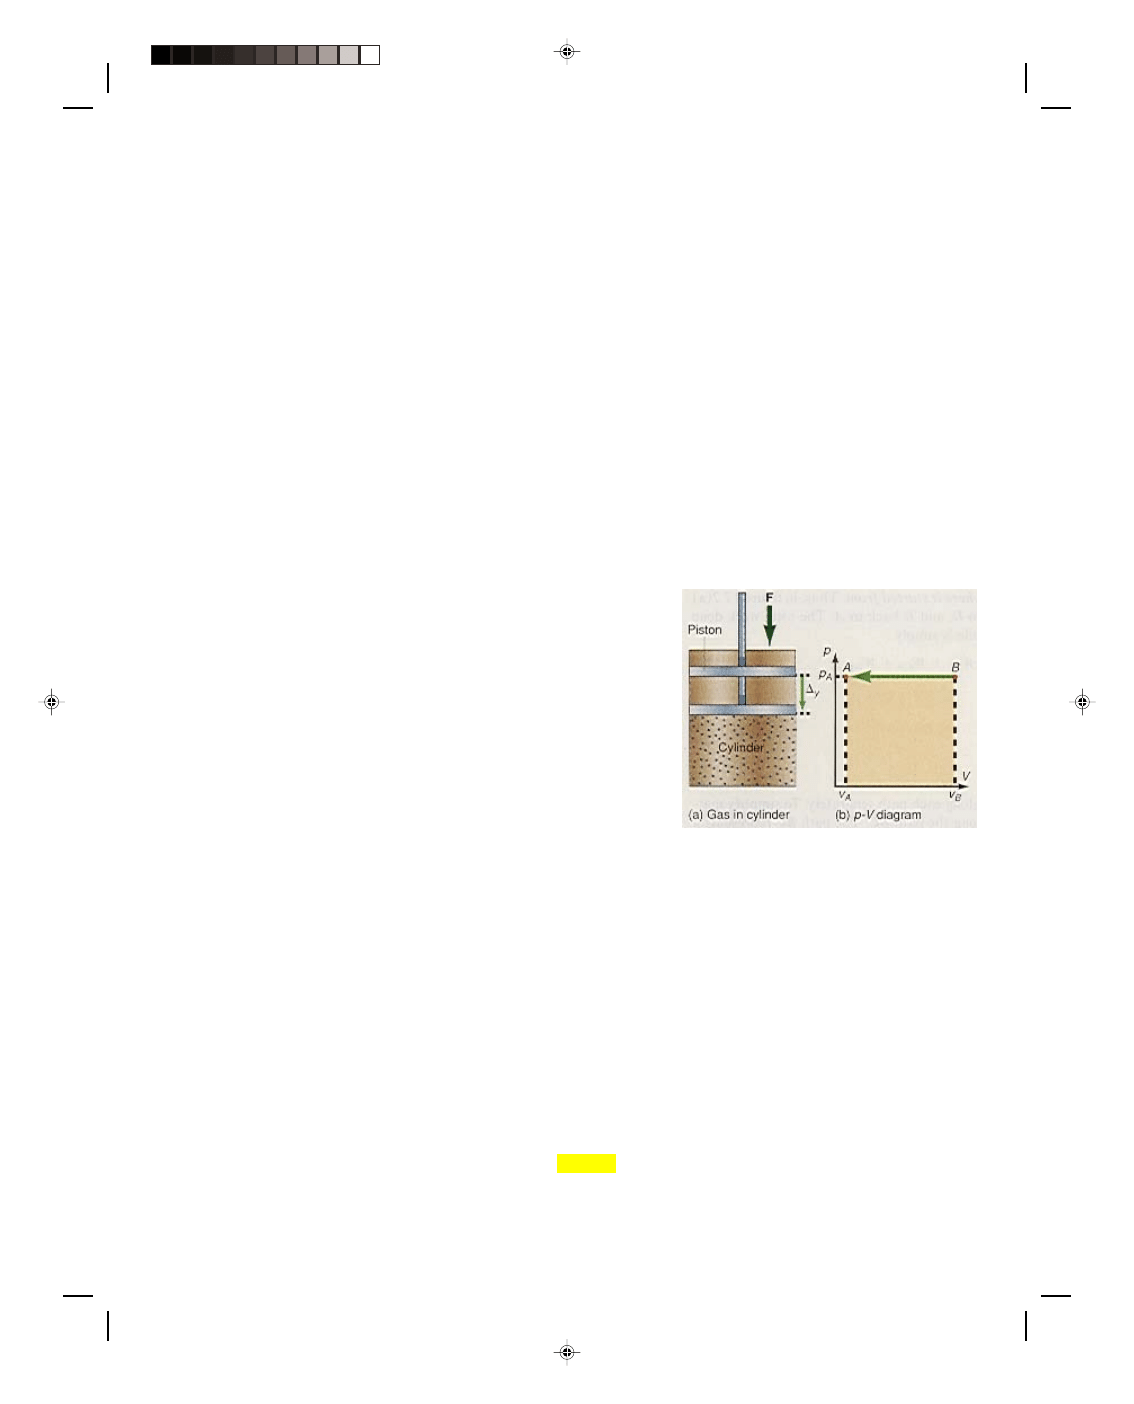
Consider what happens to an ideal gas in a cylinder when it is
compressed by a constant external force F, as shown in figure
17.1(a). The constant force exerted on top of the piston causes it to
be displaced a distance
∆y, thereby compressing the gas in the
cylinder. The work done on the gas by the external force in
compressing it is
W = F
∆y (17.1)
This work by the external agent is positive because the external
force and the displacement are in the same direction. The external
force F and the external pressure p exerted on the gas by the piston
are related by
F = pA (17.2)
where A is the cross-sectional area of the piston.
Figure 17.1
Work done in compressing a gas.
Substituting equation 17.2 into equation 17.1 gives
W = pA
∆y (17.3)
which is the work done on the gas by the external agent. If the compression takes place very slowly, the constant
external pressure exerted by the piston on the gas is equal to the internal pressure exerted by the gas throughout
the process. Thus, equation 17.3 can also be interpreted as the work done by the gas rather than the external
agent. This is a departure from the usual way we have analyzed the concept of work. Previously, we have always
considered the work as being done by the external agent. From this point on, we will consider all the work to be
done on or by the gas itself, not the external agent. The product of the area of the cylinder and the displacement of
the gas is equal to the change in volume of the gas. That is,
A
∆y = ∆V (17.4)
the decrease in the volume of the gas. Substituting equation 17.4 into 17.3 gives
W = p
∆V (17.5)
Pearson Custom Publishing
505

17-2 Vibratory Motion, Wave Motion and Fluids
Equation 17.5 represents the amount of work done by the gas when a constant external force compresses it by an
amount
∆V.
This entire process can be shown on a pressure-volume ( p-V) diagram as in figure 17.1(b). The original
state of the gas is represented as the point B in the diagram, where it has the volume V
B
and the pressure p
A
. As
the piston moves at constant pressure, the system, the gas in the cylinder, moves from the state at point B to the
state at point A [figure 17.1(b)] along a horizontal line indicating that the process is occurring at constant
pressure. At point A in the figure, the gas has been compressed to the volume V
A
. The change in volume of the gas
is seen to be
∆V = V
A
_
V
B
(17.6)
The total work done by the gas in compressing it from the point B to the point A, found from equations 17.5 and
17.6, is
W
BA
= p
A
(V
A
_
V
B
)
It is important to note here that the product of p
A
and V
A
_
V
B
represents the area of the rectangle cross-hatched in
figure 17.1(b). Thus, the area under the curve in a p-V diagram always represents a quantity of work. When the
area is large, it represents a large quantity of work, and when the area is small the quantity of work likewise is
small.
Because V
A
is less than V
B
, the quantity V
A
_
V
B
is negative. Thus, when work is done by a gas in
compressing it, that work is always negative. Notice that there are two distinct agents here. The work done by the
external agent in compressing the gas is positive, but the work done by the gas in a compression is negative.
If the gas in the cylinder of figure 17.1(a) is allowed to expand back to the original volume V
B
, then the
process can be represented on the same p-V diagram of figure 17.1(b) as the same straight line, now going from
point A to the point B. The work done by the gas in the expansion from A to B is
W = p
∆V = p
A
(V
B
_
V
A
)
But now note that since V
B
is greater than V
A
, the quantity V
B
_
V
A
is now a positive quantity. Thus, when a gas
expands, the work done by the gas is positive. (The work done on the gas by an external agent during the expansion
would be negative. From this point on let us consider only the work done by the gas and forget any external agent.)
Thus, the work done by a gas during expansion is positive and the work done by a gas during compression is
negative. In either case, the work done is still the area under the line AB given by the product of the sides of the
rectangle p
A
and V
B
_
V
A
. The areas are the same in both cases, however we consider the area positive when the
gas expands and negative when the gas is compressed.
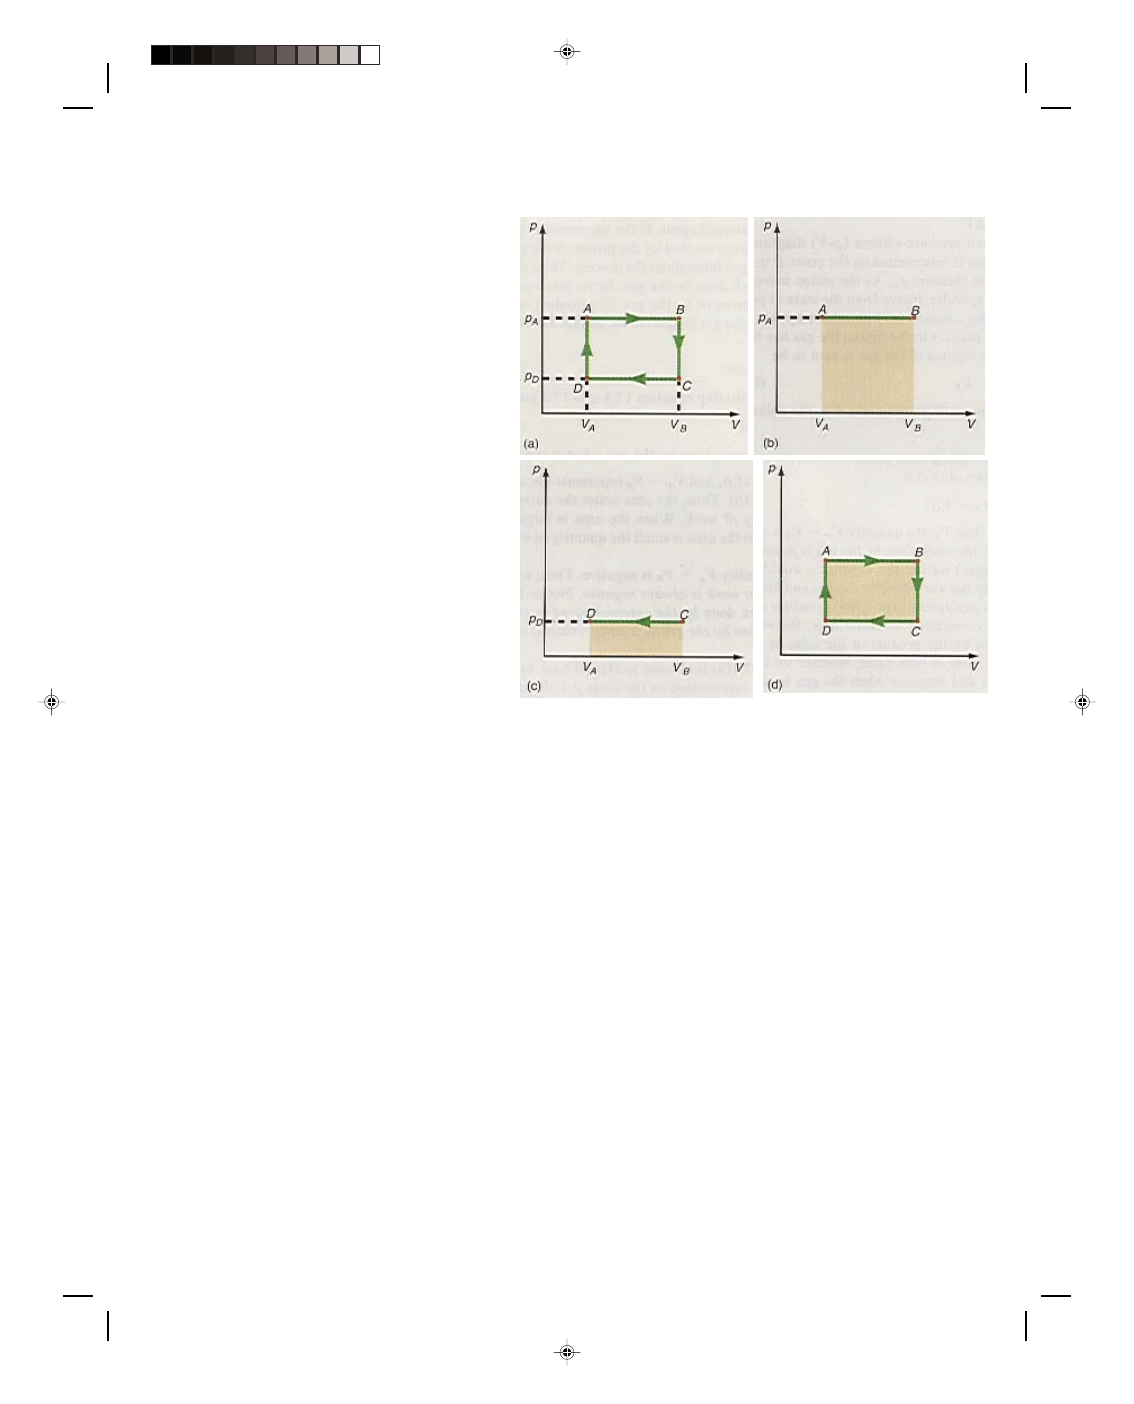
Let us now consider the work done along the different paths of the cyclic process shown in the p-V diagram
of figure 17.2. A cyclic process is a process that runs in a cycle eventually returning to where it started from. Thus,
in figure 17.2(a) the cycle goes from A to B, B to C, C to D, and D back to A. The total work done by the system as
it goes through the cycle is simply
W
total
= W
AB
+ W
BC
+ W
CD
+ W
DA
(17.7)
where
W
AB
is the work done on the path AB
W
BC
is the work done on the path BC
W
CD
is the work done on the path CD
W
DA
is the work done on the path DA
Let us consider the work done along each path separately. To simplify matters let us first look at the work
done along the path BC. The path BC represents a process that is performed at the constant volume V
B
. Therefore,
∆V = 0, and no work is performed along BC. Formally,
W
BC
= p(V
B
_
V
B
) = 0 (17.8)
Similarly, along the path DA, the volume is also a constant and therefore
∆V is again zero, and hence the
work done must also be zero. Formally,
W
DA
= p(V
A
_
V
A
) = 0 (17.9)
Since the work is given by p
∆V, whenever V is a constant in a process, ∆V is always zero and the work is also zero
along that path in the p-V diagram.
Pearson Custom Publishing
506
Chapter 17: Thermodynamics 17-3
The work done along the path AB is
W
AB
= p
A
∆V = p
A
(V
B
_
V
A
) (17.10)
Because the path AB represents an expansion,
positive work is done by the gas, as is
evidenced by the fact that V
B
_
V
A
is a positive
quantity. The work done along the path AB is
shown as the area under the line AB in figure
17.2(b).
The work done along the path CD is
W
CD
= p
D
∆V = p
D
(V
A
_
V
B
) (17.11)
Since the path CD represents a compression,
work is done on the gas. This work is
considered negative, as we can see from the
fact that V
A
_
V
B
, in equation 17.11, is
negative. The work done on the gas is shown
as the area under the line CD in figure
17.2(c).
The net work done by the gas in the
cyclic process ABCDA, found from equation
17.7 with the help of equations 17.8 through
17.11, is
W
total
= W
AB
+ W
BC
+ W
CD
+ W
DA
(17.7)
W
total
= p
A
(V
B
_
V
A
) + 0 + p
D
(V
A
_
V
B
) + 0
Figure 17.2
Work done in a cyclic process.
We can rewrite this to show that the work along CD is negative, that is, V
A
_
V
B
=
_
(V
B
_
V
A
). Hence,
W
total
= p
A
(V
B
_
V
A
)
_
p
D
(V
B
_
V
A
)
or
W
total
= ( p
A
_
p
D
)(V
B
_
V
A
) (17.12)
Thus, equation 17.12 represents the net work done by the gas in this particular cyclic process. Note that p
A
_
p
D
is
one side of the rectangular path of figure 17.2(a) while V
B
_
V
A
is the other side of that rectangle. Hence, their
product in equation 17.12 represents the entire area of the rectangle enclosed by the thermodynamic path ABCDA
and is shown as the cross-hatched area in figure 17.2(d). Another way to visualize this total area, and hence total
work, is to subtract the area in figure 17.2(c), the negative work, from the area in figure 17.2(b), the positive work,
and we again get the area bounded by the path ABCDA. Although this result was derived for a simple rectangular
thermodynamic path, it is true in general. Thus, in any cyclic process, the net work done by the system is equal to
the area enclosed by the cyclic thermodynamic path in a p-V diagram. Therefore, to get as much work as possible
out of a system, the enclosed area must be as large as possible. The net work is positive if the cycle proceeds
clockwise, in the p-V diagram, and negative if the cycle proceeds counterclockwise. Finally, we should note that the
process AB takes place at the constant pressure p
A
. A process that takes place at a constant pressure is called an
isobaric process. Hence, the process CD is also an isobaric process because it takes place at the constant
pressure p
D
. Process BC takes place at the constant volume V
B
, and process DA takes place at the constant volume
V
A
. A process that takes place at constant volume is called an isochoric or isometric process.
There is another type of process that is very important in thermodynamic systems, the isothermal process.
An isothermal process is a process that occurs at a constant temperature, that is,
∆T = 0 for the process. A picture
of an isotherm can be drawn on a p-V diagram by using the equation of state for an ideal gas, the working
substance in the system. Thus, the ideal gas equation, given by equation 15.23, is
Pearson Custom Publishing
507
17-4 Vibratory Motion, Wave Motion and Fluids
pV = nRT
Because n and R are constants, if T is also a constant, then the
entire right-hand side of equation 15.23 is a constant. We can then
write equation 15.23 as
pV = constant (17.13)
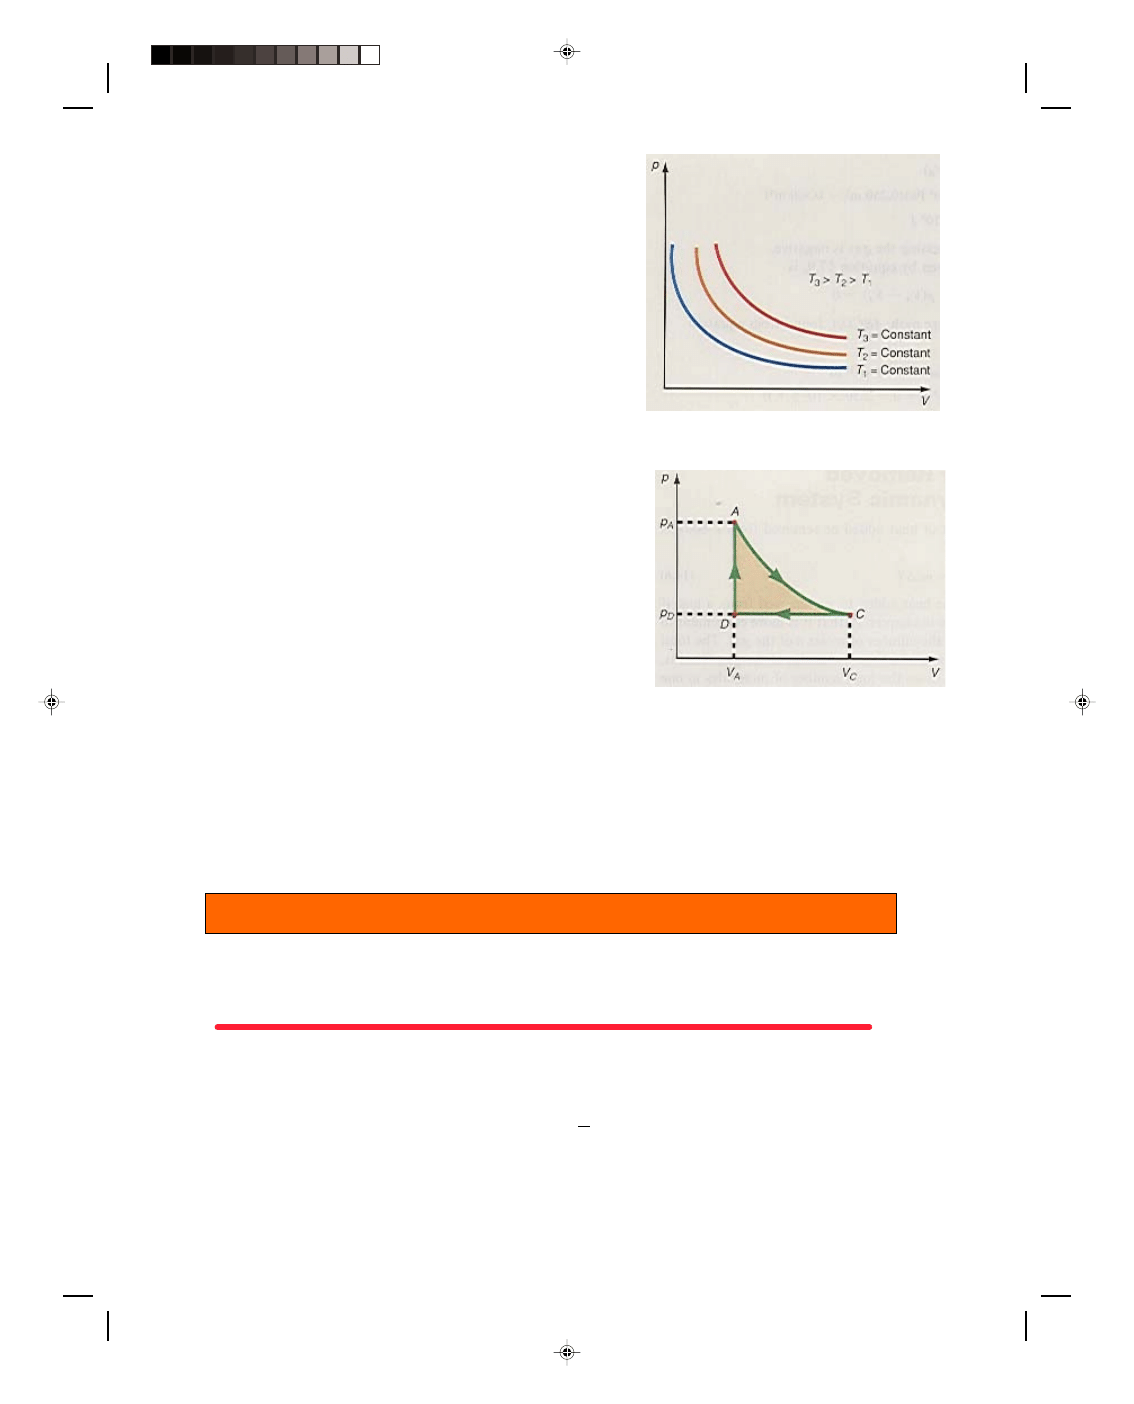
If we plot equation 17.13 on a p-V diagram, we obtain the hyperbolic
curves of figure 17.3. Each curve is called an isotherm and in the
figure, T
3
is greater than T
2
, which in turn is greater than T
1
.
Let us now consider the new cyclic process shown in figure
17.4, in which an ideal gas in a cylinder expands against a piston
isothermally. This is shown as the path AC in the p-V diagram. To
physically carry out the isothermal process along the path AC, the
Figure 17.3
Isotherms on a p-V diagram.
cylinder is surrounded by a constant temperature heat reservoir. The
cylinder either absorbs heat from, or liberates heat to, the reservoir
in order to maintain the constant temperature. When the isothermal
process is finished the heat reservoir is removed. The gas is then
compressed at the constant pressure p
D
at point C until it reaches the
point D. The pressure of the gas is then increased from p
D
to p
A
while the volume of the gas in the cylinder is kept constant. This is
shown as the path DA in the p-V diagram. Now let us assume that
the points A, C, and D are the same points that were considered in
figure 17.2(a). Recall that the net work done by the system is equal to
the area enclosed by the cyclic path. Thus, the net work done in this
process is equal to the cross-hatched area within the path ACDA
shown in figure 17.4.
Figure 17.4
Cyclic process with an
isothermal expansion.
It is important to compare figure 17.2(d) with figure 17.4. Remember the points A, C, and D in figure 17.4
are the same as the points A, C, and D in figure 17.2(d). But the area under the enclosed curve in figure 17.2(d) is
greater than the enclosed area in figure 17.4. Hence, a greater amount of work is done by the system in following
the cyclic path ABCDA than the cyclic path ACDA. Thus, the work that the system does depends on the
thermodynamic path taken. Even though both processes started at point A and returned to the same point A, the
work done by the system is different in each case. This result is succinctly stated as: the work done depends on the
path taken, and work is a path dependent quantity.
Example 17.1
Work done in a thermodynamic cycle. One mole of an ideal gas goes through the thermodynamic cycle shown in
figure 17.2(a). If p
A
= 2.00 × 10
4
Pa, p
D
= 1.00 × 10
4
Pa, V
A
= 0.250 m
3
, and V
B
= 0.500 m
3
, find the work done
along the path (a) AB, (b) BC, (c) CD, (d) DA, and (e) ABCDA.
Solution
a. The work done along the path AB, found from equation 17.10, is
W
AB
= p
A
(V
B
_
V
A
)
= (2.00 ×
10
4
Pa)(0.500 m
3
_
0.250 m
3
)
= 5.00 ×
10
3
N m
3
m
2
= 5.00 ×
10
3
N m
= 5.00 × 10
3
J
Pearson Custom Publishing
508

Chapter 17: Thermodynamics 17-5
b. The work done along the path BC, found from equation 17.8, is
W
BC
= p(V
B
_
V
B
) = 0
c. The work done along path CD, given by equation 17.11, is
W
CD
= p
D
(V
A
_
V
B
)
= (1.00 ×
10
4
Pa)(0.250 m
3
_
0.500 m
3
)
=
_
2.50 ×
10
3
J
Note that the work done in compressing the gas is negative.
d. The work done along path DA, given by equation 17.9, is
W
DA
= p(V
A
_
V
A
) = 0
e. The total work done along the entire path ABCDA, found from equation 17.7, is
W
total
= W
AB
+ W
BC
+ W
CD
+ W
DA
= 5.00 ×
10
3
J + 0
_
2.50 ×
10
3
J + 0
= 2.50
× 10
3
J
To go to this Interactive Example click on this sentence.
17.3 Heat Added to or Removed from a Thermodynamic System
We saw in chapter 14 that the amount of heat added or removed from a body is given by
Q = mc
∆T (14.6)
Equation 14.6 can also be applied to the heat added to, or removed from, a gas, if two stipulations are made. First,
we saw in chapter 15 that it is more convenient to express the mass m of a gas in terms of the number of moles n
of the gas. The total mass m of the gas is the sum of the masses of all the molecules of the gas. That is, m is equal
to the mass of one molecule times the total number of molecules in one mole of the substance, times the total
number of moles. That is
m = m
0
N
A
n (17.14)
where m
0
is the mass of one molecule; N
A
is Avogadro’s number, the number of molecules in one mole of a
substance; and n is the number of moles of the gas. Notice in equation 15.47, the product of the mass of one
molecule times Avogadro’s number is called the molecular mass of the substance M, that is,
M = m
0
N
A
(17.15)
The molecular mass is thus the mass of one mole of the gas. Substituting equation 17.15 into equation 17.14 gives
for the mass of the gas
m = nM (17.16)
Equation 17.16 says that the mass of the gas is equal to the number of moles of the gas times the molecular mass
of the gas. Substituting equation 17.16 for the mass m of the gas into equation 14.6, gives
Q = nMc
∆T (17.17)
Pearson Custom Publishing
509
17-6 Vibratory Motion, Wave Motion and Fluids
The product Mc is defined as the molar specific heat of the gas, or molar heat capacity, and is represented by the
capital letter C. Hence,
C = Mc (17.18)
The heat absorbed or lost by a gas undergoing a thermodynamic process is found by substituting equation 17.18
into equation 17.17. Thus,
Q = nC
∆T (17.19)
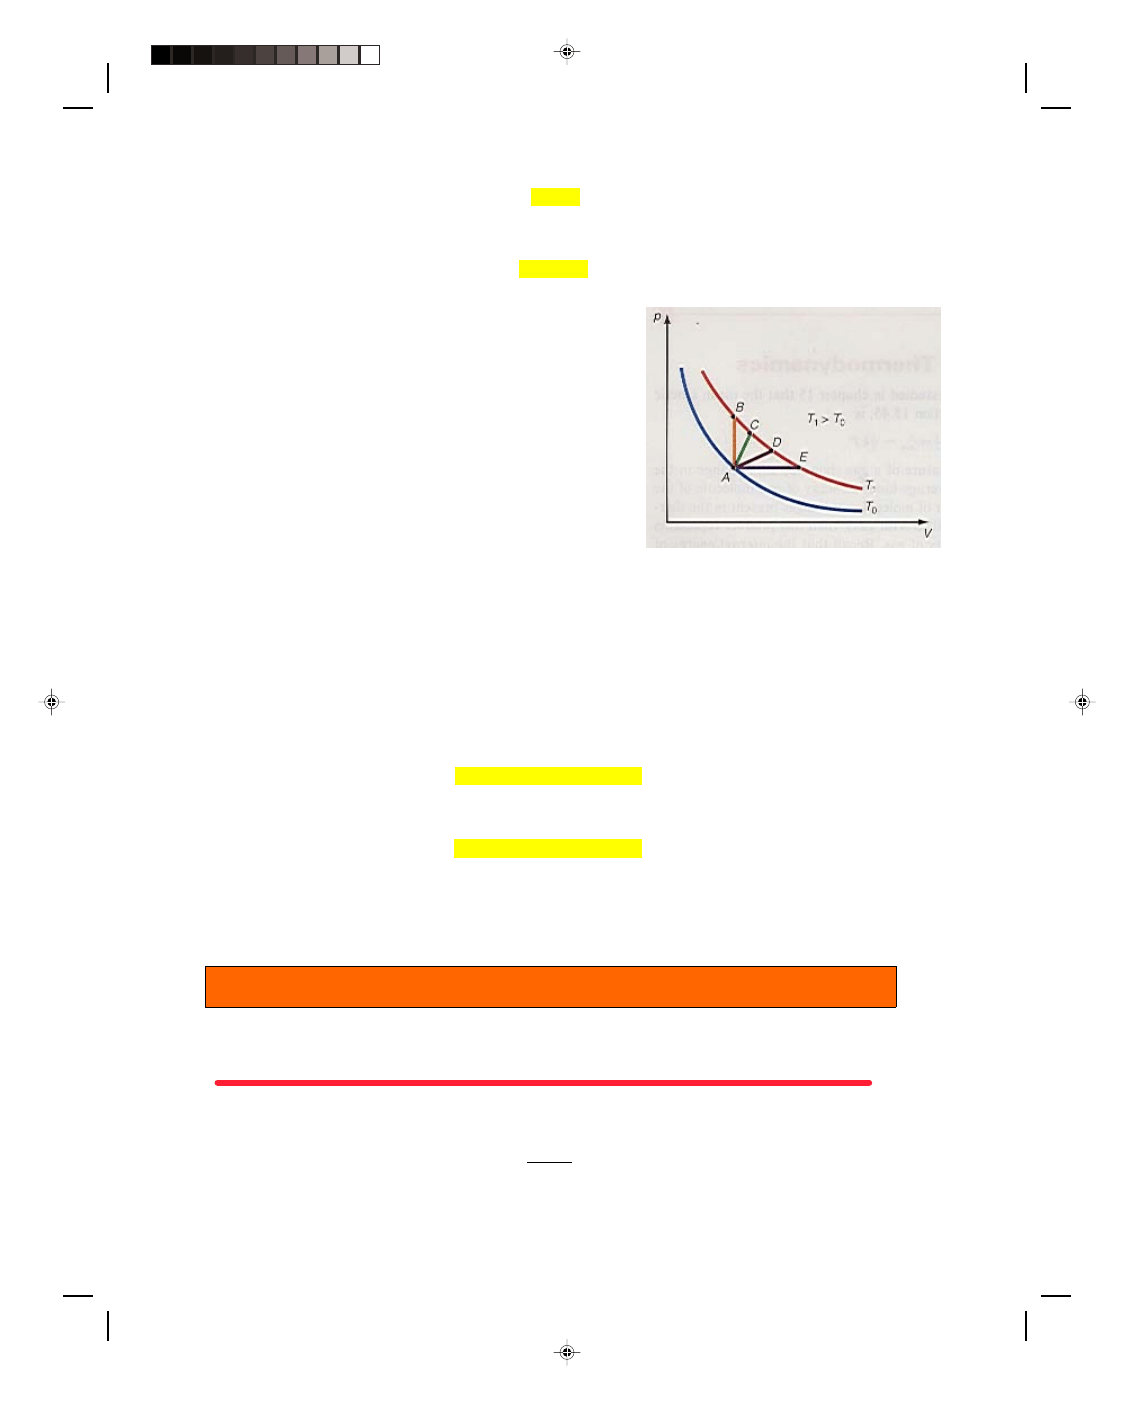
The second stipulation for applying equation 14.6 to gases
has to do with the specific process to which the gas is subjected.
Equation 14.6 was based on the heat absorbed or liberated from a
solid or a liquid body that was under constant atmospheric
pressure. In applying equation 17.19, which is the modified
equation 14.6, we must specify the process whereby the
temperature change
∆T occurs. Figure 17.5 shows some possible
processes. Let us start at the point A in the p-V diagram of figure
17.5. The temperature at point A is T
0
because point A is on the T
0
isotherm. Heat can be added to the system such that the
temperature of the gas rises to T
1
. But, as we can see from figure
17.5, there are many different ways to get to the isotherm T
1
. The
thermodynamic paths AB, AC, AD, AE, or an infinite number of
other possible paths can be followed to arrive at T
1
. Therefore, there
can be an infinite number of specific heats for gases. Let us
Figure 17.5
The specific heat for a gas depends
on the path taken in a p-V diagram.
restrict ourselves to only two paths, and hence only two specific heats. The first path we consider is the path AB,
which represents a process taking place at constant volume. The second path is path AE, which represents a
process taking place at constant pressure. We designate the molar specific heat for a process occurring at constant
volume by C
v
, whereas we designate the molar specific heat for a process occurring at a constant pressure by C
p
. It
is found experimentally that for a monatomic ideal gas such as helium or argon, C
v
= 12.5 J/mole K, whereas C
p
=
20.8 J/mole K.
The heat absorbed by the gas as the system moves along the thermodynamic path AB in figure 17.5 is
Q
AB
= nC
v
∆T = nC
v
(T
1
– T
0
) (17.20)
The heat absorbed by the gas as the system moves along the path AE is given by
Q
AE
= nC
p
∆T = nC
p
(T
1
– T
0
) (17.21)
Although the system ends up at the same temperature T
1
whether the path AB or AE is traveled, the heat that is
absorbed along each path is different because C
p
and C
v
have different values. Thus, the heat absorbed or
liberated in a thermodynamic process depends on the path that is followed. That is, heat like work is path
dependent. Although demonstrated for a gas, this statement is true in general.
Example 17.2
The heat absorbed along two different thermodynamic paths. Compute the amount of heat absorbed by 1 mole of
He gas along path (a) AB and (b) AE, of figure 17.5, if T
1
= 400 K and T
0
= 300 K.
Solution
a. The heat absorbed along path AB, given by equation 17.20, is
Q
AB
= nC
v
∆T = nC
v
(T
1
_
T
0
)
= (1 mole)(12.5 J )(400 K
_
300 K)
mole K
= 1250 J
Pearson Custom Publishing
510

Chapter 17: Thermodynamics 17-7
b. The heat absorbed along the path AE, given by equation 17.21, is
Q
AE
= nC
p
∆T = nC
p
(T
1
_
T
0
)
= (1 mole)(20.8 J )(400 K
_
300 K)
mole K
= 2080 J
Thus, a greater quantity of heat is absorbed in the process that occurs at constant pressure. This is because at
constant pressure the volume expands and some of the heat energy is used to do work, but at constant volume no
work is accomplished.
To go to this Interactive Example click on this sentence.
17.4 The First Law of Thermodynamics
Recall from the kinetic theory of gases studied in chapter 15 that the mean kinetic energy of a molecule, found
from equation 15.45, is
KE
avg
= 1 mv
avg2
= 3 kT
2 2
Thus, a change in the absolute temperature of a gas shows up as a change in the average energy of a molecule. If
the average kinetic energy of one molecule of the gas is multiplied by N, the total number of molecules of the gas
present in the thermodynamic system (i.e., the cylinder filled with gas), then this product represents the total
internal energy of this quantity of gas. Recall that the internal energy of a body was defined in chapter 14 as the
sum of the kinetic energies and potential energies of all the molecules of the body. Because the molecules of a gas
are moving so rapidly and are widely separated on the average, only a few are near to each other at any given time
and it is unnecessary to consider any intermolecular forces, and hence potential energies of the molecules. Thus,
the total kinetic energy of all the molecules of a gas constitutes the total internal energy of the gas. We designate
this internal energy of the gas by the symbol U. The internal energy of the gas is given by
U = (total number of molecules)(mean KE of each molecule)
= NKE
avg
U = N( 3 kT) (17.22)
2
But recall from equation 15.44 that
k = R
N
A
Substituting equation 15.44 into equation 17.22 gives for the internal energy of an ideal gas
U = N 3 R _T
2 N
A
But the total number of molecules N was given by
N = nN
A
(15.24)
Thus,
U = nN
A
3 R T
2 N
A
and
U= 3nRT (17.23)
2
Pearson Custom Publishing
511
17-8 Vibratory Motion, Wave Motion and Fluids
From equation 17.23 we see that a change in temperature is thus associated with a change in the internal energy
of the gas, that is,
∆U= 3nR∆T (17.24)
2
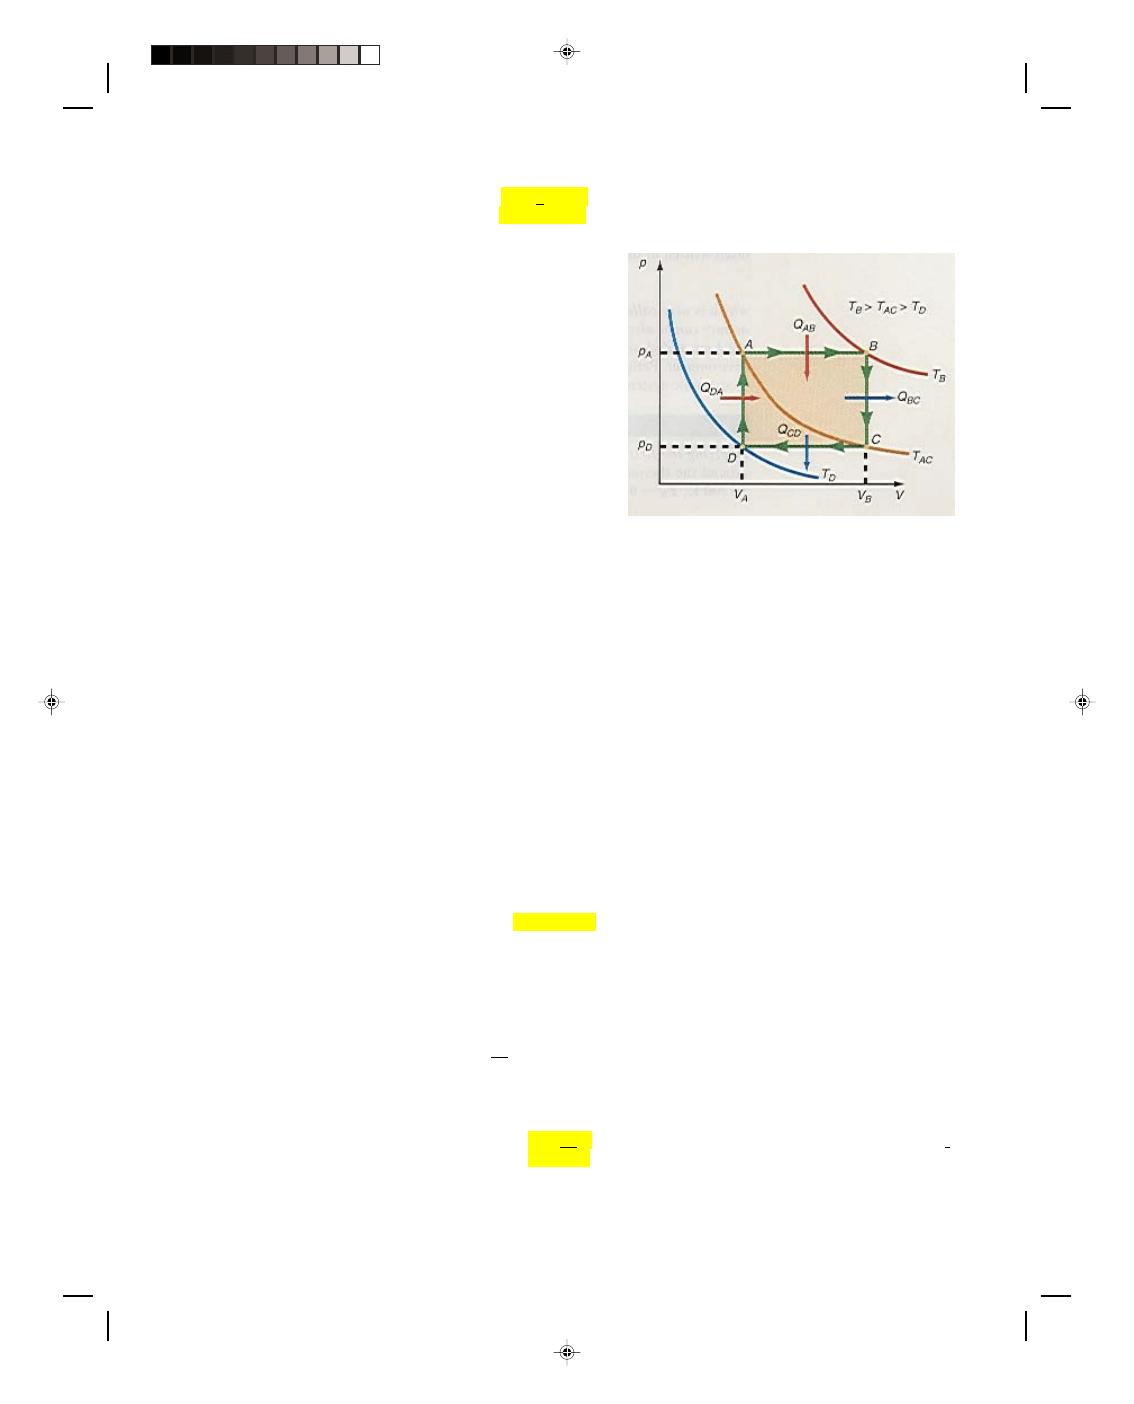
Let us now consider the thermodynamic system shown in
the p-V diagram of figure 17.6. The isotherm going through point
B is labeled T
B
, whereas the one that goes through points A and C
is labeled T
AC
, and finally, the isotherm that goes through point D
is called T
D
. Before the entire system is considered, let us first
consider a process that proceeds isothermally from A to C. Since
the path AC is an isotherm, the temperature is constant and thus
∆T = 0. But from equation 17.24, the change in internal energy ∆U
must also be zero. That is, an isothermal expansion occurs at
constant internal energy. But how can this be? As the gas expands
along AC it is doing work. If the internal energy is constant, where
does the energy come from to perform the work that is being done
by the gas? Obviously energy must somehow be supplied in order
for the gas to do work. Thus, a quantity of heat Q must be supplied
to the system in order for the system to do work along an isothermal
path. Hence, for an isothermal process,
Figure 17.6
A thermodynamic system on a
p-V diagram.
Q = W (17.25)
Let us now consider the portion of the process that is along path BC in figure 17.6. The process BC is performed at
constant volume, thus,
∆V = 0 along this path. Because the amount of work done by the gas is given as W = p∆V, if
∆V = 0, then the work done along the path BC must also be zero. But the temperature T
AC
at point C is less than
the temperature T
B
at the point B. There has been a drop in temperature between points B and C and hence a
decrease in the internal energy of the system. Since the loss of energy didn’t go into work, because
∆V = 0, heat
must have been taken away from the system along path BC. The decrease in the internal energy of the system along
an isometric path is caused by the heat removed from the system along BC, that is,
∆U = Q (17.26)
But the heat removed from the system during a constant volume process was shown in equation 17.20 to be
Q = nC
v
∆T (17.27)
Since the heat removed is equal to the loss in internal energy by equation 17.26, we can write the change in
internal energy from equations 17.26 and 17.27 as
∆U = nC
v
∆T (17.28)
Equation 17.28 is a general statement governing the change in internal energy during any process, not only the
one at constant volume from which equation 17.28 was derived. Recall from equation 17.23, a result from the
kinetic theory of gases, that U, the internal energy, is only a function of temperature. In fact if
∆U from equation
17.24 is equated to
∆U from equation 17.28, we get
3 nR
∆T = nC
v
∆T
2
Solving for C
v
, the theoretical value of the molar specific heat capacity at constant volume is found to be
C
v
= 3 R (17.29)
2
Pearson Custom Publishing
512

Chapter 17: Thermodynamics 17-9
Using the value of R = 8.314 J/(mole K) found in chapter 15, the value of C
v
, calculated from equation 17.29, is C
v
= 12.5 J/(mole K), which agrees with the experimental value.
The two special cases given by equations 17.25 and 17.26 can be combined into one general equation that
contains 17.25 and 17.26 as special cases. This general equation is
Q =
∆U + W (17.30)
and is called the first law of thermodynamics. Thus, we can derive equation 17.25 from 17.30 for an isothermal
path because then the change in internal energy
∆U = 0. We can derive equation 17.26 from equation 17.30 for a
constant volume thermodynamic path, because then
∆V = 0, and hence W = 0. The first law of thermodynamics,
equation 17.30, says that the heat Q, added to a system will show up either as a change in internal energy
∆U of the
system and/or as work W performed by the system. From this analysis we can see that the first law of
thermodynamics is just the law of conservation of energy. Equation 17.30 is quite often written in the slightly
different form:
∆U = Q − W (17.31)
which is also called the first law of thermodynamics. The first law of thermodynamics can be also stated as the
change in the internal energy of the system equals the heat added to the system minus the work done by the system
on the outside environment. Perhaps the best way to see the application of the first law to a thermodynamic system
is in an example.
Example 17.3
Applying the first law of thermodynamics. Two moles of an ideal gas are carried around the thermodynamic path
ABCDA in figure 17.6. Here T
D
= 150 K, T
AC
= 300 K, T
B
= 600 K, and p
A
= 2.00 × 10
4
Pa, while p
D
= 1.00 × 10
4
Pa. The volume V
A
= 0.250 m
3
, while V
B
= 0.500 m
3
. Find the work done, the heat lost or absorbed, and the
internal energy of the system for the thermodynamic paths (a) AB, (b) BC, (c) CD, (d) DA, and (e) ABCDA.
Solution
a. The work done by the expanding gas along the path AB is
W = p
∆V
W
AB
= p
A
(V
B
− V
A
)
(
)
4
3
3
2
N
2.00 10
0.500 m 0.250 m
m
=
×
−
= 5.00 × 10
3
J
The heat absorbed by the gas along path AB is
Q = nC
p
∆T
Q
AB
= nC
p
(T
B
− T
AC
)
(
)
J
(2 moles) 20.8
600 K 300 K
mole K
=
−
= 1.25 × 10
4
J
The change in internal energy along path AB, found from the first law equation 17.31, is
∆U
AB
= Q
AB
− W
AB
= 1.25 × 10
4
J
− 5.00 × 10
3
J
= 7.50 × 10
3
J
Thus, there is a gain of internal energy along the path AB.
b. The work done along path BC is
W = p
∆V
W
BC
= p(V
B
− V
B
) = 0
Pearson Custom Publishing
513

17-10 Vibratory Motion, Wave Motion and Fluids
= 0
The heat lost along path BC is
Q
BC
= nC
v
∆T = nC
v
(T
AC
− T
B
)
(
)
J
(2 moles) 12.5
300 K 600 K
mole K
=
−
=
−7.50 × 10
3
J
The loss of internal energy in dropping from 600 K at B to 300 K at C is found from the first law as
∆U
BC
= Q
BC
− W
BC
=
−7.50 × 10
3
J
− 0
=
−7.50 × 10
3
J
c. The work done during the compression along the path CD is
W
CD
= p
∆V = p
D
(V
A
− V
B
)
(
)
4
3
3
2
N
1.00 10
0.250 m
0.500 m
m
=
×
−
=
−2.50 × 10
3
J
The heat lost along the path CD is
Q
CD
= nC
p
∆T = nC
p
(T
D
− T
AC
)
(
)
J
(2 moles) 20.8
150 K 300 K
mole K
=
−
=
−6.24 × 10
3
J
The change in internal energy along the path CD, found from the first law, is
∆U
CD
= Q
CD
− W
CD
=
− 6.24 × 10
3
J
− (−2.50 × 10
3
J)
=
−3.74 × 10
3
J
Note that the internal energy decreased, as expected, since the temperature decreased from 300 K to 150 K.
d. The work done along the path DA is
W
DA
= p
∆V = p(V
A
− V
A
) = 0
The heat added along the path DA is
Q
DA
= nC
v
∆T = nC
v
(T
AC
− T
D
)
(
)
J
(2 moles) 12.5
300 K 150 K
mole K
=
−
= 3.74 × 10
3
J
The change in internal energy along DA is
∆U
DA
= Q
DA
− W
DA
= 3.74 × 10
3
J
e. The net work done throughout the cycle ABCDA is
W
ABCDA
= W
AB
+ W
BC
+ W
CD
+ W
DA
= 5.00 × 10
3
J + 0
− 2.50 × 10
3
J + 0
= 2.50 × 10
3
J
The net heat added throughout the cycle ABCDA is
Q
ABCDA
= Q
AB
+ Q
BC
+ Q
CD
+ Q
DA
= 1.25 × 10
4
J
− 7.50 × 10
3
J
− 6.24 × 10
3
J + 3.74 × 10
3
J
= 2.50 × 10
3
J
Pearson Custom Publishing
514

Chapter 17: Thermodynamics 17-11
Note that Q
AB
and Q
DA
are positive quantities, which means that heat is being added to the system along these
two paths. Also note that Q
BC
and Q
CD
are negative quantities, which means that heat is being taken away from
the system along these two paths. In general, Q is always positive when heat is added to the system and negative
when heat is removed from the system.
To go to this Interactive Example click on this sentence.
This effect is seen in figure 17.6 by drawing lines entering the enclosed thermodynamic path when heat is
added to the system, and lines emanating from the enclosed path when heat is taken away from the system. This
is a characteristic of all engines operating in a cycle, that is, heat is always added and some heat is always
rejected. The net change in internal energy throughout the cycle ABCDA is
∆U
ABCDA
=
∆U
AB
+
∆U
BC
+
∆U
CD
+
∆U
DA
(17.32)
= 7.50 × 10
3
J
− 7.50 × 10
3
J
− 3.74 × 10
3
J + 3.74 × 10
3
J
= 0
Note that the total change in internal energy around the entire cycle is equal to zero. This is a very reasonable result
because the internal energy of a system depends only on the temperature of the system. If we go completely
around the cycle, we end up at the same starting point with the same temperature. Since
∆T = 0 around the cycle,
∆U = nC
v
∆T must also equal zero around the cycle.
Applying the first law to the entire cycle we have
∆U
ABCDA
= Q
ABCDA
− W
ABCDA
But as just seen,
∆U
ABCDA
= 0, therefore,
Q
ABCDA
= W
ABCDA
(17.33)
That is, the energy for the net work done by the system comes from the net heat applied to the system. Looking at the
calculations, we see that this is indeed the case since
Q
ABCDA
= 2.50 × 10
3
J
while
W
ABCDA
= 2.50 × 10
3
J
Another very interesting thing can be learned from this example. Look at the change in internal energy from the
point A to the point C, and note that regardless of the path chosen, the change in internal energy is the same.
Thus, from our calculations,
∆U
AC
=
∆U
AB
+
∆U
BC
= 7.50 × 10
3
J
− 7.50 × 10
3
J = 0
and
∆U
AC
=
−∆U
AD
− ∆U
DC
=
−3.74 × 10
3
J + 3.74 × 10
3
J = 0
Along the isothermal path AC
∆U
AC
= 0
because if T is constant, U is constant. Thus, regardless of the path chosen between two points on a p-V diagram,
∆U is always the same. (It will not always be zero, as in this case where the points A and C happen to lie along the
same isotherm, but whatever its numerical value,
∆U is always the same.)
What is especially interesting about this fact is that the work done depends on the path taken, the heat
absorbed or liberated depends on the path taken, but their difference Q
−
W, which is equal to
∆U is independent of
the path taken. That is,
∆U depends only on the initial and final states of the thermodynamic system and not the
path between the initial and final states.
Thus, the internal energy is to a thermodynamic system what the potential energy is to a mechanical
system. (Recall from chapter 7, section 7.7 that the work done, and hence the potential energy, was the same
Pearson Custom Publishing
515

17-12 Vibratory Motion, Wave Motion and Fluids
whether an object was lifted to a height h, or moved up a frictionless inclined plane to the same height h. That is,
the potential energy was independent of the path taken.)
The thermodynamic system considered in figure 17.6 represents an engine of some kind. That is, heat is
added to the engine and the engine does work. To compare one engine with another it is desirable to know how
efficient each engine is. The efficiency of an engine can be defined in terms of what we get out of the system
compared to what we put into the system. Heat, Q
in
, is put into the engine, and work, W, is performed by the
engine, hence the efficiency of an engine can be defined as
Eff = Work out = W (17.34)
Heat in Q
in
Example 17.4
The efficiency of an engine. In example 17.3, 2.50 × 10
3
J of work was done by the system, whereas the heat added
to the system was the heat added along paths AB and DA, which is equal to 1.25 × 10
4
J + 3.74 × 10
3
J, which is
equal to 1.62 × 10
4
J. Find the efficiency of that engine.
Solution
The efficiency of the engine, found from equation 17.34, is
3
4
in
2.50 10 J
Eff
0.15
1.62 10 J
W
Q
×
=
=
=
×
= 15%
Thus, the efficiency of the engine represented by the thermodynamic cycle of figure 17.6 is only 15%. This is not a
very efficient engine. We will discuss the maximum possible efficiency of an engine when we study the Carnot
cycle in section 17.8.
To go to this Interactive Example click on this sentence.
Before leaving this section, however, let us take one more look at the change in the internal energy of the
system along the path ABC. We have already seen that since the initial and final states lie on the same isotherm,
the change in internal energy is zero. There is still, however, some more important physics to be obtained by
further considerations of this path. The change in internal energy along the path ABC is given by
∆U
ABC
=
∆U
AB
+
∆U
BC
But from the first law we can write this as
∆U
ABC
= Q
AB
− W
AB
+ Q
BC
− W
BC
(17.35)
But as we have already seen
Q
AB
= nC
p
(T
B
− T
AC
)
W
AB
= p
A
(V
B
− V
A
) (17.36)
Q
BC
= nC
v
(T
AC
− T
B
)
W
BC
= p(V
B
− V
B
) = 0
Substituting all these terms into equation 17.35, gives
∆U
ABC
= nC
p
(T
B
− T
AC
)
− p
A
(V
B
− V
A
) + nC
v
(T
AC
− T
B
) (17.37)
∆U
ABC
= nC
p
(T
B
− T
AC
)
− nC
v
(T
B
− T
AC
)
− p
A
V
B
+ p
A
V
A
But from the ideal gas equation,
p
A
V
A
= nRT
AC
(17.38)
and
p
A
V
B
= p
B
V
B
= nRT
B
(17.39)
Pearson Custom Publishing
516

Chapter 17: Thermodynamics 17-13
Substituting equations 17.38 and 17.39 back into equation 17.37, we get
∆U
ABC
= nC
p
(T
B
− T
AC
)
− nC
v
(T
B
− T
AC
)
− nRT
B
+ nRT
AC
= nC
p
(T
B
− T
AC
)
− nC
v
(T
B
− T
AC
)
− nR(T
B
− T
AC
)
∆U
ABC
= (C
p
− C
v
− R)n(T
B
− T
AC
) (17.40)
However, we have already determined that
∆U
ABC
is equal to zero. Hence, equation 17.40 implies that
C
p
− C
v
− R = 0
or
C
p
– C
v
= R (17.41)
Thus we have determined a theoretical relation between the molar specific heat capacities and the universal gas
constant R. Since it has already been shown that C
v
= 3/2 R in equation 17.29, C
p
can now be solved for in
equation 17.41 to obtain
C
p
= C
v
+ R
= 3 R + R
2
C
p
= 5R (17.42)
2
Using the value of R = 8.314 J/mole K found in chapter 15, the value of C
p
is 20.8 J/mole K, which agrees with the
experimental value of C
p
for a monatomic gas.
17.5 Some Special Cases of the First Law of Thermodynamics
Although we have already discussed the first law of thermodynamics pretty thoroughly, let us summarize some of
the results into special cases.
An Isothermal Process
An isothermal process is a process that occurs at constant temperature. Thus,
∆T = 0. But ∆U = nC
v
∆T. Therefore,
if
∆T = 0, then ∆U = 0. The first law then becomes
∆U = 0 = Q − W
Q = W (17.43)
In an isothermal process, heat added to the system shows up as mechanical work done by the system.
An Adiabatic Process
An adiabatic process is a process that occurs without an exchange of heat between the system and its
environment. That is, heat is neither added to nor taken away from the system during the process. Thus, Q = 0 in
an adiabatic process. The first law of thermodynamics for an adiabatic process becomes
∆U = Q − W
W
U
= −∆
(17.44)
Thus, in an adiabatic process, the energy for the work done by the gas comes from a loss in the internal energy of the
gas.
An example of an adiabatic process is the process of cloud formation in the atmosphere, which we will
discuss in the section “Have you ever wondered’’ at the end of this chapter.
Some processes that are not strictly speaking adiabatic can be treated as adiabatic processes because the
process occurs so rapidly that there is not enough time for the system to exchange any significant quantities of
heat with its environment.
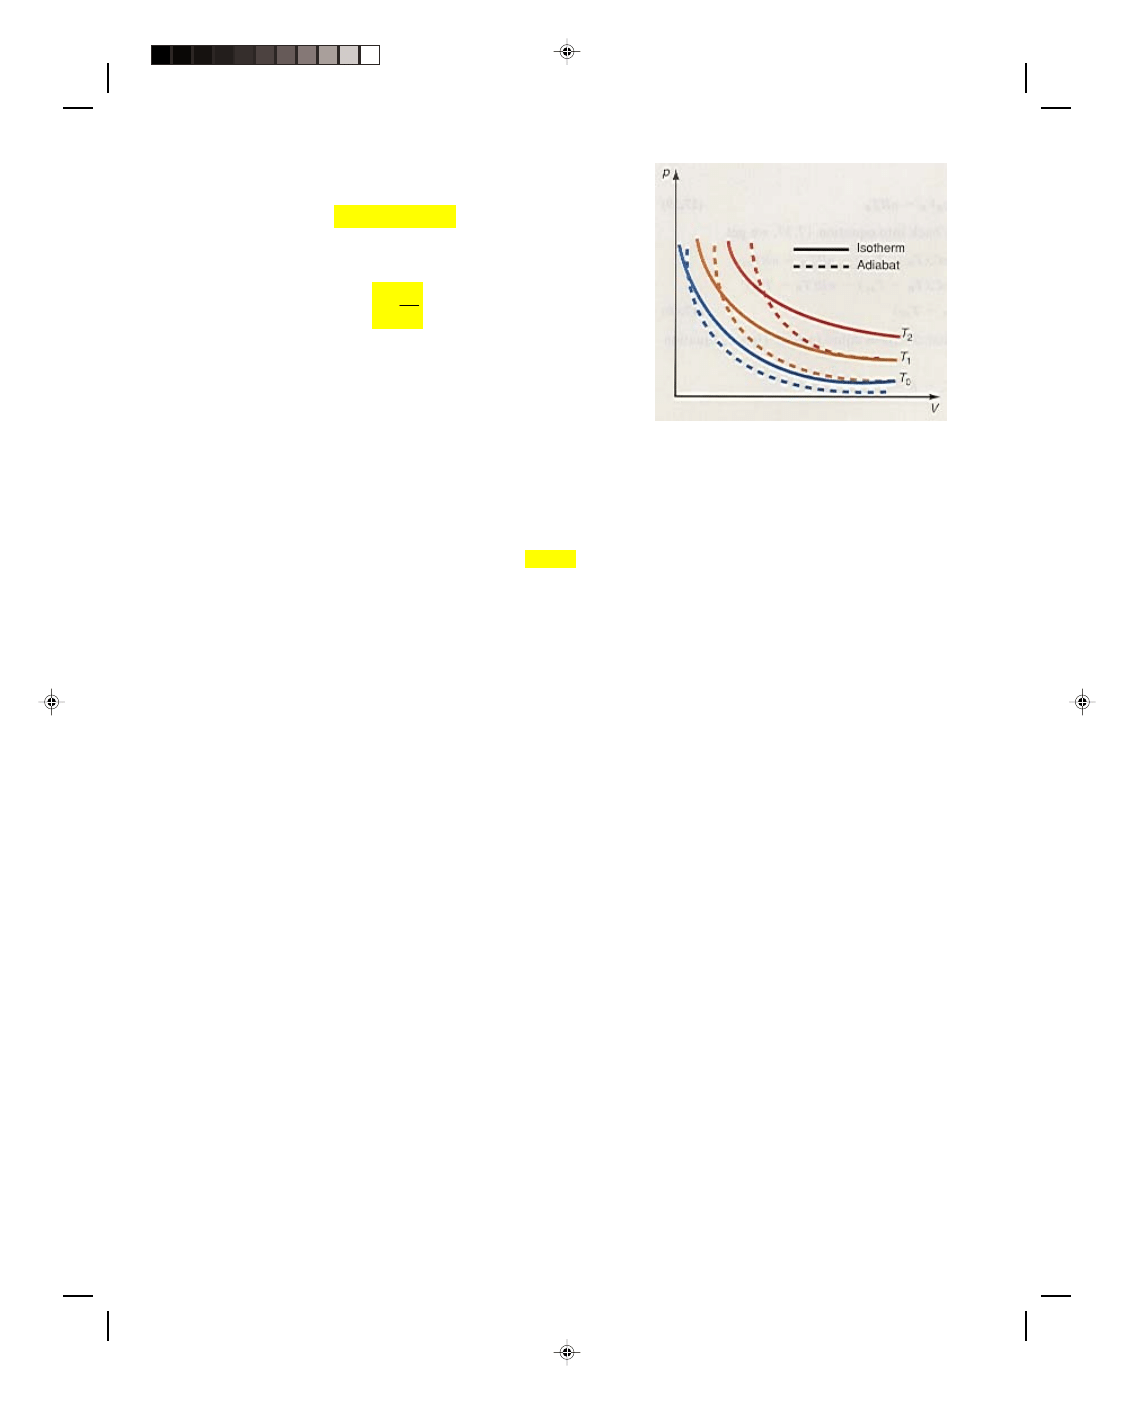
An adiabatic process can be drawn as the dashed line on the p-V diagram in figure 17.7. Note that the
adiabatic line has a steeper slope than the isotherm.
Pearson Custom Publishing
517
17-14 Vibratory Motion, Wave Motion and Fluids
Although the equation for the adiabat cannot be derived
without the use of the calculus, we will state the result here for
completeness:
constant
γ
pV
=
(17.45)
where
γ is equal to the ratio of the molar specific heats. Thus,
p
v
C
C
γ =
(17.46)
The adiabatic process is essential to the study of the Carnot cycle in
section 17.8.
Figure 17.7
Adiabats and isotherms on a
p-V diagram.
Isochoric Process or Isometric Process
An isochoric process is a process that occurs at constant volume, that is,
∆V = 0. Since the work done, W, is equal
to p
∆V = 0, then W must also be zero. The first law of thermodynamics for an isochoric process therefore becomes
Q =
∆U (17.47)
Thus, the heat added to a system during an isochoric process shows up as an increase in the internal energy of the
system.
An Isobaric Process
An isobaric process is a process that occurs at constant pressure, that is,
∆p = 0. Since the pressure is a constant
for an isobaric process, the work done in an isobaric process is given by the product of the constant pressure p and
the change in volume
∆V. That is,
W = p
∆V
If the process is not an isobaric one then the pressure p has to be an average value of the pressure along the
thermodynamic path to give the average amount of work done on that path.
A Cyclic Process
A cyclic process is one that always returns to its initial state. The process studied as ABCDA in figure 17.6 is an
example of a cyclic process. Because the system always returns to the original state,
∆U is always equal to zero for a
cyclic process. That is,
∆U = 0
Hence, the first law of thermodynamics for a cyclic process becomes
W = Q (17.48)
Thus, the work done by the system in the cyclic process is equal to the heat added to the system on a portion of the
cycle minus the heat removed on the remainder of the cycle.
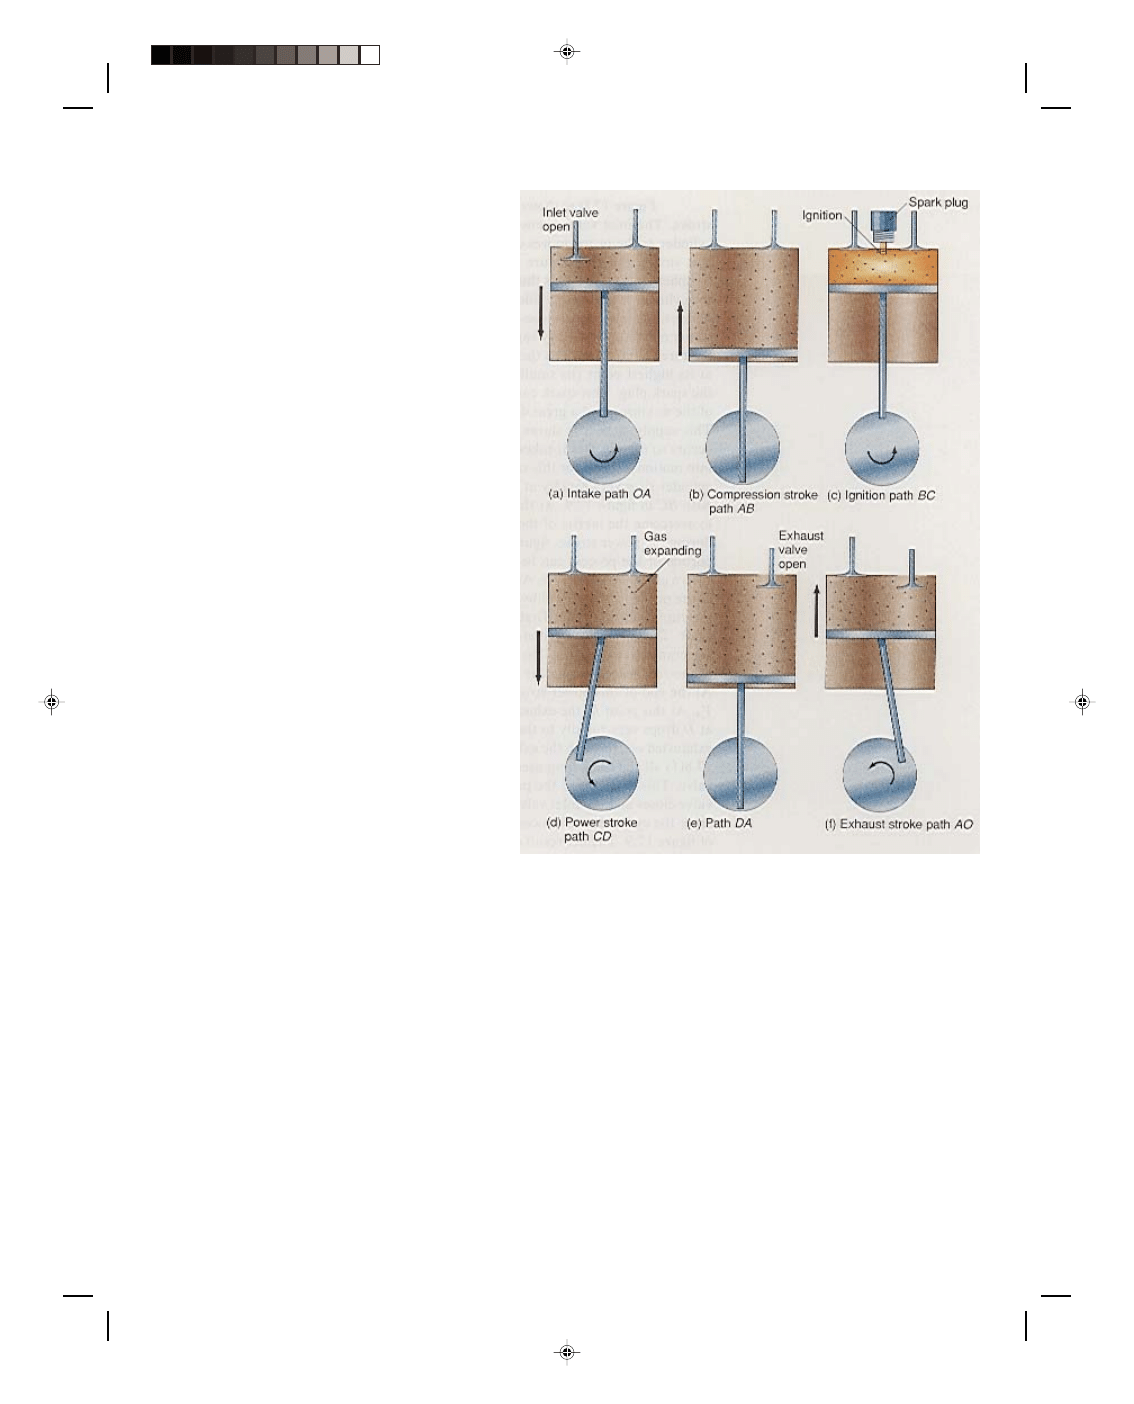
17.6 The Gasoline Engine
The thermodynamic system studied so far is somewhat idealistic. In order to be more specific, let us consider the
thermodynamic process that occurs in the gasoline engine of an automobile. The engine usually consists of four,
six, or eight cylinders. Each cylinder has an inlet valve, an exhaust valve, a spark plug, and a movable piston,
which is connected to the crankshaft by a piston rod. The operation of one of these cylinders is shown
schematically in figure 17.8. The gasoline engine is approximated by an Otto cycle and is shown on the p-V
diagram of figure 17.9.
Pearson Custom Publishing
518
Chapter 17: Thermodynamics 17-15
Figure 17.8(a) shows the first stroke
of the engine, which is called the intake
stroke. The inlet valve opens and a mixture
of air and gasoline is drawn into the cylinder
as the piston moves downward. Because the
inlet valve is open during this first stroke,
the air pressure inside the cylinder is the
same constant value as atmospheric pressure
and is thus shown as the isobaric path OA in
figure 17.9. When the cylinder is completely
filled to the volume V
A
with the air and
gasoline mixture, point A, the inlet valve,
closes and the compression stroke starts,
figure 17.8(b). The piston moves upward very
rapidly causing an adiabatic compression of
the air-gas mixture. This is shown as the
adiabatic path AB in figure 17.9. When the
piston is at its highest point (its smallest
volume V
B
), a spark is applied to the mixture
by the spark plug. This spark causes ignition
of the air-gas mixture (a small explosion of
the mixture), and a great deal of heat is
supplied to the mixture by the explosion.
This supply of heat is shown as Q
H
on the
path BC of figure 17.9. The explosion occurs
so rapidly that it takes a while to overcome
the inertia of the piston to get it into motion.
Hence, for this small time period, the
pressure and temperature in the cylinder
rises very rapidly at approximately constant
volume. This is shown as the path BC in
figure 17.9. At the point C the force of the
air-gas mixture is now able to overcome the
inertia of the piston, and the piston moves
downward very rapidly during the power
stroke, figure 17.8(d). Because the piston
moves very rapidly, this portion of the
process can be approximated by the adiabatic
Figure 17.8
The gasoline engine cycle.
expansion of the gas shown as CD in figure 17.9. As the piston moves down rapidly this downward motion of the
piston is transferred by the piston rod to the crankshaft of the engine causing the crankshaft to rotate. That is, the
piston rod is connected off-center to the crankshaft. Thus, when the piston rod moves downward it creates a torque
that causes the crankshaft to rotate. The rotating crankshaft is connected by a series of gears to the rear wheels of
the car thus causing the wheels to turn and the car to move. At the end of this power stroke the piston has moved
down to the greatest volume V
A
. At this point D, the exhaust valve of the cylinder opens and the higher pressure
at D drops very rapidly to the outside pressure at A, and a good deal of heat Q
C
is exhausted out through the
exhaust valve. As the piston now moves upward in figure 17.8(f) all the remaining used gas-air mixture is dumped
out through the exhaust valve. This is shown as the path AO in figure 17.9. At the position O, the exhaust valve
closes and the inlet valve opens allowing a new mixture of air and gasoline to enter the cylinder. The process now
starts over again as the same cycle OABCDAO of figure 17.9. The net result of the entire cycle is that heat Q
H
is
added along path BC, work is done equal to the area enclosed by the cyclic path, and heat Q
C
is exhausted out of
the system. Thus, heat has been added to the system and the system performed useful work. Four, six, or eight of
these cylinders are ganged together with the power stroke of each cylinder occurring at a different time for each
cylinder. This has the effect of smoothing out the torque on the crankshaft, causing a more constant rotation of the
Pearson Custom Publishing
519

17-16 Vibratory Motion, Wave Motion and Fluids
crankshaft. Unfortunately practical limitations, such as compression ratio, friction, cooling, and so on, cause the
efficiency of the gasoline engine, which uses the Otto cycle, to be limited to about 20% to 25%.
Figure 17.9
The Otto cycle.
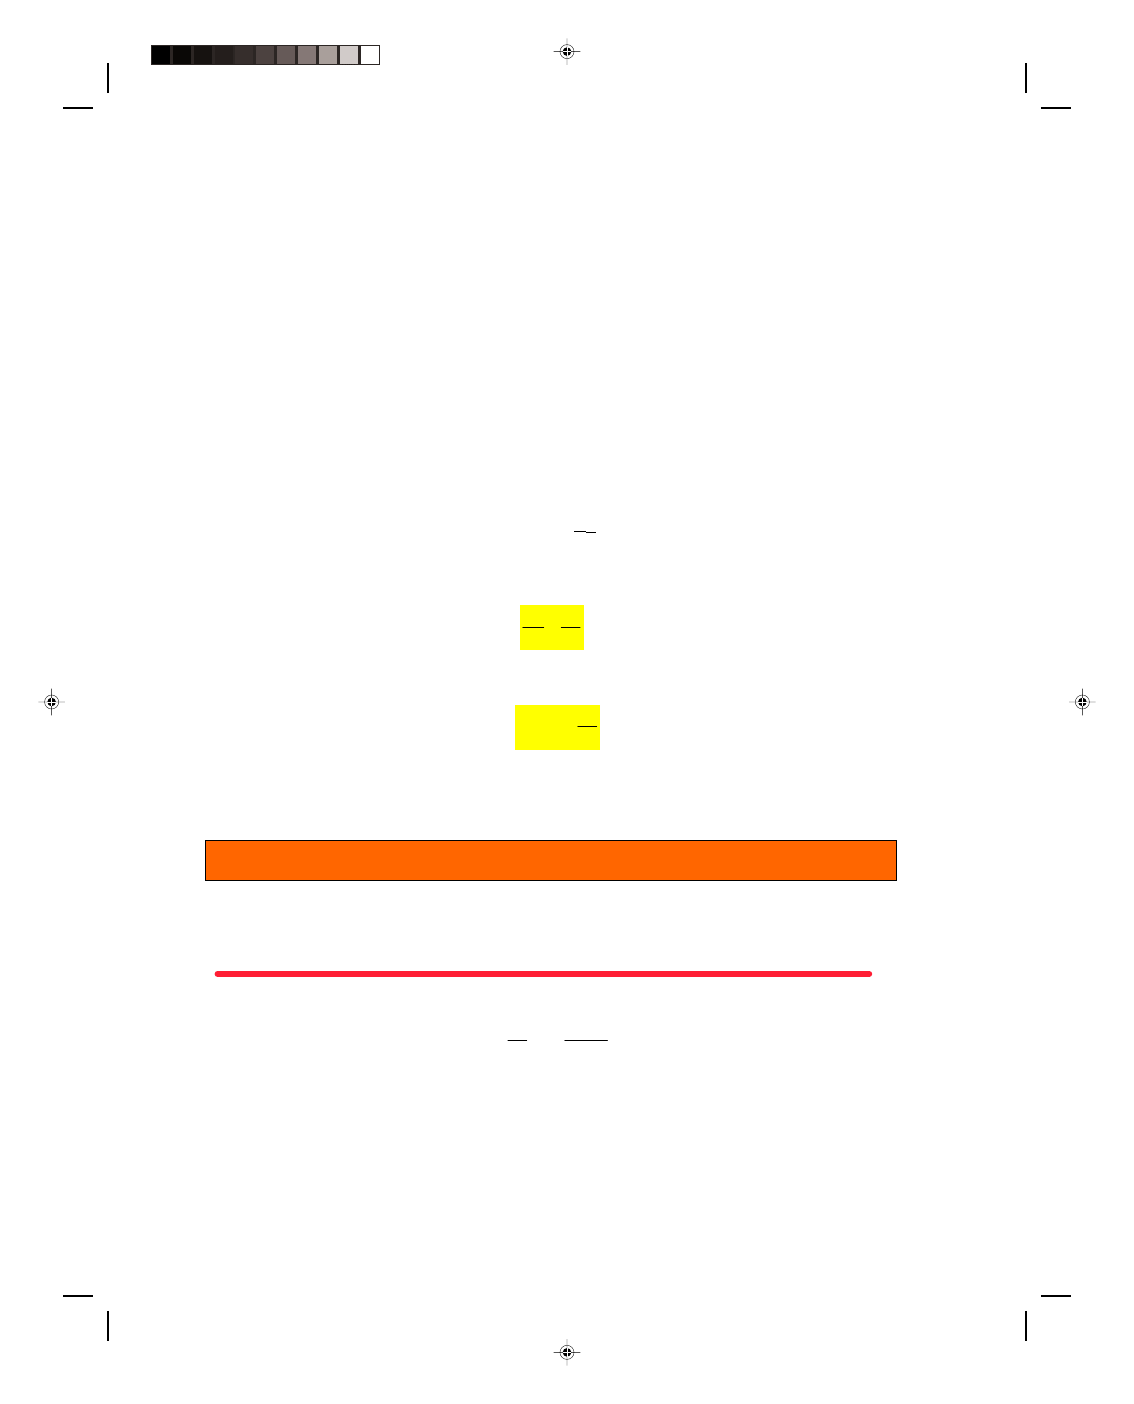
17.7 The Ideal Heat Engine
There are many heat engines in addition to the gasoline engine, but
they all have one thing in common: every engine absorbs heat from a
source at high temperature, performs some amount of mechanical work,
and then rejects some heat at a lower temperature. This process can be
visualized with the schematic diagram for an ideal heat engine, and
is shown in figure 17.10. The engine is represented by the circle in the
diagram. The engine absorbs the quantity of heat Q
H
from a hot-
temperature reservoir, at a temperature T
H
. (In the gasoline engine,
the quantity of heat Q
H
was supplied by the combustion of the air-
gasoline mixture.) Some of this absorbed heat energy is converted to
work, which is shown as the pipe coming out of the engine at the right.
This corresponds to the work done during the power stroke of the
gasoline engine. The rest of the original absorbed heat energy is
dumped as exhaust heat Q
C
into the low-temperature reservoir. (In the
gasoline engine this is the hot exhaust gas that is rejected to the cooler
environment outside the engine.)
Figure 17.10
An idealized heat engine.
Because the engine operates in a cycle,
∆U = 0, and as we have already seen, the net work done is equal to
the net heat absorbed by the engine, that is,
W = Q
But the net heat absorbed is equal to the difference between the total heat absorbed Q
H
at the hot reservoir, and
the heat rejected Q
C
at the cold reservoir, that is,
Q = Q
H
− Q
C
Thus, the work done by the engine is equal to the difference between the heat absorbed from the hot reservoir and
the heat rejected to the cold reservoir
H
C
W
Q
Q
=
−
(17.49)
The efficiency of a heat engine can also be defined from equation 17.34 as
Pearson Custom Publishing
520
Chapter 17: Thermodynamics 17-17
H
C
in
H
H
Eff
Q
Q
W
W
Q
Q
Q
−
=
=
=
(17.50)
C
H
Eff 1
Q
Q
= −
(17.51)
Thus, to make any heat engine as efficient as possible it is desirable to make Q
H
as large as possible and Q
C
as
small as possible. It would be most desirable to have Q
C
= 0, then the engine would be 100% efficient. Note that
this would not be a violation of the first law of thermodynamics. However, as we will see in section 17.8, such a
process is not possible.
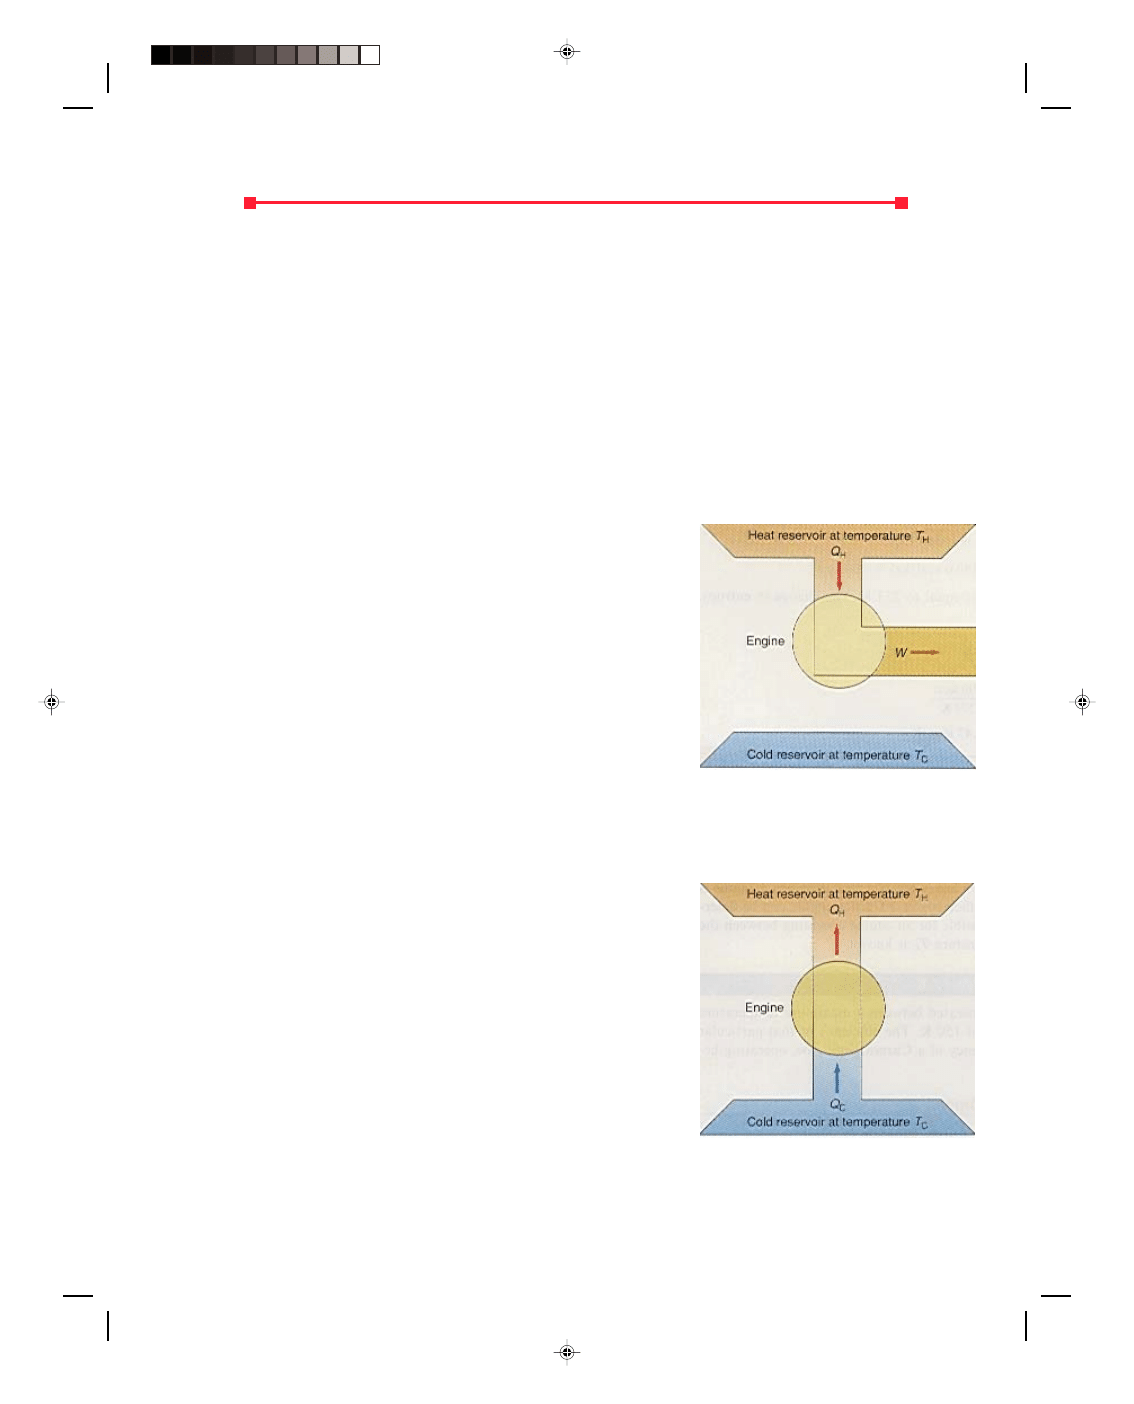
Before leaving this section we should note that a
refrigerator, or a heat pump, is a heat engine working in reverse. A
refrigerator is represented schematically in figure 17.11, where the
refrigerator is represented as the circle in the diagram. Work W is
done on the refrigerator, thereby extracting a quantity of heat Q
C
from the low-temperature reservoir and exhausting the large quantity
of heat Q
H
to the hot reservoir. The total heat energy exhausted to the
high-temperature reservoir Q
H
is the sum of the work done on the
engine plus the heat Q
C
extracted from the low-temperature
reservoir. Thus,
Q
H
= W + Q
C
We define the equivalent of an efficiency for a refrigerator, the
coefficient of performance, as
Figure 17.11
An ideal refrigerator.
Coefficient of performance = Heat removed (17.52)
Work done
Coefficient of performance = Q
C
W
C
H
C
Coefficient of performance
Q
Q
Q
=
−
(17.53)
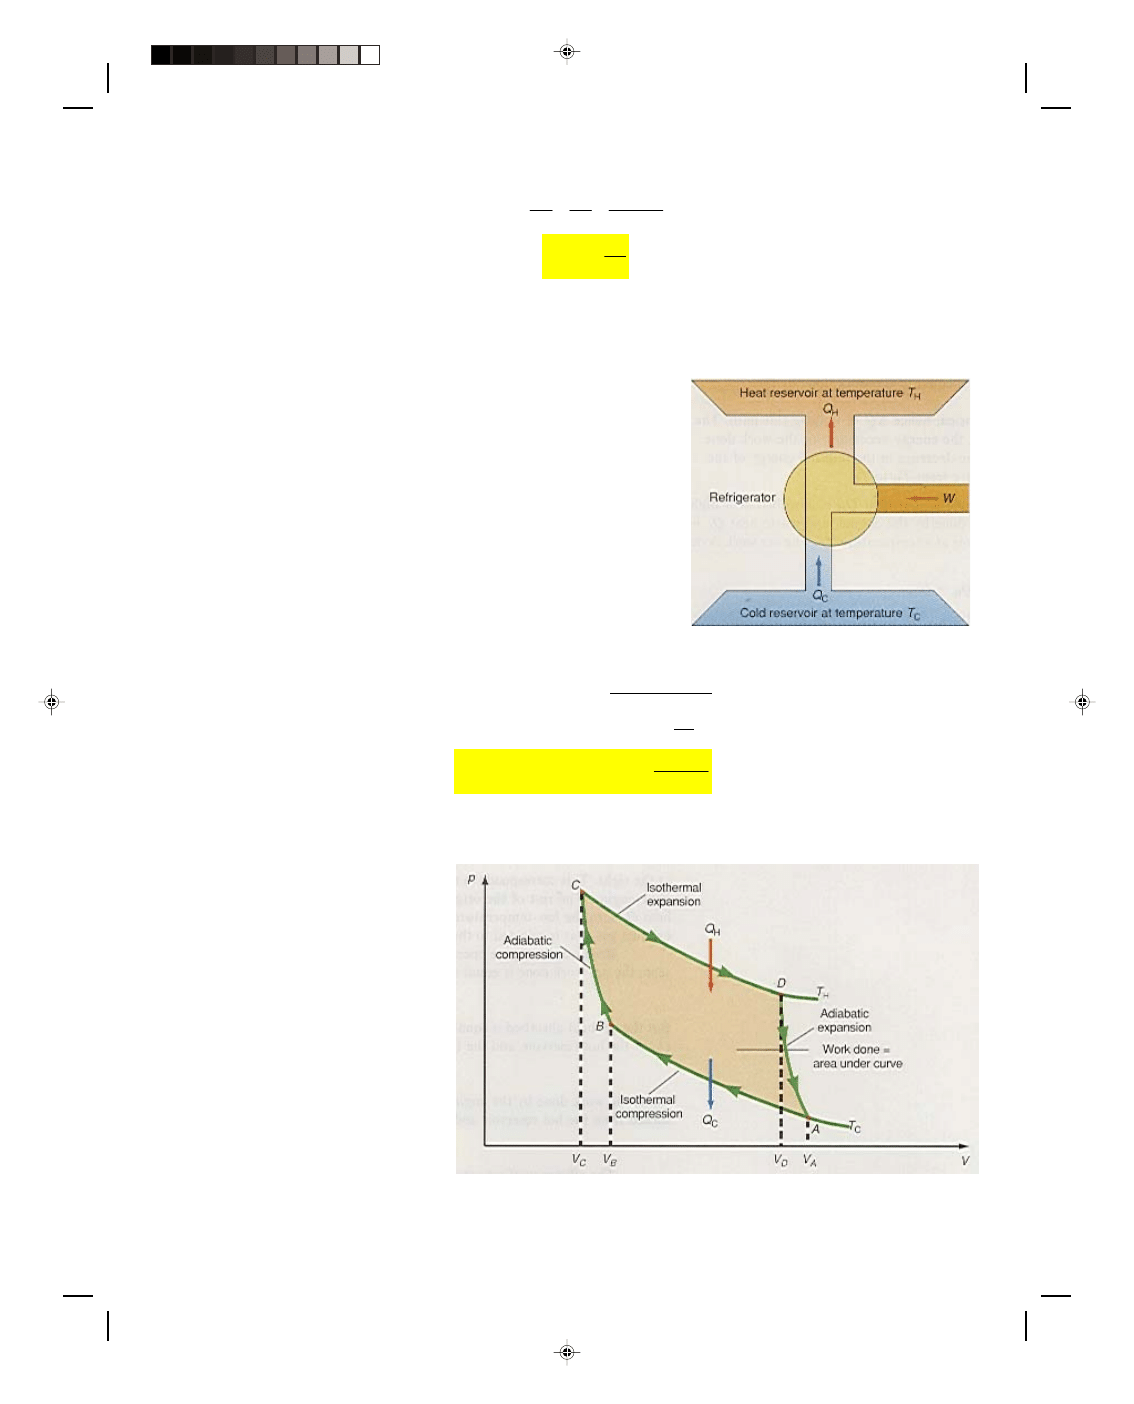
17.8 The Carnot Cycle
As we saw in section 17.7, it is
desirable to get the maximum
possible efficiency from a heat
engine. Sadi Carnot (1796-1832)
showed that the maximum
efficiency of any heat engine must
follow a cycle consisting of the
isothermal and adiabatic paths
shown in the p-V diagram in figure
17.12, and now called the Carnot
cycle. The cycle begins at point A.
Let us now consider each path
individually.
Figure 17.12
A p-V diagram for a Carnot cycle.
Pearson Custom Publishing
521
17-18 Vibratory Motion, Wave Motion and Fluids
Path AB: An ideal gas is first compressed isothermally along the path AB. Since AB is an isotherm,
∆T = 0 and
hence
∆U = 0. The first law therefore says that Q = W along path AB. That is, the work W
AB
done on the gas is
equal to the heat removed from the gas Q
C
, at the low temperature, T
C
.
Path BC: Path BC is an adiabatic compression and hence Q = 0 along this path. The first law therefore becomes
∆U = W. That is, the work W
BC
done on the gas during the compression is equal to the increase in the internal
energy of the gas as the temperature increases from T
C
to T
H
.
Path CD: Path CD is an isothermal expansion. Hence,
∆T = 0 and ∆U = 0. Therefore, the first law becomes W = Q.
That is, the heat added to the gas Q
H
at the high temperature T
H
is equal to the work W
CD
done by the
expanding gas.
Path DA: Path DA is an adiabatic expansion, hence Q = 0 along this path. The first law becomes
∆U = W. Thus,
the energy necessary for the work W
DA
done by the expanding gas comes from the decrease in the internal
energy of the gas. The gas decreases in temperature from T
H
to T
C
.
The net effect of the Carnot cycle is that heat Q
H
is absorbed at a high temperature T
H
, mechanical work W
is done by the engine, and waste heat Q
C
is exhausted to the low-temperature reservoir at a temperature T
C
. The
net work done by the Carnot engine is
W = Q
H
− Q
C
The efficiency is given by the same equations 17.50 and 17.51 as we derived before. That is,
Eff = 1
− Q
C
(17.51)
Q
H
Lord Kelvin proposed that the ratio of the heat rejected to the heat absorbed could serve as a temperature scale.
Kelvin then showed that for a Carnot engine
C
C
H
H
Q
T
Q
T
=
(17.54)
where T
C
and T
H
are the Kelvin or absolute temperatures of the gas. With the aid of equation 17.54, we can
express the efficiency of a Carnot engine as
C
H
Eff 1
T
T
= −
(17.55)
The importance of equation 17.55 lies in the fact that the Carnot engine is the most efficient of all engines. If the
efficiency of a Carnot engine can be determined, then the maximum efficiency possible for an engine operating
between the high temperature T
H
and the low temperature T
C
is known.
Example 17.5
In examples 17.3 and 17.4 the engine operated between a maximum temperature of 600 K and a minimum
temperature of 150 K. The efficiency of that particular engine was 15%. What would the efficiency of a Carnot
engine be, operating between these same temperatures?
Solution
The efficiency of the Carnot engine, found from equation 17.55, is
C
H
150 K
Eff 1
1
0.75
600 K
T
T
= −
= −
=
Therefore, the maximum efficiency for any engine operating between these temperatures cannot be higher than
75%. Obviously the efficiency of 15% for the previous cycle is not very efficient.
To go to this Interactive Example click on this sentence.
Pearson Custom Publishing
522
Chapter 17: Thermodynamics 17-19
17.9 The Second Law of Thermodynamics
There are several processes that occur regularly in nature, but their reverse processes never occur. For example,
we can convert the kinetic energy of a moving car to heat in the brakes of the car as the car is braked to a stop.
However, we cannot heat up the brakes of a stopped car and expect the car to start moving. That is, we cannot
convert the heat in the brakes to kinetic energy of the car. Thus, mechanical energy can be converted into heat
energy but heat energy cannot be completely converted into mechanical energy. As another example, a hot cup of
coffee left to itself always cools down to room temperature, never the other way around. There is thus a kind of
natural direction followed by nature. That is, processes will proceed naturally in one direction, but not in the
opposite direction. Yet in any of these types of processes there is no violation of the first law of thermodynamics
regardless of which direction the process occurs. This unidirectionality of nature is expressed as the second law
of thermodynamics and tells which processes will occur in nature. The second law will first be described in
terms of the ideal heat engine and refrigerator studied in section 17.7.
The Kelvin-Planck Statement of the Second Law
No process is possible whose sole result is the absorption of heat from a
reservoir at a single temperature and the conversion of this heat
energy completely into mechanical work. This statement is shown
schematically in figure 17.13. That is, the diagram in figure 17.13
cannot occur in nature. Observe from figure 17.13 that heat Q
H
is
absorbed from the hot reservoir and converted completely into work. In
figure 17.10 we saw that there had to be an amount of heat Q
C
exhausted into the cold reservoir. Thus the Kelvin-Planck statement
of the second law of thermodynamics says that there must always
be a quantity of heat Q
C
exhausted from the engine into a lower
temperature reservoir.
Figure 17.13
Kelvin-Planck violation of the
second law.
The Clausius Statement of the Second Law of Thermodynamics
No process is possible whose sole result is the transfer of heat from a
cooler to a hotter body. The Clausius statement of the second law
of thermodynamics can best be described by the refrigerator of figure
17.11. Work was done on the refrigerator to draw heat Q
C
out of the
cold reservoir to then deliver it to the hot reservoir. The Clausius
statement says that work must always be done to do this. The violation
of this Clausius statement of the second law is shown in figure 17.14.
This statement of the second law of thermodynamics is essentially an
observation of nature. Thermal energy flows from hot reservoirs (hot
bodies) to cold reservoirs (cold bodies). The reverse process where heat
flows from a cold body to a hot body without the application of some
kind of work does not occur in nature. Thus, the second law of
thermodynamics says that such processes are impossible, and the
diagram in figure 17.14 cannot occur in nature.
Figure 17.14
Clausius violation of the
second law.
Pearson Custom Publishing
523

17-20 Vibratory Motion, Wave Motion and Fluids
17.10 Entropy
The second law of thermodynamics has been described in terms of statements about which processes are possible
and which are not possible. It would certainly be more desirable to put the second law on a more quantitative
basis. In 1865, Clausius introduced the concept of entropy to indicate what processes are possible and what ones
are not. When a thermodynamic system changes from one equilibrium state to another in a series of small
increments such that the system always moves through a series of equilibrium states, the system is said to go
through a reversible process. A reversible process can be drawn as a continuous line on a p-V diagram. All the
processes that have been considered are reversible processes. When a thermodynamic system changes from one
equilibrium state to another along a reversible path, there is a change in entropy,
∆S of the system given by
Q
S
T
∆
∆ =
(17.56)
where
∆Q is the heat added to the system, and T is the absolute temperature of the system.
Example 17.6
Find the change in entropy when 5.00 kg of ice at 0.00
0
C are converted into water at 0.00
0
C.
Solution
The heat absorbed by the ice in melting is found from
∆Q = mL
f
= (5.00 kg)(3.34 × 10
5
J/kg) = 1.67× 10
6
J
The process takes place at 0
0
C which is equal to 273 K. The change in entropy, found from equation 17.56, is
∆S = ∆Q
T
= 1.67× 10
6
J
273 K
= 6.12 × 10
3
J/K
To go to this Interactive Example click on this sentence.
Whenever heat is added to a system,
∆Q is positive, and hence, ∆S is also positive. If heat is removed from
a system,
∆Q is negative, and therefore, ∆S is also negative. When the ice melts there is a positive increase in
entropy.
Entropy is a very different concept than the concept of energy. For example, in a gravitational system, a
body always falls from a region of high potential energy to low potential energy, thereby losing potential energy. In
contrast, in an isolated thermodynamic system, the system always changes from values of low entropy to values of
high entropy, thereby increasing the entropy of the system. Therefore, the concept of entropy can tell us in which
direction a process will proceed. For example, if an isolated thermodynamic system is in a state A, and we wish to
determine if it can naturally go to state B by itself, we first measure the initial value of the entropy at A, S
i
, and
the final value of the entropy at B, S
f
. The system will move from A to B only if there is an increase in the entropy
in moving from A to B. That is, the process is possible if
f
i
0
S S
S
∆ =
−
< (17.57)
If
∆S is negative for the proposed process, the system will not proceed to the point B. The second law of
thermodynamics can also be stated as: the entropy of an isolated system increases in every natural process, and only
those processes are possible for which the entropy of the system increases or remains a constant. The entropy of a
Pearson Custom Publishing
524

Chapter 17: Thermodynamics 17-21
nonisolated system may either increase, or decrease, depending on whether heat is added to or taken away from
the system. If
∆Q is equal to zero, such as in an adiabatic process, then ∆S also equals zero. Hence, an adiabatic
process is also an isoentropic process. Just as the change in internal energy of a system from state A to state B is
independent of the path taken to get from A to B, the entropy of a system is also independent of the path taken.
Note from the form of equation 17.56 that the temperature T must be a constant. If the temperature is not
a constant, as is the case in most processes, the calculus must be used to evaluate the entropy of the system. In
some cases an average temperature of the system can be used in equation 17.56 to evaluate the entropy.
Example 17.7
Find the change in entropy when 5.00 kg of ice at
−5.00
0
C is warmed to 0.00
0
C.
Solution
The heat added to the ice is found from
∆Q = mc∆T = mc(T
f
− T
i
)
(
)
0
0
0
J
(5.00 kg) 2093
0 C ( 5.00 C
kg C
=
− −
= 5.23 × 10
4
J
We can use equation 17.56 to evaluate the change in entropy of the ice if an average temperature of
−2.50
0
C =
270.5 K is used. Thus,
∆S = ∆Q (17.56)
T
= 5.23 × 10
4
J
270.5 K
= 193 J/K
To go to this Interactive Example click on this sentence.
Example 17.8
Find the change in entropy when 5.00 kg of ice at
−5.00
0
C are converted to water at 0.00
0
C.
Solution
We can find the change in entropy by dividing the problem into two parts. First, we find the change in entropy in
warming the ice to 0.00
0
C and then we find the change in entropy in melting the ice. We have already found the
change in entropy for these two processes in examples 17.6 and 17.7. The total change in entropy is the sum of the
change in entropy for the two processes. Therefore,
∆S = ∆S
1
+
∆S
2
= 193 J/K + 6.12 × 10
3
J/K
= 6.31 × 10
3
J/K
To go to this Interactive Example click on this sentence.
Pearson Custom Publishing
525
17-22 Vibratory Motion, Wave Motion and Fluids
17.11 Statistical Interpretation of Entropy
As we have seen in sections 17.9 and 17.10, the second law of thermodynamics is described in terms of statements
about which processes in nature are possible and which are not possible. Clausius introduced the concept of
entropy to put the second law on a more quantitative basis. He stated the second law as: the entropy of an isolated
system increases in every natural process, and only those processes are possible for which the entropy of the system
increases or remains a constant. But this analysis was done on a macroscopic level, that is, a large-scale level,
where concepts of temperature, pressure, and volume were employed. But the gas, the usual working substance
discussed, is made up of billions of molecules, as shown in the kinetic theory of gases. Ludwig Boltzmann’s
approach to the second law of thermodynamics is a further extension of the kinetic theory, and is called statistical
mechanics. Boltzmann looked at the molecules of the gas and asked what the most probable distribution of these
molecules is. There is a certain order to the distribution of the molecules, with some states more probable than
others. Thus, statistical mechanics deals with probabilities.
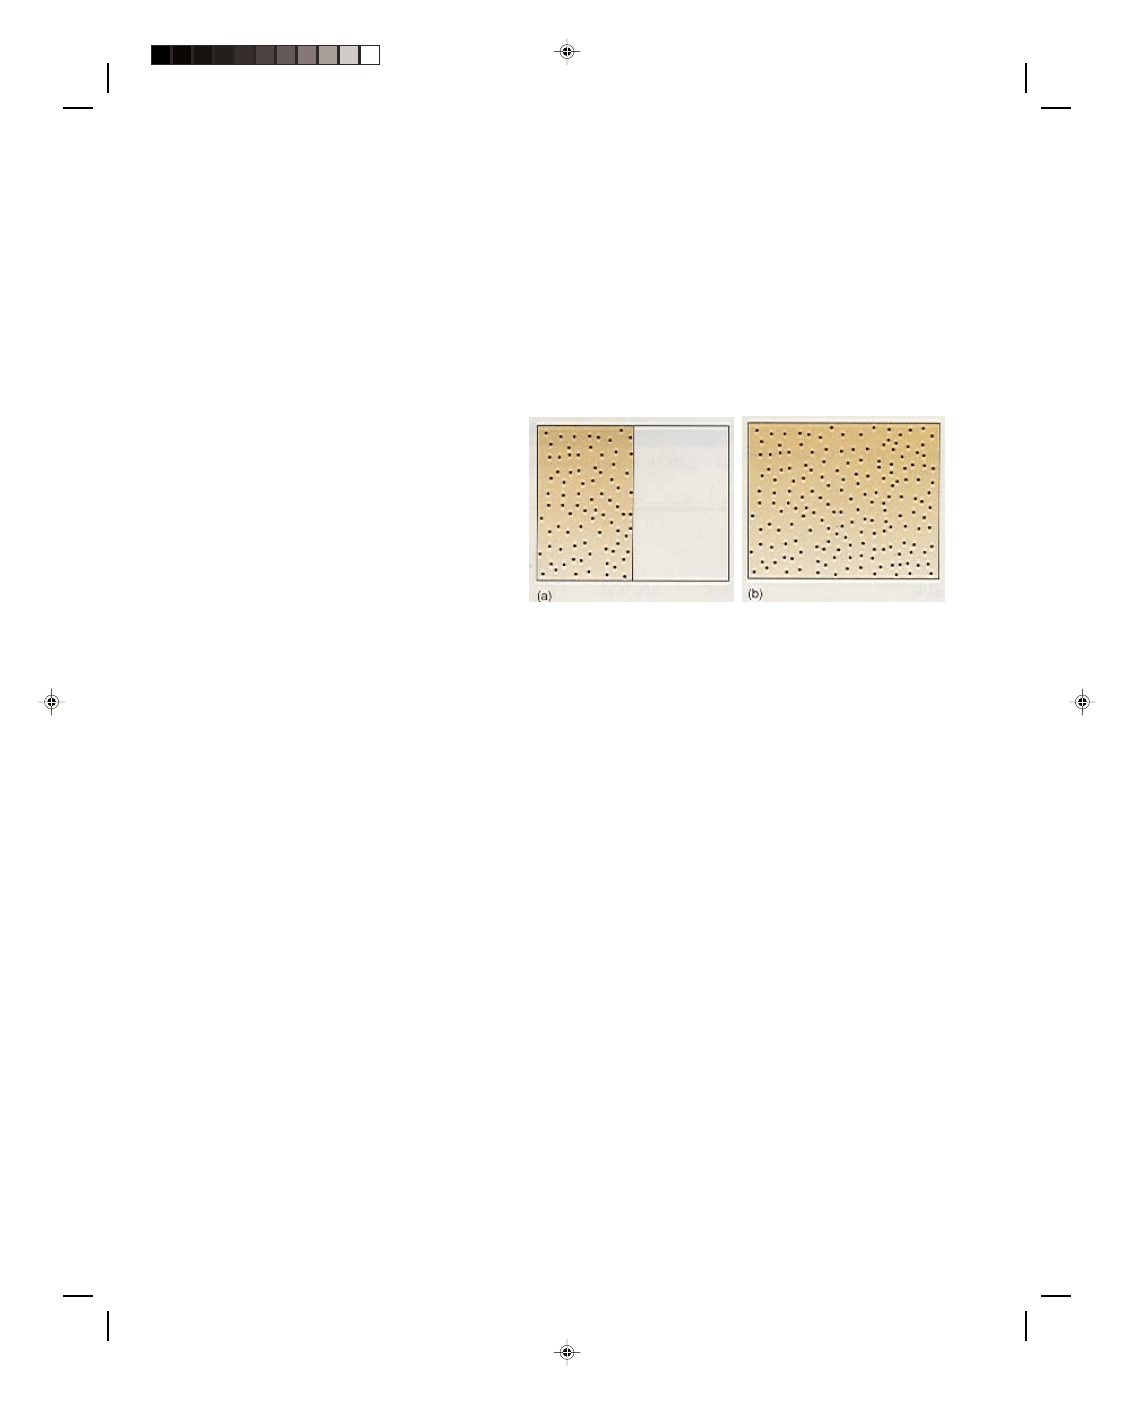
As an example, let us consider the gas molecules in figure 17.15(a). The molecules are contained in the left-
hand side of a box by a partition located in the center of the box. When the partition is removed some of the
molecules move to the right-hand side of the box
until an equilibrium condition is reached whereby
there are the same number of molecules in both
sides of the box, figure 17.15(b). We now ask, can all
the gas molecules in the entire box of figure 17.15(b)
move to the left and be found in the original state
shown in figure 17.15(a)? We know from experience
that this never happens. This would be tantamount
to all the gas molecules in the room that you are
now sitting in moving completely to the other side of
the room, leaving you in a vacuum. This just does
Figure 17.15
Gas molecules in a partitioned box.
not happen in life. However, if it did it would not violate the first law of thermodynamics. But the second law says
some processes do not occur. This is certainly one of them. Notice that the first case in which all the molecules are
in the left-hand side of the box is more orderly than the second case where the molecules are distributed over the
entire box. (If the volume of the box is larger, there are more random paths for the molecules to follow and hence
more disorder.)
As another example of order and disorder, let us drop a piece of clay. When the clay is dropped,
superimposed over the thermal motion of the molecules of the clay is the velocity of the clay toward the ground.
That is, all the molecules have a motion toward the ground, which is an ordered motion. When the clay hits the
ground and sticks to it, the kinetic energy of the falling molecules shows up as thermal energy of the clay
molecules, which is a random or disordered motion of the molecules. Hence there is a transformation from order to
disorder in the natural process of a collision of a falling object. Now as we know, the clay cannot gather together
all the random thermal motion of the clay molecules and convert them to ordered translational motion upward,
and hence the clay by itself cannot move upward. Thus the concept of which processes can occur in nature can also
be measured by the amount of order or disorder between the initial and final states of the system. Using the
concept of order, the second law of thermodynamics can also be stated as: an isolated system in a state of relative
order will always pass to a state of relative disorder until it reaches the state of maximum disorder, which is
thermal equilibrium.
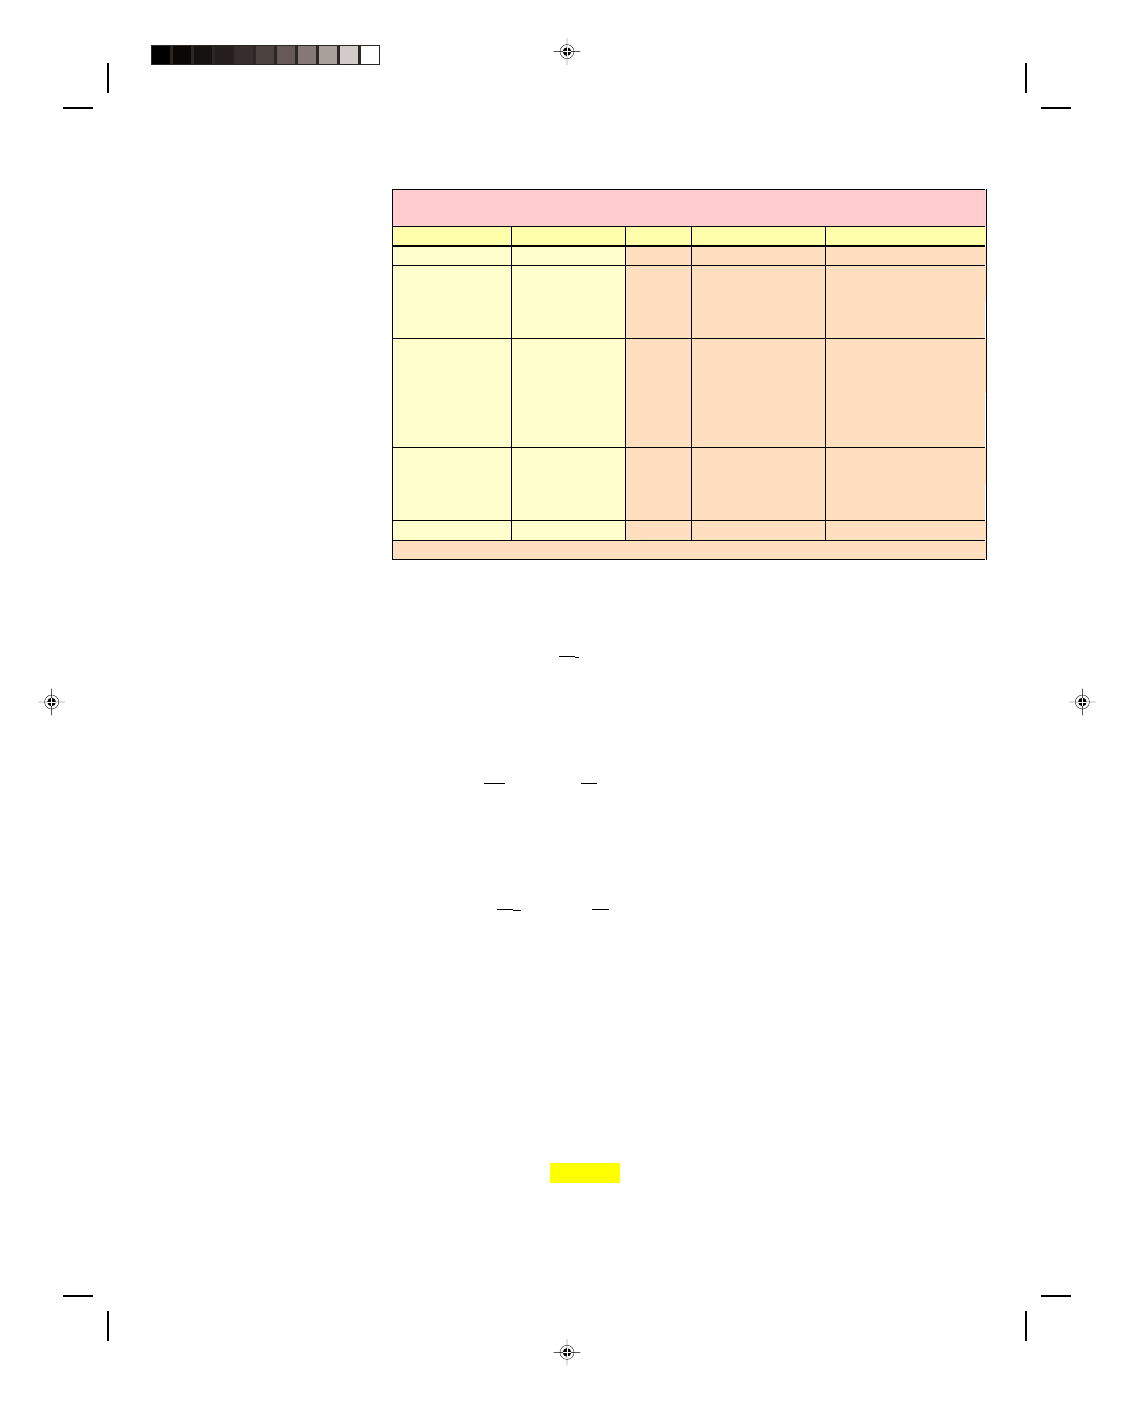
Let us return to our example of the gas molecules in a box. Although normally there are billions of
molecules in the box, to simplify our discussion let us assume that there are only four molecules present. They are
numbered consecutively 1, 2, 3, and 4. Let us ask how many ways we can distribute these four molecules between
the left- and right-hand sides of the box. First we could place the four molecules all in the left-hand side of the box
as shown in table 17.1. Thus there is only one way we can place the four molecules into the left-hand side of the
box. Let us designate the number of ways that the four molecules can be distributed as N
i
and note that N
1
= 1. Next
we see how many ways we can place one molecule in the right-hand side of the box and three in the left-hand side.
That is, first we place molecule 1 in the right-hand side of the box, and see that that leaves molecules 2, 3, 4, in the
left-hand side. Then we place molecule 2 in the right-hand side and see that we then have molecules 1, 3, 4 in the
left-hand side. Continuing in this way we see from the table that there are four ways to do this. Thus, we
designate the number of ways we can place one molecule in the right-hand side of the box and three in the left-
hand side as N
2
and see that this is equal to 4. Next we see how many ways we can place two molecules in the
right-hand side of the box and two in the left-hand side. From the table we see that there are six ways, and we
Pearson Custom Publishing
526
Chapter 17: Thermodynamics 17-23
call this N
3
= 6. Next we see
how many ways we can
place one molecule in the
left-hand side of the box
and three in the right-hand
side. Again from the table
we see that there are four
ways to do this, and we call
this N
4
= 4. Finally we ask
how many ways can the
four molecules be placed in
the right-hand side of the
box and again we see from
the table there is only one
way. We call this N
5
= 1.
Thus there are five possible
ways (for a total of 16
possible states) that the
four molecules could be
distributed between the
left- and right-hand sides of
the box.
But which of all these possibilities is the most probable? The probability that the molecules are in the state
that they are in compared with all the possible states they could be in is given by
P = N
i
×
100%
N
where N
i
is the number of states that the molecules could be in for a particular distribution and N is the total
number of possible states. As we see from the table, there are 16 possible states that the four molecules could be
in. Hence the probability that the molecules are in the state where all four are on the left-hand side is
P = N
1
× 100% = 1 × 100% = 6.25%
N 16
That is, there is a 6.25% probability that all four molecules will be found in the left-hand side of the box.
The probability that the distribution of the four molecules has three molecules in the left-hand side and
one in the right-hand side is found by observing that there are four possible ways that the molecules can be
distributed and hence N
2
= 4. Therefore,
P = N
2
×
100% = 4 × 100% = 25%
N 16
Thus there is a 25% probability that there are three molecules in the left-hand side and one molecule in the right-
hand side. Continuing in this way the probabilities that the molecules will have the particular distribution is
shown in table 17.1. Thus there is a 37.5% probability that the distribution has two molecules in each half of the
box, a 25% probability that the distribution has one molecule in the left half of the box and three in the right half
of the box, and finally a 6.25% probability that the distribution has no molecules in the left half of the box and four
in the right half of the box.
Notice that the first and last distributions (all molecules either on the left side or on the right side), are the
most ordered and they have the lowest probability, 6.25%, for the distribution of the molecules. Also notice that
the third distribution where there are two molecules on each side of the box has the greatest disorder and also the
highest probability that this is the way that the molecules will be distributed. Notice that the distribution with the
greatest possible number of states gives the highest probability. These ideas led Boltzmann to define the entropy
of a state as
ln
S k
P
=
(17.58)
Table 17.1
Possible Distributions of Four Molecules in a Box
Left
Right
N
i
P
i
= N
i
/N
S = k ln P
1 2 3 4
1
1/16 = 6.25%
2.53 × 10
−23
J/K
2 3 4
1 3 4
1 2 4
1 2 3
1
2
3
4
4
4/16 = 25%
4.44 × 10
−23
J/K
1 2
1 3
2 3
1 4
2 4
3 4
3 4
2 4
1 4
2 3
1 3
1 2
6
6/16 = 37.5%
5.00 × 10
−23
J/K
1
2
3
4
2 3 4
1 3 4
1 2 4
1 2 3
4
4/16 = 25%
4.44 × 10
−23
J/K
1 2 3 4
1
1/16 = 6.25%
2.53 × 10
−23
J/K
ΣN
i
= N = 16 ;
ΣP
i
= 100%
Pearson Custom Publishing
527

17-24 Vibratory Motion, Wave Motion and Fluids
where k is a constant, that later turned out to be the Stefan-Boltzmann constant, which is equal to 1.38 × 10
−23
J/K; ln is the natural logarithm; and P is the probability that the system is in the state specified. Thus in our
example, the entropy of the first distribution is computed as
S = k ln P = (1.38 × 10
−23
J/K)(ln 6.25)
= 2.53 × 10
−23
J/K
The entropy for each possible distribution is computed and shown in table 17.1. Notice that the most
disordered state (two molecules on each side of the box) has the highest value of entropy. If we were to start the
system with the four molecules in the left-hand box, entropy = 2.53 × 10
−23
J/K, the system would move in the
direction of maximum entropy, 5.00 × 10
−23
J/K, the state with two molecules on each side of the box. As before,
natural processes move in the direction of maximum entropy. The actual values of the computed entropy for this
example are extremely small, because we are dealing with only four molecules. If we had only one mole of a gas in
the box we would have 6.02 × 10
23
molecules in the box, an enormous number compared with our four molecules.
In such a case the numerical values of the entropy would be much higher. However there would still be the same
type of distributions. The state with the greatest disorder, the same number of molecules on each side of the box,
would be the state with the greatest value of the entropy. The state with all the molecules on one side of the box
would have a finite but vanishingly small value of probability.
Hence the original problem we stated in figure 17.15(a), with the gas in the left partition has the smallest
entropy while the gas on both sides of the box in figure 17.15(b), has the greatest entropy. The process flows from
the state of lowest entropy to the one of highest entropy. It is interesting to note that it is not impossible for the
gas molecules on both sides of the box to all move to the left-hand side of the box, but the probability is so
extremely small that it would take a time greater than the age of the universe for it to happen. Hence, effectively
it will not happen.
The state of maximum entropy is the state of maximum disorder and is the state where all the molecules
are moving in a completely random motion. This state is, of course, the state of thermal equilibrium. We have seen
throughout our study of heat that whenever two objects at different temperatures are brought together, the hot
body will lose thermal energy to the cold body until the hot and cold body are at the same equilibrium
temperature. Thus, as all bodies tend to equilibrium they all approach a state of maximum entropy. Hence, the
universe itself tends toward a state of maximum entropy, which is a state of thermal equilibrium of all the
molecules of the universe. This is a state of uniform temperature and density of all the atoms and molecules in the
universe. No physical, chemical, or biological processes would be capable of occurring, however, because a state of
total disorder cannot do any additional work. This ultimate state of the universe is sometimes called the heat
death of the universe.
One final thought about entropy, and that is the idea of a direction for time. All the laws of physics, except
for the second law of thermodynamics, are invariant to a change in the direction of time. That is, for example,
Newton’s laws of motion would work equally well if time were to run backward. If a picture were taken of a
swinging pendulum with a video camera, and then played first forward and then backward, we could not tell from
the picture which picture is running forward in time and which is running backward in time. They would both
appear the same. On the other hand, if we take a video of a dropped coffee cup that hits the ground and shatters
into many pieces we can certainly tell the difference between running the video forward or backward. When the
video is run backward we would see a shattered coffee cup on the floor come together and repair itself and then
jump upward onto the table. Nature does not work this way, so we know the picture must be running backward.
Now before the coffee cup is dropped, we have a situation of order. When the cup is dropped and shattered we have
a state of disorder. Since natural processes run from a state of order (low entropy) to one of disorder (high
entropy), we can immediately see the time sequence that must be followed in the picture. The correct sequence to
view the video picture is to start where the coffee cup has its lowest entropy (on the table initially at rest) and end
where the cup has its maximum entropy (on the floor broken into many pieces). Hence the concept of entropy gives
us a direction for time. In any natural process, the initial state has the lowest entropy, and the final state has the
greatest entropy. Thus time flows in the direction of the increase in entropy. Stated another way, the past is the
state of lowest entropy and the future is the state of highest entropy. Thus entropy is sometimes said to be time’s
arrow, showing its direction.
Because of this, there have been many speculative ideas attributed to time. What happens to time when
the universe reaches its state of maximum entropy? Since time flows from low entropy to high entropy, what
happens when there is no longer a change in entropy? Would there be an infinite present? An eternity?
Pearson Custom Publishing
528
Chapter 17: Thermodynamics 17-25
Have you ever wondered?
An Essay on the Application of Physics
Meteorology - The Physics of the Atmosphere
Have you ever wondered, while watching the weather forecast on
your local TV station, what all those lines and arrows were on those
maps? It looked something like figure 1.
If we were to look at the television screen more closely we
would see a map of the United States. At every weather station
throughout the United States, the atmospheric pressure is measured
and recorded on a weather map. On that map, a series of lines,
connecting those pressures that are the same, are drawn. These
lines are called isobars and can be seen in figure 2. An isobar is a
line along which the pressure is constant. An isobar is analogous to
a contour line that is drawn on a topographical map to indicate a
certain height above mean sea level. As an example, consider the
mountain and valley shown in figure 3(a). A series of contour lines
are drawn around the mountain at constant heights above sea level.
The first line is drawn at a height H = 200 m above sea level.
Everywhere on this line the height is exactly 200 m above sea level.
The next contour line is drawn at H = 400 m. Everywhere on this
line the height is exactly 400 m above sea level. Between the 200 m
contour and the 400 m contour line the height varies between 200 m
and 400 m. The contour line for 600 m is also drawn in the figure.
The very top of the mountain is greater than the 600 m and is the
highest point of the mountain. The contour lines showing the valley
are drawn at
−200 m, −400 m, and −600 m. The −200 m
Figure 1
Your local TV weatherman.
contour line shows that every point on this line is 200 m
below sea level. The bottom of the valley is the lowest
point in the valley. If we were to look down on the
mountain and valley from above, we would see a series of
concentric circles representing the contour lines as they
are shown in figure 3(b). (On a real mountain and valley
the contours would probably not be true circles.)
The isobars are to a weather map as contour
lines are to a topographical map. The isobars represent
the pressure of the atmosphere. By drawing the isobars,
a picture of the pressure field is obtained. Normal
atmospheric pressure is 1013.25 mb. But remember that
normal is an average of abnormals. At any given time,
the pressure in the atmosphere varies slightly from this
normal value. If the atmospheric pressure is greater
than normal at your location, then you are in a region of
high pressure. If, on the other hand, the atmospheric
Figure 2
A weather map.
pressure is less than normal at your location, then you are in a region of low pressure. The isobars indicating high
and low pressure are shown in figure 4(a). The high-pressure region can be visualized as a mountain and the low-
pressure region as a valley in figure 4(b). Air in the high-pressure region flows down the pressure mountain into
the low-pressure valley, just as a ball would roll down a real mountain side into the valley below. This flow of air is
called wind. Hence, air always flows out of a high-pressure area into a low-pressure area. The force on a ball
Pearson Custom Publishing
529
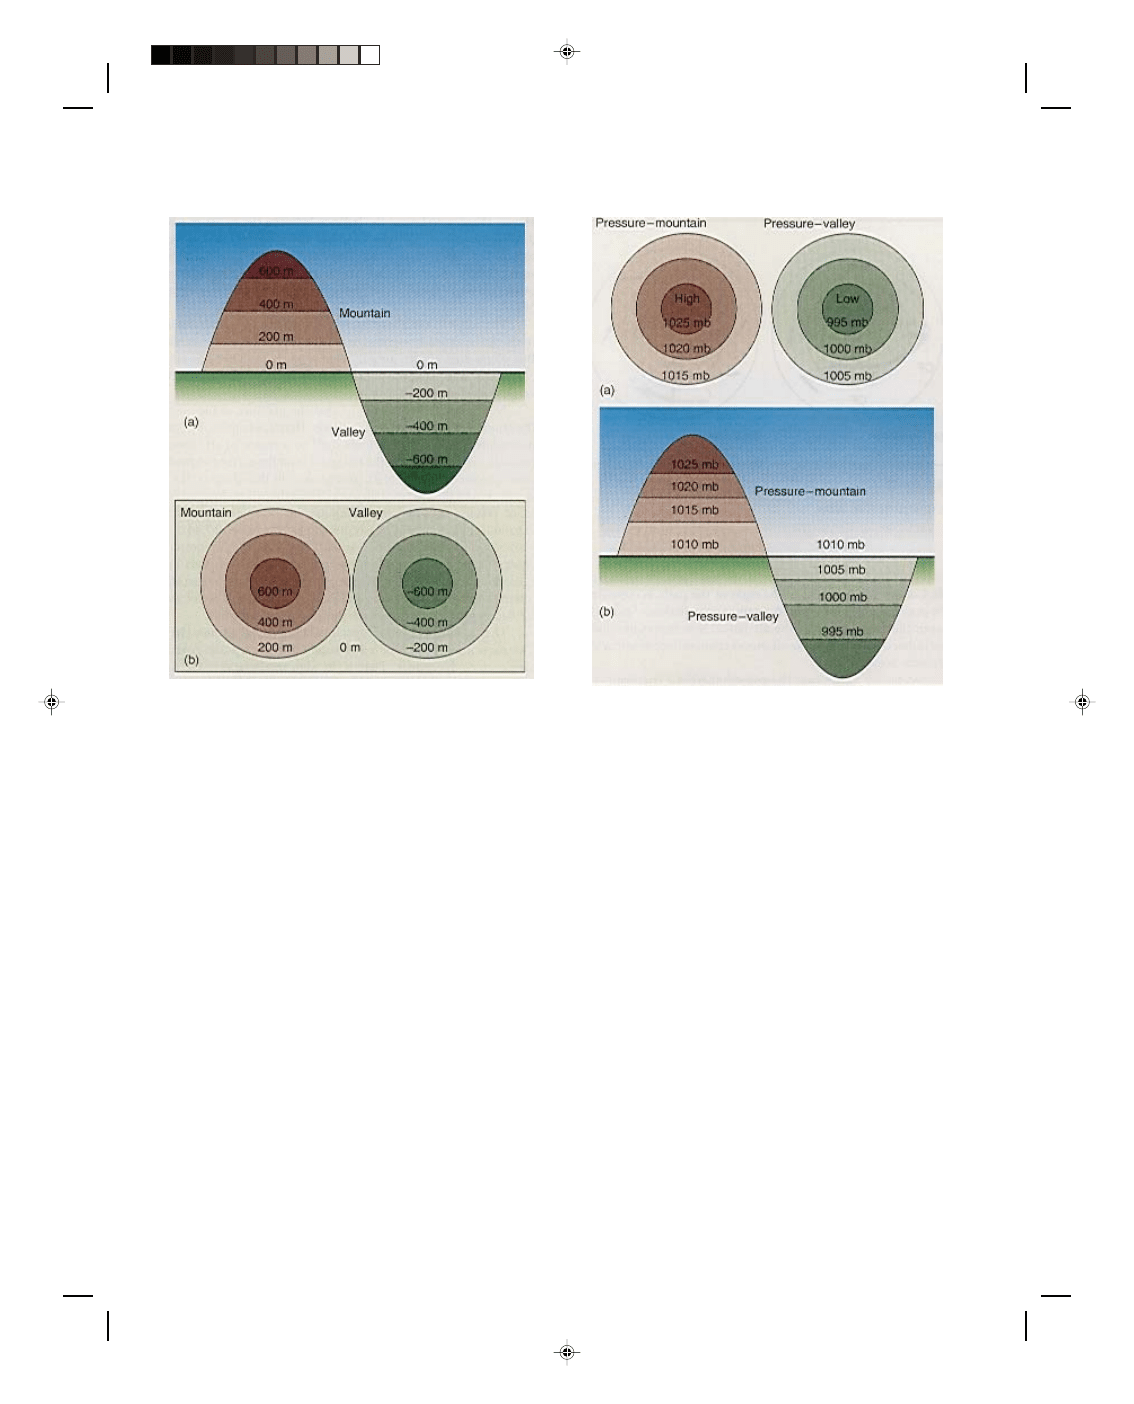
17-26 Vibratory Motion, Wave Motion and Fluids
rolling down the mountain is the component, acting down the mountain, of the gravitational force on the ball. The
force on a parcel of air is caused by the difference in pressure between the higher pressure and the lower
Figure 3
Contour lines on a topographical map.
Figure 4
High and low atmospheric pressure.
pressure. This force is called the pressure gradient force (PGF) per unit mass, and it is directed from the high-
pressure area to the low-pressure area. It is effectively the slope of the pressure mountain-valley. A large pressure
gradient, corresponding to a steep slope, causes large winds, whereas a small pressure gradient, corresponding to
a shallow slope, causes very light winds.
If the earth were not rotating, the air would flow perpendicular to the isobars. However, the earth does
rotate, and the rotation of the earth causes air to be deflected to the right of its original path. The deflection of air
to the right of its path in the northern hemisphere is called the Coriolis effect. The Coriolis effect arises because
the rotating earth is not an inertial coordinate system. For small-scale motion the rotating earth approximates an
inertial coordinate system. However, for large-scale motion, such as the winds, the effect of the rotating earth
must be taken into account. It is taken into account by assuming that there is a fictitious force, called the Coriolis
force (CF) that acts to the right of the path of a parcel of air in its motion through the atmosphere. The equation
for the Coriolis force is
CF = 2v
Ω sin φ (17H.1)
where CF is the Coriolis force per unit mass of air, v is the speed of the wind,
Ω is the angular velocity of the earth,
and
φ is the latitude. Thus, the Coriolis force depends on the speed of the air (the greater the speed the greater the
force) and the latitude angle
φ. At the equator, φ = 0 and sin φ = 0, and hence there is no force of deflection at the
equator. For
φ = 90
0
, sin
φ = 1, hence the maximum force and deflection occur at the pole.
Let us describe the motion of the air as it moves toward the low-pressure area. The air starts on its motion at the
point A, figure 5(a), along a path that is perpendicular to the isobars. But the air is deflected to the right of its
path by the Coriolis force, and ends up at the position B. At B, the pressure gradient force is still acting toward
the center of the low-pressure area, while the Coriolis force, acting to the right of the path, is opposite to the
pressure gradient force.
Pearson Custom Publishing
530
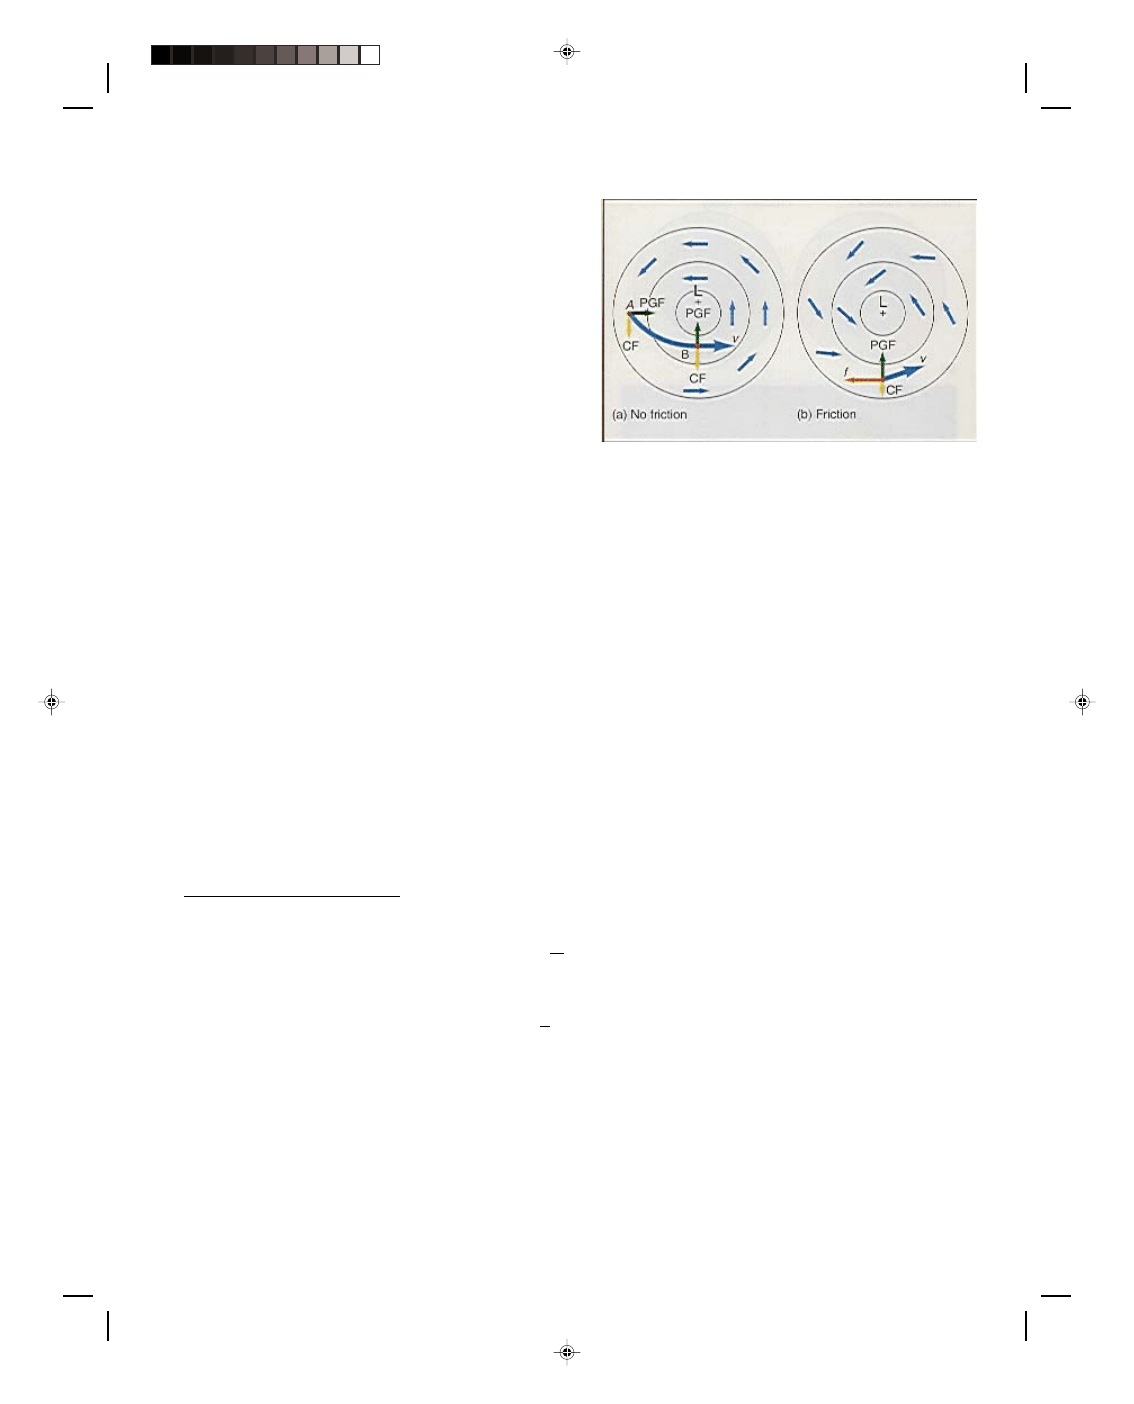
Chapter 17: Thermodynamics 17-27
An approximate balance
1
exists between the two forces
and the air parcel now moves parallel to the isobars.
Notice that the air moves counterclockwise in a low-
pressure area.
As the air moves over the ground, there is a
frictional force f that acts on the air, is directed opposite
to the direction of motion of the air, and is responsible
for the slowing down of the air. This is shown in figure
5(b). But, as seen in equation 17H.1, the Coriolis force is
a function of the wind speed. If the wind speed decreases
because of friction, the Coriolis force also decreases.
Hence, there is no longer the balance between the
pressure gradient force and the Coriolis force and the air
parcel now moves toward the low-pressure area. The
combined result of the pressure gradient force, the
Figure 5
A low-pressure area.
Coriolis force, and the frictional force, causes the air to spiral into the low-pressure area, as seen in figure 5(b).
The result of the above analysis shows that air spirals counterclockwise into a low-pressure area at the
surface of the earth. But where does all this air go? It must go somewhere. The only place for it to go is upward
into the atmosphere. Hence, there is vertical motion upward in a low-pressure area.
Now recall from chapter 13 that the pressure of the air in the atmosphere decreases with altitude. Hence,
when the air rises in the low-pressure area it finds itself in a region of still lower pressure aloft. Therefore, the
rising air from the surface expands into the lower pressure aloft. But as seen in this chapter, for a gas to expand
the gas must do work. Since there is no heat added to, or taken away from this rising air,
∆Q = 0, and the air is
expanding adiabatically. But as just shown in equation 17.44, the work done in the expansion causes a decrease in
the internal energy of the gas. Hence, the rising air cools as it expands because the energy necessary for the gas to
expand comes from the internal energy of the gas itself. Hence the temperature of the air decreases as the air
expands and the rising air cools.
The amount of water vapor in the air is called humidity. The maximum amount of water vapor that the air
can hold is temperature dependent. That is, at high temperatures the air can hold a large quantity of water vapor,
whereas at low temperatures it can only hold a much smaller quantity. If the rising air cools down far enough it
reaches the point where the air has all the water vapor it can hold. At this point the air is said to be saturated and
the relative humidity of the air is 100%. If the air continues to rise and cool, it cannot hold all this water vapor.
Hence, some of the water vapor condenses to tiny drops of water. These drops of water effectively float in the air.
(They are buoyed up by the rising air currents.) The aggregate of all these tiny drops of water suspended in the air
is called a cloud. Hence, clouds are formed when the rising air is cooled to the condensation point. If the rising and
cooling continue, more and more water vapor condenses until the water drops get so large that they fall and the
1A more detailed analysis by Newton’s second law would give
a = F = PGF + CF
M
Since the air parcel is moving in a circle of radius r, with a velocity v, the acceleration is the centripetal acceleration given by v
2
/r. Hence
Newton's second law should be written as
v
2
= PGF + CF
r
But in very large scale motion, such as over a continent, v
2
/r
≈ 0.1× 10
−3
m/s
2
, while the PGF
≈ 1.1 × 10
−3
m/s
2
. Thus the centripetal acceleration
is about 1/10 of the acceleration caused by the pressure gradient force, and in this simplified analysis is neglected. The second law then
becomes
0 = PGF + CF
or
PGF =
−CF
Hence the force on the air parcel is balanced between the pressure gradient force and the Coriolis force. The wind that results from the balance
between the PGF and the CF is called the geostrophic wind. For a more accurate analysis and especially in smaller sized pressure systems such
as hurricanes and tornadoes this assumption cannot be made and the centripetal acceleration must be taken into account.
Pearson Custom Publishing
531
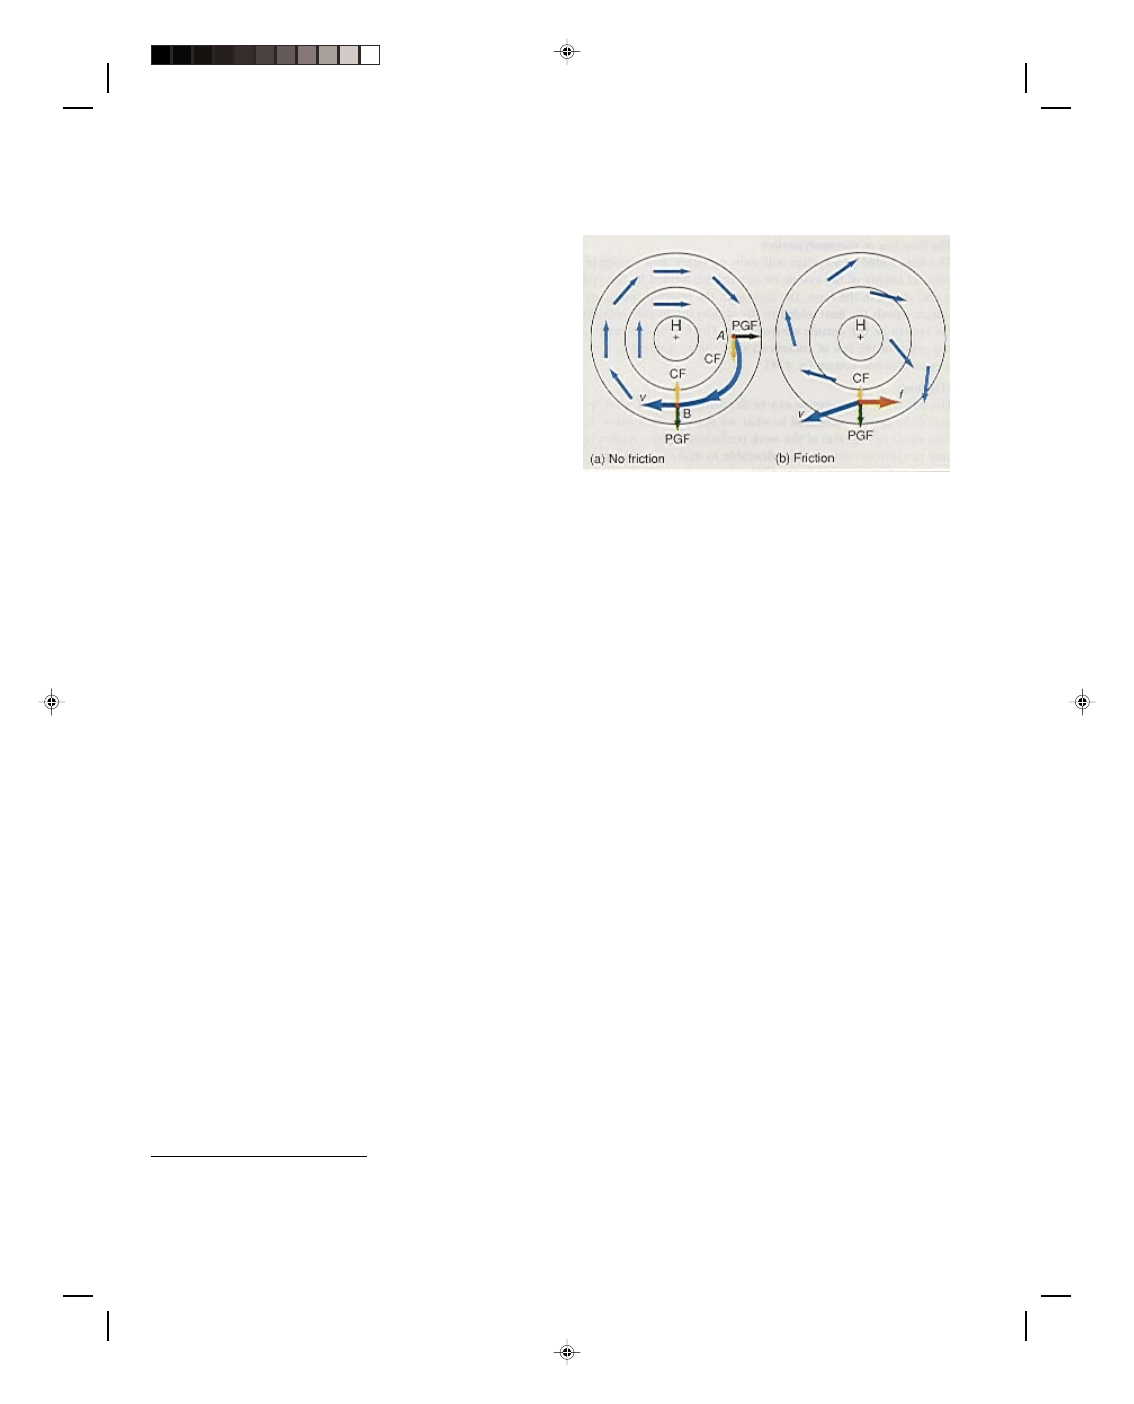
17-28 Vibratory Motion, Wave Motion and Fluids
falling drops are called rain. In summary, associated with a low-pressure area in the atmosphere is rising air. The
cooling of this adiabatically expanding air causes the formation of clouds, precipitation, and general bad weather.
Thus, when the weatherman says that low pressure is moving into your area, as a general rule, you can expect bad
weather.
Everything we said about the low-pressure area is
reversed for a high-pressure area. The pressure gradient
force points away from the high-pressure area. As the air
starts out of the high-pressure area at the point A, figure
6(a), it is moving along a path that is perpendicular to the
isobars. The Coriolis force now acts on the air and deflects
it to the right of its path. By the time the air reaches the
point B, the pressure gradient force is approximately
balanced by the Coriolis force,
2
and the air moves parallel
to the isobars. Thus, the air flows clockwise around the
high-pressure area. The frictional force slows down the air
and causes the Coriolis force to decrease in size. The
pressure gradient force is now greater than the Coriolis
force, and the air starts to spiral out of the high-pressure
area, figure 6(b).
Figure 6
A high-pressure area.
From what we have just seen, air spirals out of a high pressure area at the surface of the earth. But if all
the air that was in the high-pressure area spirals out, what is left within the high-pressure area? If the air is not
replenished, the area would become a vacuum. But this is impossible. Therefore, air must come from somewhere to
replenish the air spiraling out of the high. The only place that it can come from is from the air aloft. That is, air
aloft moves downward into the high-pressure area at the surface. Thus, there is vertical motion downward in a
high-pressure area.
As the air aloft descends, it finds itself in a region of still higher pressure and is compressed adiabatically.
Thus, work is done on the gas by the atmosphere and this increase in energy shows up as an increase in the
internal energy of the air, and hence an increase in the temperature of the descending air. Thus, the air warms up
adiabatically as it descends. Because warmer air can hold more water vapor than colder air, the water droplets
that made up the clouds evaporate into the air. As more and more air descends, more and more water droplets
evaporate into the air until any clouds that were present have evaporated, leaving clear skies. Hence, high-
pressure areas are associated with clear skies and, in general, good weather. So when the weatherman tells you
that high pressure is moving into your area, you can usually expect good weather.
Now when you look at your TV weather map, look for the low- and high-pressure areas. If the low-pressure
area is moving into your region, you can expect clouds and deteriorating weather. If the high-pressure area is
moving into your region, you can expect improving weather with clear skies.
Those other lines on the weather map are called fronts. A front is a boundary between two different air
masses. An air mass is a large mass of air having uniform properties of temperature and moisture throughout the
horizontal. Air sitting over the vast regions of Canada has the characteristic of being cold and dry. This air mass is
called a continental polar air mass and is designated as a cP air mass. Air sitting over the southern ocean areas
and the Gulf of Mexico has the characteristic of being hot and humid. This air mass is called a maritime tropical,
mT, air mass. These two air masses interact at what is called the polar front. Much of your weather is associated
with this polar front. If the continental polar air mass is moving forward, the polar front is called a cold front. On a
weather map the cold front is shown either as a blue line or, if the presentation is in black and white, a black line
with little triangles on its leading edge showing the direction of motion. If the continental polar air mass is
retreating northward, the polar front is called a warm front. On a weather map the warm front is shown either as
a red line or, if the presentation is in black and white, a black line with little semicircles on its edge showing the
direction in which the front is retreating. The center of the polar front is embedded in the low-pressure area.
With all this background, let us now analyze the weather map of figure 2. Notice that there is a large low-
pressure area over the eastern half of the United States. In general, the poorer weather will be found in this
region. A high-pressure area is found across the western half of the United States. In general, good weather will be
found in this region. The polar front can also be seen in figure 2. The cold front is the boundary between the cold
2The same approximation for the balance between the PGF and the CF used in the analysis of the low-pressure area is also made for the high-
pressure area.
Pearson Custom Publishing
532

Chapter 17: Thermodynamics 17-29
continental polar air that came out of Canada and the warm moist maritime tropical air that has moved up from
the gulf. The arrows on the map indicate the velocity of the air. The cold dry cP air, being heavier than the warm
tropical mT air, pushes underneath the mT air, driving it upward. The moisture in the rising tropical air
condenses and forms a narrow band of clouds along the length of the cold front. The precipitation usually
associated with the cold front is showery.
The warm front is the boundary of the retreating cool air and the advancing warm moist air. The mT air,
being lighter than the retreating cP air, rises above the colder air. The sloping front of the retreating air is much
shallower than the slope of the advancing cold front. Therefore, the mT air rises over a very large region and gives
a very vast region of clouds and precipitation. Thus the weather associated with a warm front is usually more
extensive than the weather associated with a cold front.
Your weather depends on where you are with respect to the frontal systems. If you are north of the warm
front in figure 2, such as in Illinois, Ohio, or Pennsylvania, the temperatures will be cool, the winds will be from
the southeast, the sky will be cloudy, and you will be getting precipitation. If you are south of the warm front and
in advance of the cold front, such as in Alabama, Georgia, South Carolina, and Florida, the temperature will be
warm, the humidity high, winds will be from the southwest and you will usually have nice weather. If the cold
front has already passed you by, such as in Kansas, Oklahoma, Texas, and Arkansas, the skies will be clear or at
least clearing, the temperature will be cold, the humidity will be low, the winds will be from the northwest, and in
general you will have good weather.
All the highs, lows, and fronts, move across the United States from the west toward the east. So the
weather that you get today will change as these weather systems move toward you.
The Language of Physics
Thermodynamics
The study of the relationships
between heat, internal energy, and
the mechanical work performed by
a system. The system is usually a
heat engine of some kind (p. ).
Work
The work done by a gas during
expansion is positive and the work
done by a gas during compression is
negative. The work done is equal to
the area under the curve in a p-V
diagram. The work done depends on
the thermodynamic path taken in
the p-V diagram (p. ).
Cyclic process
A process that runs in a cycle
eventually returning to where it
started from. The net work done by
the system during a cyclic process is
equal to the area enclosed by the
cyclic thermodynamic path in a p-V
diagram. The net work is positive if
the cycle proceeds clockwise, and
negative if the cycle proceeds
counterclockwise on the p-V
diagram. The total change in
internal energy around the entire
cycle is equal to zero. The energy
for the net work done by the system
comes from the net heat applied to
the system (p. ).
Isobaric process
A process that takes place at a
constant pressure (p. ).
Isochoric or isometric process
A process that takes place at
constant volume. The heat added to
a system during an isochoric
process shows up as an increase in
the internal energy of the system
(p. ).
Isothermal process
A process that takes place at
constant temperature (p. ).
Molecular mass
The molecular mass of any
substance is equal to the mass of
one molecule of that substance
times the total number of molecules
in one mole of the substance
(Avogadro’s number). Thus, the
molecular mass of any substance is
equal to the mass of one mole of that
substance. Hence, the mass of a gas
is equal to the number of moles of a
gas times the molecular mass of the
gas (p. ).
Molar specific heat
The product of the specific heat of a
substance and its molecular mass
(p. ).
Heat in a thermodynamic
process
The heat absorbed or liberated in a
thermodynamic process depends on
the path that is followed in a p-V
diagram. Thus, heat, like work, is
path dependent. Heat is always
positive when it is added to the
system and negative when it is
removed from the system (p. ).
Internal energy of a gas
The internal energy of a gas is
equal to the sum of the kinetic
energy of all the molecules of a gas.
A change in temperature is
associated with a change in the
internal energy of a gas. Hence, an
isothermal expansion occurs at
constant internal energy.
Regardless of the path chosen
between two points in a p-V
diagram, the change in internal
Pearson Custom Publishing
533

17-30 Vibratory Motion, Wave Motion and Fluids
energy is always the same. Thus,
the internal energy of the system is
independent of the path taken in a
p-V diagram; it depends only on the
initial and final states of the
thermodynamic system (p. ).
The first law of
thermodynamics
The heat added to a system will
show up either as a change in
internal energy of the system or as
work performed by the system. It is
also stated in the form: the change
in the internal energy of the system
equals the heat added to the system
minus the work done by the system
on the outside environment. The
first law is really a statement of the
law of conservation of energy
applied to a thermodynamic system
(p. ).
Efficiency
The efficiency of an engine can be
defined in terms of what we get out
of the system compared to what we
put into the system. It is thus equal
to the ratio of the work performed
by the system to the heat put into
the system. It is desirable to make
the efficiency of an engine as high
as possible (p. ).
Adiabatic process
A process that occurs without an
exchange of heat between the
system and its environment. That
is, heat is neither added nor taken
away from the system during the
process (p. ).
Otto cycle
A thermodynamic cycle that is
approximated in the operation of
the gasoline engine (p. ).
Ideal heat engine
An idealized engine that shows the
main characteristics of all engines,
namely, every engine absorbs heat
from a source at high temperature,
performs some amount of
mechanical work, and then rejects
some heat at a lower temperature
(p. ).
Refrigerator
A heat engine working in reverse.
That is, work is done on the
refrigerator, thereby extracting a
quantity of heat from a low-
temperature reservoir and
exhausting a large quantity of heat
to a hot reservoir (p. ).
Carnot cycle
A thermodynamic cycle of a Carnot
engine, consisting of two isothermal
and two adiabatic paths in a p-V
diagram. The Carnot engine is the
most efficient of all engines (p. ).
The second law of
thermodynamics
The second law of thermodynamics
tells us which processes are possible
and which are not. The concept of
entropy is introduced to give a
quantitative basis for the second
law. It is equal to the ratio of the
heat added to the system to the
absolute temperature of the system,
when a thermodynamic system
changes from one equilibrium state
to another along a reversible path.
In an isolated system, the system
always changes from values of low
entropy to values of high entropy,
and only those processes are
possible for which the entropy of
the system increases or remains a
constant (p. ).
Kelvin-Planck statement of the
second law of thermodynamics
No process is possible whose sole
result is the absorption of heat from
a reservoir at a single temperature
and the conversion of this heat
energy completely into mechanical
work (p. ).
Clausius statement of the
second law of thermodynamics
No process is possible whose sole
result is the transfer of heat from a
cooler to a hotter body (p. ).
Summary of Important Equations
Work done by a gas
W = p
∆V (17.5)
Mass of the gas m = m
0
N
A
n (17.14)
Molecular mass M = m
0
N
A
(17.15)
Mass of the gas m = nM (17.16)
Molar specific heat
C = Mc (17.18)
Heat absorbed or liberated by a gas
at constant volume
Q = nC
v
∆T (17.20)
Heat absorbed or liberated by a gas
at constant pressure
Q = nC
p
∆T (17.21)
Internal energy of an ideal gas
U = 3 nRT (17.23)
2
Change in internal energy of an
ideal gas
∆U = 3 nR∆T (17.24)
2
Change in internal energy of an
ideal gas
∆U = nC
v
∆T (17.28)
Molar specific heat at constant
volume C
v
= 3 R (17.29)
2
Molar specific heat at constant
pressure C
p
= 5 R (17.42)
2
First law of thermodynamics
∆U = Q − W (17.31)
Adiabatic process Q = 0
First law for adiabatic process
W =
−∆U (17.44)
Isochoric process
∆V = 0
First law for isochoric process
Q =
∆U (17.47)
Isobaric process
∆p = 0
Pearson Custom Publishing
534
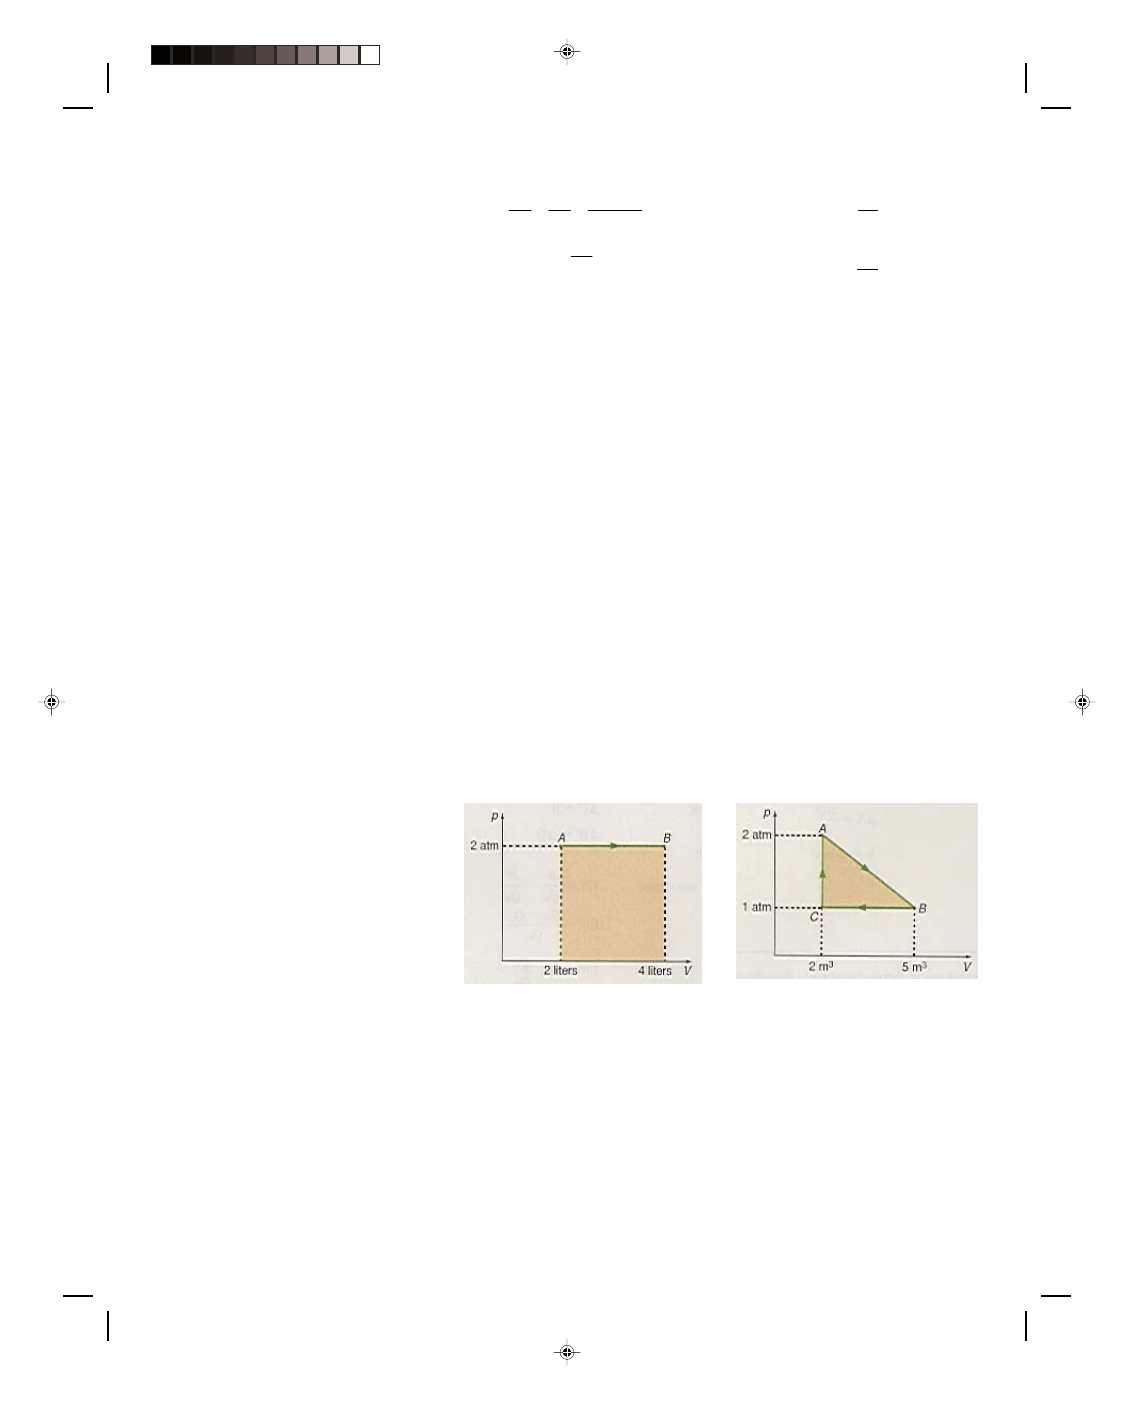
Chapter 17: Thermodynamics 17-31
Cyclic process
∆U = 0
First law for cyclic process
W = Q (17.48)
Efficiency of any engine
H
C
in
H
H
Eff
Q
Q
W
W
Q
Q
Q
−
=
=
=
(17.50)
C
H
Eff 1
Q
Q
= −
(17.51)
Efficiency of a Carnot engine
C
H
Eff 1
T
T
= −
(17.55)
Entropy
∆S = ∆Q (17.56)
T
S = k ln P (17.58)
Questions for Chapter 17
1. Discuss the difference
between the work done by the gas
and the work done on the gas in any
thermodynamic process.
2. Why is the work done in a
thermodynamic process a function
of the path traversed in the p-V
diagram?
3. Define the following
processes: isobaric, isothermal,
isochoric, adiabatic, cyclic, and
isoentropic.
4. How is it possible that a solid
and a liquid have one value for the
specific heat and a gas can have an
infinite number of specific heats?
5. Discuss the first and second
laws of thermodynamics.
6. Describe what is meant by
the statement, “the internal energy
of a thermodynamic system is
conservative.’’
7. Figure 17.7 shows a plot of
isotherms and adiabats on a p-V
diagram. Explain why the adiabats
have a steeper slope.
*8. Discuss the thermodynamic
process in a diesel engine, and draw
the process on a p-V diagram.
*9. Use the first law of
thermodynamics to describe a solar
heating system.
10. Can you use a home
refrigerator to cool the home in the
summer by leaving the door of the
refrigerator open?
*11. Why is a heat pump not
very efficient in very cold climates?
*12. Show how equation 17.54
could be used as the basis of a
temperature scale.
13. Is it possible to connect a
heat engine to a refrigerator such
that the work done by the engine is
used to drive the refrigerator, and
the waste heat from the refrigerator
is then given to the engine, to drive
the engine thus making a perpetual
motion machine?
14. Discuss the concept of
entropy and how it can be used to
determine if a thermodynamic
process is possible.
*15. Discuss the statements: (a)
entropy is sometimes called time’s
arrow and (b) the universe will end
in a heat death when it reaches its
state of maximum entropy.
Problems for Chapter 17
17.2 The Concept of Work
Applied to a Thermodynamic
System
1. How much work is done by
an ideal gas when it expands at
constant atmospheric pressure from
a volume of 0.027 m
3
to a volume of
1.00 m
3
?
2. What is the area of the cross-
hatched area in the p-V diagram?
What is the work done in going
from A to B?
Diagram for Problem 2.
3. What is the net work done in
the triangular cycle ABC?
Diagram for Problem 3.
4. How much work is done in
the cycle ABCDA in the diagram
below?
Pearson Custom Publishing
535
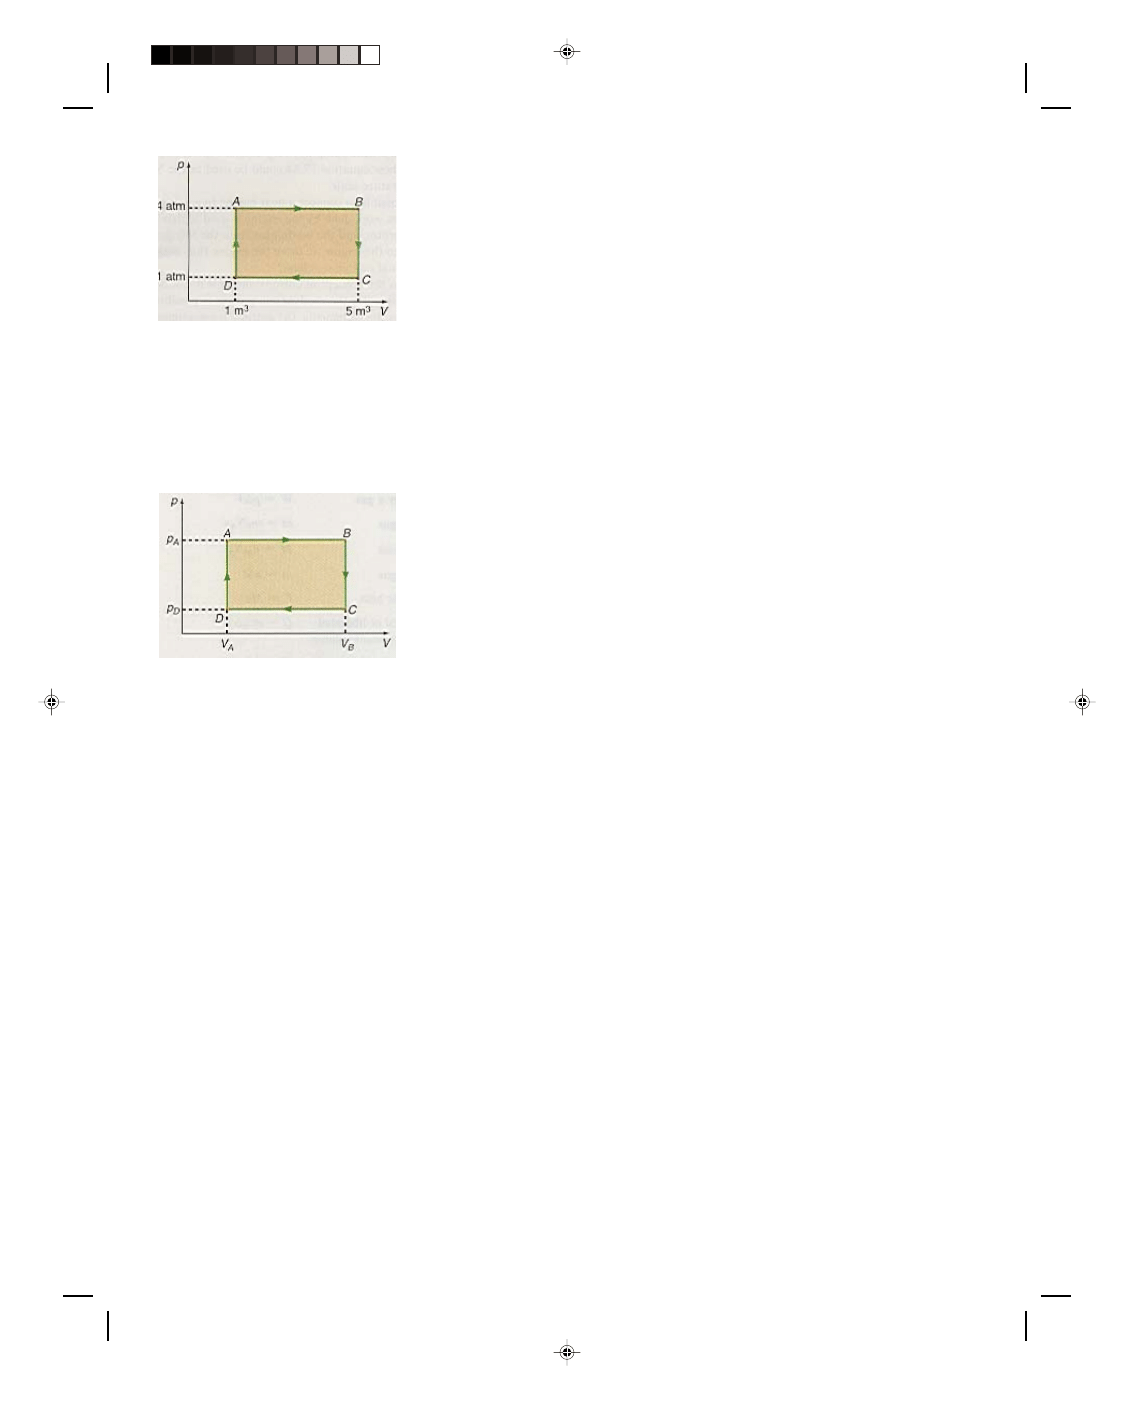
17-32 Vibratory Motion, Wave Motion and Fluids
Diagram for Problem 4.
5. One mole of an ideal gas goes
through the cycle shown. If p
A
=
2.00 × 10
5
Pa, p
D
= 5.00 × 10
4
Pa,
V
B
= 2.00 m
3
, and V
A
= 0.500 m
3
,
find the work done along the paths
(a) AB, (b) BC, (c) CD, (d) DA, and
(e) ABCDA.
Diagram for Problem 5.
17.3 Heat Added to or
Removed from a
Thermodynamic System
6. What is the mass of 4.00
moles of He gas?
7. Find the amount of heat
required to raise the temperature of
5.00 moles of He, 10.0
0
C, at
constant volume.
8. Find the amount of heat
required to raise the temperature of
5.00 moles of He, 10.0
0
C, at
constant pressure.
9. Compute the amount of heat
absorbed when one mole of a
monatomic gas, at a temperature of
200 K, rises to a temperature of 400
K (a) isochoricly and (b) isobaricly.
17.4 The First Law of
Thermodynamics
10. What is the total internal
energy of 3.00 moles of an ideal gas
at (a) 273 K and (b) 300 K?
11. What is the change in
internal energy of 3.00 moles of an
ideal gas when it is heated from 273
K to 293 K?
12. Find the change in the
internal energy of 1 mole of an ideal
gas when heated from 300 K to 500
K.
13. In a thermodynamic system,
500 J of work are done and 200 J of
heat are added. Find the change in
the internal energy of the system.
14. In a certain process, the
temperature rises from 50.0
0
C to
150.0
0
C as 1000 J of heat energy
are added to 4 moles of an ideal gas.
Find the work done by the gas
during this process.
15. In a thermodynamic system,
200 J of work are done and 500 J of
heat are added. Find the change in
the internal energy of the system.
16. In a certain process with an
ideal gas, the temperature drops
from 120
0
C to 80.0
0
C as 2000 J of
heat energy are removed from the
system and 1000 J of work are done
by the gas. Find the number of
moles of the gas that are present.
17. Four moles of an ideal gas
are carried through the cycle
ABCDA of figure 17.6. If T
D
= 100
K, T
AC
= T
A
= T
C
= 200 K, T
B
= 400
K, p
A
= 0.500 × 10
5
Pa, and p
D
=
2.50 × 10
4
Pa, use the ideal gas
equation to determine the volumes
V
A
and V
B
.
*18. In problem 17 find the
work done, the heat lost or
absorbed, and the change in
internal energy of the gas for the
paths (a) AB, (b) BC, (c) CD, (d) DA,
and (e) ABCDA.
19. In a thermodynamic system,
700 J of work are done by the
system while the internal energy
drops by 450 J. Find the heat
transferred to the gas during this
process.
20. If 5.00 J of work are done by
a refrigerator and 8.00 J of heat are
exhausted into the hot reservoir,
how much heat was removed from
the cold reservoir?
21. A heat engine is operating
at 40.0% efficiency. If 3.00 J of heat
are added to the system, how much
work is the engine capable of doing?
17.5 Some Special Cases of the
First Law of Thermodynamics
22. If the temperature of 2.00
moles of an ideal gas increases by
40.0 K during an isochoric process,
how much heat was added to the
gas?
23. If 800 J of thermal energy
are removed from 8 moles of an
ideal gas during an isochoric
process, find the change in
temperature in degrees (a) Kelvin,
(b) Celsius, and (c) Fahrenheit.
24. If 3.00 J of heat are added to
a gas during an isothermal
expansion, how much work is the
system capable of doing during this
process?
25. During an isothermal
contraction, 55.0 J of work are done
on an ideal gas. How much thermal
energy was extracted from the gas
during this process?
*26. A monatomic gas expands
adiabatically to double its original
volume. What is its final pressure
in terms of its initial pressure?
*27. One mole of He gas at
atmospheric pressure is compressed
adiabatically from an initial
temperature of 20.0
0
C to a final
temperature of 100
0
C. Find the
new pressure of the gas.
28. If 50.0 J of work are done on
one mole of an ideal gas during an
adiabatic compression, what is the
temperature change of the gas?
17.6 The Gasoline Engine
*29. The crankshaft of a
gasoline engine rotates at 1200
revolutions per minute. The area of
each piston is 80.0 cm
2
and the
length of the stroke is 13.0 cm. If
the average pressure during the
power stroke is 7.01 × 10
5
Pa, find
the power developed in each
cylinder. (Hint: remember that
there is only one power stroke for
every two revolutions of the
crankshaft.)
17.7 The Ideal Heat Engine
30. An engine operates between
room temperature of 20.0
0
C and a
cold reservoir at 5.00
0
C. Find the
maximum efficiency of such an
engine.
Pearson Custom Publishing
536
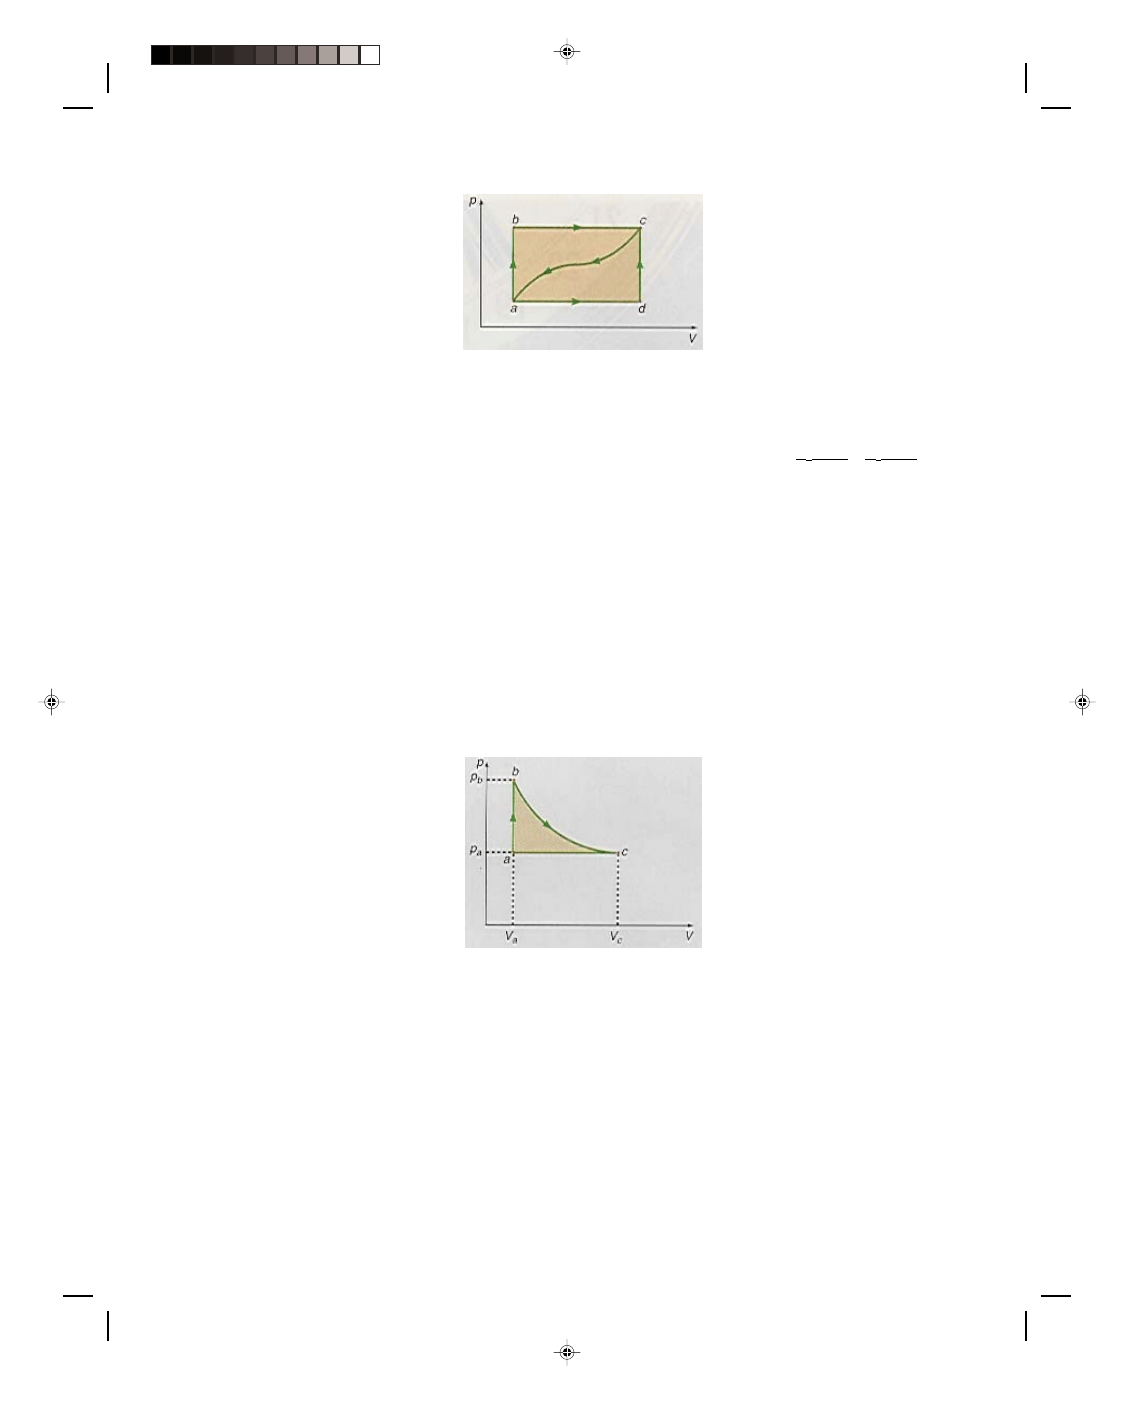
Chapter 17: Thermodynamics 17-33
31. What is the efficiency of a
Carnot engine operating between
temperatures of 300 K and 500 K?
32. A Carnot engine is working
in reverse as a refrigerator. Find
the coefficient of performance if the
engine is operating between the
temperatures
−10.5
0
C and 35.0
0
C.
33. A Carnot refrigerator
operates between
−10.0
0
C and
25.0
0
C. Find how much work must
be done per joule of heat extracted.
34. Calculate the efficiency of
an engine that absorbs 500 J of
thermal energy while it does 250 J
of work.
17.10 Entropy
35. Find the change in entropy
if 10.0 kg of ice at 0.00
0
C is
converted to water at +10.0
0
C.
36. A gas expands adiabatically
from 300 K to 350 K. Find the
change in its entropy.
*37. Find the total change in
entropy if 2.00 kg of ice at 0.00
0
C is
mixed with 25.0 kg of water at
20.0
0
C.
38. Find the change in entropy
when 2.00 kg of steam at 110
0
C is
converted to water at 90.0
0
C.
39. A gas expands isothermally
and does 500 J of work. If the
temperature of the gas is 35.0
0
C,
find its change in entropy.
Additional Problems
40. In the thermodynamic
system shown in the diagram,
(a) 50.0 J of thermal energy are
added to the system, and 20.0 J of
work are done by the system along
path abc. Find the change in
internal energy along this path.
(b) Along path adc, 10.0 J of work
are done by the system. Find the
heat absorbed or liberated from the
system along this path. (c)
The
system returns from state c to its
initial state a along path ca. If
15.0 J of work are done on the
system find the amount of heat
absorbed or liberated by the system.
Diagram for problem 40.
41. Draw the following process
on a p-V diagram. First 8.00 m
3
of
air at atmospheric pressure are
compressed isothermally to a
volume of 4.00 m
3
. The gas then
expands adiabatically to 8.00 m
3
and is then compressed isobaricly to
4.00 m
3
.
42. In the diagram shown, one
mole of an ideal gas is at
atmospheric pressure and a
temperature of 250 K at position a.
(a) Find the volume of the gas at a.
(b) The pressure of the gas is then
doubled while the volume is kept
constant. Find the temperature of
the gas at position b. (c) The gas is
then allowed to expand
isothermally to position c. Find the
volume of the gas at c.
Diagram for problem 42.
*43. Repeat problem 42, but for
part (c) let the gas expand
adiabatically to atmospheric
pressure. Find the volume of the
gas at this point. Show this point on
the diagram.
*44. It was stated in equation
17.45 that for an adiabatic process
with an ideal gas,
pV
γ
= constant
Show that when an ideal gas in an
initial state, with pressure p
1
,
volume V
1
, and temperature T
1
,
undergoes an adiabatic process to a
final state that is described by
pressure p
2
, volume V
2
, and
temperature T
2
, that
p
1
V
1
γ
= p
2
V
2
γ
and
T
1
V
1
γ − 1
= T
2
V
2
γ − 1
and
T
1
γ/(γ − 1)
= T
2
γ/(γ − 1)
p
1
p
2
45. A lecture hall at 20.0
0
C
contains 100 students whose basic
metabolism generates 4.186 × 10
5
J/hr of thermal energy. If the size of
the hall is 15.0 m by 30.0 m by 4.00
m, what is the increase in
temperature of the air in the hall at
the end of 1 hr? It is desired to use
an air conditioner to cool the room
to 20.0
0
C. If the air conditioner is
45.0% efficient, what size air
conditioner is necessary?
Interactive Tutorials
46. A thermodynamic cycle.
Three moles of an ideal gas are
carried around the thermodynamic
cycle ABCDA shown in figure 17.6.
Find the work done, the heat lost or
absorbed, and the internal energy
of the system for the
thermodynamic paths (a)
AB,
(b) BC, (c)
CD, (d)
DA, and
(e) ABCDA. The temperatures are
T
D
= 147 K, T
AC
= 250 K, and T
B
=
425 K. The pressures are p
A
= 5.53
×
10
4
Pa and p
D
= 3.25 × 10
4
Pa.
The volumes are V
A
= 0.113 m
3
and
V
B
= 0.192 m
3
. (f)
Find the
efficiency of this system.
Tutorials click on this sentence.
To go to another chapter, return to the table of contents by clicking on this sentence.
Pearson Custom Publishing
537

Pearson Custom Publishing
538
Wyszukiwarka
Podobne podstrony:
Fundamentals of College Physics Chapter 08
Fundamentals of College Physics Chapter 03
Fundamentals of College Physics Chapter 15
Fundamentals of College Physics Chapter 04
Fundamentals of College Physics Chapter 12
Fundamentals of College Physics Chapter 11
Fundamentals of College Physics Chapter 02
Fundamentals of College Physics Chapter 01
Fundamentals of College Physics Chapter 10
Fundamentals of College Physics Chapter 16
Fundamentals of College Physics Chapter 05
Fundamentals of College Physics Chapter 13
Fundamentals of College Physics Chapter 07
Fundamentals of College Physics Chapter 14
Fundamentals of Anatomy and Physiology 17 Chapter
Fundamentals of Statistics 2e Chapter08
Fundamentals of radiation dosimetry and radiological physics
Fundamentals of Anatomy and Physiology 22 Chapter
Fundamentals of Anatomy and Physiology 29 Chapter
więcej podobnych podstron