
Bull Call Spread
BACK TO BASICS: Spread Yourself Around: Example
By David Bickings, Optionetics.com
Options are a fantastic investment to make money on the rise and fall of an asset. This is
no surprise to anyone unless the first time you’ve ever heard of an option was in the preceding
sentence. There are two kinds of options: calls and puts. Calls give traders the right to buy an
asset at a specific price on or before a specific date; puts provide the right to sell an asset at a
specific price on or before a specific date. When bought as a single contract, they offer
unlimited reward with limited risk. Not bad, right? How would you like to reduce risk even
further, while still keeping your appreciation potential high? Interested? Sure you are. Options
spreads offer you a means to do just that.
Spreads composed of options with the same expiration date and different strike prices are
known as vertical spreads. There are two types of vertical spreads: debit spread and credit
spreads. Debit spreads include a bull call spread and a bear put spread—each one makes a profit
in a bullish or bearish market respectively. Credit spreads include bull put spreads and bear call
spreads. A bull call spread involves buying a lower strike call and selling a higher strike call
against it. For example, if you wanted to create a bull call spread using XYZ Company’s stock
trading at $31 per share, you could buy an XYZ March 30 call for $4.00 and sell an XYZ Mar 40
call for $2.00. Your net cost (maximum limited risk) is $2.00, or $200 per spread. This is the
absolutely the most you can lose even if XYZ falls to a penny a share. This is because that for
every dollar you make on the call you purchased, you lose a dollar on the one you sold. Your
reward potential can be calculated as the difference in strike prices minus your net debit.
Therefore your maximum reward is $800 ($10 - $2 = $8). Your reward to risk ratio is 4 to 1—
you’re risking $2 to make $8. Would you place this trade if your prospects for XYZ were good?
I certainly would! Trades like this exist every day if you’re willing to look for them and
structure them on appropriate assets. You can often find trades with reward to risk ratios of
much higher than that. I would not look at a spread with a reward to risk ratio of less than 3 to 1
unless the probability that the trade would materialize in my favor was extremely high.
In contrast, a bull put spread consists of buying a lower strike put and selling a higher
strike put against it to create a net credit—the maximum profit available on the spread. The hope
here is that the stock will continue to rise and your long put will be worth more than your short
put.
As you can see, the ability to utilize either calls or puts doubles your chances of finding a
great trade. Whether you use calls or puts, your overall outlook is bullish on the stock and I
recommend that you look at both sides before making up your mind as there can often be a big
difference between the reward to risk ratio between the calls and puts when placed as a spread.
Placing the trade is as simple as calling your broker and telling him or her that you want to place
a spread order to open a position and saying: “I want to place a spread order to open a position.
“I want to buy the XYZ March 30-40 call spread at a net debit of $2.00.” Getting out of the
trade is accomplished by calling up and telling him or her you want to close an existing position
and saying: “I want to sell the XYZ March 30-40 call spread at a net credit of $8”

The opposite side of the market is the bear side! I am an eternal optimist, so I don’t place
many bearish trades unless the prospects for the company are bleak at best. A bear put spread is
a debit spread compromised of buying a higher put and selling a lower put against it. The bear
call spread is a credit spread that consists of the purchase of a higher call and the simultaneous
sale of a lower call. Placing the order is done the same way as in the bearish examples and the
reward to risk ratio is figured the same way. The most important factor when trading spreads is
the probability that the trade will move as you expect. With a low probability, it is not even
tempting to take a trade with an extremely high reward to risk ratio. For more detailed
information about these innovative strategies, go to the Optionetics.com website and click on “
trading education.”
A great advantage to spread trading is that you can utilize LEAP options which gives you
a longer time frame in which to be right. This increases your probability that you will be
successful in the trade. Spreads cost less than the outright purchase of calls or puts and allow
you to more thoroughly diversify your holdings so that you don’t break the old rule about putting
all your eggs in one basket.
A bull call spread is a debit spread created by purchasing a lower strike call and selling a
higher strike call with the same expiration dates. This strategy is best implemented in a
moderately bullish market to provide high leverage over a limited range of stock prices. The
profit on this strategy can increase by as much as 1 point for each 1-point increase in the price of
the underlying asset. However, the total investment is usually far less than that required to
purchase the stock. The strategy has both limited profit potential and limited downside risk.
Steps to Using a Bull Call Spread
1.Look for a moderately bullish market where you anticipate a modest increase in the price of the
underlying stock-not a large move.
2.Check to see if this stock has options.
3.Review call options premiums per expiration dates and strike prices.
4.Investigate implied volatility values to see if the options are overpriced or undervalued.
5.Explore past price trends and liquidity by reviewing price and volume charts over the last year.
6.Choose a lower strike call to buy and a higher strike call to sell with the same expiration date.
7.Calculate the maximum potential profit by multiplying the value per point by the difference in
strike prices and subtracting the net debit paid.
8.Calculate the maximum potential risk by figuring out the net debit of the two option premiums.
9.Calculate the breakeven by adding the lower strike price to the net debit.
10.Create a risk profile for the trade to graphically determine the trade's feasibility.
11.Write down the trade in your trader's journal before placing the trade with your broker to
minimize mistakes made in placing the order and to keep a record of the trade.
12.Contact your broker to buy and sell the chosen call options.
13.Watch the market closely as it fluctuates. The profit on this strategy is limited-a loss occurs if
the underlying stock closes at or below the breakeven point.
14.To exit the trade, you need to sell the lower strike call and buy the higher strike call or simply
let the options expire. The maximum profit occurs when the underlying stock rises above the
short call strike price. If and when the short call is exercised by the assigned option holder, you
can exercise the long call and deliver those shares to the option holder at the lower long call
price, pocketing the difference plus the premium from the short call.

OPTIONETICS
1301 Shoreway Rd. Suite 125, Belmont, CA 94002
Tel: (888) 366-8264 / Fax: (650) 802-0900
www.optionetics.com
Picking the Right Strategy
Often the biggest problem newcomers to options trading face is choosing which strategy
is the most appropriate to use under a given set of market conditions. It’s easy picking a stock
strategy; you either buy or you sell. Stock prices are not affected by time and volatility. Since
options have multidimensional attributes, the trader is faced with the same choice of buy or sell,
but also needs to determine such things as volatility, time and delta. It seems that ever since we
started trading sideways, everyone has picked “the bottom,” and are therefore attempting to trade
bullish positions. This isn’t necessarily a bad thing; however, the rationale is disturbingly
biased, particularly from the media heads.
One of the most important things a trader can do is forget about what the market might do
and determine what it is doing. Then set up a play that will pose limited risk should you be
wrong.
So aside from experience, how do you determine what the market is telling you and how
do you know what strategies to use? In order to avoid the risk of turning this into a discussion on
technical analysis, I will only mention that there are plenty of technical and fundamental
indicators that you can use to determine the trend. After you have determined the trend, you
need to get some idea of the volatility of the market and the underlying stock you are going to
trade. (Though you can get this from other sources, I must shamelessly plug our Platinum site as
my personal favorite source for this data.) From there, you can determine what is the most
appropriate strategy that has the highest probability of becoming profitable.
Of course, in order to keep from inundating yourself from information overload, it’s best
to keep your strategies for each scenario to a minimum. As you progress as a trader, experiment
with variations of the strategies, or new ones to accommodate your evolving personality. For
example, in a bullish market with low volatility—although you can choose from a number of
strategies—it might be best to practice with just bull call spreads until they become so boring
that you’re making too much money (ha, never!). Then maybe start to experiment with ratio
back spreads.
The following chart illustrates that indeed you can make money in any market. I’ve put
together a matrix of one example of a strategy I would be using under each of the various market
conditions. I suggest you do the same with the strategies you currently know and understand. If
you come to an empty cell that you cannot think of a strategy for, that’s what you need to
research. Keep the matrix at your side until you can trade your strategies cold. Keeping with the

OPTIONETICS
1301 Shoreway Rd. Suite 125, Belmont, CA 94002
Tel: (888) 366-8264 / Fax: (650) 802-0900
www.optionetics.com
Optionetics methodology, all of the following are spreads of some kind. As the saying goes,
better spread than dead!
High IV
Neutral
Low IV
Very Bullish
ITM Bull Put (credit)
OTM Bull Call (debit)
Call Ratio Backspread
Bullish
OTM/.ATM Bull Put (credit) OTM Call Calendar
ATM Bull Call (debit)
Neutral
ATM Calendar Spread
Iron Butterfly
Straddle
Bearish
OTM/ATM Bear Call (credit)
OTM Put Calendar
ATM Bear Put (debit)
Very Bearish
ITM Bear Call (credit)
OTM Bear Put (debit)
Put Ratio Backspread
You probably noticed that in more than half of the above strategies, I’ve entered whether
the play should be out-of-the- money [OTM], at-the-money [ATM] or in-the- money [ITM].
Although these choices are only my opinion, the point is that I have determined what I believe to
be strategies that take advantage of higher leverage with an appropriate balance of risk/reward.
Speaking of risk/reward, when you’ve determined the market and the strategy you wish
to seek out, the next thing you want to determine is how much risk you would like to take on for
each play. As an example, I won’t put on a credit spread for any less than $1 for every $5
difference between strikes. On debit spreads, I won’t even look at them unless the minimum
reward potential is 200% return. That’s not to say that I have to make 200%; just that on a 10
point spread, I only have to put up a maximum of $3.30 to make the $6.70. This is the same for
all other spreads. You should decide for yourself how much you are willing to risk for every
debit spread, calendar spread, etc.
Everything in trading should be calculated, and nothing should be spontaneous.
Unfortunately, for the speed traders, boring makes money. The only truly successful traders I’ve
ever known actually research the market and their trades prior to putting them on. Gone are the
days where we can blindfold ourselves and throw darts at the Wall Street Journal.
Until next time, happy trading…
Michael Bennett
Staff Writer
Optionetics.com

A
adjustment The process of buying or
selling instruments to bring your position
delta back to zero.
at-the-money An option that has a strike
price equal to the underlying market price.
C
callAn option contract giving the holder
the right, but not the obligation, to buy a
specified amount of an underlying security
at a specified price within a specified time.
D
delta The change of the price of an option
relative to the change of the physical
underlying.
delta neutral Any position in which the
total deltas of the position add up to zero.
E
exercise The process by which the holder
of an option notifies the seller of their
intention to take delivery or make delivery
of the underlying instrument at the
specified exercise price.
exercise price The price at which the
underlying will be delivered in the event
that the option is exercised.
expiration The date and time after which
an option may no longer be exercised.
extrinsic value The price of an option
less its intrinsic value. An out-of-the money
option’s worth consists of nothing but
extrinsic or time value.
F
fair value The theoretical value of what
the option should be worth.
fixed delta A delta figure that does not
change with the change in the underlying.
front month Usually the option with the
shortest time to expiration or the future
with the nearest time to delivery.
futures contract A contract between
buyer and seller whereby the buyer is
obligated to take delivery and the seller is
obligated to make delivery of a fixed
amount of a commodity at a predetermined
price at a specified future date.
Glossary at a Glance
G
gamma The change of an option’s delta
relative to the change in the price of the
underlying instrument.
go long To buy securities, options or
futures with the intent to profit from a rise
in the price of the asset.
go short To sell securities, options or
futures with the intent to profit from a drop
in the price of the asset.
H
hedge To create a trade which lowers the
risk of an outright directional move (i.e. to
go long one security, short another secu-
rity).
I
Illiquid market A market which has no
volume that subsequently creates a lot of
slippage due to lack of trading volume.
immediate/cancel An order which must
be filled immediately or canceled.
index An index (or indices) is a group of
stocks which make up a portfolio in which
performance can be monitored based upon
one mathematical calculation.
in-the-money An option which could be
exercised and immediately closed out
against the contract for a cash credit. A call
is in-the-money if its exercise price is
lower than the current market price of the
underlying instrument. A put is in-the-
money if the exercise price is higher than
the current market price of the underlying
instrument.
intrinsic value The real value of an
option. This is determined by calculating
the difference between the price of the
underlying asset and the in-the-money
option’s strike price.
L
leverage The amount of volume that
enables a trader to buy or sell a security or
derivative and receive fair value for it.
limit move The maximum daily price
limit for an exchange traded contract.
limit order An order which must be filled
at a specific price or better.
liquidity The amount of volume in a
futures or options contract.
locked market A market where trading
has been halted because prices have
reached their daily trading limit.
long A position resulting from the
purchase of an underlying stock, option,
commodity or futures contract.
low (lo) The low price of a security or
derivative for a certain time frame.
low risk investing A trade which is
hedged for purposes of limiting price loss
as opposed to a directional trade where loss
is unlimited.
M
margin A deposit made by a trader with a
clearinghouse to ensure that he/she will
fulfill any financial obligations resulting
from his or her trades.
margin call The need for additional
money to be deposited into an account to
maintain a trade.
mark-to-market At the end of each
trading day (and all following days a
position remains open), the contract value
is credited or debited based on that specific
trading day’s session. In this way, losses
are never allowed to accumulate.
market maker An independent trader or
trading firm that is prepared to buy and sell
shares or contracts in a designated market.
Market makers on stock or stock option
exchanges perform functions similar to
locals on the exchanges. The difference
with market makers is that they must make
a two-sided market (bid and ask).
market on close An order that is filled as
a market order on the close of the trading
session.
market order An order that is filled at the
current market price.
momentum When a market continues in
a certain direction for a specific time frame.
momentum trading Investing with (or
against) the momentum of the market in
hopes of profiting from it.
moving average The average of a number
of time frames to smooth out a direction of
the market.
Continued on back
1-888-366-8264 • optionetics.com • E-mail: seminars@optionetics.com • ©Optionetics Copyright 2001

N
naked option An option written (sold)
without an underlying hedge position.
net change The daily change from time
frame to time frame. An example would be
the change from the close of yesterday to
the close of today.
O
offer down The change of the offer of the
market related to a downward price
movement at that specific time.
option A security that represents the right,
but not the obligation, to buy or sell a
specified amount of an underlying security
at a specified price within a specified time.
order A ticket or voucher to buy or sell
securities.
opportunity cost The cost of using your
capital for one investment versus another.
For example, if you have $10,000 in one
investment, this is $10,000 that cannot be
used elsewhere.
option premium The price of an option.
P
put An option contract giving the holder
the right, but not the obligation, to sell a
specified amount of an underlying security
at a specified price within a specified time.
R
risk graph A graphical representation of
risk and reward on a given trade as prices
change.
risk manager A person who manages risk
of trades in a portfolio by hedging their
trades.
risk profile A determination of risk on a
trade. This would include the profit and
loss of a trade at any given point for any
given time frame.
roundturn A fee or commission cost
charged by a brokerage to cover the trades
made to open and close each position.
Usually paid upon exiting the trade.
running stops Something which when
quoted, floor traders use to move the
market. When stops are bunched together,
traders may move the market in order to
activate stop orders and propel the market
further.
S
series All options of the same class with
the same exercise price and the same
expiration date.
short A position resulting from the sale of
a stock, option or contract. Note that a short
put position is a long market position.
short premium Expectation that a move
of the underlying in either direction will
result in a theoretical decrease of the value
of an option.
spread An order to simultaneously buy
and sell at least two different contracts at a
quoted differential. A long market position
is usually offset by a short market position,
but not always, with contracts in the same
underlying.
T
technical analysis The study of price
action based on mathematical formulas
(i.e. moving averages, stochastics and
relative strength index).
technical indicator A bullish or bearish
numerical indicator used to help predict
future price movement.
theoretical value An option value
generated by a mathematical option’s
pricing model to determine what an option
is really worth.
theta The change of the option’s value
relative to change in time.
ticket An order form for a security or
derivative for a certain time frame.
time decay The amount of time premium
movement within a certain time frame on
an option due to the passage of time in
relation to the expiration of the option
itself.
time premium Another name for extrinsic
value. The additional value of an option
due to the volatility of the market and the
time remaining until expiration. Premium
minus intrinsic value.
time spread A spread consisting of one
long and one short option of the same type
with the same exercise price but which
expire in different months (i.e. sell the
nearby month, buy the far away month).
Margin may be required.
time value Another name for extrinsic
value. This important factor helps to
determine how much an option is worth.
trading account An account opened with
a brokerage firm from which to place
trades. Opening an account takes several
steps including signing a risk disclosure
statement (a document which indicates that
the signer understands the risks involved
in trading), performance bond agreement
(binds the trader to pay for any losses
incurred in the course of trading), and a
futures account agreement (outlines how
the account is to be handled by the broker).
U
upside The potential for prices to move
up. Also the potential risk taken on a
directional trade.
underlying asset The stock, commodity,
futures contract or cash index to be
delivered in the event an option is exer-
cised.
V
variable delta A delta that can change due
to the change of an underlying asset or a
change in time expiration of an option.
vega The speed of the options price
relative to the change in the underlying.
This is also referred to as the volatility of
the market.
volatility Measure of the magnitude of
price or yield changes over a predefined
period of time. Volatility is used as a
primary determinant in the valuation of
options models.
volume (vol) The total volume for a
security or derivative in a certain time
frame.
Y
yield The return on an investment in a
given period of time.
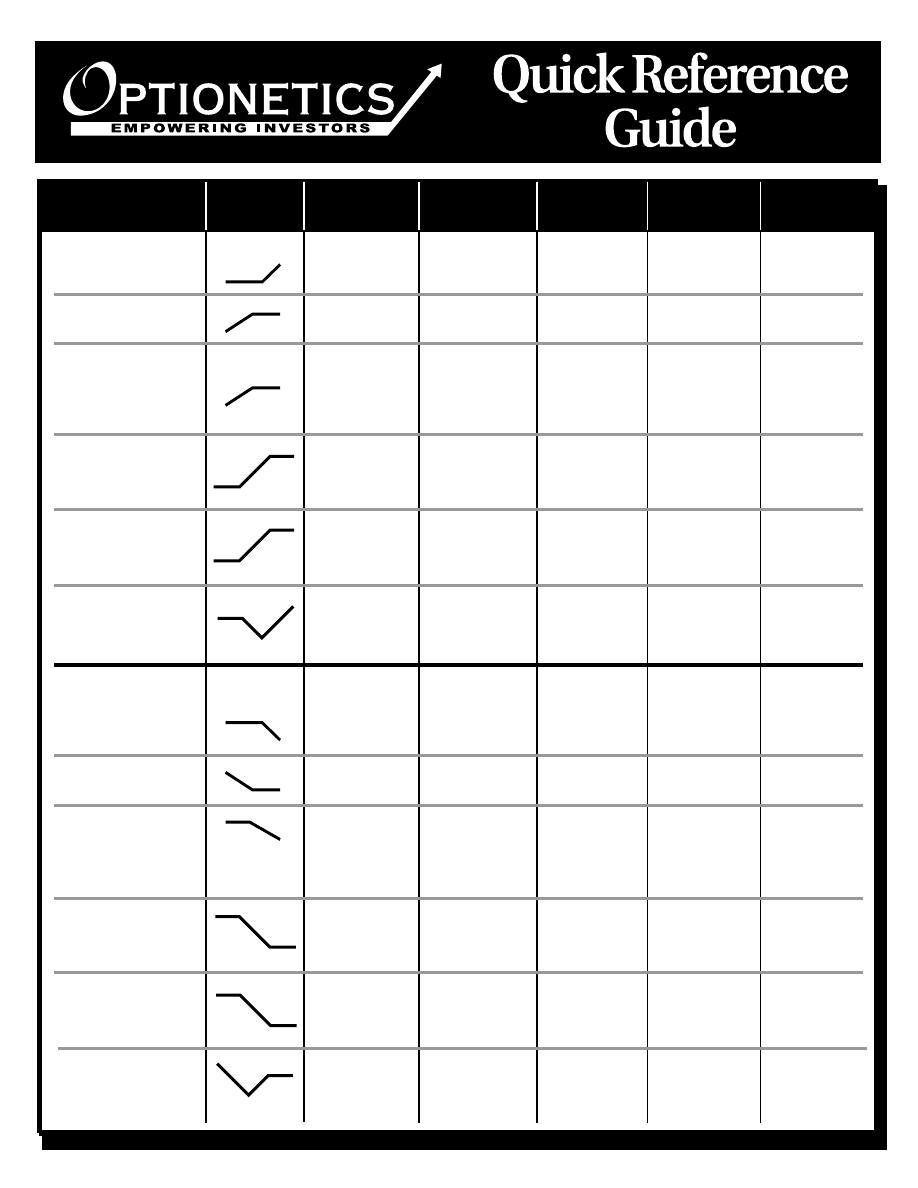
STRATEGY
MARKET
OUTLOOK
PROFIT
POTENTIAL
RISK
PROFILE
STRATEGY
RISK
POTENTIAL
TIME DECAY
EFFECT
BULLISH
Long Call
B1-C
Bullish
Unlimited
Limited
Detrimental
Short Put*
S1-P
Bullish
Limited
Unlimited
Helpful
Covered Call*
B1-U
Slightly
Limited
Unlimited
Helpful
S1-C
Bullish
to Neutral
Bull Call Spread
B1-LC
Bullish
Limited
Limited
Mixed
S1-HC
Bull Put Spread
B1-LP
Moderately
Limited
Limited
Mixed
S1-HP
Bullish
Call Ratio
S1-LC
Very Bullish
Unlimited
Limited
Mixed
Backspread
B2-HC
BEARISH
Short Call*
S1-C
Bearish
Limited
Unlimited
Helpful
Long Put
B1-P
Bearish
Unlimited
Limited
Detrimental
Covered Put*
B1-U
Slightly
Limited
Unlimited
Helpful
S1-P
Bearish
to Neutral
Bear Call Spread
S1-LC
Moderately
Limited
Limited
Mixed
B1-HC
Bearish
Bear Put Spread
B1-HP
Bearish
Limited
Limited
Mixed
S1-LP
Put Ratio
S1-HP
Very Bearish
Unlimited
Limited
Mixed
Backspread
B2-LP
©
Copyright Optionetics.com 2001.
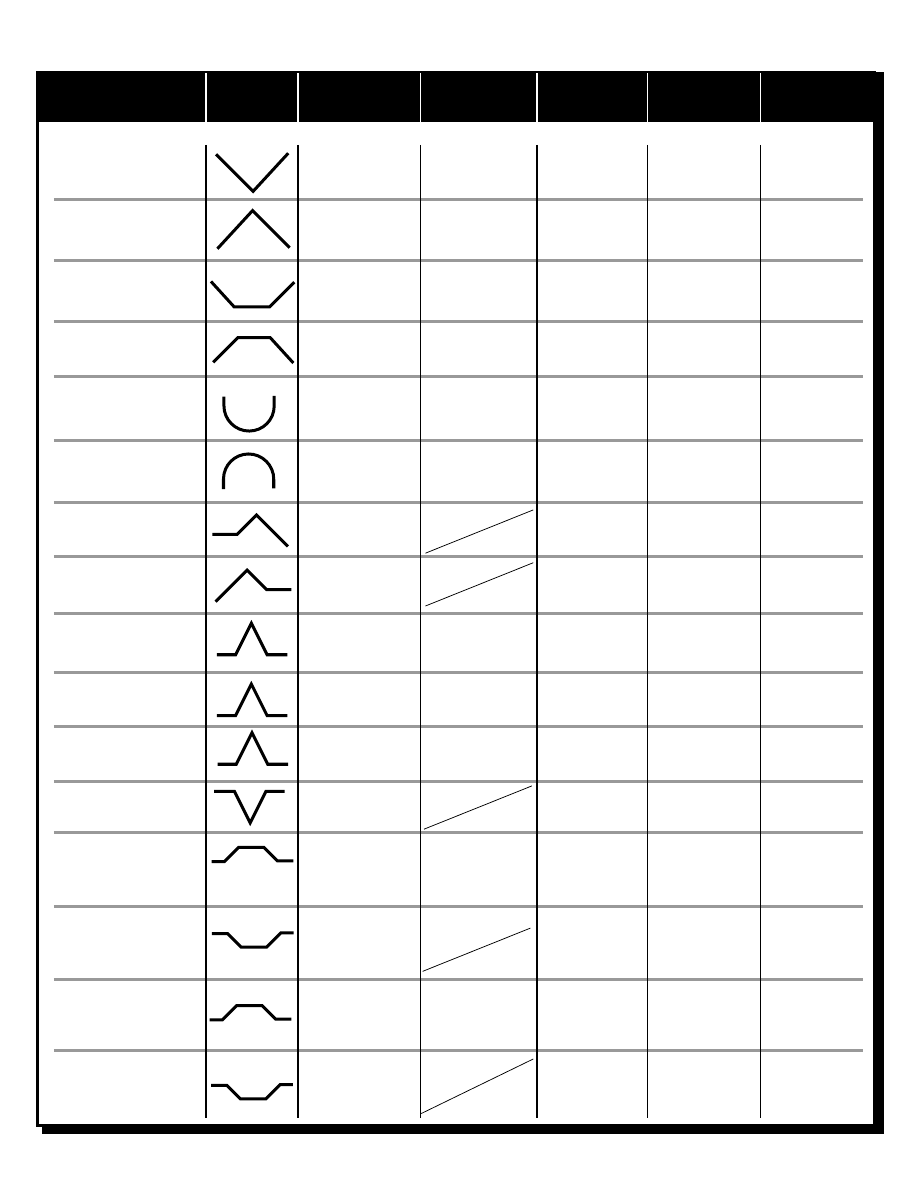
STRATEGY
MARKET
OUTLOOK
PROFIT
POTENTIAL
RISK
PROFILE
STRATEGY
RISK
POTENTIAL
TIME DECAY
EFFECT
Long Straddle
B1-ATM-C
Volatile
Unlimited
Limited
Detrimental
B1-ATM-P
Short Straddle*
S1-ATM-C
Stable
Limited
Unlimited
Helpful
S1-ATM-P
Long Strangle
B1-OTM-C
Volatile
Unlimited
Limited
Detrimental
B1-OTM-P
Short Strangle*
S1-OTM-C
Stable
Limited
Unlimited
Helpful
S1-OTM-P
Long Synthetic
Volatile
Unlimited
Limited
Detrimental
Straddle
Short Synthetic
Volatile
Limited
Unlimited
Helpful
Straddle*
Call Ratio
B1-LC
Bearish
Limited
Unlimited
Mixed
Spread*
S2-HC
Stable
Put Ratio
B1-HP
Bullish
Limited
Unlimited
Mixed
Spread*
S2-LP
Stable
Call Calendar
B1-LTC
Stable
Limited
Limited
Helpful
Spread
S1-STC
Put Calendar
B1-LTP
Stable
Limited
Limited
Helpful
Spread
S1-STP
Long Butterfly
Stable
Limited
Limited
Helpful
B1-U/B2-ATM-P
OR
S1-U/B2-ATM-C
B1-U/S2-ATM-C
OR
S1-U/S2-ATM-P
B1-LC, S2-HC B1-HC
OR
B1-LP S2-HP B1-HP
Short Butterfly
Bullish
Limited
Limited
Detrimental
Bearish
Long Condor
Stable
Limited
Limited
Helpful
Short Condor
Bullish
Limited
Limited
Detrimental
Bearish
Long Iron
Stable
Limited
Limited
Helpful
Butterfly
Short Iron
Bullish
Limited
Limited
Detrimental
Butterfly
Bearish
S1-LC, B2-HC S1-HC
OR
S1-HP B2-HP S1-HP
B1-LC S1-HC
S1-HC B1-HC OR
B1-LP S1-HP
S1-HP B1-HP
S1-ATM-C
B1-OTM-C
S1-ATM-P
B1-OTM-P
B1-ATM-C
S1-OTM-C
B1-ATM-P
S1-OTM-P
S1-LC B1-HC
B1-HC S1-HC OR
S1-LP B1-HP
B1-HP S1-HP
* Not recommended optionetics strategy, unlimited risk.
1-888-366-8264
Optionetics Quick Reference Guide
Optionetics Quick Reference Guide
NON DIRECTIONAL
Trading involves risk, this flyer is supplied for educational purposes and not as investment advice.
There is no guarantee of future performance and individual results will vary.
Wyszukiwarka
Podobne podstrony:
Goal Realization Made Easy
Obedience Training Made Easy
linux administration made easy Nieznany
vocabulary improvement words made easy
Gann Made Easy by Bill McLaren
Herbert M Shelton Food Combining Made Easy (Fragment)
Freestyle Made Easy A User’s Manual
Wayne Ross Dating Beautiful Women Made Easy (website)
John J Murphy Charting Made Easy
Human Biology Mental Health Psychology Made Easy The 100 Simple Secrets Of Happy People
Dating Made Easy
McLaren, William Gann Made Easy
FCE Key Word Transformation Made Easy
Recipes Bartending Made Easy
FCE KEY WORD TRANSFORMATION MADE EASY
(1892) Dress fitting made easy Barnes, A , L
charting made easy john murphy 1
więcej podobnych podstron