
3 SWING TRADING EXAMPLES, WITH CHARTS,
INSTRUCTIONS, AND DEFINITIONS TO GET YOU STARTED
By Alan Farley
The following examples cover common areas of swing trading that will provide insight into the
mechanics of the swing trade. Following the three examples, I provide a glossary of terms that are
essential to understanding the basics of swing trading. I hope the combination will set you on
your way to success.
Amazon.com (AMZN:Nasdaq) [dated 11/20/01]
Net stocks aren't flying very high anymore, but they're still setting up nice swing trades. After
getting pummeled for months, many of these stocks are bouncing off multiyear lows. Driven by
optimism that things can't get any worse, market players have finally reawakened the Net rally.
But pick your trades wisely. With few exceptions, Net stocks face an extraordinary burden of
overhead supply. Vast legions of investors and institutions are still holding these stocks from
much higher prices. They will sell out their diminished portfolios for years to come.
Many of these stocks are now trading in the single digits – a situation that demands careful
evaluation of position size and risk tolerance. The good news is the massive liquidity and small
spreads of the sector's largest stocks. These high-float issues can trade all day with a single penny
marking the difference between the buying and selling price. This small transaction cost has
another advantage. We can safely juggle in and out of a position several times to catch the best
entry price.
Most Net rallies are only bear-market bounces. This fact raises the odds that resistance at stocks'
200-day moving averages will extinguish their progress. In fact, the king of the jungle we'll look
at today should encounter that gorilla very soon.
So play the Net rallies and enjoy the good old days. But keep those stops tight and take what the
market gives you. Fortunately, that could be double -digit gains at these discount prices.
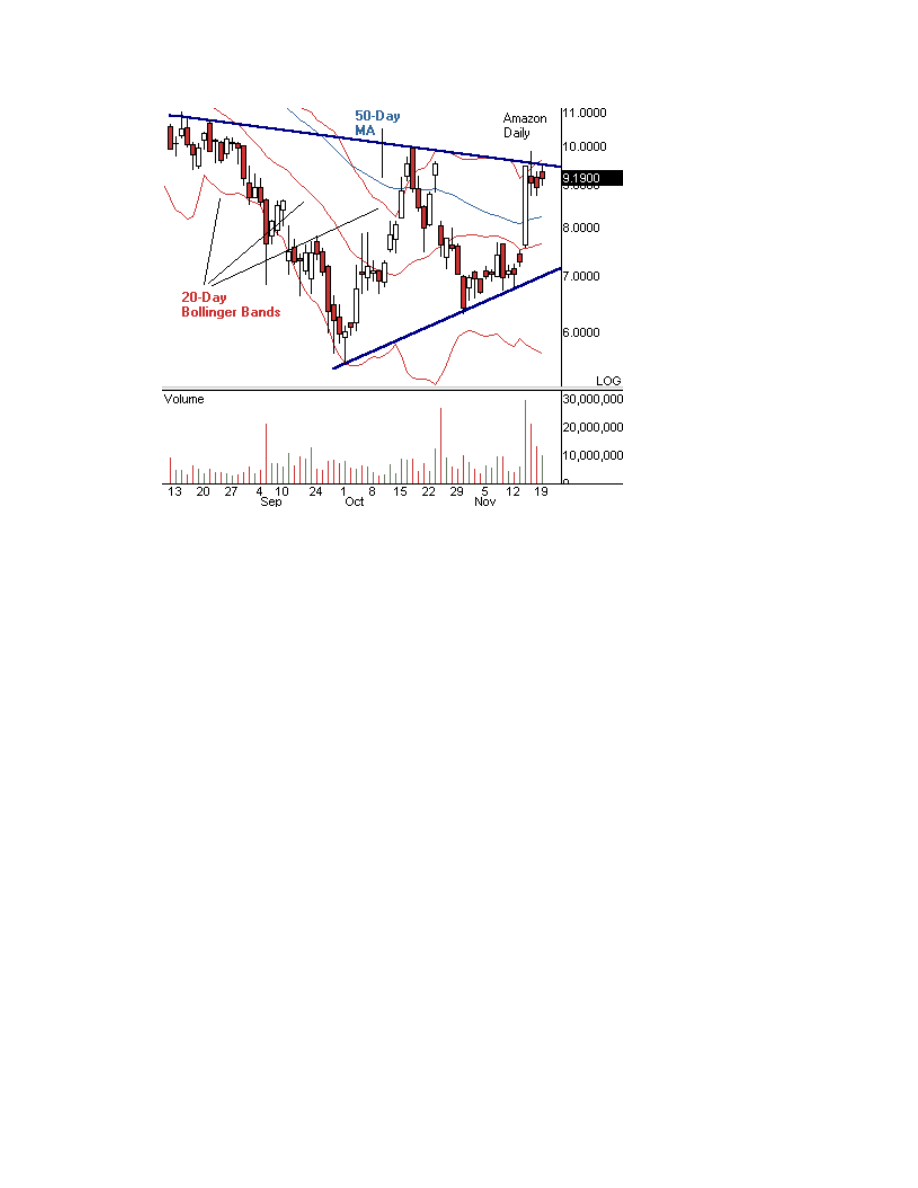
Amazon.com (AMZN:Nasdaq) got crushed when the bubble burst, losing over 90% of its value.
But times may be changing for the online retailer. The last few weeks finally delivered some
good news and the stock rallied about 50% off its October low. It now sits just under $10. Not a
huge ramp for the former giant, but accumulation suggests a bottom may near. Notice the big
move on Nov. 14. It drove Amazon above its 50-day moving average, right into a test of the last
high.
While volume shows investor interest, Amazon could be headed into a broader basing pattern
instead of a breakout. Notice the lines drawn across recent highs and lows. They take on the
appearance of a partially developed symmetrical triangle. A stock needs to eject quickly out of a
box like this, or it can easily drop all the way back to the lower trend line.
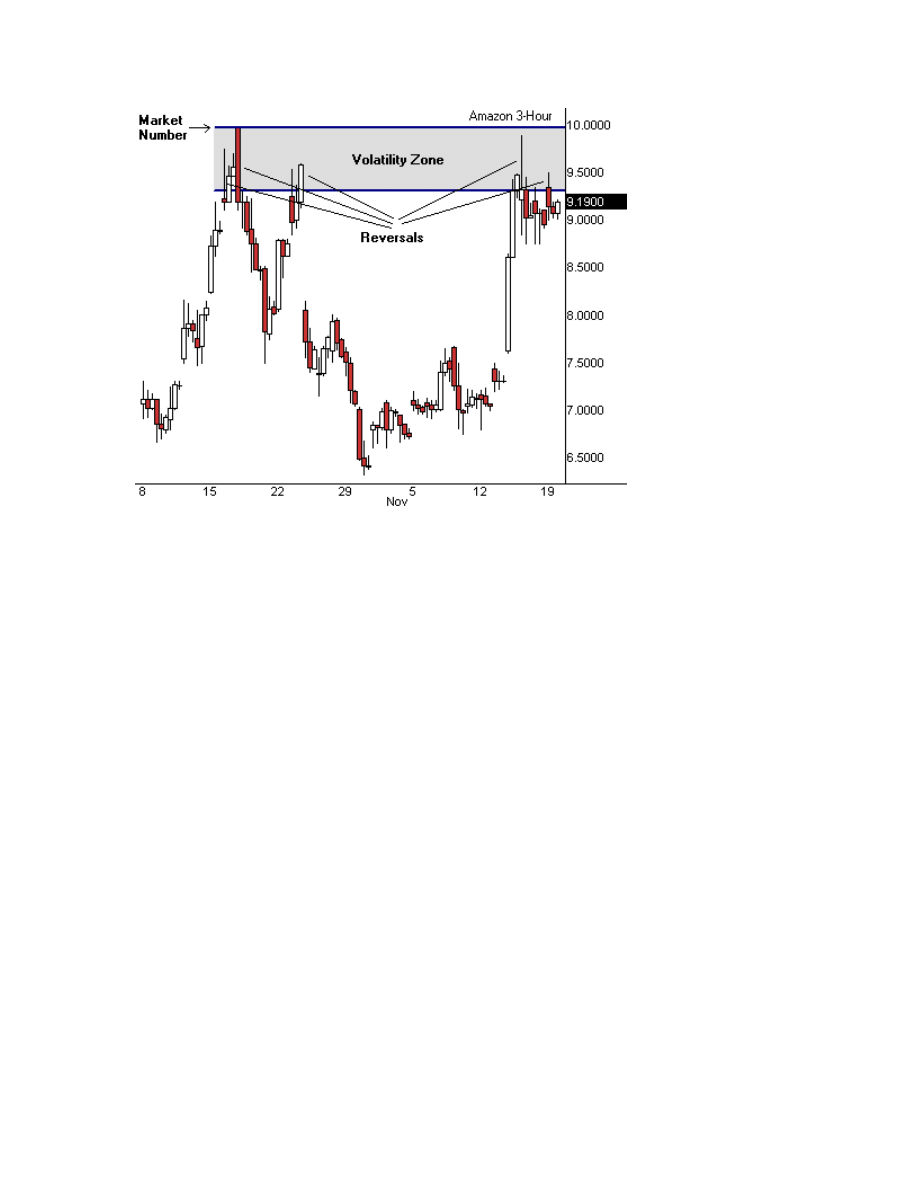
The volatility zone between $9.50 and $10 raises another caution flag. As you can see, sharp
reversals characterize these price levels. Why does this happen? Certain chart points hide
significant numbers of traders and investors sitting in losing positions, because they bought into
sudden reversals. This volatility needs to be unwound before price can move past it.
The key to this trade is the market number $10. If Amazon can mount it, it will complete two
bullish patterns and draw in new buyers. First, it would trigger a cup-and-handle breakout on the
shorter-term chart. More importantly, it would confirm a well-formed double bottom on the daily
chart.
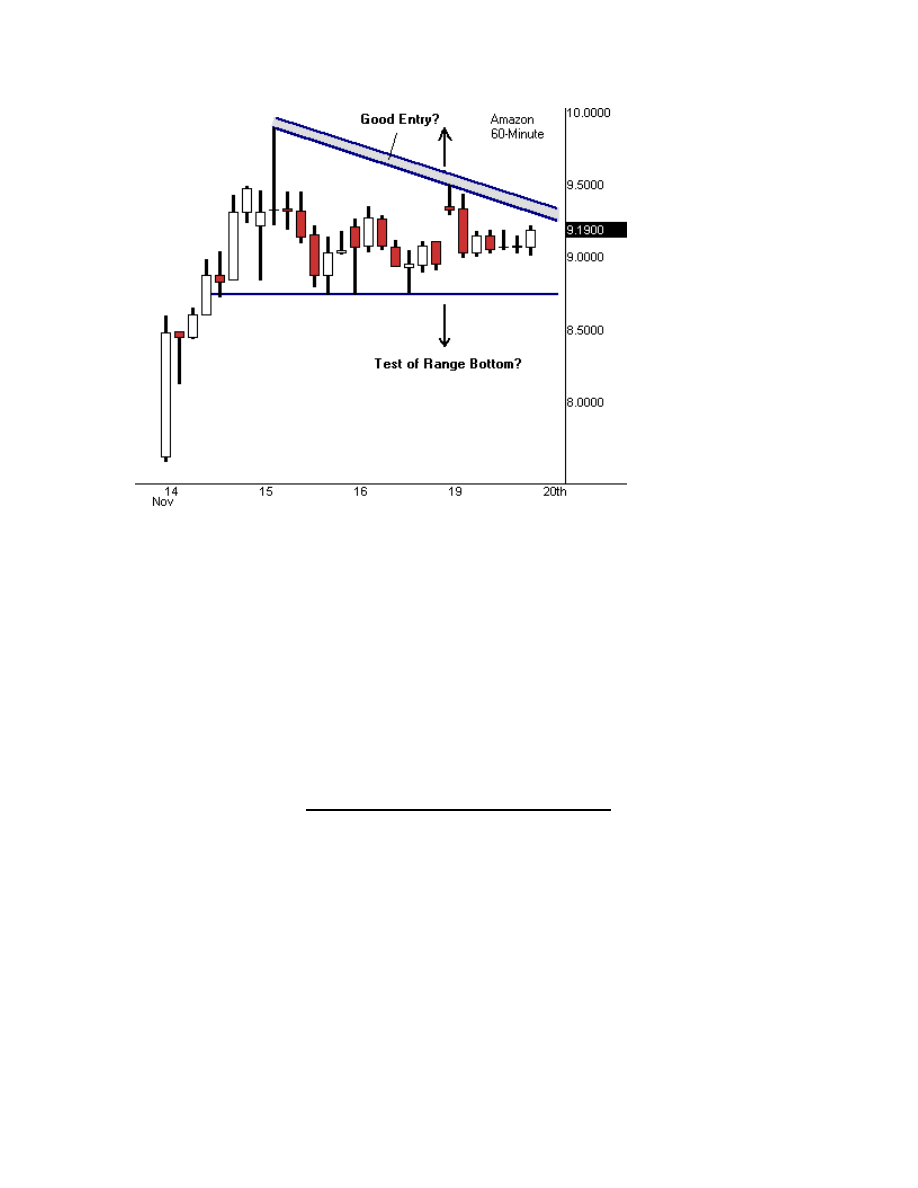
The best trading plan might be to go long before the breakout. Consider a position using the
intraday pattern, but be prepared to exit quickly if larger forces intercede. For example, a break
above the small triangle could offer the perfect entry for a larger price move. But avoid any
position near the bottom of this pattern. It has the look of a bearish descending triangle. We could
see a decent selloff if that lower line breaks.
Concentrate on good trade management if you work this position into a profit. As I mentioned
above, strong resistance will stall most bear-market rallies at the 200-day moving average. This
formidable barrier is sitting near $12 on Amazon's daily chart. The hot spot also crosses the major
down trend line for the entire postbubble collapse. We should take our profits if and when price
approaches this danger zone.
Nvidia (NVDA:Nasdaq) [dated 12/04/01]
Computer gaming has traveled light years since Pong was first released in the 1970s. Fortune 500
companies now cater to a game habit measured in the billions of dollars. In fact, 2001 industry
revenue will rival worldwide movie and DVD sales. This time-wasting endeavor has moved well
beyond its core teenage audience into a variety of demographics.
The game sector also represents an endangered species for traders: a technology bull market.
Enthusiastic buyers are loading up on a new generation of boards, boxes and game titles. Equities
keep running to catch up with this strong demand, and most stocks sit very close to multiyear
highs.
You can attempt to profit with trade setups in the gaming sector. But forget about direct plays on
the boxmakers themselves. Microsoft (MSFT:Nasdaq) (Xbox) and Sony (SNE:NYSE ADR)
(PlayStation 2) have core interests unaffected by industry sales. Japanese giant Nintendo
(GameCube) has no ADR (American Depository Receipt) trading on the American markets.
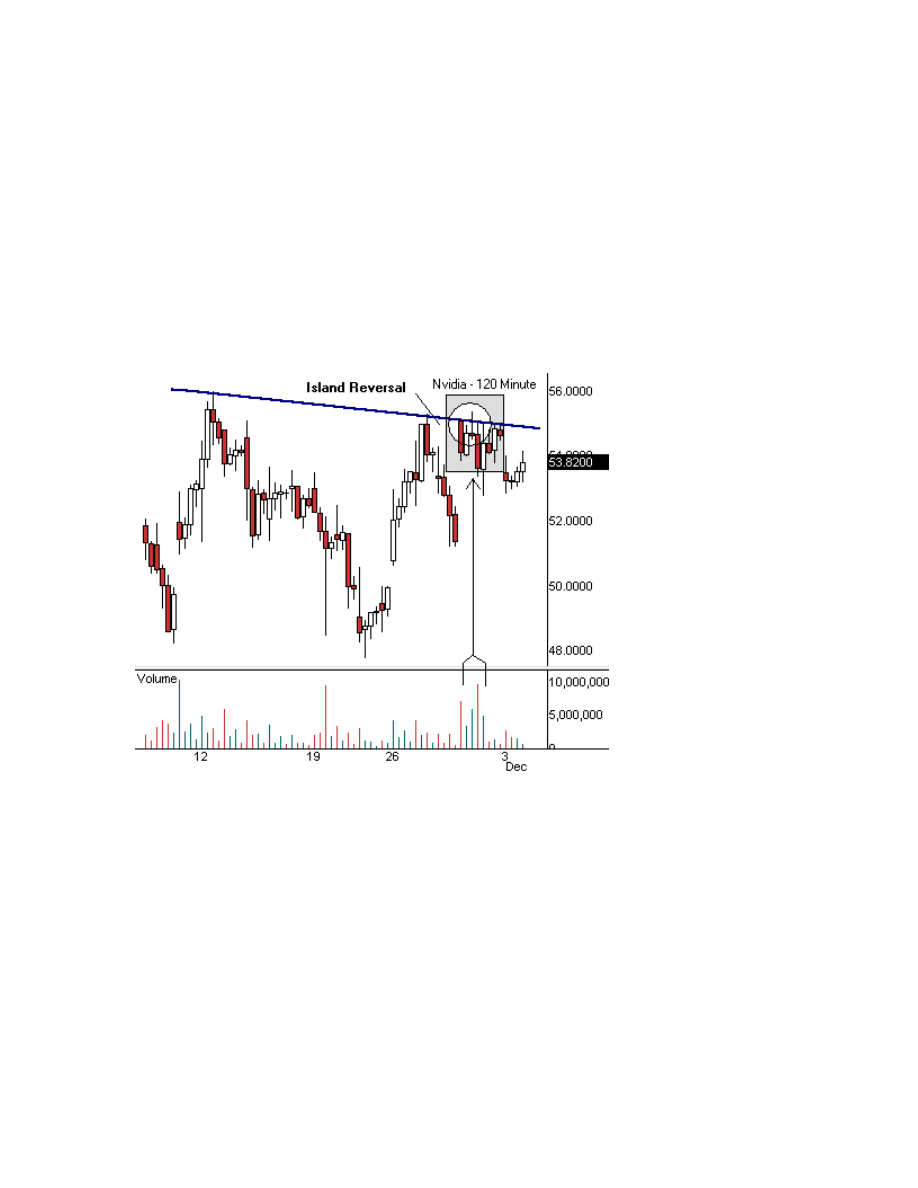
Nvidia, a boardmaker, is another story, however. Nvidia rose from mediocrity to become the
powerhouse in 3-D chips, boards and technology. The Nvidia chipset in Microsoft's Xbox ensures
its industry leadership for years to come. Nvidia has been pushing through a series of all-time
highs throughout its relationship with Microsoft. But it has never generated very strong
momentum after each high and has fallen back over and over again to retest lower ground.
What will it take for Nvidia to finally break out of the top of its rising trend line? The volume
spike on Nov. 29 might offer a clue. It conceals a false breakout that caught many longs in a bull
trap. Until Nvidia can absorb overhead supply created by this ugly reversal, it will be difficult for
any rally to generate momentum.
Nvidia sits at a price pivot where it could start another run at the short-term high. Or it could just
roll over here and retest the $40s. The small Island Reversal formed last week might speed up
events. Many traders probably noticed it and entered new short sales. The stock will need to fill
the gap and trade above $54 in a hurry, or the shorts (plus overhead supply) could kick in with a
vengeance.
Alkermes (ALKS:Nasdaq)
[dated 11/29/01]
At a training session a while ago I asked the crowd about their trading habits. Specifically, I
wanted to know how often they sold short. To my amazement, less than 25% said they ever had.
This was not a group of typical buy-and-hold investors. These were hard-core traders. But even
with all that experience, many avoided the art of short-selling.
Obscure market rules and Wall Street happy talk discouraged short-selling for years.
Furthermore, the upside-down logic required to sell short was too mysterious for many retail
traders.
Times have changed with the advent of online trading and instant execution. Filling a short sale is
now just as easy as buying a stock. Gone are the days when you had to plead with your broker to
release shares from inventory so you could borrow them. And the SEC is finally giving serious
thought to abolishing the uptick rule.
Here are three quick tips to improve your odds when selling short: First, never chase a selloff.
The best short sales come at the end of weak rallies. Second, sell short in less volatile markets.
Tech stocks carry high short interest (outstanding short sales) and are vulnerable to nasty
squeezes. Finally, take a short position in a well-established downtrend, rather than trying to pick
a top in a rally.
Timing a short sale requires more precision than buying a stock for a trade. True believers,
contrarian traders and old-fashioned bad luck hold up crappy stocks that should break down. Help
your cause by locating bearish patterns on both the daily and 60-minute charts. But even then,
keep stops tight and don't hesitate to jump ship if the short trade doesn't move quickly in your
favor.
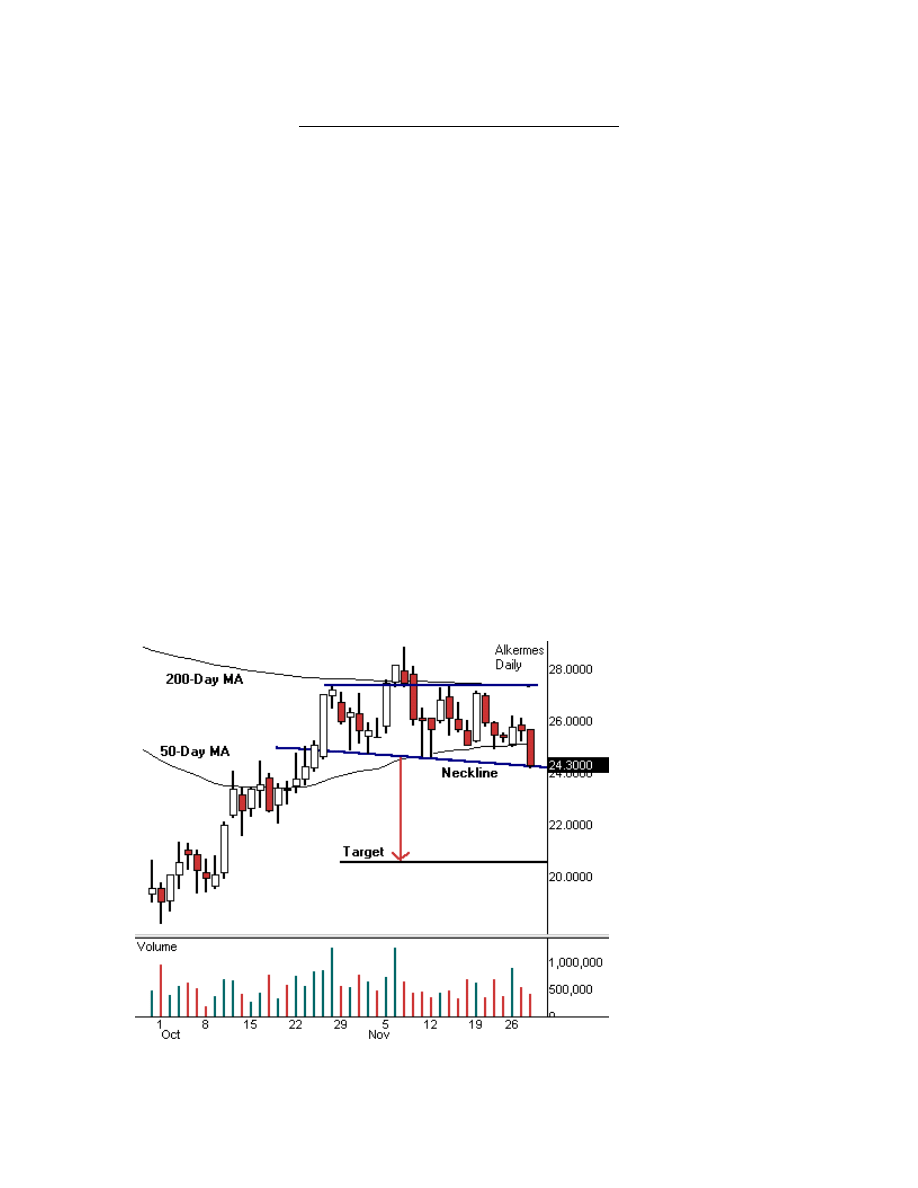
Swing traders should recognize Alkermes' (ALKS:Nasdaq) setup from their favorite technical
analysis books. It's a classic head-and-shoulders pattern, and it fits all the rules. It has well-
formed left and right shoulders at the same height. The neckline descends modestly in a straight
line. And each rally shows less commitment by the longs. So the stock appears to be a prime
target for short-sellers.
In a classic head-and-shoulders setup, we expect a stock to break the neckline and fall a distance
equal to the height of the head (middle high). This targets a decline to around $20 for Alkermes.
But we have no guarantee the target will be reached, so the setup works best with a trailing stop
loss. This way we can grab a profit, but reduce damage from an unexpected short squeeze.
The Alkermes chart looks bearish for other reasons as well. The November high failed at the 200-
day moving average. And the selloff on the last bar failed the 50-day moving average. So when
do we jump in with our short sale?
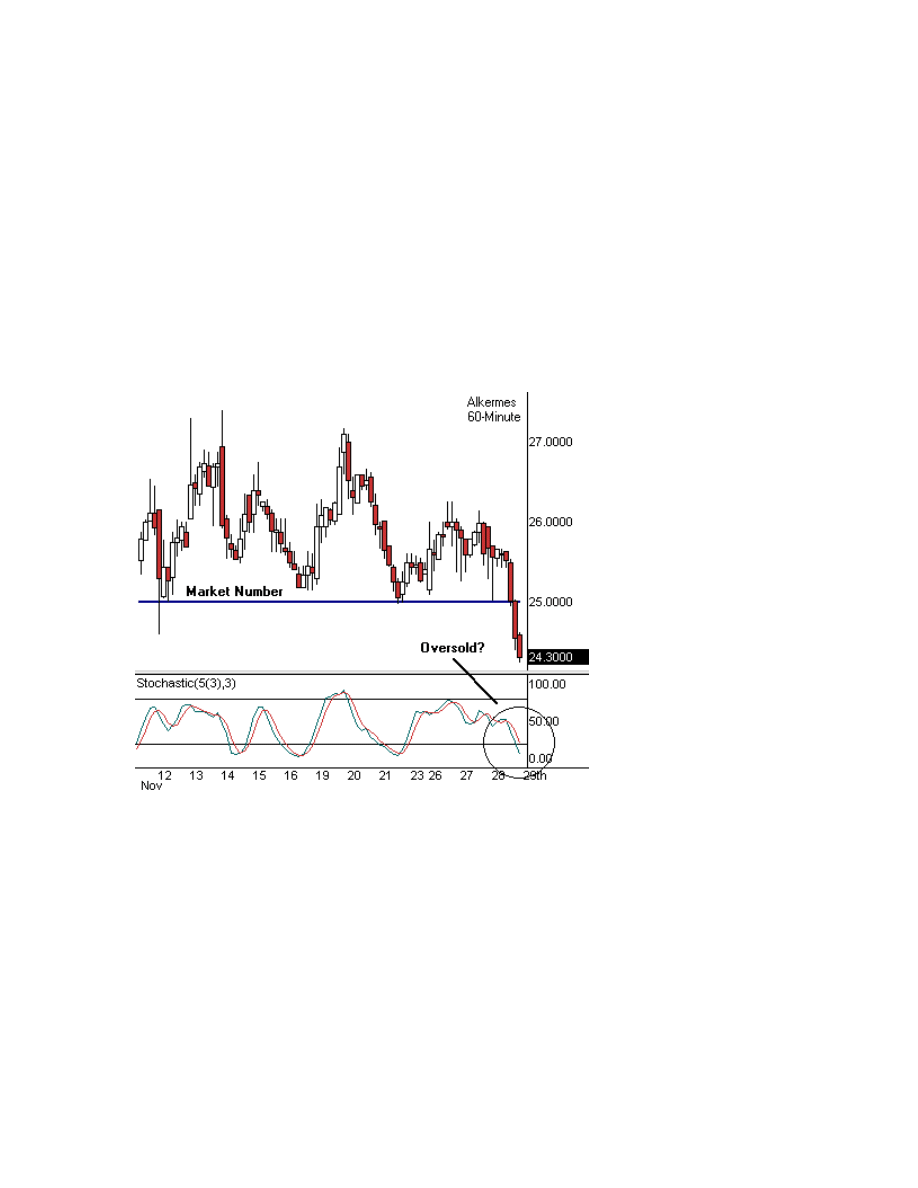
It still looks too early to sell Alkermes short. The 60-minute overbought-oversold oscillator
(stochastics) cautions that the stock could bounce before breaking the neckline. Fortunately, a
weak rally might offer a better short entry. It would run into triple resistance: the broken 50-day
moving average, three short-term lows and a market number of $25. And by that time, stochastics
could be rolling over from an overbought condition. All-around better timing for our swing trade.
The classic head-and-shoulders trade sells short on a neckline break or the first pullback, if the
opportunity arises. But the pattern is so well known that common entry levels can generate
substantial whipsaws. Contrarians like to trade against head-and-shoulders short-sellers, and
implement a variety of shakeouts to force them to cover positions.
Don't be surprised if price pulls back through the broken neckline before generating good
downside momentum. This is a consequence of our modern trading environment, where everyone

has access to good tech analysis books. So stay one step ahead of the crowd, keep up your
defenses and consider alternative strategies.
The best short sale after a neckline break often lies within the pattern itself. It's no coincidence
that this execution target sits at the same price as the first setup, i.e., up near the 50-day moving
average and the market number of $25.

SWING TRADING DEFINITIONS
Abandoned Baby -- A 3-bar candlestick reversal pattern. A single bar gaps up or down but then
immediately gaps back in the opposite direction on the next bar. The shadow of the lone candle
never crosses the shadow of the bar before the first gap or after the second gap.
Accumulation-Distribution (Acc-Dis) -- The underlying buying or selling pressure within a
particular stock.
Adam and Eve (A&E) -- Top or bottom reversal pattern noted by its sharp, volatile first high (low)
and slower, rounded second high (low).
Ascending Triangle -- A common continuation pattern that forms from a rising lower trendline
and a horizontal top resistance line.
AvgLOSS -- A performance measurement that shows the total losses divided by the number of
losing trades.
AvgWIN -- A performance measurement that shows the total profits divided by the number of
winning trades.
Bear Hug -- A trading strategy that finds short sale opportunities in weak markets that rally into
resistance or narrow range bars on the verge of breakdown.
Bollinger Bands (BB) -- Elastic support and resistance channels above and below price bars
that respond to the tendency of price to draw back to center after strong movement in either
direction. The Bollinger Band center band sets up at the moving average chosen for the indicator.
Breakaway Gap -- A classic gap popularized in Technical Analysis of Stock Trends that signals
the start of a new trend after a prolonged basing period.
Bucket Shops -- Early 20
th
-century stock gambling parlors that catered to short-term speculation.
Fictional trader Jesse Livermore discusses his experiences in them in the classic Reminiscences
of a Stock Operator.
Charting Landscape -- A three-dimensional view that evaluates complex price action through
multiple layers of information on a single price chart.
Coiled Spring -- A trading strategy that executes a position at the interface between a range-
bound market and a trending market.
Continuation Gap -- A classic gap popularized in Technical Analysis of Stock Trends that signals
the dynamic midpoint of an ongoing trend.
Convergence-Divergence (C-D) -- The tendency of two or more charting landscape features to
confirm or refute an expected price outcome.
Clear Air (CA) -- Pockets of thin participation and ownership that often lead to wide range price
bars.

Climbing the Ladder -- Bollinger Band pattern that indicates a strong and sustained rally.
Cross-Verification (CV) -- The convergence of unrelated directional information at a single price
level.
Cross-Verification x 4 (CVx4) -- A high probability trade in which a single price and time
emerges from analysis through at least four unrelated methods.
Cup and Handle (C&H) -- A popular pattern that triggers a breakout through a triple top. The
formation draws a long and deep base after an intermediate high. The market rallies into a double
top failure that creates the "cup". It pulls back in a small rounded correction that forms the
"handle" and then surges to a new high.
Cup and Two Handles (C&2H) -- A Cup and Handle variation that draws two congestion zones
on the right side of the pattern before price ejects into a strong breakout.
Dark Cloud Cover -- A 2-bar candlestick reversal pattern. The first bar draws a tall rally candle.
The next candle gaps up but closes well within the range of the prior bar.
Descending Triangle -- A common reversal pattern that forms from a descending upper
trendline and a horizontal bottom support line.
Dip Trip -- A trading strategy that buys pullbacks in an active bull market.
Doji -- A 1-bar candlestick reversal pattern in which the open and close are the same (or almost
the same) price and the high-low range is above average for that market.
Double Bottom (DB) -- A common reversal pattern in which price prints a new low, reverses into
a rally and returns once to test it before moving higher.
Double Top (DT) -- A common reversal pattern in which price prints a new high, reverses into a
selloff and returns once to test it before moving lower.
Dow Theory -- Observations on the nature of trend by Charles Dow in the early 20th century. It
also notes that broad market trends verify when the three major market averages all move to a
new high or low.
Electronic Communications Networks (ECNs) -- Computer stock exchanges that rapidly
match, fill and report customer limit orders.
Elliott Wave Theory (EWT) -- A pattern-recognition technique published by Ralph Nelson Elliott
in 1939 that believes all markets move in five distinct waves when traveling in the direction of a
primary trend and three distinct waves when moving in a correction against a primary trend.
Empty Zone (EZ) -- The interface between the end of a quiet range-bound market and the start
of a new dynamic trending market.
Execution Trigger (ET) -- The predetermined point in price, time and risk that a trade entry
should be considered.
Execution Zone (EZ) -- The time and price surrounding an Execution Target that requires
undivided attention in order to decide if a trade entry is appropriate.

undivided attention in order to decide if a trade entry is appropriate.
Exhaustion Gap -- A classic gap popularized in Technical Analysis of Stock Trends that signals
the end of an active trend with one last burst of enthusiasm or fear.
Fade -- A swing strategy that sells at resistance and buys at support.
Failure Target -- The projected price that a losing trade will be terminated. The price at which a
trade will be proven wrong.
Farley's Accumulation-Distribution Accelerator (ADA) -- A technical indicator that measures
the trend of accumulation-distribution.
Fibonacci (Fibs) -- The mathematical tendency of trends to find support at the 38%, 50% or 62%
retracement of the last dynamic move.
First Rise/First Failure (FR/FF) -- The first 100% retracement of the last dynamic price move
after an extended trending market.
Finger Finder -- A trading strategy that initiates a variety of tactics based upon single bar
candlestick reversals.
5-8-13 -- Intraday Bollinger Bands and moving average settings that align with short-term
Fibonacci cycles. Set the Bollinger Bands to 13-bar and two standard deviations. Set the moving
averages to 5-bar and 8-bar SMAs.
5 Wave Decline -- A classic selloff pattern that exhibits three sharp downtrends and two weak
bear rallies.
Flags -- Small continuation pattern that prints against the direction of the primary trend.
Foot in Floor -- Bollinger Band pattern that indicates short term support and reversal.
Fractals -- Small-scale predictive patterns that repeat themselves at larger and larger intervals on
the price chart.
Gap Echo -- A gap that breaks through the same level as a recent one in the opposite direction.
Hammer -- A 1-bar candlestick reversal pattern in which the open-close range is much smaller
than a high-low range that prints well above average for that market. The real body must sit at
one extreme of the high-low range to form a hammer.
Harami -- A 1-bar candlestick reversal pattern in which the open-close range is much smaller
than the high-low range and sits within the real body of a tall prior bar.
Hard Right Edge -- The location where the next bar will print on the price chart. This also points
to the spot where the swing trader must predict the future.
Head and Shoulders -- This classic reversal pattern forms from an extended high that sits
between two lower highs. Three relative lows beneath the three highs connect at a trendline
known as the neckline. Popular opinion expects a major selloff when the neckline breaks.

Head in Ceiling -- Bollinger Band pattern that indicates short-term resistance and reversal.
Historical Volatility -- The range of price movement over an extended period of time as
compared to current activity.
Hole in the Wall -- A sharp down gap that immediately follows a major rally.
Inside Day -- A price bar that prints a lower high and higher low than the bar that precedes it.
Inverse Head and Shoulders -- This classic reversal pattern forms from an extended low that
sits between two higher lows. Three relative highs above the three lows connect at a trendline
known as the neckline. Popular opinion expects a major rally when the neckline breaks.
January Effect -- The tendency for stocks to recover in January after end-of-year, tax-related
selling has completed.
Market Numbers – Price levels based on multiples or fractions of 10 that act as support or
resistance. Common market numbers include 5, 10, 20, 25, 30, 50, 100.
Moving Average Convergence-Divergence (MACD) -- A trend-following indicator that tracks
two exponentially smoothed moving averages above and below a zero line.
Mesa Top -- A double top reversal pattern that declines at the same angle as the initial rally.
Moving Average Crossover -- The point where a moving average intersects with another
moving average or with price.
Moving Average Rainbows (MARs) -- Wide bands of mathematically related and color-coded
moving averages.
Narrow Range Bar (NR) -- A price bar with a smaller high-low range as compared to the prior
bar's high-low range.
Narrowest Range of the Last 7 Bars (NR7) -- A low volatility time-price convergence that often
precedes a major price expansion. A price bar with a smaller high-low range as compared to the
prior six bars high-low ranges.
NR7-2 -- The 2nd NR7 in a row. A low volatility time-price convergence that often precedes a
major price expansion.
Neckline -- A trendline drawn under the support of a Head and Shoulders pattern over the
resistance of an Inverse Head and Shoulders pattern.
Negative Feedback -- Directionless price action in which bars move back and forth between
well-defined boundaries.
Noise -- Price and volume fluctuations that confuse interpretation of market direction.
On Balance Volume (OBV) -- A volume indicator that measures the progress of accumulation-
distribution.
Oscillator -- A subset of technical indicators that accurately measures flat market conditions by
assigning overbought and oversold price levels.

assigning overbought and oversold price levels.
Overbought -- The evolution of price action to a state in which it runs out of buying pressure.
Oversold -- The evolution of price action to a state in which it runs out of selling pressure.
Pattern Analysis -- Price prediction through interpretation of the crowd behavior seen in
repeating chart formations.
Pattern Cycles -- The tendency of markets to repeat identical price formations through different
stages of development in all time frames. The master market blueprint that generates all chart
patterns.
Pennants -- Small continuation pattern that prints against the direction of the primary trend.
%WIN -- A performance measurement that shows the total winners divided by the total number of
trades.
Positive Feedback -- Directional price action in which bars gather momentum and move from
one level to the next.
Power Spike -- A trading strategy that seeks high volume events and executes positions to
capitalize on their special characteristics.
Profit Target -- The projected price that a successful trade will be terminated. The price at which
a trade faces first resistance.
Random Walk -- Classic theory that chaos drives all market activity and that price movement
cannot be predicted.
Rainbow Crosspoint -- A horizontal support and resistance zone created by a moving average
crossover.
Rectangle -- Small continuation pattern that prints sideways to the primary trend.
Reflection -- A 2-4 bar candlestick pattern that first print a significant reversal, then thrusts away
from that formation and immediately draws an identical reversal in the opposite direction.
Relative Strength Index -- A technical indicator that measures a stock's ability to close up rather
than down for a specific period of time. An oscillator invented by J. Welles Wilder that measures
overbought, oversold and divergent market situations.
Rising Wedge -- Reversal pattern that slowly rises in an uptrend until price suddenly ejects into a
selloff.
Seasonality -- The predictable appearance of certain market characteristics that reflect specific
and repeating calendar events.
Setup -- A sequence of bars, patterns or other charting landscape features that predict the
direction and timing of future price movement.
Shooting Star -- A 1-bar to 3-bar candlestick reversal pattern with a small real body and tall
shadow that pushes into an intermediate high or low before a sudden change in direction.

shadow that pushes into an intermediate high or low before a sudden change in direction.
Slippage -- The difference between expected transaction costs and actual transaction costs.
Slippery Slope -- Bollinger Band pattern that indicates a sustained decline.
Signpost - Point on the charting landscape that identifies an imminent trading opportunity.
Silent Alarm -- A rare high volume signal that prints a narrow range bar and flags an impending
breakout.
6-18 Swing -- A moving average crossover system used to track intraday buying and selling
pressure.
Standard Deviation (std dev) -- The positive square root of the expected value of the square of
the difference between a random variable and its mean.
Stochastics -- An overbought-oversold oscillator that compares the current bar to a preset
selection of high and low prices. The indicator plots the results on a graph between 0 and 100.
Support/Resistance (S/R) -- Horizontal and non-horizontal barriers that current price should not
pass without the application of sufficient directional force.
Swing Trading -- A complex execution strategy that relies on identification of market opportunity
through the charting landscape.
Symmetrical Triangle -- A common pattern formed from a descending and rising trendline. The
formation has an equal bias of breaking out in either direction.
Technical analysis -- Market prediction that studies crowd behavior through evolving price and
volume activity.
3rd of a 3rd -- The middle wave and most dynamic price movement within a complete Elliott 5-
Wave rally or decline.
3rd Watch -- A trading strategy that executes a long position on a triple top breakout.
Transit Zone -- The horizontal price level of the last segment of a dying trend that also becomes
the first retracement of the new range.
Trend Mirrors (TM) -- Past chart activity that influences the direction and development of current
trend and range.
Trend Relativity Error -- A common mistake committed when a trader prepares an analysis in
one-time frame but executes in another.
Trendlet -- Small pocket of chart activity that appears and disappears over time.
Trendline -- A line that connects a series of highs or lows. The trendline can represent support in
an uptrend or resistance in a downtrend. Horizontal trendlines mark support-resistance and
range-bound conditions.

Triangles -- A related set of common 3-sided congestion patterns.
Wave -- Sustained price movement in one direction marked by clear high and low reversal
boundaries.
Whipsaw -- Erratic price behavior that triggers false signals and incurs trading losses.
Window Dressing -- Institutional buying or selling near the end of a quarter that makes reported
results appear better than actual results.
Wyszukiwarka
Podobne podstrony:
Example CV 11 CV Example with detailed instructions and tips embedded
Alan Farley Pattern Cycles Mastering Short Term Trading With Technical Analysis (Traders Library)
Explosive Forex Trading with Live Forex Trading Examples Udemy
Targeting Profitable Entry & Exit Points with Alan Farley
Pristine Intra day Trading Techniques With Greg Capra
11 3 2 2 Packet Tracer Test Connectivity with Traceroute Instructions
LEAPS Trading Strategies Powerful Techniques for Options Trading Success with Marty Kearney
Pristine Intra day Trading Techniques With Greg Capra
Pristine Swing Trading Tactics Oliver Velez
An Introduction To Options Trading Success with James Bittman
English Skills with Readings 5e Appendix Answers Charts Acknowledgement and Index
Jankovsky Jason Alan The Art Of The Trade What I Learned (And Lost) Trading The Chicago Futures Mar
Advanced Strategies For Options Trading Success with James Bittman
Swing Trading Using the Wyckoff Method — Wyckoff Analytics
Racing Ahead Trading Swing trading Peter Webb
Pristine Guerrilla Trading Tactics with Oliver Velez
więcej podobnych podstron