
Harvard Business Review Online | Take Command of Your Growth
Click here to visit:
Take Command of Your Growth
Companies that know where their revenues really come from are as disciplined in
managing growth as they are in managing costs.
by Michael Treacy and Jim Sims
Michael Treacy (
) is the author of Double-Digit Growth (Portfolio, 2003) and a cofounder of the product innovation
firm GEN3 Partners in Boston. Jim Sims (
) is a cofounder and the CEO of GEN3 Partners and the founder of systems
integrator Cambridge Technology Partners.
The top line—like the Socratic life—demands examination. Total revenues tell a story of growth, sometimes happy,
sometimes less so, but they do not tell the story of how a company grows. That knowledge abides in the distinctive
wellsprings from which revenues emerge. We have developed a tool—the sources of revenue statement (SRS)—that reveals
those origins and helps companies make the kinds of smart, targeted decisions that transform business performance.
Many companies treat cost cutting as a core competency: Ask senior managers to pare costs by 10%, and they know just
what to do. Ask them to boost growth by 10%, however, and they’re stymied. That’s because management tends to draw a
Serenity Prayer–like distinction between things it can and cannot change. Costs fall into the former category. Growth is in
the latter.
But that presumption turns out to be misguided, as the SRS amply demonstrates. The tool emerged from our research into
publicly traded companies that achieved steady double-digit growth in revenues and gross profits from 1997 to 2002.
Looking for the strategies and management disciplines behind those results, we interviewed senior management, reviewed
the financial filings of the companies, and discussed their performance with Wall Street analysts.
Managers can influence growth, we discovered, if they possess the right diagnostic information about revenue sources.
Unfortunately, that information is often unavailable to management teams, who are blinkered by the narrow perspective of
traditional financial reports. Income statements generally sort revenues by geographic market, business unit, or product
line, which is useful—as far as it goes. But managers not only must know where sales encourage or disappoint, they also
must understand why and what to do about it.
For many companies, the top line is terra incognita. So like Livingstone seeking the headwaters of the Nile, we set out to
discover the revenue sources to which all business growth can be traced. Unlike Livingstone, we found what we were looking
for.
We’ve identified five distinct sources of growth, all centered on customers and sorted not according to the way a company is
organized but, rather, by the range of strategies open to it. Three sources stem from a company’s core business: continuing
sales to established customers (base retention), sales won from the competition (share gain), and new sales in an expanding
market (market positioning). The other two lie outside the core: moves into adjacent markets where core capabilities can be
leveraged and entirely new lines of business unrelated to the core.
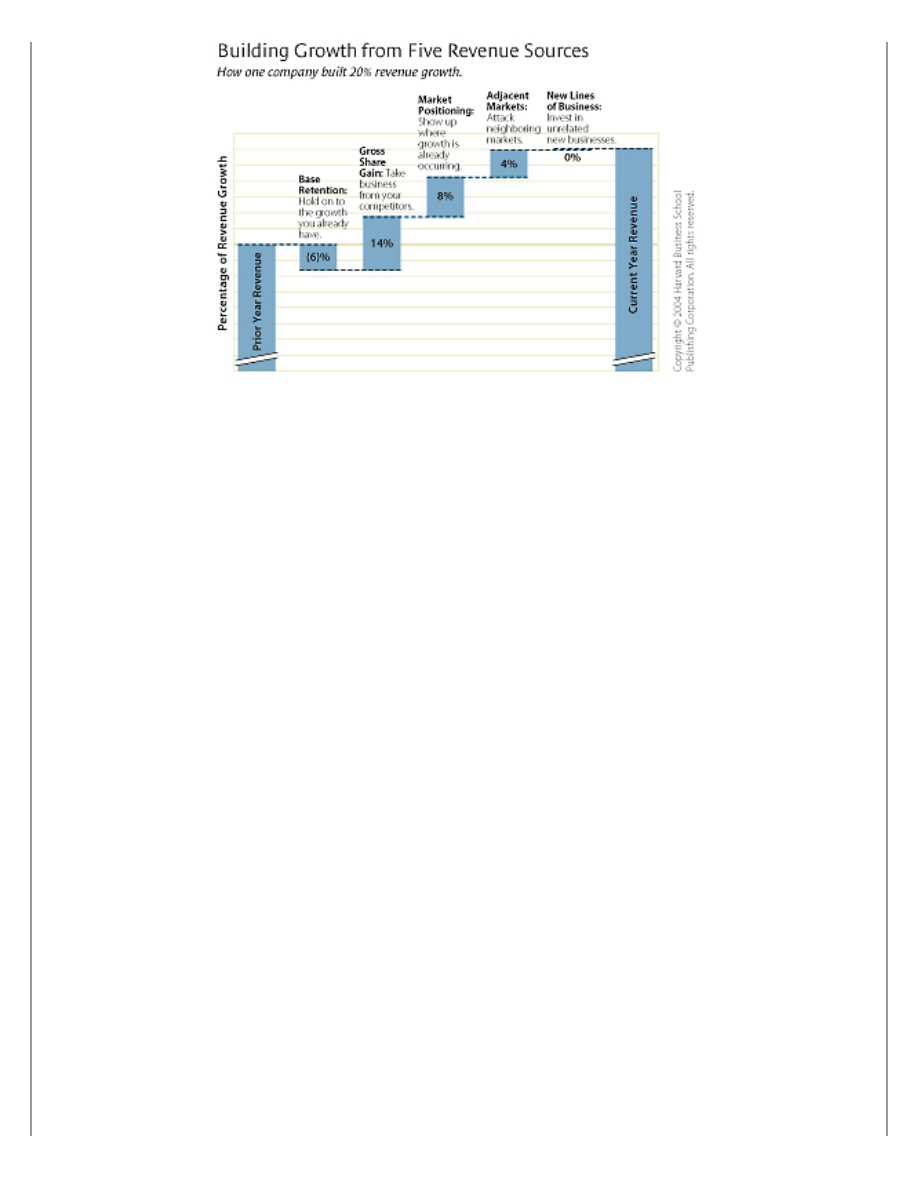
1
The exhibit “Building Growth from Five Revenue
Sources” traces one company’s 20% revenue rise back to these origins.
http://harvardbusinessonline.hbsp.harvard.edu/b02/en...nt.jhtml;jsessionid=U1OD1EC54NVXECTEQENB5VQKMSARWIPS (1 of 7)05-May-04 14:56:54
Harvard Business Review Online | Take Command of Your Growth
The SRS, then, is an income statement that breaks out revenue by provenance. By tracking the amount of revenue coming
from each source, the SRS helps managers take control of their revenue streams, diagnose problems, and spot opportunities
for growth. Yes, it is helpful to know that sales in Germany are falling short, but it is illuminating to identify a problem in
base retention. A company aware that it is exceeding its customary share of an expanding market can try to snitch even
more sales from the competition.
The SRS is equally effective in evaluating how well an acquisition target might be used to gain market share, reap the spoils
in a faster-growing segment, enter an adjacent market, or move into an entirely new line of business. Knowing which
sources of revenue an acquisition can potentially enhance helps to clarify how it should be treated. Say share gain is the
chief objective of the deal. If the acquiring company is focused solely on picking up customers at comparatively low cost,
then the target company is best dismembered and digested. Firms eyeing an adjacent market, by contrast, must consider
that market’s attractiveness, the acquired company’s position within it, and how the new business and the core will
strengthen each other. In such cases, integration need not progress beyond taking management control and making the
changes necessary for collaboration.
Tally the Top Line
The SRS relies on a formula not much more complex than an old-fashioned income statement; its calculations are clear and
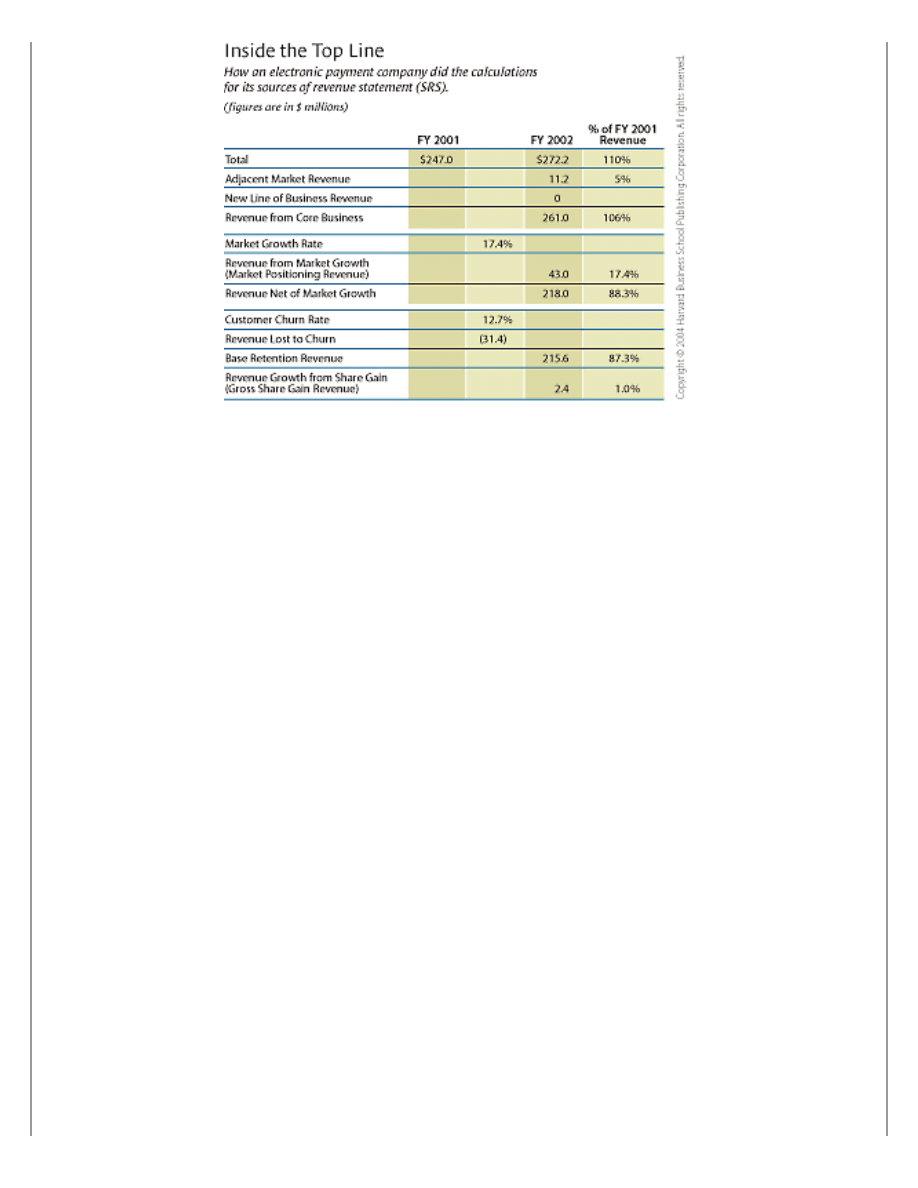
straightforward. Let’s take a basic example of a company operating in a single market. The exhibit “Inside the Top Line”
shows SRS calculations for a midsize payment services company. (We’ve called it Payment Services Incorporated and
disguised some data for competitive purposes.) Here’s how it calculates its SRS:
• Determine total revenue for the current year and the previous one. (Revenue for Payment Services totaled $247 million in
2001, and it rose to $272.2 million in 2002.)
• Determine the revenue gain or loss from entry into or exit from adjacent markets and new lines of business in the current
year. Deduct those amounts from total revenue to determine revenue within the core business. (In FY 2002, Payment
Services acquired a small company in a related market, which brought in $11.2 million, leaving a core revenue of $261
million.)
• Estimate the market growth rate for the current year. (The young electronic payment market grew at a healthy 17.4%
clip.) Multiply that rate by the prior year’s revenue to calculate the dollar growth attributable to market position ($43
million). Subtract that amount from core business revenue to determine what the revenue would have been if there had
been no market growth ($218 million).
• Estimate the customer churn rate. (Payment Services found that to be 12.7%.) Multiply that by the prior year’s revenue to
calculate revenue churn ($31.4 million). Deduct revenue churn from the prior year’s revenue to calculate base retention
revenue in the current year ($215.6 million).
• The balance of growth revenue that is not attributable to base retention, market positioning, new lines of business, or
moves into adjacent markets is revenue attributable to gross share gain ($2.4 million).
http://harvardbusinessonline.hbsp.harvard.edu/b02/en...nt.jhtml;jsessionid=U1OD1EC54NVXECTEQENB5VQKMSARWIPS (2 of 7)05-May-04 14:56:54
Harvard Business Review Online | Take Command of Your Growth
Like tests for steroids, the SRS may cast seemingly strong performance in a new light. Payment Services’ total annual
revenues grew a little more than 10%—not bad on the face of it. But an examination of sources on the company’s SRS
reveals that customer churn slashed revenues by more than 12%. The company had to find more than $31 million in new
revenues to compensate for customers walking out the door. Those defections cut sharply into overall growth.
Furthermore, the company can ascribe the largest portion of its growth to an expanding market, which contributed $43
million to total revenue. Yet the company grew more slowly than the market overall, ceding share to competitors. Adjacent
market growth resulting from the acquisition was the second largest source of revenue.
Should the company be satisfied with those results? Yes and no. Its position in a fast-growing market raised revenues
17.4%: That bodes well. And management is doubtless pleased with the $11.2 million generated in the adjacent market,
although it’s early days to pass judgment on the wisdom of that acquisition. More troubling are the paltry gross share gains
of 1%, which didn’t begin to make up for customer churn of 12.7%. The net share gain was actually negative—an 11.7%
loss of share. That’s alarming: It suggests that the company’s value proposition has lost its allure. (Problems with base
retention and share gain both generally arise from problems with a company’s basic value proposition.) In sum, those
superficially blue skies look cloudy, with a chance of rain.
See the Trees for the Forest
Such insights, and hundreds like them, are the missing links in what passes for growth management. The focus on net share
gain obscures its components—customer churn and gross share gains—and, by extension, both deeper problems and
opportunities for improvement. It is possible to track churn rates, but too often they remain unknown, making it difficult to
judge how to balance investments in customer retention with those in new-customer acquisition. Companies rarely measure
market gain, even though the insight earned by doing so might spur them to upgrade their offerings in higher growth
segments. Reporting adjacent market growth together with base business results further fogs the picture. The SRS makes
such distinctions possible and in the process hands managers an accurate map from which to correct the company’s course.
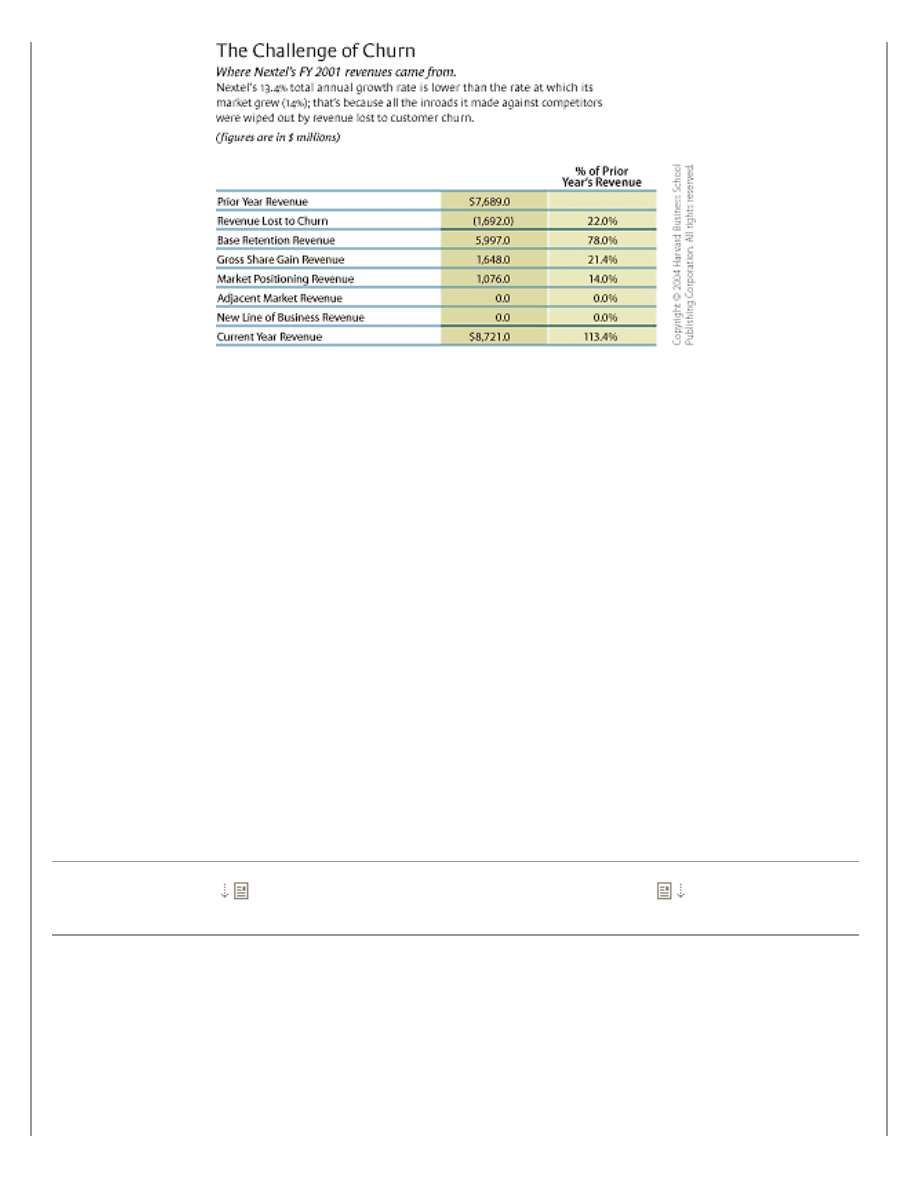
SRS calculations rely on estimates of customer churn and market growth rates. For some industries, those data are publicly
available. According to Wall Street estimates, for example, the wireless phone company Nextel churned through 22% of its
customer base in 2002 (a strong performance for that industry). Those analysts further surmise that the overall market for
wireless services grew about 14% last year. Combining this information with financial statements contained in Nextel’s 10-k
filings lets us compute the company’s SRS, shown in the exhibit “The Challenge of Churn.”
http://harvardbusinessonline.hbsp.harvard.edu/b02/en...nt.jhtml;jsessionid=U1OD1EC54NVXECTEQENB5VQKMSARWIPS (3 of 7)05-May-04 14:56:54
Harvard Business Review Online | Take Command of Your Growth
Nextel’s SRS illustrates the hazards of the wireless phone business. Because it retains only about three-quarters of its
customers in any one year, the company must invest considerable time and money to attract replacements. The bad news is
that losses from customer churn (22%) outweighed all the gains in gross market share (21.4%). The good news is that the
market continues to grow strongly. Thus, Nextel gets a big revenue boost (14%) just by showing up and winning its fair
share.
And what happens when market growth fades, as fade it must? The SRS also provides Nextel with guidance for raising its
own boat regardless of the state of the tide. For example, better tactics to strengthen base retention could pay huge
dividends. As the incumbent wireless service provider for these customers, Nextel holds three advantages over competitors.
First, it must necessarily have more information about its own customers and their usage patterns than its competitors
would, and it can use that information to improve the value proposition it offers current customers. Second, because it has
those people’s attention, it can influence their perceptions of various features and services. The final advantage is economic:
Customers incur a switching cost to change suppliers. Nextel must use those natural advantages to maintain superior
customer value so it can corral more people within its retained base year after year.
As for new customers, Nextel is racking them up. The challenge is to do so at lower cost every year. Revenue from market
growth is predicted to decline as the market for wireless services saturates. Nextel needs to identify new growth
opportunities within the wireless market before its rivals do, get established in those segments early, and deliver a patently
better value proposition to new customers. Only by tracking revenues earned from share gain separately from those arising
from market position can it begin to manage this difficult transition.
To further cushion the blow of declining market growth, Nextel may want to establish new revenue streams in adjacent
markets, as mobile phone vendors did by moving into the pager market in the late 1990s, much to the chagrin of the
incumbents there. The pager industry might still be vibrant today had companies in it sought new beachheads for their core
capabilities in other adjacent markets—such as low-cost data networking that could support everything from smart soft-drink
vending machines to new services for delivering customized real-time information.
Unfortunately, most industries don’t produce reliable data on churn and market growth. But with just a little work,
companies can develop surprisingly accurate assessments of those rates. Even crude estimates, so long as they are
directionally correct, often yield valuable insights about the sources of revenue growth. (See the sidebar “First, Get the
Numbers.”)
First, Get the Numbers
Sidebar R0404J_A
(
Located at the end of this article)
Exploit the Power of Divisions
Even finer-grained analysis is feasible in large companies comprising several business units, each with its own revenue
stream. Armed with reasonable estimates of customer churn and market growth rates, senior managers can create SRSs for
business units, product lines, geographic markets, and the like. In fact, the tool’s ability to identify variances in revenue
sources from one unit to another is what makes it so powerfully diagnostic.
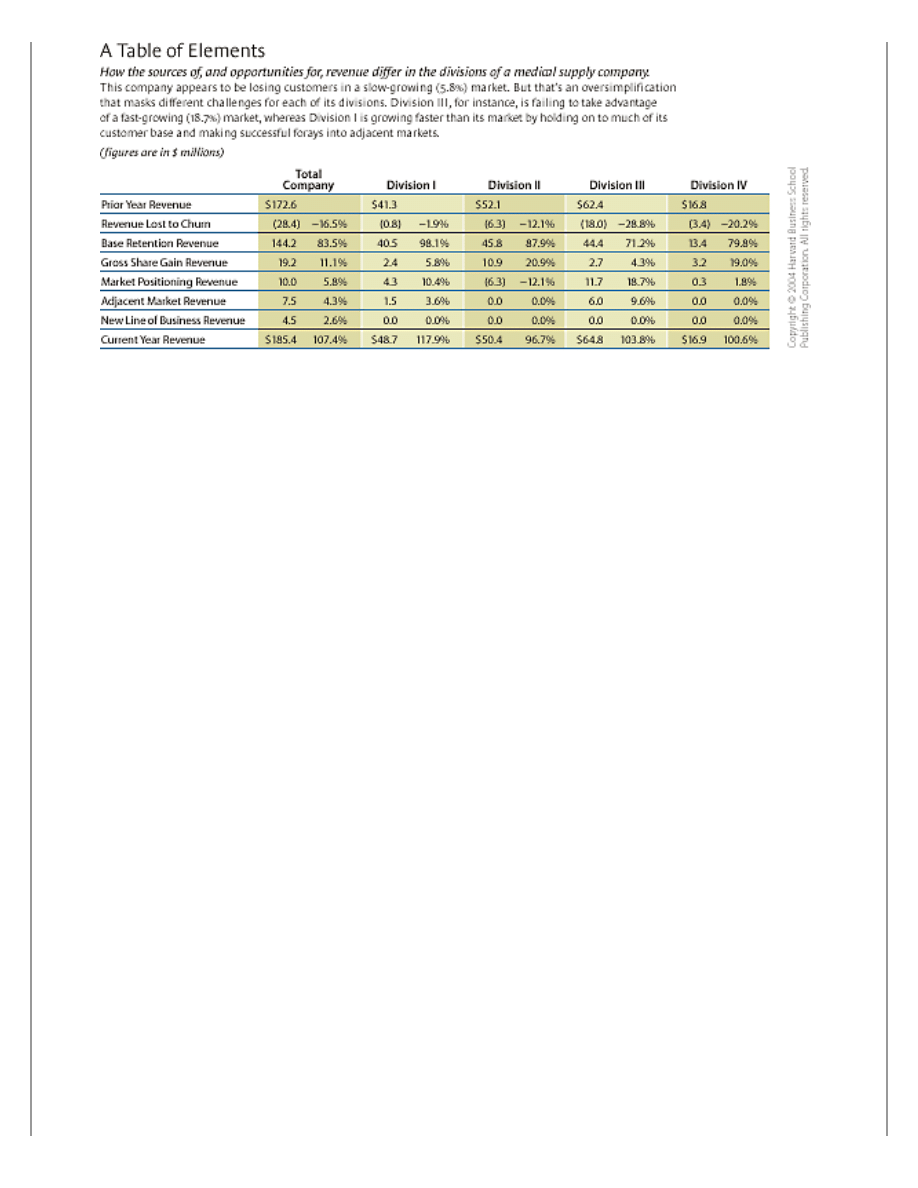
We worked with one medical supply business that built an SRS for the corporation and one for each of its product divisions.
The data, slightly altered for proprietary reasons, are summarized in the exhibit “A Table of Elements.”
http://harvardbusinessonline.hbsp.harvard.edu/b02/en...nt.jhtml;jsessionid=U1OD1EC54NVXECTEQENB5VQKMSARWIPS (4 of 7)05-May-04 14:56:54
Harvard Business Review Online | Take Command of Your Growth
Corporate-level analysis reveals that the chief growth drivers were $7.5 million from moves into adjacent markets and $4.5
million from new lines of business. In addition, the company’s core markets expanded at a healthy annual 5.8% clip, adding
$10 million in revenues. But clearly, the company needs to work on its value proposition and effectiveness in selling against
competitors. Market share declined, as the medical supplier lost more revenues from defecting customers (-16.5%) than it
earned from new ones (11.1%). In fact, customer churn drained $28.4 million of revenue and, had it not lost these
customers’ business, the growth rate would have tripled. Retaining more base customers would appear to be paramount.
But the divisions’-eye view tells a more complicated story:
• Division I contributed most of the company’s revenue gain without achieving any substantial market share gain. Its very
high base-retention rate, coupled with strong market growth, assured its performance. It also made inroads into an adjacent
market that will expand its growth horizons.
• Division II’s revenues have sunk, but management appears to have done its best. The division gained substantial gross
share (up more than 20%) at the expense of competitors, indicating a strong customer value proposition. Too bad that gain
has been more than wiped out by a 12% customer churn rate and a 12% drop in the overall market. This division should
focus on stanching base-customer losses, but it should also stake out the segments of its diminishing market with the most
growth potential.
• Division III’s modest growth of 3.8% masks an alarming performance. Net market share declined precipitously—by 24.5%
—in a market that grew more than 18% in the past year. This divisional management team is squandering a huge growth
opportunity.
• Division IV achieved impressive gross market share gains that were wiped out by 20% customer churn. The overall effect
was a small decline in net market share. Reducing that churn rate will pay big dividends in this modestly growing market.
The SRS data reveal that Division III, although growing, is wasting a larger opportunity. Division II, meanwhile, is fighting
the good fight in a rapidly deteriorating situation. The other two divisions confront mirror-image challenges of base
retention, share gain, and market positioning. Had managers focused only on total revenue, they would have missed those
important conclusions.
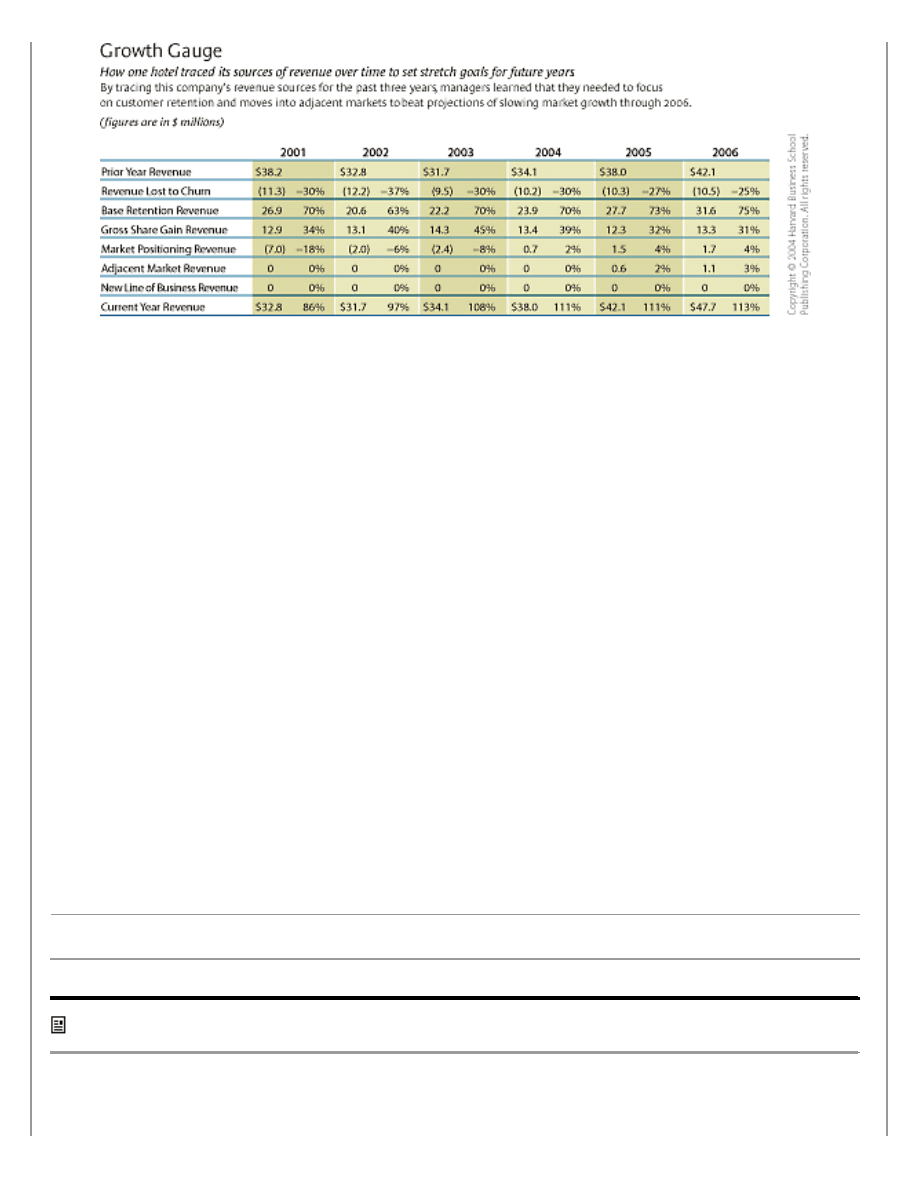
Build In Stretch
The SRS is not merely an instrument for diagnosing present performance but also a tool for planning future growth. One
hotel property company we’ve worked with is using it to set multiyear targets for its properties. Like most companies in this
industry, this business confronted a sharp fall in overall market demand after the terrorist attacks: 18% in 2001, another
6% in 2002, and 8% more in 2003. After examining industry forecasts and regional data, hotel management teams
concluded that demand in 2005 would rebound only to 2002 levels. They had given little thought to initiatives that might
change the writing on that wall.
Having made the acquaintance of the SRS, these managers began using it to set stretch growth targets for each revenue
source and to develop tactics for reaching those targets. The exhibit, “Growth Gauge” illustrates the revenue plan for one of
the company’s properties as of January 2003.
http://harvardbusinessonline.hbsp.harvard.edu/b02/en...nt.jhtml;jsessionid=U1OD1EC54NVXECTEQENB5VQKMSARWIPS (5 of 7)05-May-04 14:56:54
Harvard Business Review Online | Take Command of Your Growth
Customer churn spiked in 2002 for both the company and the industry, as competitors fought one another to fill rooms.
Aggressive price and promotional competition caused most of the decline in base retention. In response, the management
team of this particular hotel developed more than two dozen tactics to coax base retention back to its historical 70% rate
and then improve it year after year. By building a base retention stretch objective into its plans and monitoring performance
month to month, the team brought focus and energy to a troubling source of revenue loss.
As base retention declined in 2002, managers balanced those losses with new-client acquisitions, causing a share gain spike
in 2002 and 2003. Although it experimented with aggressive tactics and planned more of the same for the following year,
the team deemed it prudent to reduce its stretch target for share gain after 2003, and setting the level became a negotiating
point with upper management.
The travel slump had also scotched plans to dip a toe in adjacent markets. Before September 11, the team had been eyeing
off-premises catering, corporate concierge services, even a membership-oriented fitness center. Empty rooms had meant
lack of access to capital, rendering adjacent markets unbreachable.
The SRS changed all that. By looking at each revenue source separately, the team could identify appropriate stretch targets
and develop practical tactics to achieve them. The managers gained confidence in their ability to deliver growth in the core
hotel business and set aside capital for one foray into an adjacent market. The revenue goal for the adjacent market
investment is $600,000 in 2005, the first year of operation.
The SRS also enriched the conversation between the hotel’s property management team and the parent company’s senior
management. Enlightened through the revenue source data about issues limiting growth, senior management could better
apply its experience and judgment to negotiating aggressive—but not excessive—revenue targets with the team managing
the property. Finally, the SRS led to a new reporting-and-control system that measures the impact of each tactic on the
revenue source at which it is directed.
• • •
Hundreds of companies are perched atop enormous potential that they don’t exploit because they can’t see it. The SRS can
endow them with sight and, more important, with understanding. Once these businesses master revenue growth, the effect
on their overall growth may be phenomenal.
Seekers of truth are routinely enjoined to go to the source. Executives seeking to make the best decisions about managing
revenue growth should do the same.
1. A sixth source—pricing—comes into play for businesses in markets that exhibit meaningful price fluctuations, such as those for commodities, and in
industries beset by significant inflation or deflation, such as those for computer memory chips.
Reprint Number R0404J
First, Get the Numbers
Sidebar R0404J_A
http://harvardbusinessonline.hbsp.harvard.edu/b02/en...nt.jhtml;jsessionid=U1OD1EC54NVXECTEQENB5VQKMSARWIPS (6 of 7)05-May-04 14:56:54

Harvard Business Review Online | Take Command of Your Growth
Companies have been measuring costs for more than a century—plenty of time to develop an array of reliable data sources.
But businesses are nowhere near as proficient at producing data on market growth and customer churn, which are needed to
calculate sources of revenue statements (SRSs). Fortunately, even an SRS based on guesstimates of churn and market
growth rates provides far more value than traditional reports. In addition, companies can begin with rough numbers and
then iteratively improve their estimates of churn and market growth, producing ever more accurate SRSs as a result.
Here’s how to do it.
Let’s start with some definitions. Market growth is the rate of growth in demand—expressed in dollars—of an entire market.
It is best computed by estimating the growth rate of each market segment and then calculating the weighted average
growth rate of all the segments across the entire market. If a company shifts its mix of revenue toward higher growth
market segments, its market growth rate will rise. Thus, market growth rates can be actively managed.
Customer churn is the weighted average rate of customer defections to competitors. In its simplest form, customers do
business frequently and exclusively with one supplier—the model for the consumer wireless industry. In that case, churn is
the rate at which customers cancel their accounts in favor of another supplier, adjusted for the size of those accounts.
(Customer churn should not be confused with negative market growth, in which customers withdraw from the market
altogether rather than just switch suppliers.)
The calculation gets trickier when a customer uses several suppliers at once. In that case, customer churn is the weighted
average loss of a company’s “share of wallet” for those customers. When share of wallet increases, churn is zero, and the
growth, of course, counts as share gain.
For markets—such as automobiles—in which purchases typically occur only once every few years, there is churn whenever
the customer chooses a brand different from the one chosen the time before. Straightforward enough. But there are
complications. For example, across the entire U.S. auto market, only about 44% of consumers buy the same brand of
vehicle twice in a row. Another 11%, however, choose a different brand from the same automaker. Thus, churn is either
45% or 56%, depending on whether the supplier views its sister divisions as competitors.
Several independent firms reliably track market growth and customer churn for the automotive sector. Companies in most
other industries must compile their own numbers by collecting data from customers—a nontrivial task in terms of time and
effort. There are several ways to go about it. One East Coast building materials distributor, for example, began collecting
data on housing starts of its customers (who are home builders). It then created a simple model that translates monthly
housing starts into demand for building materials. By matching those data with its sales to those customers, the distributor
was able to determine changes in share of wallet, churn, and market growth.
A large computer hardware manufacturer, by contrast, employs an independent research firm to survey samples of
customers every month about their total hardware purchases and brand selection. It then uses those data to estimate
market growth and customer churn for each of its products and geographic segments. Many other firms use less formal
sampling techniques to develop reasonably accurate estimates of market segment growth and customer churn rates.
Copyright © 2004 Harvard Business School Publishing.
This content may not be reproduced or transmitted in any form or by any means, electronic or mechanical, including photocopy,
recording, or any information storage or retrieval system, without written permission. Requests for permission should be directed to
permissions@hbsp.harvard.edu, 1-888-500-1020, or mailed to Permissions, Harvard Business School Publishing, 60 Harvard Way,
Boston, MA 02163.
http://harvardbusinessonline.hbsp.harvard.edu/b02/en...nt.jhtml;jsessionid=U1OD1EC54NVXECTEQENB5VQKMSARWIPS (7 of 7)05-May-04 14:56:54
Document Outline
Wyszukiwarka
Podobne podstrony:
ref 2004 04 26 object pascal
2 3 Unit 1 Lesson 2 – Master of Your Domain
2014 05 04 THE ESSENTIALS OF A HEALTHY FAMILY part 3
2004 04, dzieje zlotego
2004 04 Fonty w Linuksie [Administracja]
2004 04 Moduł zasilacza do wzmacniaczy mocy
Causes and control of filamentous growth in aerobic granular sludge sequencing batch reactors
DzU 151 2004 04 16 O ochronie przyrody
konstrukcyjne cennik 2004 04 01
Matematyka dyskretna 2004 04 Rachunek prawdopodobieństwa
Change the look of your?ckground
Jones R&D Based Models of Economic Growth
323 Green Day Time of Your Life
2004 04 Automatyczny wyłącznik TV
Inżynier Budownictwa 2004 04
PBO G 04 F04 Receipt of document transmittal
ref 2004 04 26 object pascal
2 3 Unit 1 Lesson 2 – Master of Your Domain
więcej podobnych podstron