
TIME FACTORS
IN
THE STOCK MARKET
BY
GEORGE BAYER

Preface
A few words by way of introduction to this work may be
necessary, since it deals with a technical subject and the scope of it
cannot be readily understood by the casual reader. It is essentially
intended for investors and traders in the various kinds of
commodities traded on exchanges. To the chart reader it is
particularly informing in that it reveals the more scientific part of
the subject and shows the mathematical base underlying the lucky
hits to which many of our chart readers have undisputed claim. The
general scope of this work embraces all that is essential to the art
of scientifically detecting direction and distance of swings.
This is a field practically foreign to the average trader and investor.
Attempts have been made to partially reveal still more remote
truths behind stock and commodity movements, but their
explanations become so involved that it is wiser to train our
thoughts along simple lines at the present time. Only through
serious study of the various phases and underlying laws of Nature,
can success be attained in market operations.
I trust to have left no point untouched that would help in
grasping the laws of motion whatever sort they may be.
January 2, 1937
Page 1

Day after day, when we speak to different people we make
use of practical, applied psychology. Instinctively we try to
ascertain their thoughts and reactions so that we may draw concise
Sioux to account for their behavior. By such processes, we can
form opinions as to their knowledge and character. This type of
psychology constitutes an essential part of our associations with
everyone. Depending upon personal ability keen observation and
individual conditions we can advance to a certain degree in this
science of judging men. Without such practical experience, such
applied psychology, neither jurists nor businessmen can secure the
necessary advantage that brings any endeavor to a successful close.
To understand the actual process of forming these judgments,
we find that two distinct methods are used, one being as essential
as the other – namely, experience and thought, or empiry and
speculation. These methods are of prime importance in forming
judgments and entail two distinct mental operations. Only by
joining both operations can a complete judgment or decision result.
The more experience a man has in finding related occurrences,
similar mental pictures, or similar events this mind the more he is
apt to group them correctly in correlation to past experiences and
the more sound will be the resultant judgment. It is almost
impossible to picture a four-legged horse walking on three legs.
Should you think of a horse walking, past experience
Page 3

has convinced you that the animal called "horse" has four legs; not
three, nor five. Moreover, you know that it walks on four legs, with
the possible exception of a horse that has accidentally lost a limb
or one that has been trained for a specific purpose, such as a horse
in a circus. Similar comparisons can be made with other animals.
in fact, with anything alive.
The same results occur when treating the abstract. When we
speak of the abstract, we mean the mental action or reaction of the
human brain. Suppose one asks about the weather. It would be
absurd to believe or blink that a rational person would begin
reciting a poem. In answer, he will invariably concentrate on
thoughts of clouds, rain and sunshine. This fact is based on the
important law which states that equal causes produce equal events.
Every event has an underlying cause, else no event could occur.
As a further illustration, let us consider the case of a man
who has an accident. We will assume that he crossed the street
against a traffic light and was hit by an automobile. This accident
would not have occurred if he had not crossed the street while the
light was against him. His own decision to cross the street,
contrary to accepted traffic laws was the cause of the accident. The
direct cause was the car hitting him. It is obvious that if he had
crossed the street against the light and with no danger in sight he
would have surely crossed in safety. The direct cause of his
accident was his decision to take the risk of crossing at the wrong
time.
Naturally, the important question arises - was it necessary
that he should cross the street to meet with an accident, or could he
have avoided it? A very good reason must have caused him to
cross the street against the light, or else he would have waited for
the light to change. It can be assumed that his mind was clear and
normal and that no attempt was made to become involved in an
accident. Nevertheless, the conditions under which he crossed the
street caused the resulting event of the accident. Were the same
Page 4

conditions again equal and present, and should this man cross once
more, the same occurrence would take place, precisely as it did in
the past.
If a trader buys a stock while the market is a downward trend,
he suffers a loss. Therein we see the parallel; the trader did not
watch the stop light. The same conditions recur frequently, and the
trader may react in the same manner, again and again, with
attendant losses. This will only cease when the trader begins to pay
attention to what may be termed “market stop lights".
Everything possesses certain characteristics peculiarly its
own wherein it differs from everything else. There must be a
reason for this singular difference, for this being what it is and not
something else that it is not. No two men are alike. No two stocks
are alike. Not even two cars of the same manufacture are alike
even though they seem to be so superficially. Although each object
has its own particular peculiarities, its own individuality, yet it has
one thing in common with all the other objects in this world; it
strives to remain what it is and to stay where it is, unless some
external influence causes it to change. The same applies to an
object in motion. Any object, once placed in motion, will remain in
motion until some outside agency or influence increases or retards
this motion. A rock should remain on a hillside forever unless
some external influence dislodges it; then it may roll away. This
same rock then gradually slows down until inertia is reached once
more.
What Do We Mean By Time?
Things that exist or events that occur can only be brought to
mind without contradiction provided we know what has been and
what has happened. Therefore what is and what happens, as far as
we know, is or happens only in connection with other things that
are or happen. We arrive at the conclusion that everything that
exists, affects and is affected by everything that exists; everything
Page 5

affects and is affected by everything else in the Universe and the
existence of anything is but a point of an endless chain.
If we speak of duration, be it of all object or an event, we
mean a lapse of time between its inauguration and its conclusion.
This duration is called 'time'. Time, as we are able to grasp it
philosophically, is a line running backward to what has passed and
forward to what will be. We cannot possibly say that time will ever
come to an end or to rest; for even the presents our only tangible
point, is moving constantly and becomes the past during every
moment of existence. As the time passes, each present moment or
point automatically becomes one of the past; being replaced by one
of the future. We can conceive of the idea of time as a steadily
flowing river. But we cannot conceive of a river without a river-
bed and a territory through which it flows. Let us remain at one
point. On one side flows the future, on the other, the past. We can
imagine the river, or 'time', coming from the distant past and
flowing into the endless future, but we must not lose sight of the
fact that this incessant river is and remains actual reality, no matter
if it flows on the side of the future or on the side of the past;
nevertheless, during the moment of its passage before us, it is the
present in full reality.
Actually these pictures bring us nothing positive. Let us now
consider time in the abstract. Nothing is gained if an abstract
conception of a sequence is substituted for the useless picture of a
line; the only thing acquired is the inner sequence of the single
moment, which is part of the conception of time. The sequence of
the moments is fixed. The moment has its place between m + l and
m - l; its sequence is uniform, and the distance between two equal
members is equal to the sum of the distance of all the members
between. If we compare time to a line, this line must be straight.
This makes it rather difficult to speak of a circle of time, unless we
conceive that the very immensity of this circle makes the minutes
appear to us as a straight line.
Page 6

As difficult as it is to explain the flow of time, we are faced
with the same problem when we try to analyze time in proportion
to objects and events. It would avail nothing that things are in time
if they were not to suffer an effect were they not in time. But to
say that the flow of time carries them along with it would create a
false impression. Not only would the force that is behind it remain
in the dark, but time, empty of contents could then exercise a force
against the motion of filled space, our actual reality, a force or
motion which would not be its own. The result would be
inexplicable. The productive power of time should mean creation
and destruction, but not change in the quantity or quality.
Much could be written developing this line of thought, and
ultimately we could again arrive at the point of beginning. We do
not seem to be able to solve the puzzle of time with its attendant
cause of events. But there is a way to solve this puzzle and I am
positive that I have solved it through the careful study of the Bible.
Why it is so tremendously difficult to find a solution lies primarily
in our system of education and the systems of existing
philosophies, wherein neither attempts to grasp the main factors.
About Religions
For thousands of years, human beings have recognized as the
motivating power of all events, a cause which; is called "God".
Like all other broad, general conceptions, it underwent changes
throughout the ages while humans developed their reasoning
powers. It may even be said that no other conception has ever been
so radically changed and remodeled as this one, as can be seen
from the many attempts to reconcile reasoning science with the
deepest beliefs and superstitions of the human race. Comparative
criticism of the many ideas of God is very interesting and
Page 7

instructive but would disrupt our train of thought.
1
We must remain
satisfied with illustrating the most important conceptions of God
and their relations to our main subject, the stock market.
The manifold conceptions of God can be divided into two
distinct groups: theistic and pantheistic. The former may be called
the dualistic or mystic conception, the latter the monistic or
rational conception of the Universe. Theism propounds the thought
that God and the World are two different entities. God, conceived
by the various races, is subject, in their fancy, to the most varied
forms, from fetishism to the well-defined, monotheistic religions of
the present time. The more important varieties of the theistic
conceptions are: polytheism, triplotheism, amphithism and
monotheism.
Pantheism considers God and the World to be one and the
same. The conception of God falls in the category of Nature and
Substance. It is, of course much younger than theism, whose crude
forms are found in the religions of thousands of years ago. The
pantheistic idea is completely different from the theistic idea. The
former places God intermundane, calling God, so to say, Nature
and within the substance, active, as force and energy. This view
enlightens the natural laws discovered during the last century.
(This paragraph is merely “a joker” so as not to anticipate too
much, expressing merely the views of “modern scientists", for the
Bible is not theistic, but pantheistic, as will be shown soon.)
Theism places God extramundane, as being outside the rules
of the world.
The following laws can only be fully understood when using
a pantheistic world conception:
1) The Universe is infinite, unlimited; it is completely filled with
substance throughout.
2) Time of the Universe is infinite, unlimited. Time has no
beginning and no end.
Page 8

3) Its substance is everywhere, at all times in uninterrupted motion
and uninterrupted change. The infinite quantity of matter remains
as fixed as the eternal changing energy.
4) The universal motion or substance in the Universe is an eternal
circular motion with periodically repeating eras.
5) These eras consist of periodic changes of the aggregate
condition whereby a primary separation of matter and ether occurs,
the ergonomy of ponderable and imponderable matter.
6) This separation has its cause in the progressively denifying (?)
process of matter, in the formation of uncountable small density
centers.
7) In one part of the Universe, heavenly bodies are formed through
the pycnotic process, first small, then larger and the ether between
them obtains a greater tension; in other parts of the Universe, the
exact opposite process occurs, namely the destruction of heavenly
bodies through collisions.
8) The immense quantities of heat released by these mechanical
collisions which effect the motion of the forming cosmic dust
masses and the reformation of rotating balls. So the eternal process
repeats indefinitely.
The Earth, which started from parts of our rotating Sun
system millions of years ago, will in the course of further millions
of years become rigid when its path around the Sun has become
much smaller finally dropping into the Sun.
To get a clearer vision of universal cosmic development, the
modern idea of periodic changes, of destruction and creation of
heavenly bodies, is especially important. We can ascribe to it, the
great strides made in physics and astronomy, in connection with
the law of Substance. In this idea, the earth shrinks to a tiny pinch
of dust and becomes one of the innumerable millions, which pass
throughout the infinite Universe in the form of heavenly bodies.
Thus mankind, itself, which in its anthropological fancy, glorifies
itself as the image or replica of God, sinks to the size of the
smallest bacillus. People are only ephemeral developing forms of
Page 9

eternal Substance - individual forms of matter and energy. Their
nullity and voidness we can only understand when we try to locate
ourselves in the infinity of space and in the eternity of Time.
Religion is mainly theistic. It asserts itself as an invisible
influence, ever present, ever active, in the thoughts and actions of
people. It teaches them to think in the direction prescribed by it,
and in no other way. Whoever does deviate in his thoughts from
the trodden path, can expect little support, This truth applies to the
stock market, as will be amply illustrated later.
Another great influence is produced through the laws of
Nations. These laws, made by men, influenced by their theistic
religions, are in perfect harmony with the religious laws, at least,
they will not be in sharp contrast. It is a well known fact that in the
Middle Ages, when the Pope was ruler of our so-called civilized
world, knowledge, science and invention were restrained, so as not
to endanger the safety of the Church.
Copernicus, a famous astrologer and astronomer, announced
that the earth rotated around the Sun instead of the previous view
that the sun rotated around the Earth and was persecuted for his
heretical beliefs.
Motions In The Universe
As was stated previously, each body or object in motion has
the tendency to remain in such motion at the same rate of speed
until interference forces a change. Years ago, men thought of
building a machine which once set in motion would continue this
motion indefinitely. They over-looked the fact that each motion is
subject to retardation, unless an additional force is given to the
object in motion that is able to overcome the retarding forces. A
swinging pendulum would swing eternally with the same speed as
it started if the resistance of the air and the friction caused at the
point of suspension did not gradually nullify this live mechanical
Page 10
force. It constantly needs additional mechanical force, new power.
Therefore, it is humanly impossible to construct a machine that
could produce excess energy which, would enable it to stay
continuously in motion. All experiments to build such a machine a
perpetuum mobile, had to fail; the law of Substance proved the
truth.
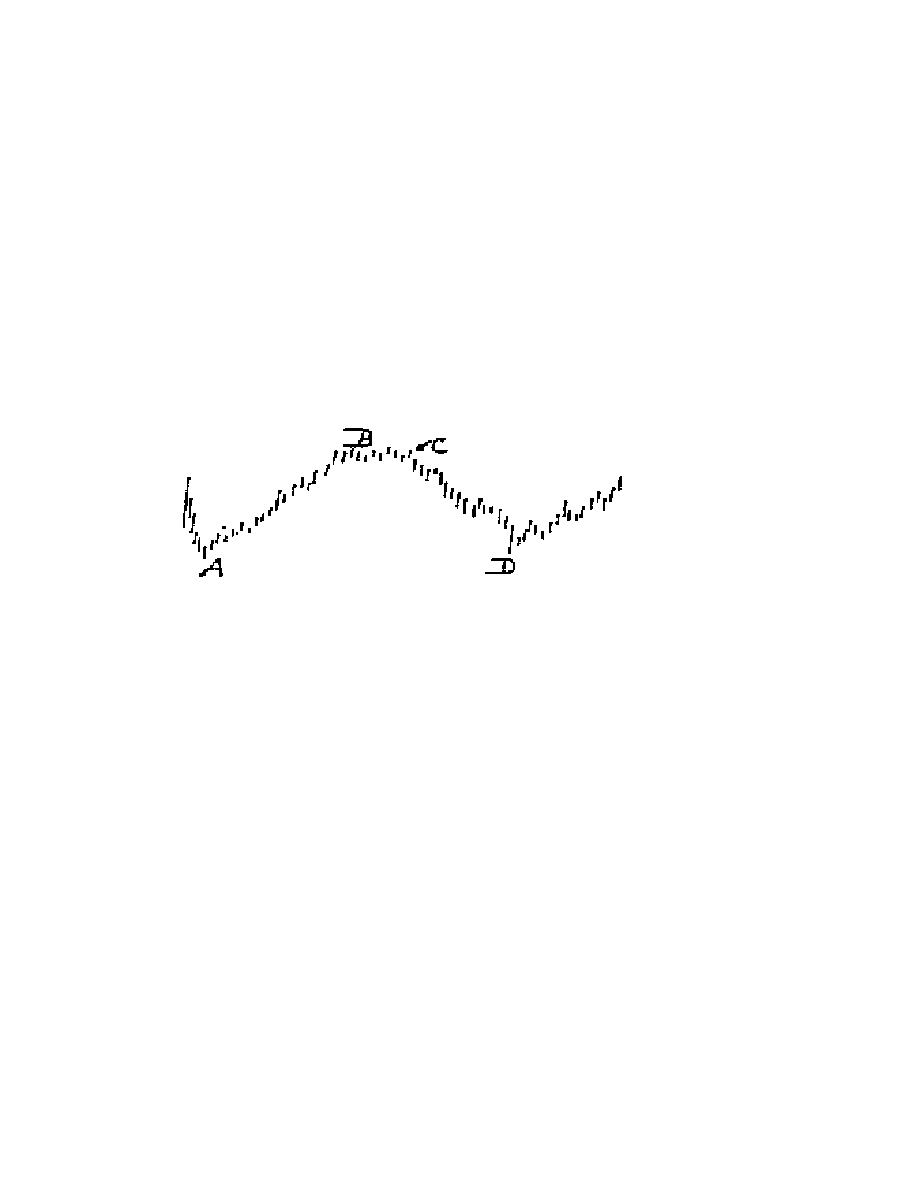
When we plot the daily or weekly motion of a single stock,
we quickly recognize that similar laws are in force. The picture
below shows a sketch of a daily high and low chart of a stock.
At point 'A', some impetus caused an upward motion in the
price of the stock. The motion gradually diminished in force,
causing at point 'B', a stagnation - traders are awaiting a new
movement whose direction is unknown to them. At point 'C', a new
movement begins causing a decline in prices and this decline kept
up until, at point 'D', something made the stock turn upward again.
It must be understood that the price of a stock is caused by
the desire of some person, somewhere to want that specific price. It
may be termed the free-will decision of men. The decision
originates in his mind. During sharp declines all around a large
number of people originate in their individual minds the desire to
sell stocks. When the turn arrives for the upside these same people
or others want stocks again and they buy them at their free will, at
a price others are willing to pay for them. In whatever direction the
Page 11

"free will" of the majority moves, in that direction will the price of
the stock move. However, it cannot be denied that at A, B, C and
D, some outside force and not freewill brings about the change
intake mental attitude of the public, although this outside force is
invisible and insensible to them. We ultimately have to ascribe the
movements of stocks to well known motions in the Universe that
control the "free will" of man. Later on we will get acquainted with
them and we will find means to measure them.
It is different, however, when we consider the infinite
Universe being in eternal motion. The infinite matter which
objectively fills the Universe we call space, the eternal motion of
the same time.
These two forms convince us of the infinity and eternity of
the Universe. This includes without further explanation the fact
that the Universe is a perpetuum mobile. This big machine feeds
itself with eternal, uninterrupted motion. Each obstacle is removed
by an equivalent energy, since the sum of the actual and potential
energy remains eternally the same. The perpetuum mobile is only
possible for the whole and not for any part of the Universe.
Therefore there is no accident in the Universe. Everything is,
because it has to be.
Let us observe the heavenly bodies. We notice the circular
motion, or rather the elliptical motions of all of them. Satellites
move around planets, planets move around Suns and Suns move
around still greater Suns. An extension of the analogical chain
renders it extremely probable, not to say certain, that all the
secondary bodies in universal space revolve in common around
one great centre, the primitive centre or Source of Attraction. If
this be the case, then whatever particular movements the secondary
bodies may have assumed from the development of forces of
internal forces peculiar to themselves, are subordinated to the great
central source of movement, and the forces by which they occur
are only reproductions in specific and modified forms of the forces
Page 12
which primarily pertain to them.
The forces producing these primitive rotary and orbital
motions in the Universe are the final source of all these diversified
ramifications of circular or elliptical movements which are
manifested by subordinate systems, Suns and planets, so the orbital
and rotary motions of the planets are the more immediate parents
and dependencies of still more diversified and minute systems of
circular development, which include stock movements, wheat
movements, cotton movements, in price as well as in volume of
transactions.
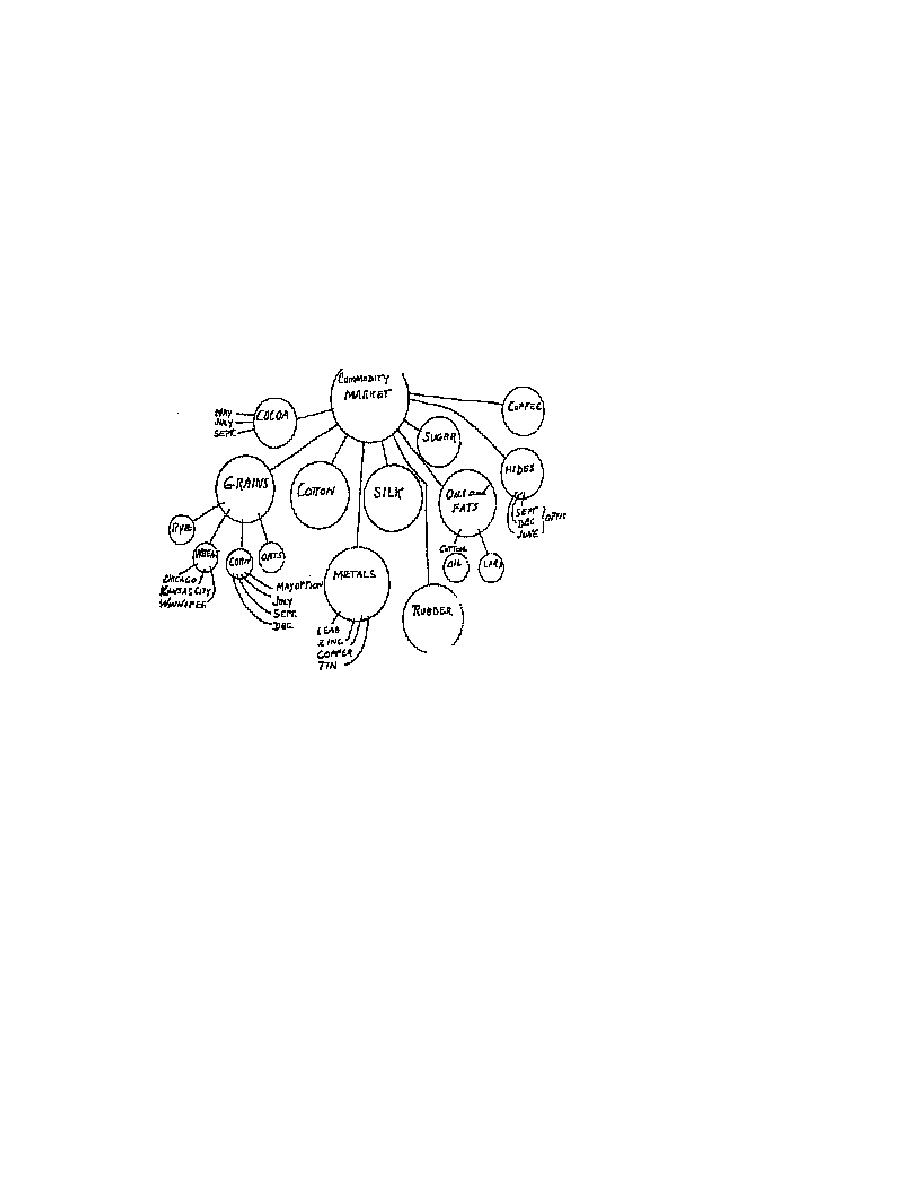
Considering the stock market as a whole to represent our
central Sun, the three main groups, the common subdivision
Industrials Rails and Utilities, to represent smaller Suns; we finally
find the individual stocks belonging to each group such as steels,
stores, coppers to represent the planets belonging to the specific
Sun system. The illustration below should show the relationship. It
partly should also explain why during one day of trading some
stocks are up and others down, individually as well as in groups:
Page 13
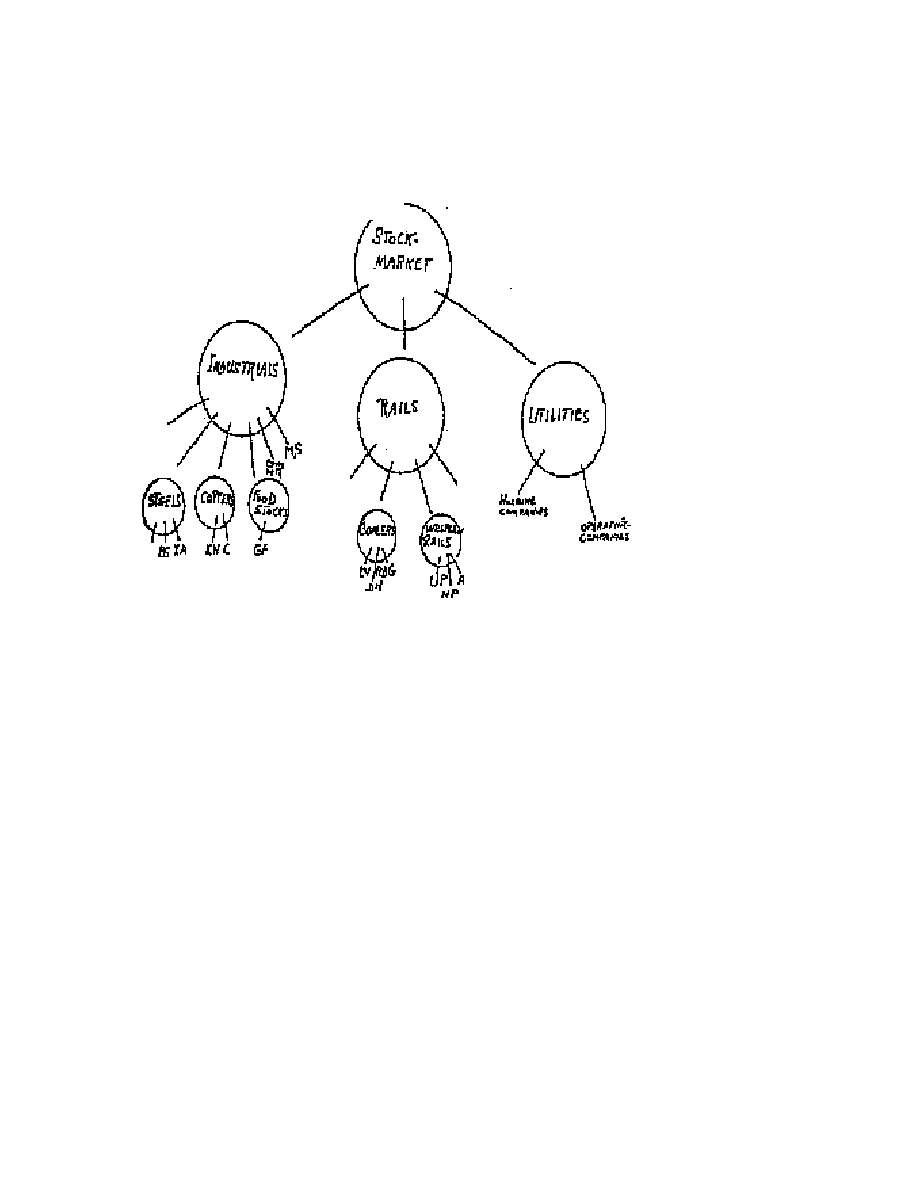
they have only distant relationship to each other.
From the orbital motion of the Earth, there is a continually
repeated circle of thermal changes, which mark the various seasons
of the year. These changes gave rise to the various annual series of
crops and other developments such as sickness etc.
Coincident with the changes of seasons are the periodic
awakening of certain animal instincts. We also can distinguish
seasonal movements in stocks as well as in commodities. The
changes occurring as they do, in regular succession and always
returning to the point of beginning, also typify a circle.
So from the alteration of day and night, with their successive
hours and minutes marking a diurnal circle, still more minute
circles of changes ensue in the condition of organic and inorganic
beings. These are the circles of wakefulness and sleep, of activity
Page 14

and repose, of organic replenishment and disposal of waste, with
all their immediate and transitional stages, whether we apply the
remark to the animal, vegetable or mineral creation, or to stocks
and commodities. It may be said that each metamorphosis, that is,
the passage from one degree to the other in the progress of any
complete circle of unfolding, involves a circle or a system of
minuter kind, until we reach the physiological function of the
organism of an ephemeron, to the circuit of blood and organic
deposits in the system of an anemaloule (?), or to the orbital and
axial revolution of an atom.
The progression from origin to dissolution of any system, or
of its change into another form, involves a circle. As we have seen
in the previous chapter, it is equally true of the Universe, of its
stellar and solar systems and individual worlds and of the further
ramifications of creation constituting the mineral, vegetable and
animal kingdoms, together with their various genera, species and
individual forms, respectively.
The minutest of these circles of movement and development
are, in some sense, dependent upon greater circles; and those, in
like manner, are included in and dependent upon still greater
circles, thus forming circles within circles, or wheels within
wheels. All are included in the Great Circle which comprehends all
movements and developments in the Universe from its periphery to
its centre, from the whole imaginable vortex of Being to a single
atom of matter, and from the origin to the very end of all material
things. Since it has been shown that there is no beginning and no
end to the Universe, but merely eternal revolution, then by
speaking of beginning and end, is meant a comprehensive circle.
The close of each comprehensive circle marks an era, not
only in its own history, but also in the history of its included
circles, which are to some extent dependent upon its state for their
own specific states.
As an illustration, the Earth, in completing an orbital
Page 15

revolution makes three hundred and sixty-five revolutions on its
own axis, occasioning repetitions of the phenomenon "day-night".
These days and nights or circles of diurnal change, vary as to their
lengths temperature etc., with the different stages of progress
attained in the annual circle of revolution.
As another illustration, stocks or commodities move from
bull markets into bear markets and from bear markets into bull
markets. Within them we find the intermediate swings and again
within those the minor swings, lasting from one to three weeks.
We even can distinguish still smaller movements, the so-called
"jiggles" encompassed in the minor swings, lasting from one hour
or two to a few days.
The whole Solar system, including our Earth, is swept around
a great common centre, which is so distant that a single orbital
revolution cannot be achieved in a period less than eighteen
million years. Such a revolution would constitute a Great Year or a
Great Circle of our own solar system. It is extremely probable that
the progress of this revolution will be marked with changes of
organic creation. The gradual alteration of the position of the solar
system in the sidereal spaces and the elemental changes consequent
thereon, may of themselves be sufficient in the course of time to
change the entire character of organic life upon our globe. Far
greater changes and still longer periods of time may be wrought in
the whole aspect of creation, physical and mental, by those
inconceivably stupendous revolutions to which all of these are
subordinated. It is by the combined influences of all other circles
of movement and creation that each particular circle is precisely
what it is; and whenever there is any change in the functional
operations of any portion of the system or of any of its sub-
systems, then, according to the law of sympathy, there is
necessarily some coordinated or co-related change in all the circles
of operation, included in this system however incomprehensible to
human conception that change might be.
Page 16

Nature, from its most comprehensive outlines as a whole, down to
its infinitesimal parts, is one compact system of co-related systems
which function harmoniously as the various but mutually
dependent pales of a most sublime and magnificent machine - the
perpetuum mobile.
The most conspicuous of the celestial phenomena is a
continual motion, common to all heavenly bodies, by which they
are carried around the Earth in regular succession. The daily
rotation of Sun and Moon about the Earth is fact admitted by
everyone. If the heavens are attentively watched on any clear
evening, it will soon be seen that the stars have a motion precisely
similar to that of Sun and Moon. To describe this phenomenon in
detail as witnessed at night is difficult, but we see the stars, while
they retain the same position with respect to each other,
undergoing a continual change of position with respect to the
Earth. Some will be seen to ascend from a quarter called the East
being replaced by others that come into view, or rise; still others
descend toward the opposite quarter, the West, and are lost to
sight. If our observation should be continued during the night with
the East on our left and the West on our right, the stars which rise
in the East will be seen to move in parallel circles, ascending
during the first half of their course and descending during the
remaining half. The greatest heights of the stars will differ but will
be attained towards that part of the heavens which lies directly in
front, called the South.
If we turn our back to the South and direct our attention to
the opposite quarter, the North, new phenomena will present
themselves. Some stars will appear as before, ascending, reaching
their greatest heights and descending; but other stars will be seen
further to the North that never set, and which appear to revolve in
circles, from East to West, about a certain star that seems to be
stationary. This seemingly stationary star is called the Pole Star
and the stars that revolve about it and never seem to set are termed
circumpolar stars. It should be noted however, that the Polar Star,
Page 17

when accurately observed by means of instruments, is found not to
be strictly stationary, but describes a small circle around a point a
little distance from it as a fixed centre. This point is called the
North Pole. It is in reality about the North Pole just defined and not
the polar star that the apparent revolutions of the stars at the north
are performed.
At the corresponding hours of the following night, the aspect
of the heaven will be the same; thus it appears that the stars return
to the same position every twenty-four hours. It would seem, then,
that the stars all appear to move from East to West, exactly as if
attached to the concave surface of a hollow sphere which rotates in
this direction about an axis passing through the station of the
observer and the North Pole of the heavens in a space of time
nearly equal to twenty-four hours. For the sake of simplicity, this
conception is generally adopted. This motion common to all
heavenly bodies is called their diurnal motion. It is ascertained by
accurate methods of observation and computation that the diurnal
motion of the stars is strictly uniform and circular.
Most stars constantly observe the same relative positions and
are called fixed stars, but there are also many stars, which
perpetually change their places in the heavens. These are called
planets or wandering stars. Each planet has received a distinctive
name, as have all the fixed stars. For convenience of designation
the planets are divided into two classes; planets, and planetoids or
minor planets. The former, in which we will be exclusively
interested later on when we analyse stock movements, comprise
Mercury, Venus, Mars, Jupiter, Saturn, Uranus, Neptune, Sun and
Moon, The first five, including Sun and Moon, are visible with the
naked eye. The others including the planetoids, can only be seen
with the aid of the telescope. The planetoids number over one
hundred.
The apparent motion of each of the planets is generally directed
towards the East; but occasionally they are seen moving towards
Page 18

the West. As their easterly motion prevails over the westerly, in
the process of time they all accomplish a revolution around the
Earth. The periods of revolution are different for each planet.
These periods, however, have no influence upon movements of
stocks, except indirectly, as will be shown later.
The Sun and Moon continually change their places among
the stars. The Moon completes one revolution around the Earth in
about twenty-seven days. The revolution of the Sun around the
Earth consumes three hundred and sixty-five days. The path of the
Sun during one revolution is not directly to the East. It has a
motion at the same time from South to North and from North to
South, bringing about the seasonal changes of summer and winter.
When the place of the Sun is measured from day to day, it appears
that its path is a circle, inclined about twenty-three degrees and
fifty minutes to a circle rustling due East and West.
The motions of Sun, Moon and Planets are for the most part
confined to a certain zone of about 18 degrees in breadth, ex-
tending around the heavens obliquely from West to East, which
has received the name ecliptic. The ecliptic is divided into twelve
imaginary parts, each one measuring thirty degrees, giving a total
of three hundred and sixty degrees for the whole circle. Each part
has a name, called a sign of the Zodiac. The count begins at the
fixed star gamma in the sign of Aries which point is called 0
degrees of Aries. The permanent sequence of the signs of the
Zodiac is as follows: Aries Taurus, Gemini, Cancer, Leo, Virgo,
Libra, Scorpio, Sagittarius, Capricorn, Aquarius and Pisces.
There is another class of bodies called comets, or hairy stars,
that have a motion among the fixed stars. They appear occasionally
in the heavens and continue visible for only a few weeks or
months. They shine with a disuse light and are commonly
accompanied by a fainter divergent stream of similar light called
the tail. The motion of the comets is not restricted to the Zodiac.
The bodies are seen in all parts of the heavens and move in every
Page 19

direction.
Telescopic inspection of the planets brings forth the fact that
some are constantly attended by a greater or lesser number of small
stars whose positions vary constantly. These attendant stars are
called satellites. Jupiter, Saturn, Uranus and Neptune have such
satellites. Planets attended in this manner are called primary
planets.
The Sun, Moon and Planets including their satellites and the
comets compose our Solar System.
From consideration of the apparent motions and other
phenomena of the Solar System, several theories have been found
in relation to the arrangement and actual motion in space of the
bodies that compose it. The theory or system now universally
accepted is that which is known as the Copernican system. It is as
follows: the Sun occupies a fixed centre about which the planets,
including the Earth, revolve from West to East in planes that are
slightly inclined towards each other in the following order:
Mercury, Venus, Earth. Mars, Jupiter, the Planetoids Saturn,
Uranus, Neptune and Pluto. The Moon revolves from West to East
around the Earth as centre. Outside the Solar System, and at
immense distances from it, are the Fixed Stars.
Extension Of Astronomic Laws
The planets, being the nearest heavenly bodies to our Earth, have
consequently the greatest influence upon the beings of this Earth.
This influence comprises the sequence and events of their lives,
their individual and composite actions. The science, which deals
with this subject is called Astrology, the oldest science in the
world.
Unfortunately, the "moderns" taboo this science as such.
They claim it to be filled with superstition to be mere charlatanism;
they give it any kind of name just to discredit it. If these blind
Page 20

millions would only know that the most read book in this world,
printed in any kind of language, found in any home, the Bible or
Scriptures, is just merely an old astrological book! The authors of
the Bible clothed the interpretations of the planets' motions into
stories that could be believed by anyone, King or pauper, learned
professors and little colored boys of the South. They believe it to
be true, but they don't understand it, neither one of them. These
“Wise men" are even supplied with printed maps of the countries
mentioned in the Bible for their deep study. If they would, instead,
construct these places as being parts of the division of the Zodiac
around us, they would get to understand what is meant in the Bible,
of which every word is true.
Practically all the laws and methods brought later are
exclusively based the astrological laws as shown in the Bible and
applied to our special analysis of calculating stock and commodity
movements.
As the planets move in ellipses, closely resembling a circle,
which of course is also an ellipse, we may assume that human
beings are also planets of infinitesimally small size, even though
restricted in their movements to the Earth. Therefore they also
move in ellipses as their lives roll off, influenced in their motions
by planets. It is a well, known fact that planets also are disturbed in
their motions by others, called perturbations or inequalities.
Astrological studies actually show that the lives of human beings,
of animals, of business undertakings, the prices of stocks, bonds,
wheat, cotton etc. all move in ellipses.
We will dwell at length with this subject in our discussion of one
of the methods, which teaches how to measure price movements
with the aid of fixed ellipses.
Page 21

The Stock Market:
One Of The Minute Wheels Of The Universe
Progress is the man thought with all of us. Hard work will
produce results. Persistent work will increase the percentage
remarkably. Most businesses are started in a small way and
expanded, at times with great speed, into nationally known
concerns. A good example is Henry Ford's enterprise. The answer
to such occasional rapid advance, i.e. the cause, is to be sought in
timely opportunity and knowledge. Opportunity represents the time
factor of the enterprise, more or less. It is the subconscious feeling
that urges a start at the right time. A straw hat sale for Christmas in
Brooklyn would not be the right time to produce results, but to
start a business whose products are actually going to be in big
demand, without the realisation of other people until too late, is
grasping an opportunity.
Knowledge, of course, is a great asset in any business. It
helps you to buy the right kind of merchandise; it regulates the
amount that can be sold within a fixed time, and it produces a fair
selling price. A baker would rarely succeed if he opened a drug
store. His knowledge would not be applicable in this field of
endeavour. Success would be lacking, no matter how hard he
worked because his theoretical and practical knowledge of that
specific business would be at fault.
Knowledge as we wish to express it, is the art of knowing
when to buy and what to buy, when to sell that which, was bought
at a profit.
To buy correctly you must first acquire a knowledge of
values. The knowledge of buying is much harder to acquire than
the knowledge of selling. "Caveat emptor'' - "let the buyer
beware", said the Romans. It is entirely upon you to judge value.
The one who sells undoubtedly brings forth all the good points of
the merchandise. You are inveigled through empty talk to buy a
pig in the poke.
Page 22

The advantage lies with you; as judgment falls to the buyer, you
have reason for selling. You know the good and bad sides of the
merchandise; you have them well separated. All your work
consists in telling the buyer the good points, painting the
merchandise glowingly, displaying it favourably, making it look
good to the eyes of the prospective buyers, talking about the great
sacrifices you are making and the unusual benefits the buyer will
derive from this merchandise that you are so anxious to dispose of.
Dangle the bait long enough, and the fish will bite.
The only bad feature is that all the sellers must sooner or later
become buyers again, These buyers will be prepared to eliminate
sales talk, for they will simply apply their knowledge and
experience to arrive at values. They will offer value for value; they
will ignore the bally-hoo used to increase this bare value, by
saying: "Now, let's get down to brass tacks". In the end, this bare
value will be accepted by the seller and the margin will have been
struck.
The great advantages of the seller without considering value of
merchandise, are manifold.
The seller can draw the attention of the buyer by:
making the explanation simple
making it believable
making buying easy and attractive
It must be understood, however that to be successful, i.e. to be
able to apply these rules properly, a thorough knowledge of the
article to be sold is necessary and thorough knowledge of the
average buyer's mind is essential.
This brings us to the realm of stocks and commodity values, the
subject to be treated in this work. The previous chapters were
merely the foundation for the laws that will be developed from this
point, and should some of the readers doubt any connection
between the previous parts and the markets, it will soon be fully
brought to light and its important factors proven.
Page 23

"Quack Quack" About The Market
The New York Stock Exchange is an organisation which,
facilitates an orderly and regulated exchange of values represented
by securities, stocks and bonds. In this work we are primarily
interested in stocks.
The exchange of securities is not made directly from a certain
seller to a certain buyer, but the transaction is made through
intermediaries, called brokers. They act as exclusive agents,
assuming no responsibility beyond the safe delivery of the
securities from the seller to the buyer. The seller remains unknown
to the buyer. One may be in California, while the other might be in
London. This agent or broker collects a fee for the services
performed, called commission. Both the buyer and the seller pay
equal charges to their individual brokers.
The actual trading is done between brokers. There are some
1500 brokers on the NY Stock Exchange who transact all the
business, no matter whence it comes. These brokers maintain
offices in all the important cities of this country and abroad. A
buyer or seller of a stock can go to any one of these offices and
place an order to buy or sell. All the offices have automatic stock
transaction machines, which register each and every sale made on
the floor of the Exchange just previous to its registry. This machine
enables the traders who visit the office to see the latest prices at
which stocks are selling.
The newspapers of the larger cities contain daily pages of
financial news, among which are the day's stock and bond
quotations, wheat and other commodity prices, together with
reports on earning and dividends of various companies.
Brokerage houses issue monthly booklets reporting high and
low prices registered by stocks for the month, including several
past months, preceded by the yearly high and low prices of several
years back. Besides these quotations, individual reports of earnings
of the corporations are listed. The radio is now also used as a
medium to disseminate information concerning the actions of the
Page 24

market. Investors' Services offer assistance and data on the market.
Most of them cater strictly to public demand, always
recommending the buying of securities, rarely suggesting their
sale. As we shall see later the public never sells short; in fact
selling securities is practically an unknown quantity to them.
The public prefers to buy dividend-paying stocks for the sake
of income. If a stock was bought at $50 and its dividend rate was
$2, it is held, even should the value of the stock drop to $5. When
the dividend is omitted, then it is usually sold. Appreciation and
depreciation of actual stock values seem to be secondary. As will
be proven later, it is just as safe to buy or assume a long position as
it is to sell or assume a short position, provided the transaction be
made at the correct time. The long buyer will lose just as much and
just as often if he buys stocks that are on their way to lower levels,
as will the short seller lose if the trend be upward and so force him
to cover his short position at levels higher than when he had made
his commitment originally.
We can group the people who buy and sell stocks into several
types. The majority are found among the "long pull" traders who
buy stocks at fairly low levels, pay for them outright and hold them
for years. They pass through some periods when they receive
dividends and through other periods when there is no return on
their investment. They see their stocks selling at $5 and at $150.
They hardly ever sell. Nothing can disturb their equilibrium.
Among this group, we might even place the Investment Trusts with
the possible exception that they do not buy stocks when they are
cheapest. They usually wait until stocks pay dividends, something,
which seldom happens when they are low in price.
Another type of investor buys stocks when they are thought
to be low; he does not discriminate as to the kind or the quality of
stock. These investors reason that if the market moves upward, all
stocks will rise including their own. They sell, as a rule, with good
Page 25

profits. But they also hold on to stocks that do not advance as
much as they thought they would. Included among these are stocks
that do not advance, but drop instead, the holders of these stocks
always hoping they will advance eventually.
A third type is the immediate trader who trades for swings of
a week or a month. A trader of this sort is faced with the problem
of judging the values of stocks he intends to trade, for he must
choose stocks that move with the trend, irrespective of the
direction such trend might have. When he thinks values are too
high, he sells and sells short; if he judges value are too low, he
covers his short position and switches to the long side. Such traders
pick active stocks as a rule, stocks that are traded frequently and
that have a great price range within a short time. Finally, we come
to the Board Room Trader, who remains at a brokerage from ten to
three, watches the tape carefully, reads all the news reports coming
over a special news ticker, listens to what is said here and there and
is ever ready to grasp a tip as to what the next move of the market
might be and what stocks could participate in it. This type
represents a hopeless case.
Visit a brokerage office and take a good look at the people
sitting around in it. Revisit this office four months later and you
will find that one half of the previous crowd is gone, but, strange to
say, substitutes have taken their places.
The ruin of this type of trader is overtrading. With limited
funds, the anxiety to make a few points to take care of other
obligations makes such traders take chances and risks that no man
in any business would ever dare take. He actually forces trouble on
himself. His commitments are made on the slenderest margin.
Should he take once in awhile some little profit, almost
immediately thereafter he meets a snag with a resultant loss. Such
losses upset his judgement so badly that subsequent commitments
probably prove wrong again. To extricate himself quickly, a
smaller loss is taken. Following the usual procedure, such traders
Page 26

invariably double their commitments the opposite way, but instead
of the stock proceeding in the desired direction, it moves the other
way and his consternation becomes so great and his losses mount
up so rapidly that he either has to step out himself, or, if he lacks
the will power to do so, his nemesis, the margin clerk will do it for
him.
This last type and the first type are the two extremes of stock
traders. Neither one will ever make money, at least not in the stock
market. They will not listen to reason; they are possessed with the
idea that they know all about the market themselves.
Only traders belonging to the second and third group can
make money in the market consistently. Both stand a good chance
to better their trading methods if proper stock market rules are laid
before them, and if they study these rules carefully. Each trader has
to overcome serious handicaps, be they in the form of personal
weaknesses or outside influences. Astrologically we would term
the former the natal horoscope; the latter, the Stock Market
horoscope.
Personal weaknesses include buying or selling on the
"hunch", on a felling coming from within the person. Personal
opinions are not feasible in the market except in a few outstanding
cases. Those people whose hunches are valuable are extremely
scarce. They are very rich and do not need advice or instructions
from any source whatever. Something within them tells them to
sell at the right time, just as it tells them when to buy. I know of
one such case, a very rich man of course, who impulsively bought
large quantities of stock between July 1st and l0th, 1932. This
same man talked to me on September lst, 1932, saying he was
selling stocks now because he was going to Europe. He left the
next day. The time he bought was the bear market bottom; the time
he sold was the first big top; stock had advanced twenty and thirty
points. He returned from Europe on Nov. 3rd, 193? (the figure is
missing in the original from which this copy was made) and
bought stocks the same day, fifteen and twenty points lower than
Page 27

he sold them for in September; that day was a bottom in stocks.
This man is no genius or wizard. He used nothing whatever to
figure what stocks should do according to underlying laws. He
operates purely on hunches, on his luck. There are a number of
people who could be as fortunate as he is if their efforts were not
spent in other fields of business. Relatively few are aware of this
great gift Nature has bestowed upon them.
All other traders and investors need advice or knowledge of
fundamental laws in their trading, some more, others less. But the
pitfalls of Wall Street are so many that losses are usually more
numerous than gains. Only experience produces results and only
knowledge of special laws, however far-fetched and strange they
may sound to the reader, will guide them right in the market.
The other great weakness is overtrading, previously
mentioned. Overtrading has ruined more people in Wall Street than
any other cause. Overtrading can be practised in various ways. You
overtrade when you buy more than your credit balance with the
broker allows. A normal move against your actual position will
force you out with a loss. Another way of overtrading is buying too
much stock of one and the same issue, especially if that issue has a
thin market. Whenever the market turns, necessitating liquidation
of position, it is likely that you will be unable to sell out in time,
without seriously breaking the market price in that issue. Larger
commitments, therefore, should only be made in stocks that have
large quantities of stock outstanding and in which the turnover,
during the period of your commitment, is fairly large.
In 1930, stocks such as WPU or VA were traded heavily and the
swings in them were large. At such time, you could have traded in
one of these stocks 5000 shares. Such quantity would not have
changed the price of the stock more than 1/2 point, even should
such sale or purchase have been made "at market".
Page 28

In 1935, however, you could not safely trade in one of these issues
with 500 shares, for buying would have forced the price one or
even two points beyond the previous sales price. Such selling
would have lowered the price two or more points below the
previous sale's level.
It simply means that while trading in WPU or VA was
technically correct in 1930 and 1931, it was wrong in 1934-1935.
Other stocks have become favorites, such as K, CTM, DOU etc.
Such favoured stocks are commonly termed "Leaders". These are
the stocks to trade and they should be traded until they cease to be
leaders, at which time commitments must be transferred to the
coming leaders.
Signs of disfavour are easy to discern. Gradual reduction in
volume of transactions, more moderate price fluctuations each
successive week. News about these leaders’ doings become less in
the financial section of newspapers. The public attributes this
strange phenomenon to the "they", or to pools, supposedly a group
of shrewd men who force these stocks up and down at will. This is
an illusion accepted for want of a better explanation. In a later
chapter we will touch on this subject again and explain the actual
cause.
Thirdly, overtrading is done when you scatter your
commitments all over the board, if you carry in your account all
sorts and varieties of stocks. Some people have rails, utilities, and
six or eight industrials to boot. How can they keep a record of the
actions in each of these stocks, when each individual stock moves
accordingly its own individual habit, when no two stocks move
alike, or even nearly alike? We can admit that the stock of one
specific group, such as oils rails etc. moves somewhat alike in
general. If an upward move in utilities takes place, almost any
utility can be bought; some will advance more than others, but at
least none will move completely against such a general utility trend
that is then developing. On the other hand, there are times when
Page 29

the industrial group will advance vigorously, while the utilities or
rails will have no advance, when in fact one of these groups may
be establishing new low prices, as was the case in the fall and
winter of 1934 with rails and utilities. We must conclude that the
commitments should be concentrated and confined to groups of
stocks, after the direction of the main trend of such group has been
determined.
These weaknesses are fairly easy to overcome. Overcoming
certain outside influences is much more complicated. To illustrate
properly, let us glance at page 12, where four rules were advanced
recognizing the advantages of the seller. The first rule was: The
seller can draw the attention of the buyer. The Stock Exchange,
like any other business, has to advertise its own members on the
Exchange. Such advertising is not done directly, but indirectly.
Daily newspapers and certain periodicals quote stock prices
regularly in conjunction with other financial items. As little as you
may be interested in stocks at the moment, seeing these pages day
after day, including Sundays, you will, at one time or another, read
some of these quotations. Possibly this may happen at a
psychologically important moment, at a time when you have sold a
piece of land profitably, when some unexpected inheritance was
made, or some other good fortune brought you excess money.
Seeking profitable employment for such funds, the daily repetition
of Wall Street reports "makes it easy to draw your attention".
The second rule was: The seller can make explanations
simple.
When your attention has once been brought toward the
market, then the glowing newspaper reports begin to prove
interesting reading and from the various plus signs on the quotation
sheet you quickly "understand" that profits can be made in the
market. It will not be long before you begin to calculate what you
would have made, had they been actual commitments. You can
understand that someone did make money - whoever it was who
was just carrying stocks at that time. The only personal
Page 30

disadvantage was that you did not happen to be that someone. This
little matter can be readily adjusted if you should make actual
commitments and become the owner of stocks.
The third rule was: The seller can make it believable.
The integrity of the NY Stock Exchange as an association,
and that of its members, is of course a pledge that the reports, as
given out, are true and the newspapers in printing these reports day
after day do not make many errors. The reports of earnings and
dividends of corporation whose reputation is above reproach are
made regularly. These reports are invariably true and are easy to
believe.
The fourth rule said: The seller can make buying easy and
attractive.
After thinking the matter over, weighing the advantages pro
and con and discounting the disadvantages, which are seldom
printed in the newspapers and hardly ever present in the public’s
mind, there seems fated to be some friend or acquaintance who
will gladly conduct you to his brokerage firm. Once you have
entered the brokerage office, indirect salesmanship is ended,
because you have been "sold" the idea of trading. From then on,
another circle begins to operate, entirely unperceived by you. This
one produces entirely different effects having a different purpose
behind it. We start once more with the four rules and apply them
locally, within the brokerage office.
First, the seller can draw the attention of the buyer. As soon
as you enter a brokerage office, especially in downtown New
York, you will be most bewildered at the number of clients sitting
around in soft, easy chairs, at the numerous employees running
back and forth, giving and taking orders, at the number of
telephones frequently in operation at the many desks. You will be
astonished at the quotation ticker, running across the "Trans- Lux",
a reflector and magnifier of the small ribbon, the ticker tape that
passes through a machine. This machine ticks off prices from ten
to three, continuously registering the sales. You will also be
Page 31

puzzled by the electric board which automatically registers price
changes and shows at the same time the opening prices, high, low
and last prices of the more important stocks, not to speak of the
odd letter abbreviations used for naming stocks. A click of a bell
from the news ticker will cause traders and customers to rush
towards it, read quickly the short message appearing thereon
concerning an important (or seemingly so) event that occurred
somewhere a few minutes earlier that may have a bearing upon
dividend action by a corporation, a report about the quarter inch
rain that drenches some county in South Dakota. When such is the
case, you will note the telephones going into action, spreading the
news to clients of the firm, so that they can be "guided" in their
market transactions while traders in the board room will write
orders, using the information brought by the messages to interpret
the coming move of the market.
There is no doubt that your attention is now be aroused fully
and you will begin to realise that large sums can be made in the
market. The result is that you think such an opportunity awaits you
as well as the next person.
The three remaining parts could be analyzed in a similar way,
but suffice it to say that there can be no doubt in anyone's mind,
not even in the broker's mind, that you will begin by making a
commitment in a stock this very same day and open an account
with his broker. Probably someone mentions that a certain stock
"looks" as if it would do something shortly and this suggestion
makes you one of the traders.
There remains just one paragraph open for discussion, the
one that is in everyone's mind: How can I figure, if at all possible,
what the market will do to-morrow, next week, so that I can
arrange my commitments properly? How can I determine the trend
in all this maze?
People enter the market full of pep, loaded with high spirits
and ideas of their knowledge and ability to beat the market, to do
much better than the other. Most of them lose their all in the
Page 32

venture. Some of them return again and again with fresh collateral,
but the story remains unchanged, losses continue. Nevertheless,
there is a considerable number of traders, who will stick to their
guns, try their best and make the market pay in the end. Yes, it can
be done.
The secret of how they do it is strange, almost unbelievable.
In the end, you will cease to worry how unbelievable a matter may
be according to your own conception, provided it helps you to earn
a sum of money. My writings will bring several interesting
methods as to how to proceed, when equipped with proper tools.
None of these methods claims to work each and every time
infallibly. By carefully studying each method, the combined
application of these methods afterwards will demonstrate when it
is safe to buy stocks and when it is safe to sell them.
There is no scheme in the market which, can work wonders,
unless we still know more about the Universe and about the Bible,
the book interpreting universal motion. The small, minor moves
are all parts of well-defined larger moves, cycles within cycles,
wheels within wheels. The time and effort that has to be expended
to calculate and find these small moves involves too great an
outlay to make them worthwhile. Many a time I have been able to
predict moves of an hour or two's duration, but the time to find
them required the work of many hours. It is best to understand in
the beginning, before going into any of the methods, that “jiggles”,
so-called, of a point or two are not calculated therein, nor is a
method offered as to how they could be found. Therefore, you will
not be able to buy at ten in the morning and sell at "Delivery
Time". But you should be able to buy to-day and know that the
trend of the market is upward even before the tape shows it and
you should be able to figure approximately when and around
which prices clouds of trouble will begin to appear.
The main laws to be explained hereafter are the "Time Laws".
Page 33

Price laws are also explained very carefully, but they must be
subordinated to the time laws. If the time is fixed for a change, the
price of the stock must be automatically near a top or near a
bottom, as the case may be.
----oo000oo----
Before explaining my methods on stock trading, let us touch on
methods commonly in use, some of which, no doubt, give fair
results when properly used, while others will make you lose money
gradually but surely. To make it less difficult, let us segregate
traders into groups again so as to be able to distinguish each group
and the methods used by it.
Group # 1 operates on earnings, dividends and on the
financial outlook of a corporation, represented by the stock listed
on the board. Most traders, Statistical Services, newspapers,
brokers, etc. use these reports as guides. Let us see whether there is
any benefit derived in using them as an indicator of the future
market trend.
Close inspection of reports published by the corporations
good or bad, and the immediate action of the stock representing
such corporation after publication, shows that a bad report may be
followed by a decline in the stock; it also occurs just as often that
the stock rises sharply immediately after publication. If the former
happens, newspapers and the public say that the bad news caused
the decline and they are satisfied with such a statement. On the
other hand, if, after publication of such news the stock moves up,
then they explain it this way - the bad news is put down and
discounted, which made the bears cover their short position; this
caused the stock to rise.
Both conditions happen, but which one is going to happen?
The explanation after it has happened is a mere excuse for having
no adequate reason. With divided sections, you will eventually
arrive at the same conclusion. Sometimes stocks rise, sometimes
Page 34

they drop. It must be clear that dividends do not govern the price of
a stock. Some of the best trading stocks do not pay any dividends;
some never paid a cent and some probably never will pay a cent,
whether able to do so or not. As an example, what right has NPT to
sell at 15 and pay $1.20 in dividends when on the other hand CIM
sells at 180 and pays nothing? The answer simply is that according
to certain laws, which the public and others do not know and do
not care to know, CTA is worth 100 while NPT at the time is not
worth more than 15, paying dividends or no dividends.
This group is completely at a loss as far as the trend is
concerned. When stocks are low and pay no dividends, this group
as a rule does not buy. They wait until dividends are resumed. At
that time, stocks have advanced manifold from the prices they have
been selling at and thus the best gain had been made. On the other
hand, stocks do not remove dividends until the bear market is
nearly ended. Investors for dividends are fooled once more and all
statistical prognosticators of market movements must search for
plausible excuses again.
The same virtues are to be found in car loading reports, the
numbers of blast furnace in operation, power outputs, the number
of spindles at work, steel tonnage reports, in fact all such statis-
tical reports that fill bulky volumes in brokers' offices, for which
millions of dollars are spent each year. To try and forecast
movements of stocks by these methods, you are on the side of the
past instead of on the side of the future.
Group # 2 operates on tape action. These people sit all day
long in some brokerage office, even have their lunches brought to
them, and watch one ticker pass sale after sale of all stocks traded
during the session. The multitude of the various groups of stocks,
such as alcohol stocks, good stocks, steels, rails, oils, etc., the
greater number of individual stocks being sold as the day goes by,
with prices being up an eighth and down a quarter from one sale to
Page 35

the next, is assumed as showing the trend of the market.
The ticker is the ideal place to lose your head and your
money. The great excitement that is created in the board room
when a stock has a quick in, carries you involuntarily along and
you follow the crowd automatically, most likely buying right on
the top of a move.
When, afterwards, a reaction sets in, you will notice that
these traders become very quiet. They have become quickly
disillusioned and their hope of an hour ago turns to fear. As the
decline continues, this fear turns into fright and one after another
of these traders places orders "at the market", to get out of the long
position, causing the final wash-out with resultant low prices.
Having taken a good sized-loss when they released their holdings,
the stock mockingly turns upward and prices rise again.
These is no cure for such losers because the ticker tape has
them so entangled that it leads them to certain ruin as the time goes
on. These people have an eye for nothing but the tape. They
attempt to be wiser the next time, but the tape seemingly knows
these humans better than they know themselves, and they fall into
the same holes over and over again.
There are no ways or means to help the tape reader in his
trading, to advise him to stay away from the tape and radically
change his trading. This does not imply the complete exclusion of
watching the tape. It simply means that the tape cannot be read, as
it is read by the tape reader. The tape has a very important duty to
perform and at times it is absolutely necessary to watch closely for
signs of change in the market. The tape should be used like a
railroad timetable. Use it to check the arrival of a new move, of a
new trend.
Group # 3 operates with charts. This group is way above
average in ability and intelligence. The work and study put towards
the making, reading and explaining of their charts is enormous.
Page 36

Perfectly good eyes are ruined and many hours that are needed for
recreation and leisure are devoted to their studies. These people are
very precise and painstaking in their work. The charts plotted by
them are pictures of artistic work. The charts are carefully planned
and laid out. These traders may be divided into two groups, the line
chart readers and the figure chart readers. Line chart readers have
special sheets with squared lines dated across the top and bottom,
allowing one year's entry.
The price of the stock is entered on the left margin keeping
within its possible price range. One square always represents one
point of the movement of a stock, one cent in the movement of
wheat, corn or rye, 10 points in the movement of commodities that
are traded in 100 points to be one cent. The three thin lines in
between allow for ¼, ½, ¾. The spaces between these are used to
enter prices of 1/8, 3/8, etc. The vertical lines represent days and
when a Sunday, a holiday arrives, or the stock has not been traded,
the line is discounted. The entries consist of the actual price range
of each trading day, the high and low price. A connecting line is
drawn between them. These lines set daily one next to the other
will give a picture of the stock's movement for the period covered
by the entries. The way the picture appears, deductions can be
made as to how the continuation of the future picture should look.
Besides these daily charts, students also keep weekly and
monthly charts the same way, entering high and low prices for the
periods, using one single vertical line next to the other to plot.
Thus, a weekly chart on the paper covers 31 weeks of the portion
actually intended for January.
The normal quantity of charts kept by chart readers is twenty
to thirty active stocks, but there are traders who keep two and three
hundred charts; some even keep the full list of stocks traded on the
Exchange.
There are also charts in use that plot sale by sale, wherein
each single sale is registered as shown on the tape during the day, a
Page 37

connecting line is then drawn through all the entries and
conclusions are arrived at from the picture such charts produce.
We also find charts of groups of stocks, called average charts.
These are made by taking a fixed number of stocks, adding their
high prices and their low prices, separately and dividing that result
each time by the fixed number of stocks used in the makeup. This
composite high and low price is then entered in the special chart.
The purpose of this procedure seems to be that chart readers have
noted that single stocks cannot be safely used to figure what
another stock could do, not even what it can do itself.
By taking a large number of stocks, the chances of being
wrong is materially reduced. The New York Herald Tribune
reports daily such averages of various groups such as: 70 industrial
stocks, 30 railroads, 10 oils, 7 coppers, 10 motors etc.
Hamershlag Borg, a brokerage house at 39 Broadway, NYC issues
for over 5 years three averages comprising all the listed industrial
stocks, rails and utilities aside of an aggregate of them all.
A good many chart students also make entries of the volume
of shares traded in the stock, which they plot. These entries are
made at the bottom of the sheet each day with a line, using 5, 10,
25000 shares to one square, depending upon the activity of the
stock.
There are many more average charts in use, such as the 20
minute average chart of 15 stocks, the 15 and 21 hours average
chart, all having the same purpose - the attempt to find future
movements.
Offhand, the interpretation of line charts looks very simple.
Several books have been written on their interpretation and
periodicals have run serials on it; courses on chart readings are
offered by experts. Looking at several line charts you can see some
ten distinct formations of importance being formed with hundreds
of varieties of each such formation. These formations, of course,
Page 38

are brought about by planetary constellations in the heavens. As
they change or repeat, the chart picture will change and repeat.
The most important ones are double and treble bottom or top,
ascending bottom or top, flag pole and flag, triangle formation, etc.
Each and every one, though, presents the problem - is this a bottom
formation or is it a top formation - in as much as both look alike
and the market could move either way.
We are always confronted with the same question. That is why if
you visit chart readers, chart interpreters who have been studying
charts for years and who are equipped with plenty of experience,
they invariably put this question: what do you think of the market?
What do you think will come out of this formation?
Why do they ask such questions? Because they cannot read
what they wrote, the little that is to be read from charts, and not
believing that planetary motions are behind these movements, they
cling to this little with astounding tenacity. Of course, they are
much better off than the tape reader, or the operator on crop
reports. They freed themselves almost completely from the
influences of news reports, outlook, even of tape action. They
know that these indices do not move the market one eighth of a
point, But they do not know how to get to the only missing link,
time, for then they could free themselves somewhat of the charts
they use, or at least change their methods of interpretation.
Closely related to the line chart reader is the figure chart
reader. He also keeps charts, but in an entirely different way. He
uses the full numbers at which stocks sell, ignoring fractions
completely, although these are of prime importance to the line
chart reader.
A stock moving upward, selling at 58 or any point between
58 and 58 7/8 is considered merely as 58. A stock dropping and
selling anywhere between 58 and 57 1/8 is considered as being 58,
Page 39

but not 57. Note carefully the distinction between up move and
down move. On the way up, a stock must make 59 in order to be
entered into his chart as 59, and on the way down, a stock must
make 57 flat in order to be 57. As the stocks move up and down
during one day's trading, the prices are carefully noted and always
an entry is made when a full number is reached.
Supposing a stock has a sharp run-up from 52 1/2 to 59
without a reaction, i.e. the stock would not react but fractions of a
point, but never a full number during the move, then all these
numbers are compiled and pyramided above each other in one
single row upward: 53-54-55-56-57-58-59.
Since the stock had a bottom of 52 ½, no entry was made for
52, in as much as the full number was not reached. When a
reaction sets in from 59 to 56 1/8th, then he enters in the next
column the numbers 58-57, but not 55 because this was not
reached.
Supposing the stock moves then to 57 3/4, he does not make
any entries because the price would have to be 58 to require an
entry in the next adjoining column. If the stock, after making 57
3/4 drops to 55, his entries would then be 55-56 and be placed in
the original column in which the 58-57 is found entered at the
beginning of the reactionary movement. The line would therefore
read: 58-57-56-55, underneath each other. In this way a chart is
formed which is full of numbers and which assumes a certain
shape and form.
Plain squared payer is used to make figure charts. The
squares must be large enough to enter the numbers (or check
marks) within. In these charts no distinction is made of one day
and the next; one move is added right on to the other, i.e.
continued.
The interpretation of the figure charts is about as follows: a
long row of numbers side ways, when broken either upward or
downward, means a movement in that direction and the extent of
this movement should be as many points as the previous formation
Page 40

contains points across. Supposing we have a formation in a stock,
which moves side ways between 59 and 55. The number of
columns next to each other total seven. At no time had the stock
gone out of this range. Touching 60 or 54 gives the indication that
the stock should run seven points upward from the point 59 or
seven points downward from the point 55.
This method looks very easy and promising on the surface
but sad to say it rarely works. Most of the time stocks, cross the
resistance by a point, turn immediately around and move up seven
points exactly in the opposite direction. The chart reader, having
bought just when it crossed the line, finds himself quickly eight or
ten points in a hole, unable to extricate himself without great loss.
This is another method which requires plenty of work, consumes
time and effort and the results obtained are to say the least,
mediocre.
Group # 4 are the lucky ones, whose feelings run in the
direction with the market. Great care must be exercised by these
people to constantly be on the alert, lest their rhythm gets
temporarily out of step. People have no absolute guarantee of
infallibility. Livermore and Lamar could be cited as outstanding
cases of such lucky people who happened to get out of step with
the market. They overlooked the underlying causes and reasons for
such strange occurrences.
There are, of course, many combination types in existence.
One thing they all have in common, with the possible exception of
group # 4, is that they all try hard and study methods to beat the
market. Some people use their own initiative to invent mechanical
methods of their own. I know of one special student who carries
some 52 such homemade methods composed of the queerest, most
unbelievable combinations called indexes. He has fine results, but
twelve hours of the day are taken up to keep them going.
The so-called Dow Theory, another method of finding
movements, says that if the averages of industrials and the
Page 41

averages of rails are plotted and compared they will be seen to
move either up or down together and the main trend of the market
is in the direction indicated by their movement. The trend will
remain in that direction, until one of the averages stops following
the other, i.e. until one of them turns the other way. It will not be
long, when the other average will also turn around and follow, thus
confirming the former and causing a top or bottom of major
importance. In Wall Street it is said that one must confirm the
other. This theory does not work at times. Often one group of
stocks (rails or industrials) stops advancing or declining which,
according to the theory, would indicate a coming change of trend,
but original direction. If one acted on such indications, the results
would be dismaying to him.
To get closer to our problem we must advance the question of
what makes the market move? According to universal law, there
must be a cause else it would remain quiescent. Supposing we have
an up move and the market finally turns downward, there must be
a reason, a very good cause for it. Only buying and selling causes
changes in the price structure, supply and demand as some like to
call it. Therefore there must be on the one side increased buying
and reduced selling, and on the other hand increased selling and
reduced buying that forces prices down.
The reason for these changes, is evidently to be sought in the
change of opinion within the people themselves. Something must
cause them to feel that this week they want stocks. Very few will
part with their commitments; those holding stocks may desire to
buy additional stock. There is thus created an over weight on the
demand side and an under weight on the supply side causing prices
to rise. It operates similarly the other way. Supposing prices have
gone up substantially. Suddenly a strong apathy to the acquisition
of stocks spreads among the public. This will cause first stagnation
invoice at these high levels, combined with great volume but
Page 42

without further progress. As selling increases and people become
negatively stock-conscious and buying is reduced, we run into a
sell-off. Should there not appear, in the meantime some desire to
re-buy stocks, then the selling will keep up with increased speed,
finally producing a terrific drop, until the desire for stocks arises to
stop it.
Buying or selling of stocks is not an organised business to
make concerted action possible. New York, San Francisco, London
and other large operating centres are too far apart to effectuate any
man-made understanding even between a few. There are over one
thousand stocks listed on the N.Y. Stock Exchange.
If the market is in an up trend, probably all will rise and if the
market is in a down move, they all will drop. From this we can see
that what is designated as a pool surely cannot move the market.
But, just let the Sun in the heaven get into an angle of 120 degrees
or 90 degrees or 180 degrees to the planet Uranus and you can see
fireworks right in the market. We have Tables available that tell us
when the angles are due, the date and the hour and minute,
showing it long before.
If there were such groups of men in existence, called pools,
they could not move even a single stock in the man-desired
direction unless it happens to be the direction of this special
something that agrees with such direction. There is not enough
money to stop an undesired advance or decline by a pool or by any
other method of combination.
Let me remind you of the failure of the government in 1931,
when it attempted to hold wheat at the dollar level. The
government with its huge reserve formed a pool to keep the price
at this level. Nevertheless wheat reached 40 cents, my indicated
price at that time, government or no government. The specific Law
of the Universe wanted wheat to sell at 40 cents and not at $1.00
and it sold at 40 cents. This planetary force is so tremendous and
so sure of itself and of its operations and so easy to detect,
inscrutable though it may be as Nature is herself, that people just
Page 43

seem to be blind when it is attempted to explain that force.
To illustrate similar cases harbouring the same phenomena
i.e. planetary forces, let us look back a few years ago. From 1913
to 1922, land in Florida was sold for the proverbial song then
suddenly everyone wanted land in Florida. Most of the people who
were subject to this special planetary combination that centered
over Florida that time had never seen Florida. Just the same, their
desire for land in Florida was not to be denied. Land prices rose to
unbelievable heights.
A friend related his experience to me. He had sold ten lots
and three houses, just completed, at extremely good prices. He had
four lots left and two houses which were just being finished. The
next afternoon, he went to see his agent to discover why new
prospective clients had not called on him, as he wished to close out
these holdings. This broker revealed the fact that there seemed to
be something strange in the air. Each day he had his office filled
with clients, but at present there were none. Sellers seemed to be in
abundance, but there appeared to be a dearth of buyers. If these
two men had known more about Nature and its secrets they would
not have been surprised. The time for the Florida Bubble to burst
was approaching, and what a burst it was. This man owns the lots
and houses today yet. He never could get rid of them. The urge to
acquire property in Florida had ceased, but there will be a time
coming when Florida land will be wanted again and this time could
be determined, provided certain data were known.
A similar case is worth noting. It may be compared to a
double top formation in stocks such as the peak of 1929 in
September and the second and last top of April 1930.
Consider Napoleon Bonaparte. The unknown Corsican took
the leadership and pulled France out of the chaos of revolution. He
proclaimed himself Emperor and conquered nearly all Europe. He
was admired, praised, and rose to great glory. Suddenly came his
Page 44

first defeat, Moscow. His final defeat at Waterloo followed a
steady decline in his fortune. The mighty had fallen.
The cause for his rise and fall was invisible, though ever
present. Until the Moscow episode, Napoleon was wanted.
Anything he said, anything he did, was right. The event "Moscow",
began his downfall. People lost all desire for N.B. They had no use
for his previous achievements or for his leadership. He dropped to
a personal bottom. He had tried with all his willpower to stem the
tide that ran against him. He fled from his first place of exile the
Isle of Elba. Once more he assumed the reins of France, saying "I
must". What followed is history.
Another interesting case should be the so-called Bulb craze in
Holland shortly after the Thirty Year War, 1618-1648. Ho1land
and the rest of the world wanted tulip bulbs. Prices went up
spectacularly. Certain black tulip bulbs rose in price from a few
guilders to over one thousand guilders for a single bulb. Farmers
exchanged their land for a few bulbs. One nice morning there were
no buyers; the bulb craze had ended. Prices found their normal
levels again, just as in the case of Florida land, in stock prices or
anything else.
Do you imagine that all those people who bought land in
Florida, bulbs in Holland or stocks on September 3rd 1929 were
insane, incompetent? Far from it! They merely followed an
impulse, which the strange, inexplicable planetary forces imparted
to them. They could do nothing else. Someone had to buy the last
share at the top of 1929. They did not know of the forces and of
their effects. They could not evade it, because they were in this
world at a time to be influenced by these forces. The lucky ones, in
whom these strange forces produce contrary feelings, bought at the
inception and sold at the end. They seemingly felt troubles brewing
and were ready to face about. These people took short positions in
stocks around September 3rd 1929 and held these positions till
early July 1932.
Page 45

Those who have one authority to calculate when such forces are
about to assert their influence can act according to these
indications.
Neither earnings nor dividends, neither charts nor ticker
quotations nor any other measuring sticks, which people use to
find "trend", showed the debacle of 1929 and nothing could stop it,
alter it or postpone it. The weather during the fall of 1929 was
ideal, the same as any other fall. The health situation of the country
was normal. No war talk was rife, no bad news broke during this
period. But the market broke for fully 2 1/2 years. Most stocks
went lower than the monetary rate of their dividends a short while
previously. The mind of the public was so filled with prospects of
increased future dividends at that time, that the urge to buy made
them blind to any hidden trouble.
An inner voice, an inner force, the forces of the planets
around us, is constantly at work and it is this force which makes
people buy and sell stocks wheat or cotton. If this fact be once
understood, half the battle is won immediately.
Chart readers have a subconscious idea that in charting stock
movements they will discover similarities with previous
movements, hoping for exact repetitions of movements one or two
months later. This is a very fine idea if it would do so.
We merely look to the Bible for help. Genesis Chapter 10
shows us the big cycle of stock movements or any other
movements; so does Genesis Chapter 5, wherein we note that the
Adam cycle is 930 years long, equalling in our language 930
degrees of the motion of one certain planet. After the Adam cycle
is in operation for 130 degrees, the given age of Adam at the time
he begot Seth, another cycle makes its appearance and therefore is
in operation already 800 degrees before the former dies out.
Jupiter happens to the planet that is meant by Adam.
Dividing 930 by 30 gives you the answered how long the Adam
cycle must be. Thus we have to go with large time spaces as we go
Page 46

through the entire family of Adam in order to arrive at Noah.
Noah, being again the same as Adam, i.e. Jupiter, another cycle
starts that ends with Abraham. Abraham again is Jupiter.
Let us now turn to the first book of the New Testament, St.
Matthew, In Chapter 1, we find the subsequent cycles of Jupiter
beginning with Abraham. Verse 17 of that chapter tells us that we
have 14 Jupiter cycles up to David, fourteen more up to the
Babylonian time and fourteen more up to Christ, making a total of
42 cycles. The repetition therefore runs in fourteen cycles of
Jupiter, at which time elapsed we may look for similarities of
repetition of movements. You may not be able to "tie" this
statement with anything you heard before, but you are free to do
such research yourself and convince yourself of these facts.
That is why chart readers' charts are of so little positive value
to them, and why their charts get them often in and out just at the
wrong time. There are many advantages in having line charts.
Figure charts seem to be of much less value on account of the
difficulty in obtaining the required figures each day without sitting
at the ticker and no time count being taken into consideration. The
line charts are readily made from the daily quotation sheets.
Certain phases necessary to judge charts are found missing in
figure charts.
Let us get nearer to the interpretation of line charts as I have
been doing. Having years of experience with this analytical work
and having gone over many methods and varieties, which lacked
certain essential facts, I had to devise a homemade method that
was applicable in all cases. My methods are unique and surely
cannot be compared with any others, although they cannot claim to
be 100% perfect because I had to omit certain factors that would
require either personal instructions or a translation of the entire
Bible. The different methods propounded and developed hereafter
will be useful to those who wish to delve deeper into the subject
are all of my own personal research in the science of Astrology,
subdivision of forecasting stock and commodity movements.
Page 47

The methods must be used jointly and not separately. If one
method indicates an up move, it should be verified with the other
methods. Only when the major methods agree, can you enter the
market safely and make your commitments. To be out of the
market, in case of any doubt, is preferable to possibly being wrong.
This may mean the omission of a perfectly good move once in
awhile.
Parts of what you have read so far have been published by
me on June 11th, 1932. At that time, in the Introduction, I said that
the bear market for stocks was over now referring to the big
bottom of June 2nd 1932. Further I stated that very few perceived
this fact, but calculations showed it. We are already on the upgrade
and people can only set it for themselves when stocks would be
twenty and thirty points higher than the present prices, but that
would then be the time for a major reaction.
What did happen shortly thereafter? Electric Bond and Share
rose from 5 to 46; I from 21 1/2 to 52 1/2; DD from 22 to 46.
Nearly all stocks advanced by September 1932 to prices prevailing
in March 1932, from where the big decline had started. From that
point, a six months reaction into March 1933 ensued. The public
did buy in June 1932; they bought in September.
On March 4th, 1933, the day after the market closed (Bank
Holiday), I sent the following telegram:
MARKET REOPENING STOCKS WILL BE TOP; SELL
OFF TILL MARCH 30TH, FOLLOWED BY BIG ADVANCE.
The market did exactly as the wording of the wire forecast.
When the market re-opened on March 15th, 1933 stocks opened
with gaps upward. Top was made the next morning on very large
volume, when we turned downward once more until March 30th,
whence the present bull market began, This was purely scientific
calculating of the motions of the planets and their effect upon
traders. The methods that had been used to find it are all included
in the present work except one. The ellipse methods were used for
it especially. The planetary forces behind the market's movements
Page 48

were figured ahead for several years as to their importance,
weighed, interpreted as to the way the human brains would absorb
these forces and the way all traders throughout the world would
act. Continued studies of stock movements have proven
conclusively that human beings cannot influence the stock market.
Even though the SEC Senators and investigators think differently,
their views cannot possibly be accepted. The NY Stock Exchange,
its members, the operators and pools, are as innocent of rigging
this market or of putting false values on stocks as you or I. The
difficulties they face are to be sought in the fact that they are
unable to prove themselves "not guilty" as was the practice at the
time of the Spanish Inquisition. All human analysis of fact point
toward their guilt.
These strange swings up and down from a bull market to a
bear market have been of varying duration and of varying intensity.
This is primarily due to the position of the planets in the heavens.
Sometimes planets that influence a bull movement are closely
together with planets that influence a bear movement. In such a
case, a bull movement is short-lived, being cancelled when the
planets causing the bear movement begin to act upon the human
mind. The movements of stocks have a rhythm that is comparable
to other events that occur in this world occasionally. It proved
possible to time an event and the market, if it were so, had to prove
it by responding at the calculated time. Checking changes that
occurred ill past markets, the results responded to the indications
of the calculations blindly 82%.
An old proverb says: What you get in Wall Street for nothing
is worth just that, nothing. Only too true. That is the reason the
public buys a two cents newspaper to discover how to earn money
in Wall Street. They may splurge and spend a quarter for a
financial magazine, stretch on a lounge and figure profits by the
hour. Don't get such thoughts into your mind! While my methods
are safe and sound, they require work at the same time, good
judgement and a lot of patience. You cannot get rich overnight.
Page 49

Within a year or two, your funds should increase in proportion to
the efforts you put into your work.
Bear in mind that the tape does not give you any direct
indication as to future price movements of any stock. It simply
registers each sale as is made on the floor of the Exchange. It only
registers what has happened. It never reports future sales and it is
in the future transaction that you are interested when trying for
profits.
The news ticker reports news as received from various
sources; it collects, digests and offers for consumption political
events, commodity prices, average prices of stocks each hour,
outstanding news items, dividend actions and earning reports. All
these facts, while valuable if known beforehand, have lost most of
their value by the time they reach you, because everyone knows it.
Free property is hardly worthwhile. They should not be used
except on rare occasions as a guide to the market. Earnings and
dividends show past performance and the net profit of today may
turn into the net loss of to-morrow. The dividends declared today
maybe the last for many years to come. So we can see they have
nothing to do with the future.
Newspapers are primarily in business to sell news. The news
in demand by the public consists of good or spicy news. The public
dislikes bad news; there is too much of it in each individual's life.
Newspapers cater to public demand and give what is asked. The
public always seeks to buy. This fact causes newspapers to publish
earnings of corporations in prominent spots and to print headlines
when stocks advance sharply. It also requires them to deprecate
market declines and to print deficits of corporations
inconspicuously. It is obvious that such one sided treatment of the
market and its vital facts makes newspapers a poor source of
information to investor or trader.
Similar conditions exist among financial papers or
magazines. There used to run an advertisement for several years,
worded constantly the same. The reading was about as follows:
Page 50

“Which stock will participate in the coming bull market? We will
send you a list etc." This was printed while we were at the bear
market bottom; it was printed at the top in September, 1932, again
at the bottom in March, 1933 and again at the top in July, 1933
when the severe decline started. It occurred to me after a while that
these people tried to inquire of the public, which stocks would
participate in one of the bull markets that came and had gone
during the period of such advertising. We had some very serious
reactions, to say the least, during that period amounting to thirty
and forty points which can be termed small bear markets, at least
major reactions of a bull move. This is the average tenure of a
financial magazine. Always bullish, always hopeful of rising
prices. Some of them bring elaborate analyses of stocks based on
earnings, dividends and "prospects", the latter being the unknown
quantity. Such indices are of little value in regard to future
movements.
Brokers are in business to buy and sell stocks for clients.
They earn commissions by executing orders promptly and
efficiently. To ask for more would be unfair and out of place. What
you get in Wall Street for nothing... must be repeated again.
Your own knowledge about market movements is for specific
reasons not reliable or safe, at least up to now, you will sadly
admit. Therefore until the time you have mastered the methods to
measure movements, do not rely on it, do not rely on your
hunches, on your feelings as far as the market is concerned!
Lasts, but not least, do not listen to tips, inside information,
gossip. They are either of no value whatever, or they are given to
you so as to confuse.
The only way to make money in stocks or commodities rests
upon cold calculations of planetary movements which cause people
to like them or not to like them, determining that TIME..
You probably have friends of whom you are very fond.
Nevertheless, therewith be times when they get on your nerves,
when you rather wish them to be on the Moon. They may shower
Page 51

you with caresses, do anything in the world for you. Just at that
time, however, your heart is not set for such favours. Irritation may
cause you to be rude to them. Should you try to get rid of this
strange feeling, it may not be possible. Such conditions are simply
temporary cross vibrations between two tiny, weeny planets,
yourself and the other party. The man who knows that laws exist to
make you behave that way will simply leave you alone until this
condition has remedied itself in the course of time.
The great German poet, Goethe, expressed this idea in the
following verse:
Wie an dem lag, der Dioh der Welt verliehen,
Die Sonne stand zun Grusse der Planeten,
Bist alsobald und fort gediehen
Nach dem Gesetz, wonach du angetreten.
So musst du sein, dir kannst du nicht entfliehen,
So sagten schon Sybillen, so Propheten;
Und keine Zeit und keine Macht zerstueckelt
Gepraegte Formd, die lebend sich entwicklett.
Wolfgang von Goethe.
Translated into English this means:
As the Sun was placed in the sky greeting her planets,
the day that brought you into this world,
you began to grow and thrive according
to the laws which caused your life to start.
That way you must be; you cannot escape yourself.
Sybils and prophets revealed this long ago.
And no time and no power is able to destroy
such engraved form which develops while living.
Depending upon the positions of the Sun and of the various
planets, each life makes the start; men, animals, stocks,
commodities, corporation, ideas, everything "under the Sun" is
governed by this law.
Page 52

If the position of the Sun and planets be favourable, the entire life
in question will be a string of successes with very few
interruptions. The few "lucky" traders, who need no charts, no
calculations, belong to this group. Such favourable conditions
rarely occur and we are compelled to ignore them and consider
others. All living beings have their ups and dawns constantly, their
luck and misfortune, health and sickness, some more pronounced
than others, but changing from day to day, from week to week and
month to month.
When we read Chapter 3 of Ecclesiastes, we find the same
idea brought forth:
Verse l: To every thing there is a season, and a time for every
purpose under the heaven:
Verse 2: A time to be born, and a time to die; a time to plant,
and a time to pluck up that which is planted;
Verse 3: A time to kill and a time to heal; a time to break
down and a time to build up;
Verse 4: A time to weep, and a time to laugh; a time to mourn
and a time to dance;
Verse 5: A time to cast away stones, and a time to gather stones
together; a time to embrace, and a time to refrain from
embracing;
Verse 6: A time to GET and a time to LOSE; a time to KEEP,
and a time to cast away;
Verse 7: A time to rend and a time to sew; a time to keep
silence, and a time to speak;
Verse 8: A time to love, and a time to hate; a time of war and
a time of peace.
Counting these various times as given in this chapter we find
them to be just twenty-eight different times. There is a definite
cause for distinguishing 28 times and not 25 or 26 times. But this
belongs in another field and must be passed over.
Page 53

Among the "every thing", we must include all the stocks traded on
the exchange, all the various commodities, such as hides, silk;
cotton, foreign exchange, rubber, rye, flax-seed, wheat, etc. In fact
they present the very best picture of such ups and downs, of such
time cycles which we may call vibrations. You can see the big
major changes, health and sickness called bull and bear markets;
you can see the smaller swings, advances and reactions, within
these major periods; you can see the very small moves of eighths
and quarters joining one another, causing occasional irritations and
happiness. These produce cycles within cycles, irritations and
happiness. These produce cycles within cycles. The same
conditions actually occur in all things, including human beings, the
ones we are most interested in. These vibrations are the inner voice
which causes the buying and selling of stocks. It may be compared
to falling in love with a stock or, taking the other extreme, hating
it. This inner force simply pushes a certain number of people into
such sensations, enough to bring the stock to the intended price
level.
Many a man picks a mate who never would have been your
choice, You simply cannot understand how such a nice, good
looking...etc., normal and sensible man could do it. Nothing is
easier to understand than this. The vibrations of these two people
(the infinitesimal small planets) were at that time moment in
complete harmony with each other. Psychological or physiological
conditions, financial conditions, standing in society, or any such
minor differences between them do not change the vibrations at all.
Divorces and separations, also murders, are caused by those
opposite vibrations, the disharmonious forces, whereby love will
gradually, sometimes suddenly, turn to hate.
Human beings, looking for causes and reasons, are short
sighted; they delve into the things nearest and closest to their
minds, while the real cause is so great and so vast that its very size
makes it actually invisible.
Some people will understand these teachings; many will not.
Page 54

Their vibrations cross, therefore they will understand this line of
thought as little as they can grasp the idea of a handsome man
marrying a homely maid. In the market, they will continue trading
just as they always did. They will lose their money the same way
as they have lost it. Their vibrations will cross the vibrations of the
market forever and they will not try to rectify or adjust or follow
the market’s vibrations partially by eliminating their own. They are
to stay in the 18th vibration of Ecclesiastes.
The one who will benefit will be the one who realises that he
is not one of the "lucky" men whose vibrations are similar to that
of the market. He knows from experience that his vibrations cross
those of the market more or less. He knows or begins to understand
that he was born that way and therefore cannot escape this
condition. To circumvent this difficulty, he will try to measure the
market's vibrations in a scientific way and eliminate his own
vibrations as much as possible, i.e. his opinions. Such
measurement is possible and can be done. Once these vibrations
are calculated and plotted the only thing that remains to be done is
to buy stocks when the market's vibrations indicate a positive
action, and sell stocks when they indicate a negative action. This
sounds very easy, provided you have a point of beginning.
We have established the fact that stocks are subject to
vibrations brought about through planetary motions, which are
calculable; therefore the time of events when due can be
ascertained beforehand and the Scriptures corroborate this fact.
They even tell you of repeating cycles of long duration. Verse 10
of Ecclesiastes, Chapter 1 says:
Is there anything whereof it may be said, See, This is new?
It hath been already of old time, which was before us.
Doubtless you will now grasp that the "They" constantly met
with are a myth, and that pools have no influence upon markets.
When pools or groups of men strike the market right, you hear all
about it. You never hear about those who lose
.
Page 55

Do you know how radio waves pass from New York to Chicago?
You cannot feel these waves or vibrations. They travel unnoticed.
Similar vibrations come to us from distant planets and it is those
vibrations that influence everything on this Earth.
Tests concerning the development of the Universe show
seemingly that there exists no aim no special purpose, in the sense
of human reasoning. There is one possibility: everything seems to
be left to chance. One group, though, maintains according to their
teleological conception that the entire Universe is an orderly
cosmos and everything has its aim and purpose; therefore, there is
no accident. Still another group, according to its mechanical
conception says that the development of the Universe is a simple,
mechanical process in which we discover neither aim nor goal.
Herein everything is accident.
Applying these ideas to the market, the generalization
includes all the gamblers and most of the boardroom traders. They
take a chance. There is no aim or special purpose in the market
according to their way of reasoning; the market is simply a place to
buy raffles.
The group holding to the mechanical conception presents the
public as a whole. They feel as if the market were more or less a
mechanical gambling device, with or without merit, a regular maze
of abbreviations and numbers where, once entered into, the
machine can never be escaped without loss. This idea is held
before them so long and so convincingly that sooner or later they
take a chance; finally they try it and get hooked, swallowing hook,
line and sinker.
The group using the teleological conception, are the students
of market movements, the big traders and successful operators.
They know, even if they do not have the actual key to the
movements, that the market moves with a specific aim and for a
specific purpose; that after a rise, there must be a reaction; that
time is the most important factor in the movements; that laws
Page 56

unknown to them are the underlying cause resulting in moves and
fluctuations, volume, tops and bottoms. They know it is not due to
accident or chance.
Teleological conception is the right conception and it can be
proven, by checking the one hundred and forty-four years of stock
movements. According to science, the market is evidently neither
an organic nor an inorganic body. To me it is the most perfect
organic body; it is subject to health and sickness, happiness and
sorrow. The movements of the market, of the many influences
during the one hundred and forty-four year record of the
palpitations of its heart is uncanny.
This is impossible with human beings. First of all their span
of life is short. Secondly, to individuals, life does not seem to be
important enough to keep a daily record, and only big events are
recalled by them; they are uncertain enough as to the date of the
event to make it valueless for exact work. I have asked hundreds of
people the question "when were you born?" A few do not even
know the exact day of this event; most of them do not even know,
never having heard whether the time of their arrival was morning,
noon or night, not to mention the exact hour, minute or second. A
few morning seem to be able to give the hour, but the slightest
cross examination as to the source of that information makes them
shaky, so that it could have been morning or evening, a small
matter of twelve hours. With stocks it is different! Great care is
taken to note their admission to the big board. The day of the event
is published and the time is ten o'clock sharp. Whether they were
traded at ten sharp is immaterial; they could have been traded from
ten o'clock on if the planetary constellations required their trading
at such time.
Stocks are traded fully twenty-four hours a day, This includes
Sundays and holidays, even though actual transactions can only
occur between the hours of ten and three on weekdays. Gaps in the
market prove this contention. After the market closes one day, a
bad aspect between two planets may appear. (Aspects in this sense
Page 57

mean certain specific angular positions formed between two
planets, using the Earth as the centre of the angle.)
This aspect operates all night and by ten o'clock the next morning
the market opens with a gap downward, leaving a space between
the trading of the previous day and the opening the day following.
If such a bad aspect takes place during trading hours, it is called a
sharp sell-off. The same, of course, applies to the other side when a
good aspect arrives in the picture.
Let us see now for a moment what is necessary in order for
one to be a competent doctor of medicine. A thorough study of the
normal, healthy body and the study of the normal function of the
party that constitute this body is one part of the requirements. The
other part necessitates the study of the human body in a sick
condition, concentrating especially on those parts, which are
affected by the disease. A doctor has many advantages in
diagnosing symptoms. A healthy person seldom will come to him.
As for the sick, they will relate their pains to him, usually pointing
to the very centre of the ailment. They will supply him with all
sorts of information, the time when such ailment started and the
kind of pain felt. After carefully analysing the various symptoms,
he recalls similar cases and finally concludes what the sickness is.
He will prescribe known chemical compounds, herbs or pills,
which have proven beneficial for the body in their proper
proportions to remedy the situation.
Let us proceed to investigate the method the doctor of the
stock market, the careful trader and operator, has to pursue.
The patient, "market", does not talk; he does not give any
hints that something ails him, or if so, what ails him. He shows no
symptoms; on the contrary, he is the picture of health just before a
sinking spell occurs, and is deadly sick just at the time he is ready
for a big rise. Data or hints cannot be had; profits can only be made
in the market anticipating its sickness and its health quite some
time before their inception. With the methods to be explained
shortly you should be able to define such periods in a positive way
Page 58

a long time before they happen. Pills or medicines will never cure
our patient, "market", once it suffers an attack. It will have to cure
itself, which only a good aspect from the planets can bring about.
When you hear someone say: "They are supporting the
market'', it means some human agency is trying for the impossible.
Check back to October 1929, when "they'' supported
Bethlehem Steel. Unfortunately for the Corporation, the stock had
some rights outstanding just when it was selling around 90, giving
the stock holders an opportunity to buy additional shares at the
bargain price of $80 a share. They had to be taken up, i.e.
subscribed to, not later than a certain date in October 1929. The
general market was dropping at great speed, making new lows day
after day. Bethlehem followed them according to law. When
reaching 80, however some human agency stepped in and
"supported" BS. It never touched 79 7/8 or less, while the general
market kept on declining headlong. But the very day the
subscription period was over, and the new additional stock had
been taken up by the public, it dropped like rock. The human
agency had stepped back and had withdrawn. The public possessed
what it wanted at 80. The sluice opened, Nature took its course and
BS joined its companions in the valley. This may be called a
temporary rigging of the market, which, no doubt, did cost those
responsible for the delay of the laws of Nature immense sums of
money. They must have done so purposely; whether they achieved
their purpose or not does not matter here.
It is obvious that traders and operators must stay bearish as
long as the market has a sinking spell and they must remain bullish
as long as the market enjoys good health.
Another good example that parallels stock market
movements is shown in a case that happened two years ago in New
York. It is somewhat gruesome; nevertheless it brings home the
point which I am trying to illustrate. The NY Herald Tribune
reported that a Speak-easy had invested seventeen hundred dollars
Page 59

on the life of a man named Malloy. He was picked because he
seemed to have no friends or relatives and seemed to be feeble and
an inconsequent barfly, ready to succumb to alcoholism at short
notice. He had survived, it is alleged, quantities of bootleg
whiskey, tainted oysters and sardines, in which bits of chopped tin
had been placed, together with wood alcohol. It was the undertaker
who, becoming impatient at the delay in the maturing of the
insurance investment, asked if the vexatious permanence of Malloy
was proof against automobiles.
A party was collected at a speak-easy after Malloy had had
his daily dozen. That night they drove to Pelham Parkway with the
experimenters and the subject of their experiment, Durable Malloy,
limp from drink and looking anything but durable, was lifted out of
the car and supported in the middle of the road by two men, while
another back the car two blocks to get a running start at his target.
A woman seemed to have been watching the proceedings from a
window, so for the sake of protection, they drove to Gunhill Road
to attempt once more. The men supporting Malloy released their
grip too soon and Malloy, with the tenacity of life, which so tried
the patience of the syndicate, recovered his senses sufficiently to
leap out of the path of the automobile. They tried it again - and it
worked. Malloy was knocked down and run over as easily as any
other man.
All newspapers were scrutinized the next day, said one of the
participants in court, for an item concerning the death of Malloy,
but none was found. They searched the neighbourhood where they
had left him, thinking he might be there, but he was not. Then one
of the witnesses said they discovered by telephone that Malloy was
at Fordham hospital, recovering rapidly from his injuries. To save
time, however, it was decided to obtain a substitute a deputy
Malloy, and John Murray, another bar room derelict, was stupefied
with drink in the speak-easy. Malloy's papers and seventeen cents
were thrust in his pocket and they set out with him to repeat the
Page 60

experiment. Success came at last. The trio was executed at Sing-
sing. Malloy lived about another year and died of natural causes.
To return to our thought we can see that Malloy's cycle or
time was not up; however hard these people tried to do away with
him; they did not succeed. Nature prevented it. His planetary
positions at that time even though he was a drunkard must have
been wonderful, to say the least, in respect to his health, since no
human agency could bring about his death. On the other hand, the
second man was not so fortunate. His time was up; his cycle ended.
Nature provided a means in these killers to take care of that event.
This picture should show the reason why it is possible that a
stock in a big bear market is able to rise continuously. In June,
1932, AC, at a time when all stocks made new bear market lows,
was able to run up forty points inside of three days, from 37 to 77,
while at the end of October 1935, when the general market was
strong and moving upward, this stock took an eight point dive to
35. The easiest way to make money rapidly is to be able to analyze
individual stocks to find when such out-of-place movements are
due. This is, of course, the most difficult work.
As a guide to your aspirations for success in life and for
success in the stock market, do not use imaginary pictures, but
exact and well developed ideas. You will find that careful analysis
of most of your decisions proves that they are not conceptions of
judgement, but fantastic pictures. In youth especially, the objects
of our happiness show in the form of pictures which cling to us
during most of our life. They are just passing ghosts because when
you reach them they melt away. Experience shows that they do not
conform to what they promise. This is no more than natural if you
consider that only what you see and feel is something concrete,
while the abstract, the thoughts which produce general facts, can
only have effect in our will. Nevertheless, it is only abstract facts
that are trustworthy. This rule, when applied to the markets means
Page 61

that you must become master of the impressions you assimilate
over what happens on the tape and thus become master over what
you see. These impressions are tremendously strong compared to
abstract judgement, because the former play right in front of your
eyes, present concrete facts which work on your mind and disturb
your calm, your decision, your knowledge. When you watch the
tape, sale alter sale, it influences you with might. On the other
hand thoughts, decisions and judgements, need time and quiet and
must be mulled over and the wheat separated from the chaff. That
is why the tape rolling off before us from ten to three makes one
feel carefree, free from abstract thoughts, at least temporarily; at
this stage you believe the ticker is doing the thinking for you. It
seems beneficial, while actually it causes you to take the wrong
steps and you make concrete decisions.
For the same reason, it is very difficult to keep your opinion
firm and supposition steady when everyone around you, from
board boy to manager, is of a different opinion. They show it
openly and tell you about it, tell you how crazy you are, tell you
about their superior knowledge. Even if one is fully convinced of
their being wrong, yet one begins to wonder, waver and weaken;
one follows their trail and awakens with a frail bank account or a
margin call.
The cure to overcome this menace is to neutralize these
thoughts with opposite impressions. Say to yourself that you
analyzed the market situation for several hours last night whereas
these fellows have been playing golf in the afternoon and were
amusing themselves at night. It is impossible that they have
gathered any market knowledge there and that their opinions
amount to less than nothing.
Such procedures may be termed passive resistance. The
active resistances, is somewhat different. Most of those people are
egotistic. They give their advice to show off what they know, at
least what they think they know. Haughtiness, vanity and envy are
some of their negative virtues. To beat them at their own game,
Page 62

just remember that they only think of themselves. Every word they
say is capital "I". Every word you say is applied to their own
welfare, their ego; the slightest hint is constructed to suit them.
They look at everything in a subjective way. They cannot look at
things objectively, i.e. in an objective way. Therefore, they do not
allow opposition to work against their vanity, against their own
interests. They are easily hurt and offended, so that you must be
careful when you talk about the market as you see it; you might
hurt their tender ego; they might be long of the market, while your
calculations point downward. They could even accuse you of
causing their losses, as your devilish interference with the market
movement would surely get the blame for it. They do not worry
about you. They do not seek true facts, for they may prove
damaging.
There are many such creatures around brokers offices. They
are friendly; suddenly, one day, for no apparent reason as far as
you know, they no longer speak to you; they evade you. You must
have inadvertently stepped on their tender ego and they consider
you from then on their enemy. Their will is powerful, their brains
small; their little spark of intelligence is under the yoke of their
will, from which it is unable to detach itself.
Nothing flatters a man more than the thought and belief that
he does something of his own free will. It is unbelievable to him
that something else pre-destined his actions and that he could not
have acted any other way. People believe in man the master,
instead of man the mastered.
How else could it be possible to predict market movements
correctly. If people could act according to their own will, there
would be no market. A few moguls would have driven stock prices
to ten and twenty thousand dollars a share, so as to concentrate all
the power under their control. In September 1929, I predicted we
would return to the 1921 prices; we went much further than that. In
an advice written December 12th, 1933, I stated the market would
drop until December 21
st
, a change would take place then and the
Page 63

market would rise until December 30th, 1933 and that prices
would return to the present levels, with a few stocks even higher.
This prediction was not guesswork, but the product of timing
planetary movements as they influence the great will power of
great men. Actions of large and small traders are zero compared to
these unseen rays.
It is very hard for a man, brought up and educated under
materialistic ideas, to conceive that bodies, such as planets, can
influence men, animals, plants, minerals and the stock market.
These materialists cannot believe that unseen forces are at work;
they only believe the concrete. It simply means: kindly change
your view! We live in a world of rays, and auras.
Everything that exists issues force. What sort of force? Sun
energy, nothing less. It is the energy of the Sun that permeates all
space belonging in this system. Every particle within this system is
saturated with solar energy. It consists of electricity and
magnetism, two opposing forces, power against resistance,
attraction against repulsion, creating unbroken motions, swings,
vibrations. Since the Sun sends forth energy constantly, attraction
and repulsion of every atom must take place. In this way, the Sun
is our electro-magnet, our giver of life, without which nothing
would be possible.
The faster the vibrations within a body of any description, the
warmer this body will be, since its motion or vibration produces
heat, Everything is alive; what we call death, equalling definite
destruction, cannot be found in this world. All is change,
revolution, return, evolution. Everything moves within a prescribed
rhythm. The best example is found in the motion of our planets.
We find life in the hardest, seemingly most lifeless bodies.
Just take an iron bar; it is hard, cold, seemingly lifeless to the
casual materialist. When heated sufficiently, we find there is life in
it. The cold, slow vibrations of its atoms and molecules get into
faster motion. The opposite energies, attraction and repulsion,
expressing themselves, become faster. Life runs quicker.
Page 64

The atoms look for room, expand; the iron bar becomes softer the
more we subject it to heat. We finally get a hot, sizzling, sparkling,
drizzling mass alive all over. As it cools off again, the vibrations
become smaller, less heat irradiated, dying away until it takes its
normal, Nature-prescribed vibrations, the one intended for each
substance, but, remember still vibrating, alive and only dead to the
materialist, a cold iron bar.
This very same law is found to be true for any stock or any
commodity and we may substitute the stock for iron bar and repeat
the story.
Minerals act the same way; plants show it more readily. The
leaves fold up to prevent evaporation, the flowers close at night to
sleep. They turn their pretty heads with the Sun. With animals, you
can observe these carnivorous beasts have strong vibrations. Stock
vibrations are only too well known for their queer vibrations. At
times the market is as gentle as a lamb. The ticker lulls all the
board room traders to sleep, while at other times it acts like a wild,
ferocious lion, upsetting not only traders, but the whole country,
from SEC to the bootblack. This is Sun energy, my friends,
nothing else! Let any one of your statistical specialists tell you it is
the favourable dividend action, decided upon by directors of a
corporation. What a poor, vapid excuse for the true, wonderful
cause.
The energy of the Sun penetrates everything. As each body is
different it will assimilate this solar energy in a different way and
in varied degrees according to its inherent ability. Each body in
space, even atmospheric changes, will also cause changes in these
bodies. You can notice it in sensitive people best. The slightest
change in the cosmos will make them change and the market is the
best barometer for such cosmic changes, expressing human
reaction.
As each body receives Sun energy, this same body must,
according to the law of attraction and repulsion, also radiate such
energy in turn, only in modified form; the body will mix the
Page 65

received energy with its own radiation and radiate this mixture to
its surroundings. This energy has been, so to say, revamped. An
excellent example is seen in the scent of flowers, transformed Sun
energy, Each flower ejects fine scent that is peculiarly its own to a
limited surrounding; it is called the "aura" of the flower. Human
beings also exercise such influences, possess such auras and spread
them upon their surroundings, sympathetic or antipathetic. In fact,
certain people have tremendous influence, good or bad, angelic or
demonic.
How much more energy must then be allotted to planets,
which are permeated with Sun energy, and how much stronger
must they act upon their surroundings? The distance of the planets
cause no interference, for these cosmic rays travel with lightening
speed. Their activity reaches into infinite space, unites with
energies coming from neighbouring bodies creating a mixture of
force, which strikes the Earth. As the planets constantly change
their positions in the heaven from moment to moment, these
combined cosmic forces will necessarily change the force contents,
the mixtures of the rays in the same proportion as they approach or
depart from each other, causing changes proportionately. Not all
people are equally subject to these cosmic rays, but they are
individually influenced according to their own organism. So it is
with stocks. Each body will constantly react to cosmic influence in
proportion to its physical body's original energy. This energy, in
turn, depends upon the moment of birth, the coming to life,
because such body must be in absolute agreement with the then
present proportions of energies disseminated throughout the
Universe.
If a person or a stock is born at the moment when Mars is in
square aspect to Jupiter, i.e. they are then 90 degrees apart, then
each and every time these two planets obtain a similar position in
the heaven, his body will feel this and produce highly increased
vibrations. These vibrations will always act and express
themselves equally and will be of a nature that is peculiar to Mars
Page 66

and Jupiter in such aspect.
Experiments made during the ascent of Prof. Piccard and
others into the stratosphere have definitely proven that cosmic
rays, whether coming from planets or from fixed stars, act day and
night and are of such intensity, that they are able to penetrate a
solid mass of lead one hundred feet thick, or a mass of water
fifteen hundred feet deep. We have absolutely no protection
against them. Every atom is penetrated by these rays, by these
vibrations.
The actual operation of these rays in reference to market
movements should now be clear. We must bear in mind that the
quality of rays differs, At times combination rays are evil in effect,
at other times they are beneficial. Supposing an evil ray is acting
upon the Earth. This same moment everyone upon this Earth will
be influenced by it. A scare will commence and the public will sell
stocks as fast as possible causing a decline. On the other hand,
when a beneficial ray is forthcoming, the public sees everything in
a rosy hue; it starts buying stocks with price no object. Such
conditions produce, if a striking of such rays develop, a prolonged
bull market.
Fortunately, these rays change from good to evil in fairly
equal proportions, which results in normal markets most of the
time. Some of these rays are weak others strong. The weak good
rays will cause small rallies the strong ones sharp advances. The
opposite is true of the evil rays. Weak evil rays cause minor
declines, while strong ones a break.
Due to the fact that the rays alternate and vary in intensity,
there is no definite saying when a major move is over. If we have
the sequences correct, we can safely sell all stocks just at the time a
bad ray is due and buy them back when a good one makes its
appearance.
The price of a stock is not important. It is the time that counts.
End of Part 1.
Page 67

Part 2
Methods Based On Planetary Motions To Forecast Stock
Movements And Those Of The Various Commodities.
When we get down to actual studies of the Bible and not to mere
reading, we notice that we find numbers such as seven, twelve,
forty and seventy repeating so often that their meaning cannot
possibly be what we understand to-day as seven, twelve, forty,
seventy. My work on this subject has revealed that the meaning is
degrees of a circle, so that when Moses remained forty days on
Mount Sinai we have to understand that Jupiter moved forward
forty degrees in the heavens.
Astronomical calculations show that Jupiter and its path as
seen from our planet Earth just about requires one year of our time
to pass an arc of forty degrees in the Zodiac.
In Revelation as well as in Daniel we find quotations of: A
time and times and half a time.
Revelations 12:14. And the woman was given two wings of a
great eagle, that she might fly into the wilderness, into her place
where she is nourished for a time, and times, and half a time, from
the face of the serpent.
This event tells us that at the time it was winter. The eagle of
the Bible always means the zodiacal sign of the Scorpion. The
Page 68
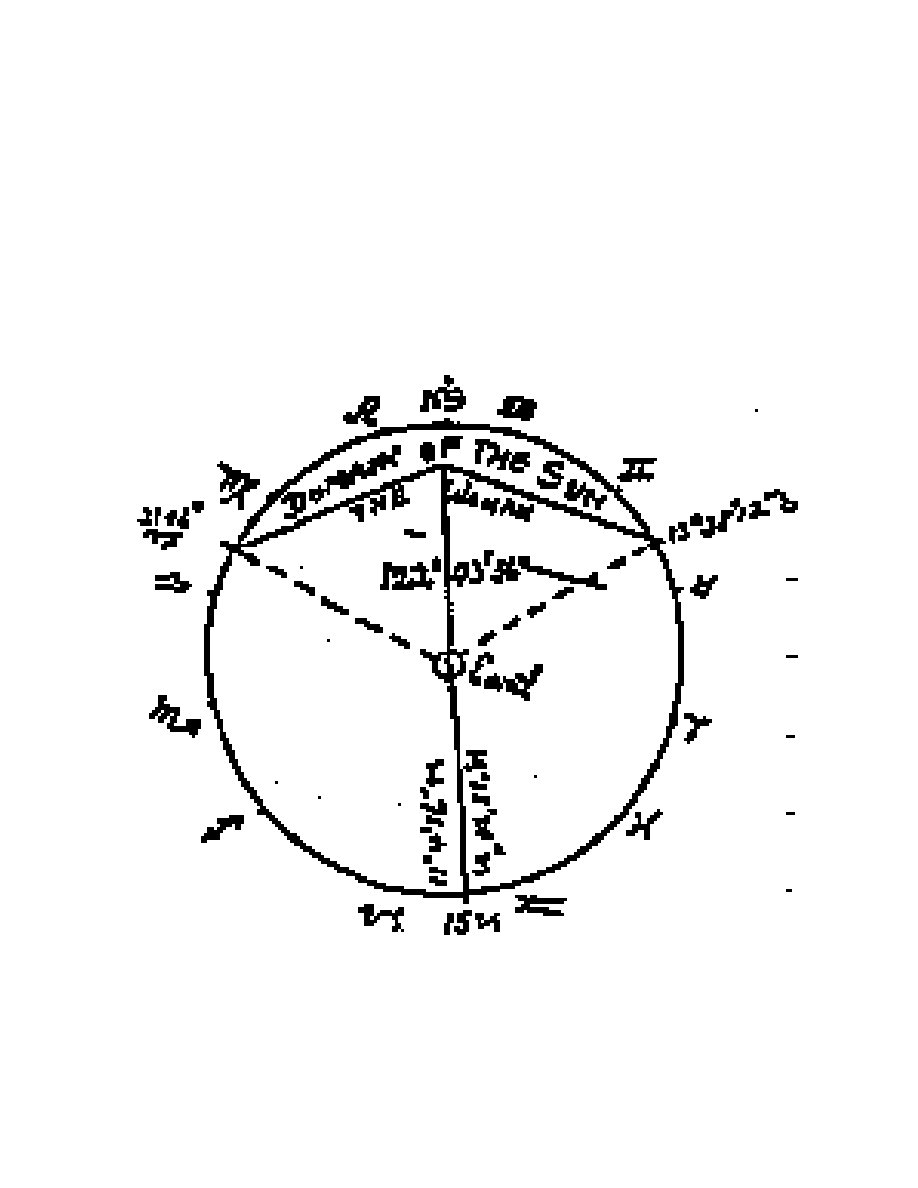
Page 69
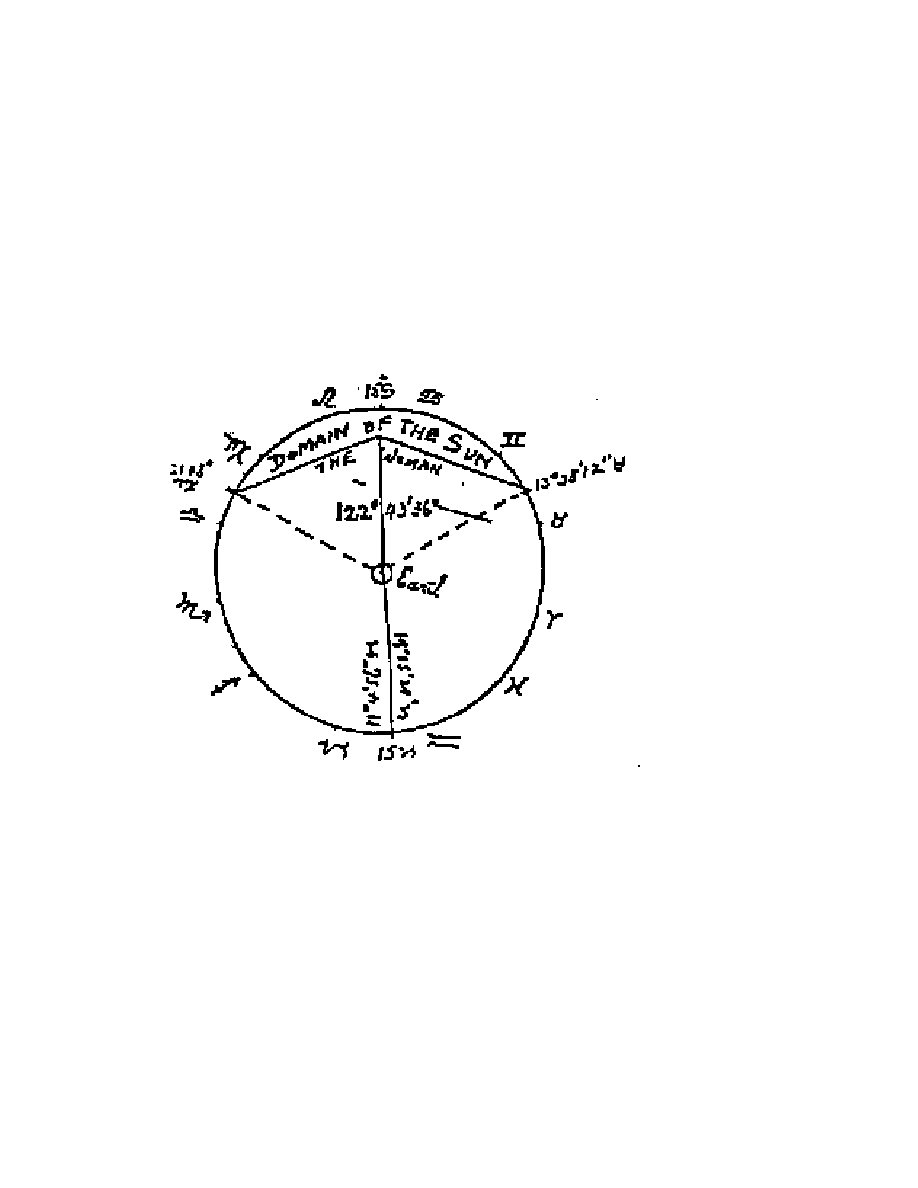
woman in this case represents the Sun, whose home is in die sign
of Leo. She flew into the wilderness, her place. The wilderness of
the Bible means the sign of Leo. She was nourished in her place
for a time and times and half a time, the value of which counts to
one hundred and twenty-two and one half. In as much as the
biblical circle is not three hundred and sixty degrees in length, but
extends to 368
o
10’48.0”, therefore the actual beginning of its
domain is at 13
o
36’ 12” of the sign of Taurus and the end at 16
o
21' 48" in the sign of Virgo. Jupiter and Saturn dominate the other
two portions.
Most readers are apt to ask what this has to do with the
market. The answer is contained therein and lies in the time factor
of the price movements for stocks and for wheat and for other
commodities.
Even those who have studied Astrology from textbooks must
be greatly surprised about the above statement, because no text
book brings anything about it. The textbooks use the circle of 360
degrees which is not the one the prophets used when they
Page 69
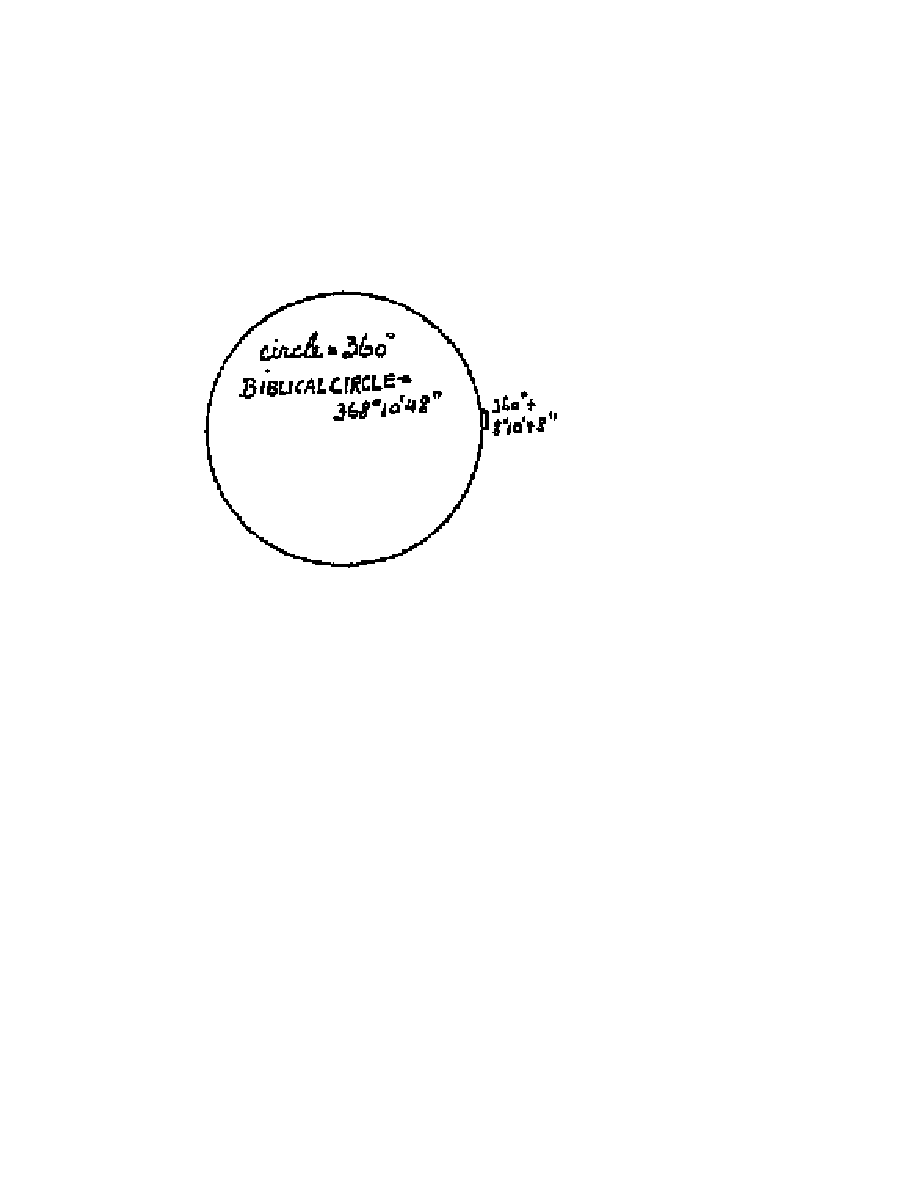
predicted events.
Analyzing further we find the unit of "Time and times and
half a time” to be 35. 1 time is 35; two times is 70; and half a time
is 17 1/2
. Adding gives us 122 1/2. 2 1/2 times representing 122
o
43' 36" or 1 time equalling 35
o
3' 53".
The number 35 (actually 35
o
3' 53"), the eighth part thereof
as well as the multiples of the same constitute the basis for distance
movements in stocks and wheat.
This law applies for the major as well as for the minor
movements of individual stocks. Therefore stocks move:
1/8 part of 35 points or 4 3/8 points (low priced stocks)
1/4 part of 35 points or 8 3/4 points (medium priced stocks)
3/8 part of 35 points or 13 1/8 points (especially wheat)
1/2 part of 35 points or 17 1/2 points (medium priced stock)
5/8 part of 35 points or 21 7/8 points (usually resistance point)
3/4 part of 35 points or 26 1/4 points (usually resistance point)
7/8 part of 35 points or 30 5/8 points (seldom used)
1 time 35 points or 35 points (high priced stocks)
2 times 35 points or 70 points (large swings)
3 1/2 times 35 points or 122 1/2 points (major resistance)
Page 70
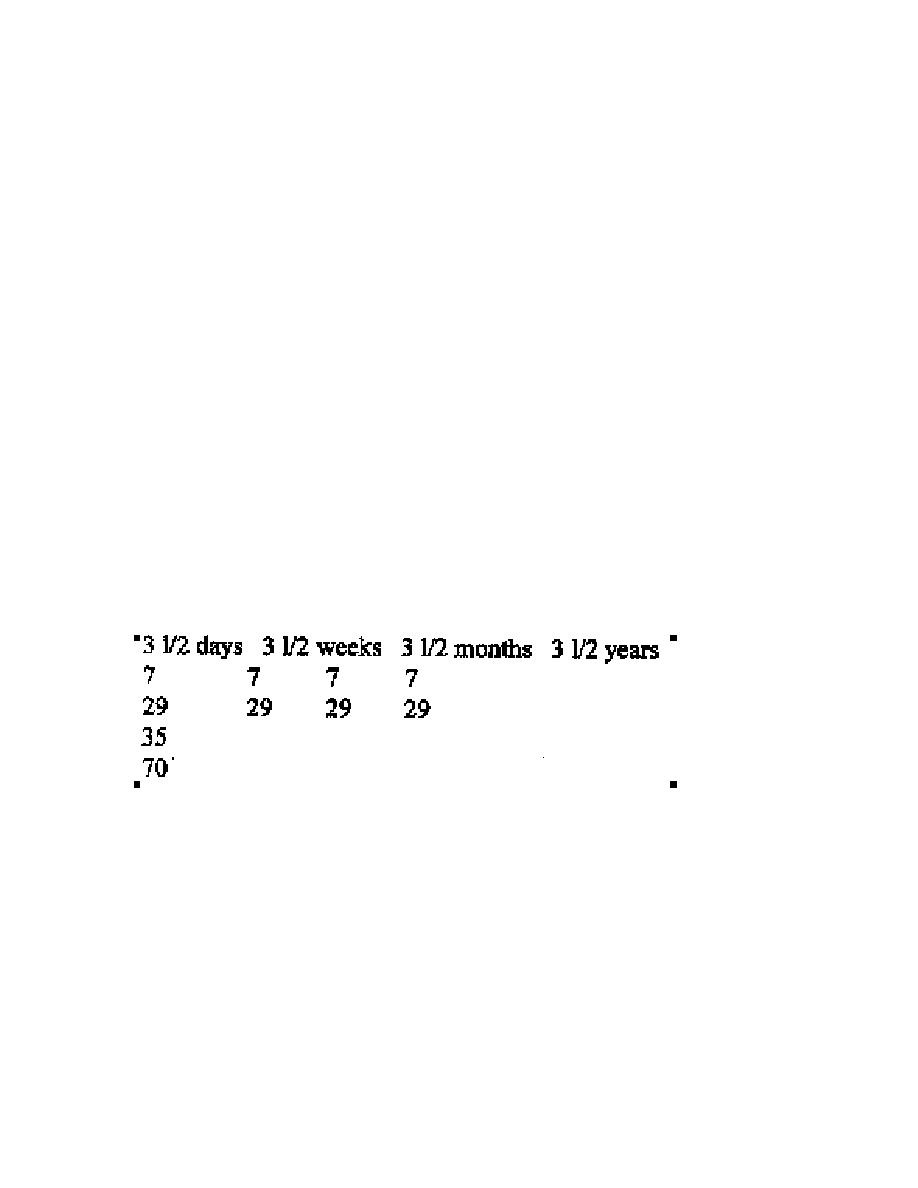
Selecting the most important distances of this sequence, we
find that normal movements of stocks extend 8 3/4 points, 17 1/ 2
points and 35 points, while for wheat important distances traveled
are 13 1/8 and 30 5/8; the latter is seldom used. All other distances,
such as 21 7/8 and 26 ¼, represent temporary resistance levels
from which, as a rule, a movement in the opposite direction begins;
when such a counter move is completed the original trend is
resumed once more, ending at the major resistance point.
This sequence should be used only to figure distance, i.e.
price or the number of points in dollars a stock travels before a turn
is due to come. In other words, the measurement between a top and
a bottom or between a bottom and the next important top.
This measurement is also used for gaps; in this case you
measure from them up or down, just as if they had a top or a
bottom. These values will not show how many days a movement
will last in one direction or the number of days consumed from a
bottom to a top or from a top to a bottom.
The following time spaces are of great importance, at the ter-mination
of which you can expect a change of trend. The count is done in calendar
days and not in trading days:
There are variations possible, but they should be ignored
entirely for practical application.
Of these cycles, the 29 days and the 3 1/2 week cycles are
very close together. While the latter usually brings about
stagnation into a movement that began 3 1/2 weeks prior the
former as a rule produces the actual change of trend.
Page 71

These two cycles and the seventy days cycle are of the greatest
importance.
The point of beginning for major moves is always at the top
of a bull movement or at the bottom of a bear movement. The
dates, which are due to produce changes can be plotted in advance
on the charts. The point of beginning for secondary movements is
always the day a major reaction ends or a major rally ends. It is not
advisable to chart any tertiary cycles, such as 3 1/2 or 7 days
movements; they will only confuse the important movements.
Another way to determine time changes in stocks or
commodities must be considered here. It is purely astrological. It is
impossible to do without astrological laws. We take recourse to
special Tables called ephemerides of planets' places. They contain
the positions of all the planets calculated for London at noon for
each day. The values are in degrees and minutes of the circle.
Adjoining, you will find the sign each planet occupies at the given,
required day. We are only interested in the planets' motion in
longitude. Declination or latitude we do not consider at this
moment.
In the picture on page 69, you were given three special
values: 13
o
28' 12" of Taurus; 16
o
21' 48" of Virgo and 15
o
of
Capricorn. The latter represents an in-between value of the actual
values, i.e. 19
o
15' 24" of Capricorn and 11
o
04' 56" of Capricorn.
Whenever any planet passes the first two places, a change in the
market must be expected. As examples we just check the
ephemeris of 1935:
Stocks
Top:
Jan. 7th. Mercury on Sun. Jan. 6th at 19
o
Capricorn 15
Bottom: April 2nd Venus at 13
o
Taurus 38
Top:
(2 week) July 29th Venus at 16
o
Virgo 21
Top:
August 25th Mercury at 16
o
Virgo 21
Gap up: Sept. 5th Venus at 16
o
Virgo 21
Retro Top:Sept. 10th Sun at 16
o
Virgo 21
Page 72

Top:
Oct. 24th Venus at 16
o
Virgo 21
Bottom &
Gap up: Nov 11th Neptune at 16
o
Virgo 21
Gap up: Nov l2th Mars at 11
o
Capricorn 04
Top:
Nov 23rd Mars at 19
o
Capricorn 15
Low:
Dec 29th Mercury at 19
o
Capricorn 15
We cannot recognize the direction of the movement because
at times a gap is formed at these points. However we must bear in
mind that we have other methods available that tell us the
direction, provided again we know that a change of trend is due on
a specific day. When looking over a chart for 1935, you will note
that the dates of change indicated with this method are at times
pretty far apart, at other times close together. We had no
opportunity during this year to see the effect of Saturn or Jupiter,
because they did not pass these points in the course of that year. I
do not use the Moon because it moves too fast and brings about the
seven day, short movements spoken of before. To gain experience,
it is suggested that you plot the movements of stocks for a few
years on daily performance, enter the planets on the day in
question and make a record of the effect they produced.
Application Of This Law In Particular Cases
The surest sign of a change of trend from an upward movement to
a downward movement or from a downward movement to an
upward movement is the increased volume of sales just a few days
prior to the time when a change is in prospect. For instance, a stock
has moved upward continually for sixty-four days, small reactions
being discounted; the average volume traded in that stock during
this period of ascent amounted to 8000 shares per day. It is known
that the 70th day should produce a change of trend.
Page 73

As the 70th day approaches, the climax, you will find that 250,000
shares or a similar proportionately large amount of shares will
change hands. If you see such conditions developing, sell your
holdings at the market and go short, because the 70th day will be
found to be the final top of the move. On that climactic buying
day, the stock may even close lower than it had closed the day
previous, notwithstanding the fact that brand new high levels were
reached during the session. This same rule applies to a bear
movement with tthe motion just reversed.
Stock averages made a low December 16th, 1930. The next
top was made on February 24th, 1931. The time factor proved to
be exactly 70 days. The astrological measure complied with it also.
Mercury on Dec. 16th, 1930 was at 11
o
Capricorn 04, (day before).
Venus on Feb. 24th, 1931 was at 19
o
Capricorn 15'. There was large
volume just a few days before the movement came to an end.
On March 24, 1931, Alaska-Juneau broke through 59 with a
gap and advanced without a setback until June 4th, 1931. The last
few days of this advance was again 70 days.
The movement of this stock during that period was
completely against the general market's trend, for all other stocks
dropped from February 24th until June 2nd of that year. This
proved to be a "Malloy case", referred to before.
Any one of the time numbers can become a turning point, at
times for minor movements, at other times for major ones. The
elements of increased volume of sales and other factors to be
explained later are concomitant factors which, if they are not
present, cancel or void the number as being the cause of a change.
Besides we must consider the factor of distance, i.e. the price
movement the stock has had since the beginning of the movement
as will be illustrated by examples.
It will be seen when checking several line charts of
representative stocks selling between 40 and 80 that they move
Page 74

17 1/ 2 points in one directions, then reverse, and move 8 3/4
points in the opposite direction. If they can push through 17 1/2
points (counted from a beginning) with little volume and quite
rapidly, they will advance another 8 3/4 points or even 17 1/2
points in the same direction. Low priced stocks have the same
proportionate movement: 8 3/4 for the main move, 4 3/8 for the
intermediate moves, or, 4 3/8 points for the main move and 2 1/4
(2 3/16) for the minor movement or counter move. High priced
stocks use 35 points for the major and 17 1/2 for the counter move.
The habit of each stock must be thoroughly checked in this
respect, as, especially when stocks are at very high levels, they act
seemingly on somewhat different scales while up there.
Auburn Motors, for example, during 1930 and 1931, when
selling above 150 up to 290 moved with clock-like precision 42
points, respectively 21 points. It may be stated that AAC and a few
other high fliers have peculiar time and distance factors that are not
in keeping with the market as a whole, and anyone trading in them
should make a thorough study of them according to rules laid
down in this work. Once the factors are located, they are as easy to
trade as any other stock.
Passing from theory to practice let us analyze several stocks.
The period of analysis is immaterial, since our laws are constant,
good today and ten years hence. Only during transition periods,
when circles gradually increase or reduce in size are complications
apt to set in, although the time factor again takes care of this
situation automatically.
EPT, American Home Products, in 1931, rose from 46 and
stopped 17 1/2 points above this low price. It was a selling point.
For more than two weeks, it sold in this neighborhood. The
specific reason for this sideways movement was to be found in the
comparatively rapid advance of this stock, leaving the time factor
lag behind. The moment this time factor caught up with the
Page 75

distance factor, there had to be a turn. Good sized volume
developed without piercing the top and a reaction set in.
CTM, Case Threshing Machine, made a top of 131 1/2 in the
Spring of 1931. It was a safe sale at this level; large volume
developed right around the top. It broke 70 points from this level
and continued for another two points (61 1/2 would have been the
correct level to stop), showing that it would drop further yet after a
fair sized rally had passed. Case rallied from 59 1/2 to 93 5/8; it
should have been sold short 35 points above the 59 1/2 level, or
very close to this price of 59 1/2 plus 35, which would have been
94 1/2. It missed making the full 35 points by 7/8 point. As the
volume was very heavy near that top, the stock should have been
sold short, "at the market" when such volume arrived and the price
nearly was reached. To begin with, the profit in this commitment
was of good size.
Then, too, there might have been just [a few words of text
were missing at the bottom of the original type-written page]
hundred share lot sold at 94 1/2, provided it was hit, followed by a
quick reaction to 93-92 or even 91.
Last but not least, there is a limit to absolute accuracy in
calculations due to phenomena that have been amply explained in
other chapters, so that the best we can expect should be entering
the market within a few points of a bottom and leaving within a
few points of the top. Other action cannot be countenanced, as it
would bear the colour of greediness. Nature helped you in this case
again, CTM held in a range between 90 and 93 for nearly one
week; if you did not see the high sign but sought to gain the extra
eighth, you would have been seeking it for fully two years, for the
stock in the meantime went to 17.
To be safe in this transaction, the short position taken at 131
1/2 should have been covered a fraction above 61 1/2, while still
on the way to lower levels or 70 points from the top. At the same
time, the stock should have been bought for a turn, to extend not
more than one half of the preceding decline, figuring the point
Page 76
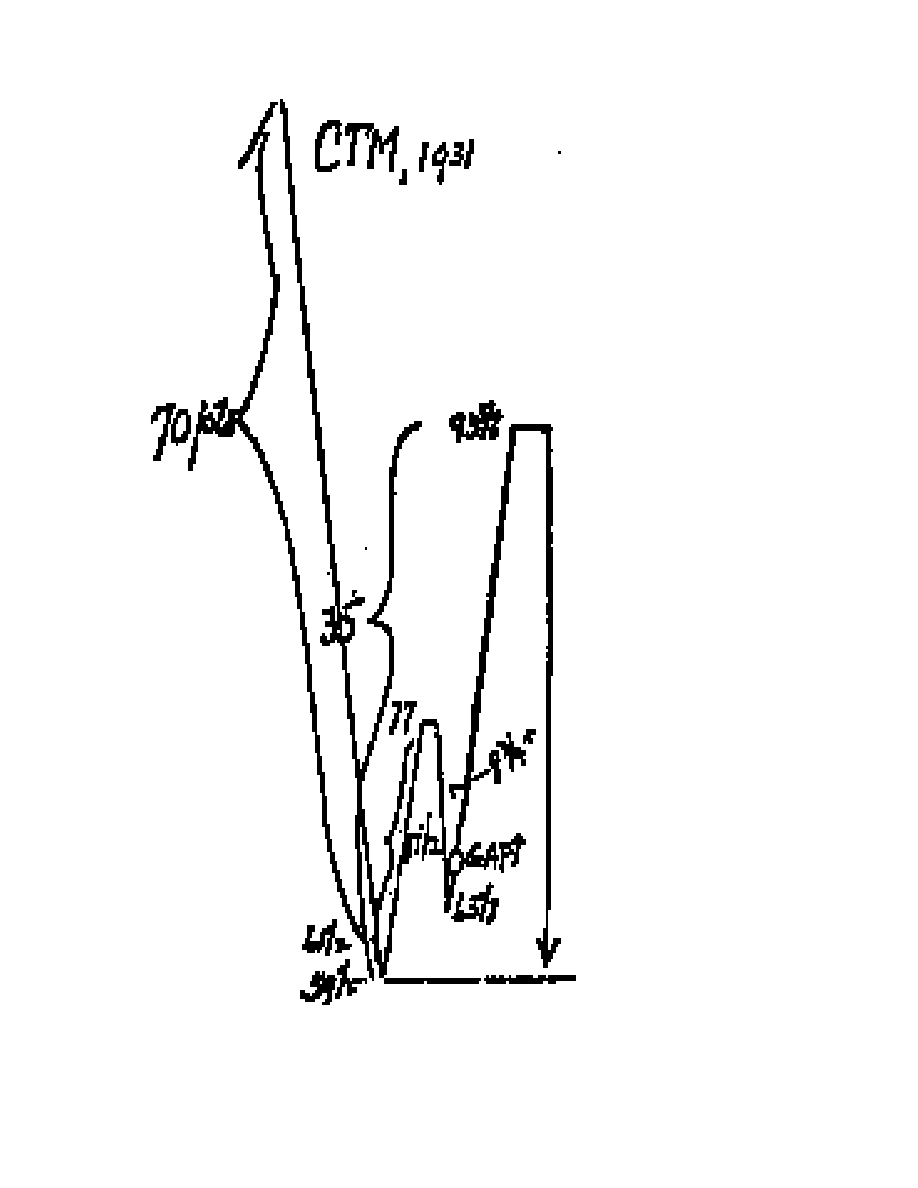
Page 76

where the decline actually came to a stop. It stopped at 59 1/2. Not
to prove greedy and attempt to hog the entire move, a 17 1/2 rally
to begin with would have been the right calculation. When this
price was reached you could judge from the way the stock behaved
whether or not the time factor or the volume permitted the advance
to continue immediately. This would have caused you to sell your
stock slightly below 77, taking a 15 to 16 point profit. When you
then saw that this price was pierced through strongly, you should
have bought it again around 80 1/8, i.e. when it reached 3 1/8
points above 77, which was 17 1/2 points away from the main
bottom, 59 1/2. The reason for such action will be explained later.
To bear out my contention, Case was not in a hurry to go
through 77. It remained there for 5 days. It could have even been
sold short for the reaction of 8 3/4 points. That would have meant
staying short till the price of Case dropped to 68 1/4, covering
there and assuming a long position once more. It reached 63 1/8
and ranged quietly within one point for an entire day. The
following day, though, it opened upward with a gap, went through
77 with a flash and, in an almost straight line reached 93 5/8. At
this point it should have been sold short once more.
Anaconda Copper made a low of 25 on December 16th,
1930. In 70 days it rallied to 43 1/2 or just a little above 17 1/2
points from its low. Big volume arose just below this price, making
all indications point towards a top formation. A short position
could have been entered into at this level. We note from this
example that at times the motion extends slightly beyond the legal
level of 17 1/2 or 8 3/4 counting from a bottom or from a top. As a
rule this excess should never amount to more than three points on
the upside or 2 7/8 points on the downside; when the excess
becomes more it is an indication that the movement continues in
the same direction.
American & Foreign Power made its bottom of 25 also on
Page 77

December 16|, 1930. It acted similarly then as Copper and stopped
at 42 1/2. On this specific day, when that price was reached, large
volume appeared with the stock moving higher, even going
through the 3 points given above to allow for "excess motion", a
price which would have been 45 (25+17 1/2+3).
From this performance we were forced to conclude that the
stock had to make 25 - 17 1/2 - 8 3/4 from the starting point. In
case you had cleared your commitments after the 17 1/2 point
move was over, you had to check, at the same time, your time
count to find out whether or not enough days were available to
allow the stock another movement of 8 3/4, i.e. an additional one
half of the primary move, so as not to go short too soon. This extra
move of 8 3/4 points would have given you as the final goal a price
of 51 1/4. Fact was, the stock made 51 3/4.
This price was satisfactory and the time consumed was just
right. At this point, or on this day, it was safe to sell short "at the
market". It may be noted that the last jump of 8 3/4 points was
made in the short space of two trading days. Such sharp runs, on
top of a movement and accomplished in a short space of time are
never permanent, especially when climaxing a standard move. In
this case, Foreign Power faced about and went to 21 1/2. This was
more than 3 points from the legal bottom limit, an indication of a
further downward move after a weak rally.
Trading in the market is not a gamble for a point or two.
Small moves bring losses. If you are able to get into a 17 1/2 move
every three months and have occasionally a 35 point move thrown
in for good measure, you cannot help increasing your capital.
Count your time, enter it on the top margin of your charts, together
with the degrees and minutes given to you then count your distance
in points. Keep a control on your volume of sales.In case one of
these factors reaches the limit before the other does, watch out. It is
the beginning of a counter move! It does not always mean it is the
end. The stock may continue merrily for several points, for several;
Page 78

the position, however, is getting more critical from hour to hour.
When the public is aflame with hopes for higher prices, or once
other hand, full of gloom, fearing the end of the market is in view,
then, the climax is reached. Action is called for, all factors
agreeing at the moment. To the very careful trader be it said, that
he may begin to lighten part of his holdings at the first indication
of a counter move being in the making, using the balance of such
holdings to await the other indications for a final signal.
This is an answer to those traders who indulge in one phase
of overloading, by spreading all over the board. No man can
properly watch more than a few stocks at a time; however, should
they belong to one group, then he may double the number. Even
one over the limit causes trouble, neglect of others, consequent
losses.
When trading in commodities, you have to be very careful to
stay in their individual trends. You may be long of wheat and of
cottonseed oil, at the same time short in sugar and in rubber.
You may have just sold your hides and get into silk.
Never compare a stock to obtain the measurement of a
commodity. For example, rayon shares have been idle the best part
of 1936 so far. At the same time, silk, a competing commodity had
important movements. The public would think that when silk drops
in price such as it happened from January 8th, 1936, when it was
selling at 198 1/2 for May option, compared to a price of 1.51 on
February 26th, 1936 for the same option the demand for Celanese,
a substitute for silk would fall off, causing lower prices for the
stock of a corporation producing such material.
However, CLZ stock sold on January 6th, 1936, at 32 1/4, on
March 12th at 25 7/8, and on April 6th, 1936, at 30 1/2 or within
less than two points of the high made on January 6th. At the
second low made in silk on June 2nd, 1936, its price, computed
into May option shows a value of 1.51 again (September option
Page 79
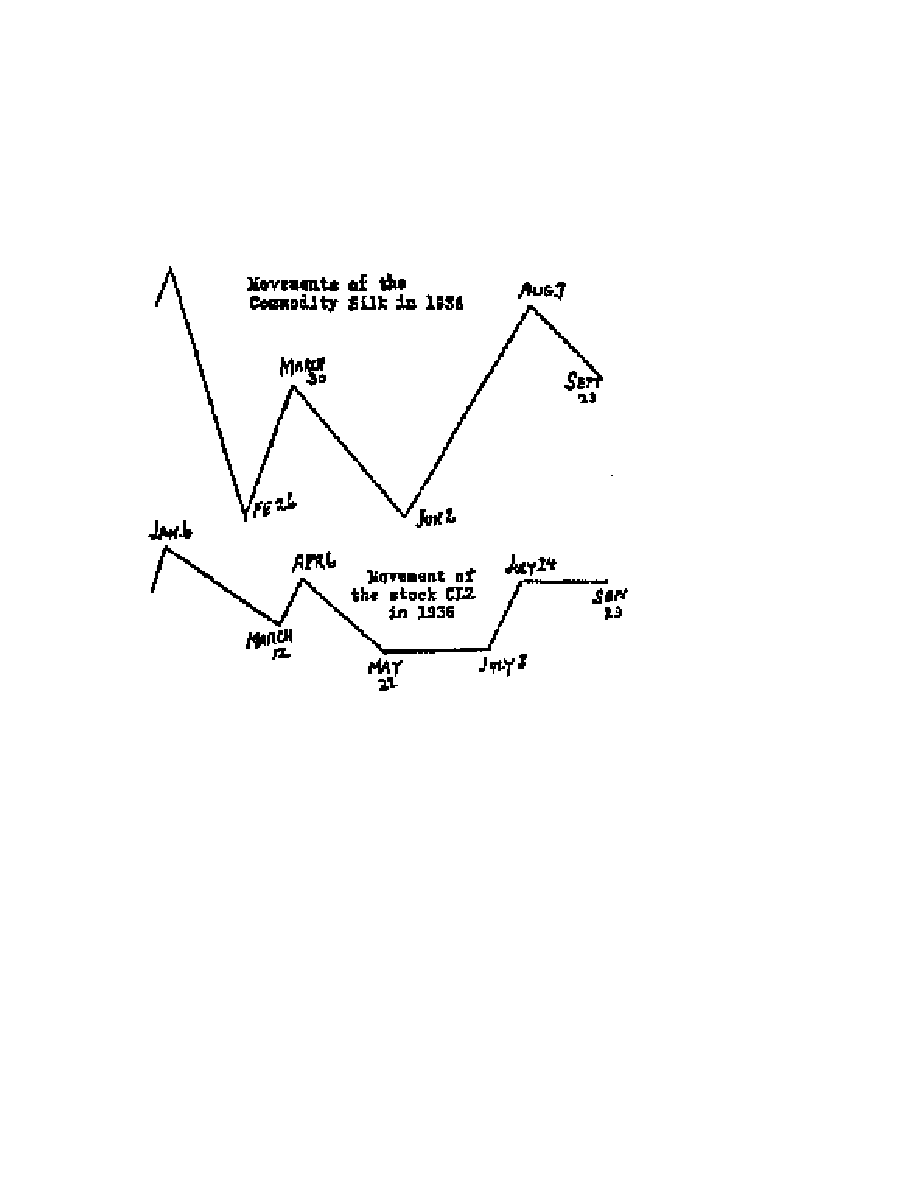
that day was 1.39), or a double bottom. At that time, CLZ was
selling at 21 7/8 or four points lower than at the March bottom.
While we may recognize some similarity of a general nature,
noting especially that CLZ seems to hit tops and bottoms just about
a week or two later than silk, they will not help us at all in deeming
changes or price levels.
Trade in stocks that you know and in stocks in which you
have made profits. Leave those alone wherein you have taken big
losses. Never try to get even with a stock that caused a loss. To do
so will cause further losses. Your vibrations are not attuned. Do
not forget your own vibrations, or those of the individual stock, or
the vibrations of the market as a whole! To gain experience with
these mechanical and scientific calculations let me suggest that you
make several daily charts of stocks covering various periods, bull
and bear movements. They will reveal identical secrets openly, but
not visible to the casual trader.
Page 80

Never enter the market on a hunch or upon the suggestion of
some person who has no right or knowledge to qualify making
suggestions.
The market will continue for a long time. To start, make a
chart of one single stock, such as U.S. Steel and check the past
performance for at least one year. Enter the market only when the
various factors show a movement ending; otherwise bide your time
and wait until such factors agree. When all calculation seem to
jibe, then buy or sell "at the market" as the case may be and not at
a fixed price. A point more or less is not important provided you
have the direction of the move that is about to begin. Discard fear
and hope. You developed abstract facts, you have weighed
carefully the various laws that are underlying, you have done your
utmost and you must let Nature take its course.
Make it a rule to trade with sufficient margin. A slender
margin disturbs your free thought. If you have made an error in
your calculations, which is humanly possible, you must be able to
withstand an entire cycle movement against you, which may
amount to 8 3/4 points or even 17 1/2 points, provided you do not
discover the error in time. Should you discover the error in your
calculations and the market has not gone too far against you,
rectify it immediately and wait until you have thoroughly re-
checked your error and until you have cooled your excited nerves,
This may require a week or two.
When fully calm again, re-enter the market without fear and
without hope. The signs of market changes are so clear and are
indicated for such long periods in advance that they can be
detected provided all news, reports, earnings and other useless
matters are fully ignored. It is needless to hurry, to rush. You have
ample time for operations.
When we speak of a gap in the market or in the picture of a
stock or commodity chart we mean an open space left between the
trading of one day and the trading the next day. The best way to
Page 81

explain a gap is by an actual example: (Fig. A).
A stock moves from 32 to 49 1/2 without any difficulty. It
has thus completed a move of 17 1/2 points. It represents the first
stop where the stock could turn around and make a move in the
opposite direction. In fact in most cases it will do so, especially
when time and volume factors are in harmony.
Supposing we let it react accordingly to all rules and
regulations, 8 3/4 points from this top of 49 1/2 would require a
bottom of 40 3/4 or close to this value. Supposing this price was
made. Then the stock must turn once more. On the way upward, it
closes one day at 44 3/4, after having had a high of 45 1/4 and a
low of 43 5/8, making the day's range 43 5/8 and 45 l/ 4. The next
day, however, this stock opens at 46 3/8. During the time of
trading, this stock recedes to 46 but not lower. In this case we have
a gap extending from 45 1/4 to 46, called a three quarter point gap.
Such gaps are of no importance if they are closed either the
same day or within the next day or two. Under "closing" we
understand that the price of the stock must return to the 45 1/4
level, which in our example was the beginning of the gap. In that
event, continue your calculations as before, just as if there never
was any sign of disturbance.
But, if this gap be not closed within treasonable time, two or
three days, or in case the movement begins to increase in speed,
i.e. in points quickly in the direction of the gap, then throw all your
calculations overboard for a new cycle has just started.
Begin with a new bottom, which is found to be the high price
of the day before the gap was made; in this case, 45 1/4. Forget all
about the previous bottom of 40 3/4. If the market is moving in a
negative direction, then the lowest price of the day before the gap
downward is made must be taken as the new imaginary top and all
calculations must be made from this point. Fig. B shows a gap
down at 40 1/2 to 40 1/8 and the movement down must be figured
from 40 1/2 (not from 40 1/8). A small gap was made upward at
Page 82
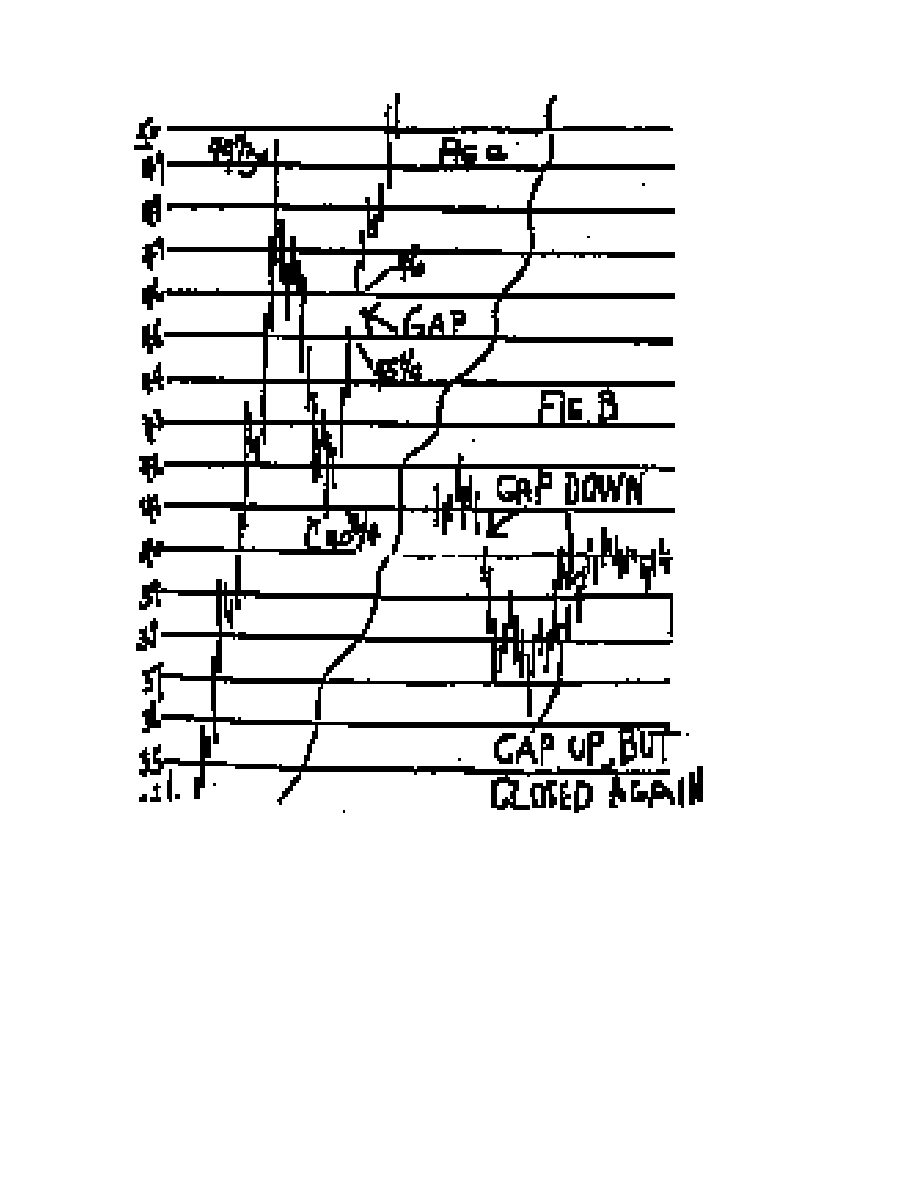
Page 82

38 1/4 but closed again the third day with a gap down. These types
happen frequently. Note the comeback of the entire move from 36
1/4 upward in Fig. B to cover the gap made downward at 40 1/2
before. This closing of an old gap, made some time previously, at
times years previously on the upside or on the downside means,
most of the time, the end of a move. And in our picture, Fig. B, we
would put out short lines between 40 and 40 1/2, expecting a
renewed decline,
In our original example, Fig. A, the new bottom is therefore
45 1/4, the calculations are now built upon this price. First move
17 1/2 points, which would indicate a tentative price of 62 3/4 if
necessary and depending upon other known factors by the time we
reach 62 3/4, we add another 8 3/4, giving us an important top at
71 1/2. During all this time we must never forget our time element.
It runs along undisturbed. The volume element will be disturbed
internally for a few days and is not an indicator to be depended
upon during such transition period until we return to normal
conditions, which will always be found present long before the
move actually comes to an end.
Such gaps can be followed by others during one actual
movement. You may find as many as six consecutive gaps at
various distances apart in very active stocks, but the normal
number for one major swing does not seem to be more than four,
followed by a final gap, which we call the exhaustion gap. Any
gap, except the exhaustion gap, indicates that the suction or the
pull the vibration, is in the direction of the gap. When Use gap is
upward, the suction is upward; when the gap is downward, the
suction down.
Stocks, in which trading is light, such as UP, DH, ASE, are
full of gaps. These types of stocks cannot be used for our purpose
here, but will be judged by other methods that follow. They have
just the same swings of 17 1/2, 8 3/4, 35 like the others.
However, when stocks are inactive and not traded at times
they are not favourites and automatically excluded except for long
Page 83

term commitments when using elliptic swings as shown later. The
rule given above applies only to active stocks, which are traded in
fairly heavy volume each day, at least 5000 shares per day when
the total amount of sales is around one million shares. In 1928 or
1929, heavy volume meant 100,000 shares per stock each day; this
has shrunk to about 25,000 shares or even less per stock to be
called heavy volume.
The reason for gaps has been touched upon in a previous
chapter as being caused by the sudden arrival of a combination ray,
either of good or evil nature, operating day and night with
increasing power, making people buy or sell irrespective of value
or price in the direction intended by such vibration or ray. It is just
a pleasure to time these rays, a pleasure to watch them get into
operation; a pleasure to watch them all, abiding unconsciously to
these forces, young and old, experienced and inexperienced,
banker and broker, millionaire and five-share trader alike. An
unusually good example, showing the action of gaps, could be seen
in Vanadium from January to March 1931. From a low of 45 1/8 it
advanced to 51 1/2. A gap was formed between 51 1/2, and 51
3/4; therefore we had to expect a strong move upward to extend 17
1/2 points from 51 1/2 This should have given us a price of 69 and,
in special cases, adding all extra 8 3/4 to that price, a final top at 77
3/4 or close to that price. We now take step by step what happened
actually to Vanadium. There was a gap made between 55 1/2 and
56 1/8, and, when adding 17 1/2 to the low point of the gap, gives
us a top of 73. The question of trying first 8 3/4 is not suitable,
because we have already two gaps, which indicated exceptional
strength. Nature evidently did not think there were enough gaps as
yet and a third one occurred between 63 and 63 7/8; at this point
however, it was advisable to stop, look and listen. At least we were
obligated to reduce our speed from 17 1/2 to 8 3/4 points as the
next possible top. As an extra possibility due to extreme strength,
we might have taken 13 1/8 points away from that gap, since there
Page 84

is never a perpendicular advance, no matter how strong the aspect
might be. We find that the ult - [a word or two of text was missing
here in the original copy] should be either 76 1/8 or 71 3/4. The
last price is not very suitable in as much as we arrive at a much
higher price when figuring from the previous gap.
There was a fourth gap made between 66 1/2 ; the stock had
therefore to make an additional 8 3/4 points from 66 1/2,
eliminating definitely the possibility of a further 13 1/8 points
advance. The point 75 1/4 should be the top. The actual price
reached by Vanadium was 76 3/4, coming originally from 45 l/ 8.
It rose nearly thirty-five points, A method explained later showed
it exactly took in a full large ellipse.
Gaps upward after we had a bear market and gaps downward
after we had a bull market will not be closed for years at times.
But it is absolutely necessary to know at what prices these gaps are
located, since Nature as a whole and stocks or commodities in
particular abhor unfilled spaces. Nature grows grass and weeds
quickly over a ploughed field. A stock that may sell today at a
price of 5 or 6 dollars could have declined from 175. On its way to
lower levels it left a gap open at 144, another at 106 3/4, the latter
being two points in length. Now, whenever this stocks reaches
again in the nineties, whether your calculations, time factor,
volume or other indices show a top to be due at 102 1/4, Nature
will ignore these minor laws and use one of its major laws. Nature
will force traders to buy this stock clear up to 106 3/4, possibly 107
and you ought to see them like a movement might throw you all
out of balance; it might make you bullish right near a top unless
you knew of this open gap made four or five years previously.
In 1932, UAF and in 1933 CLZ made such gaps on the way
upward each one at 16 7/8. The size of this gap in both cases was
very tiny; one eighth of a point, hardly worthwhile bothering with
it. UAF went from that gap upward 17 1/2 points with
Page 85

big bullish sentiment that UAF surely was heading straight for 75
right here. It turned down and closed this tiny opening. CLZ, after
making that tiny gap at 16 7/8, went up to 59 or thereabouts, but
immediately after that top was passed I predicted (easy?) that the
next bottom would be 16 3/4 and you just check back and find that
it made just that in 1934. This stock has only been able to recover
17 1/2 point level once with a gap upward, you can expect
"fireworks".
In the case of Vanadium, it might be interesting to note that
just at the time the top was made in our example, the corporation
issued convertible bonds for a large amount. This gave statisticians
and newspapers a good talking point for its dropping 71 3/4
thereafter in actual points. It went down to 5.
A strong move, which most always starts with a gap, is most
rapid at its inception. This is the cause for its quick advance in the
beginning and not returning to close the gap. Its speed slows down
somewhat around the middle of the move, but increases in speed
again when it nears the end, which finally causes the exhaustion
gap.
Sir John F.W. Herschel, in his book "Outlines of Astronomy",
when explaining the variation of the Moon's eccentricity tells us in
articles 688 and 689:
Let us proceed to investigate the influence of the disturbing force
so resolved on the eccentricity of the lunar orbit, and the foregoing
articles having sufficiently familiarized the reader with our mode
of following out the changes in different situations of the orbit, we
shall take at once a more general situation, and suppose the line of
up sides in any position with respect to the Sun, such as ZY, the
perigee being at Z, a point between the lower system and the
quadrature following it, the direction of P's motion as all along
supposed being ADEE.
Then commencing with the normal force, the momentary change of
eccentricity will vanish at a, b, c, d by the vanishing of that force, and at Z
Page 86
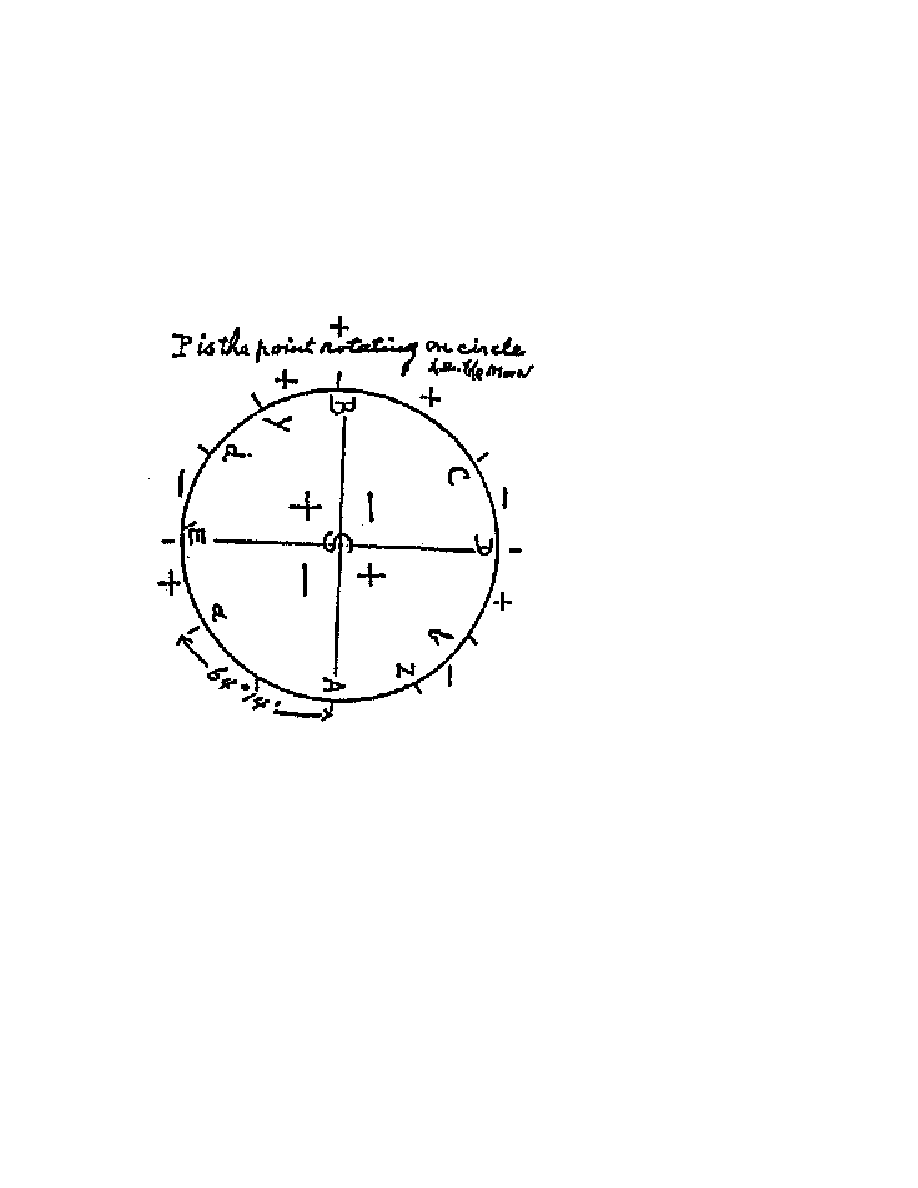
and Y be the eject of situation in the orbit annulling its action. In the arcs Zb
and Yd therefore the acting force nowhere attaining either great magnitude
or an advantageous situation within their limits. And the force within these
two arcs having the same characters to inward and outward, but being
oppositely influential by reason of the approach of P to S in one of them and
its recess in the other, it is evident that, so far as arcs are concerned, a very
near compensation of effects will take place, and though the apogeal arc Yd
will be somewhat more influential, this will tell for little upon the average of
a revolution.
The arcs bDc and dEa are each much less than a quadrant in extent,
and the force acting inwards throughout them, which at its maximum in D
and E is only half the outward force at B, A, degrades very rapidly in
intensity towards either syzygy. Hence whether Z be between bc or bA, the
ejects of the force in these arcs will not produce very extensive changes on
the eccentricity,
Page 87

and the changes which it does produce will be opposed to each other
Although then, the arc ad be further from the perigee than be, and therefore
the force in it is greater, yet the predominance of effect here will not be very
marked, and will moreover be partially neutralized by the small
predominance of an opposite character in Yd over Zb.
On the other hand, the arcs aZ, cY are both larger in extent than
either of the others, and the seats of action of forces doubly powerful. Their
influence, therefore, will be most important and their preponderance, one
over the other, being opposite in their tendencies, will decide the question
whether on an average of the revolution, the eccentricity shall increase or
diminish.
It is clear that the decision must be in favour of cY, the apogeal arc,
and, since in this the force is outwards and the moon receding from the
earth, an increase of the eccentricity will arise from its influence.
A similar reasoning will evidently lead to the same conclusion were
the apogee and perigee to change places, for the directions of P's motion as
to approach and recess to S will be indeed reversed, but at the same time the
dominant forces will have changed sides, and the arc sAZ will now give the
character to the result. But when Z lies between A and E, the reader may
easily satisfy himself, the case will be altogether different, and the reverse
conclusion will obtain. Hence the changes of eccentricity emergent on the
average will obtain.
Hence the changes of eccentricity emergent on the average of single
revolutions from the action of the normal force will be as represented by the
signs plus and minus as shown in the figure.
Without going into further details read verse 29 of Chapter 11 of
the Book of Revelation, the last book of the Bible. It says there: He
that hath an ear, let him hear what the Spirit saith unto the
Church. ...
Page 88

So far, your biggest and insurmountable difficulty to understand
movements of stocks or commodities was found in the point of
beginning. Once these points are located, the stock will do just
what you expect it to do, provided you make no misinterpretation
in your calculations. You can rest assured that each stock knows
where it has to go and the exact eighth where it has to come to a
stop. Stocks require no timetable, no road map. With our little bit
of knowledge we try to lay out the time and the road they travel
ahead with laws that we were able to recognize so far, and watch
closely if they do not deviate from the calculated path, ever ready
to make adjustments of our map to suit them. Stocks travel
according to unchangeable, predestined immutable laws. Anyone
who knows these laws has the market under control. Few such
people exist.
The division of stocks into groups such as the industrials,
rails utilities or oils is absolutely without good cause. In one of the
next methods, it will be shown how such division can be made.
This fact is purposely brought up because it is inadvisable and a
waste of time and effort to make charts of such averages; to
attempt afterwards to interpret them will most likely turn out
negatively as far as results are concerned. This brings about
discouragement and you are liable to construe it to be true of all
other charts. If you must keep average charts, then take the Tribune
averages or those of Hamershlag-Borg. Each one, however
produces an individual picture and the interpretation of one is most
of the time different to the othe. They may be called the
seismographs of the market's vibration in a very general way.
Supposing a stock makes a top at 75 and, further that this top
is 17 1/2 points away from a bottom or gap, then it is possible, due
to the big rush that always occurs when stocks turn around that the
stock may be rushed beyond its normal point of resistance which
should be the top, from 1/8 to 3 points. If this should happen, the
trend would be downward just the same and not upward.
Page 89

The extreme limit in our case would be 78. A stock, to show
further up trend, must make at least 3 1/8 points above the
calculated top, in this case 78 1/8.
The same applies when the market is moving downward. Let
us assume a stock makes a bottom of 42, according to our
calculations. In the last mad scramble to dispose of stocks, to
liquidate holdings, the stock may drop below this price from 1/8 to
2 7/8 points and still show up trend; it could therefore make 39 1/8.
On the other hand, dropping 3 full points below the 42 level, would
indicate a further decline after a rally, possibly even without one.
As shown by the many examples, this method works
perfectly time and again, especially when there is an active market
where the swings are large. It operates best in active stocks, which
are leaders in the market. Of course, it also operates with inactive
stocks; only, the difficulty of extricating yourself from a position
in them at the top or at the bottom without taking unusual risks is
too much to warrant a trial. It is over 4 years now since I first
revealed this method to the public; it worked in practically all
stocks right along, and will do so thereafter.
The methods, which follow are produced upon other
premises and wonderful results can be obtained through them
individually. Co-ordinated, however, working one into the other,
gives the full result because all refinements are taken care of that
are humanly possible.
End of method # l
---0000000 ---
The further we proceed, the more difficult the work becomes, the
more you will find that without proper foundation, i.e. with- out
understanding fully everything that was explained previously,
Page 90
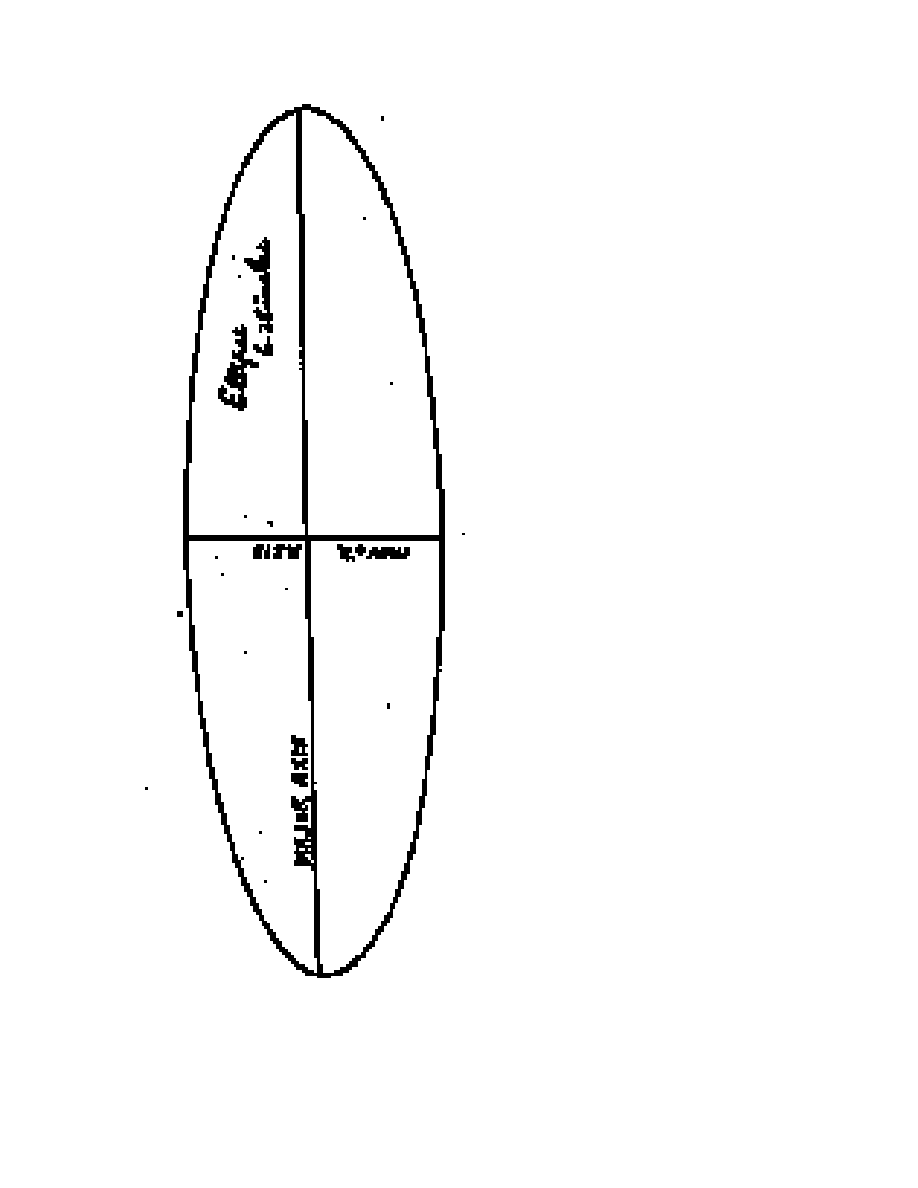
Page 90
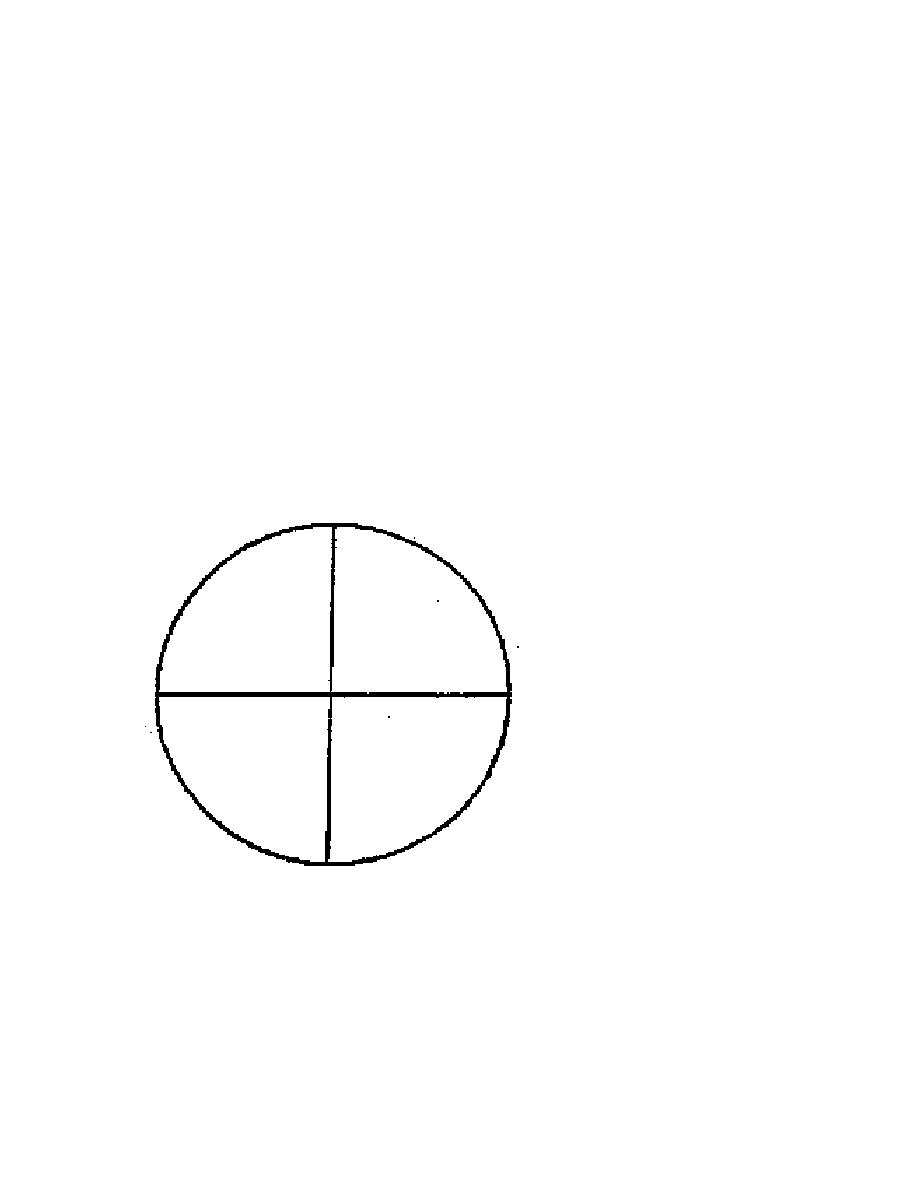
it becomes, like the book of Friedrich Nietzsche "Also Sprach
Zarathustra|", incomprehensible. From here we will drop all the
minor expressions and terms used in trading and use technical
language only.
The original idea of the present method, called the circle
method was discovered with the aid of planetary movements. We
know that the planets rotate through space in paths that form
ellipses, which however, closely resemble circles. A circle is also
an ellipse, the major and minor axes simply being equal.
Therefore, in our present method, we consider the planets' ellipses
being circles. The circle contains 360
o
as commonly used. Dividing
the circle in four equal parts or quadrants, we find each one must
be 90
o
in length, The first one extends from 0
o
to 90
o
the second
one from 90
o
to 180
o
the third one from 180
o
to 270
o
and the fourth
from 270
o
to 360
o
a value which again equals 0
o
.
In our special cycle chart, we find each quadrant divided into
six equal parts of 15
o
each. One arc of 15
o
is taken to be a minor
house and the arc adjoining, 30
o
in length we call a major house.
Page91

We find these rumor and major houses placed alternately around
the circle. The zero point, or point of beginning starts the second
half of a major house, extending from 0
o
to 15
o
followed by a
major house, extending from 15
o
to 30
o
. This is followed by a
major house, reaching from 30
o
to 60
o
, followed by a minor house,
etc.
Each 15
o
arc is divided into four equal parts, producing a unit
of 3 3/4
o
. The final and last division cuts each unit into half,
producing the smallest division of the quadrant 1 7/8
o
.
Each degree of the circle we call one point or one dollar for
our purpose of measuring movements of stock prices.
In each house, whether major or minor, the centre or
midpoint must be defined. In this manner, the minor house,
extending from 60
o
to 75
o
has its mid-point or centre at 67 1/8
o
; the
major house, extending from 75
o
to 105
o
has its mid-point or centre
at 90
o
.
As stocks move in an imaginary way up and down beside the
periphery of the circle, they swing back and forth like a pendulum.
The pendulum of a hall clock has its centre or dead point in the
middle of its two extremes. Stocks have their dead point in the
middle of the range in which they trade. In order that we may have
a measure where they swing at special moments we must consider
the centre of each house as the dead point of their swinging area.
The other important points of the pendulum are the extreme points
from whence a forward movement or motion changes into the
reverse motion; where an up-tick is followed by a down-tick.
Individual stocks possess individual amplitudes, i.e. the distances
between the dead point and one side of the tick, respectively the
other side of the tick.
There are four main groups of stocks that can be
differentiated which possess the same proportional amplitudes, i.e.
they swing alike. Let us give each group a colour to distinguish
them from each other. We call them red, green, blue and black
groups. To anticipate, these groups when compared to human
Page 92

beings maybe classified as: the red groups contain the youngsters,
jumping back and forth; the green group contain mature people,
settled, acting with a purpose; black and blue groups contain the
old folks, going slow, acting slow, but, just the same, arriving at
their destinations.
Each group of stocks operates according to its colour, i.e. the
red group and the stocks belonging to it operate on green etc. To
define each stock and assign it to its group is not hard. Check
several major as well as minor swings of a stock mark down the
colours of the field at which it stopped in, at tops and at bottoms.
You will quickly notice that these turning points either fall in red
nests or in green nests or at some other colour. Black and blue
stocks have no nests, but just single points around which they stop.
If the colour of a stock should be green, the stock will always meet
resistance within an area designated by G (green), comparison as a
rule a nest, 3 3/4 points long. The important points of such a nest
are the corners. Looking over the circle chart we see one between
48 3/4 to 52 1/2 marked with G. This nest encompasses all these
prices: 48 3/4, 48 7/8, 49, 49 1/8, 49 1/4, 52 3/8, 52 1/2. The corner
values, 48 3/4 and 52 1/2 are most important. Each major house as
well as each minor house, contains two green nests which are
resting places for green stocks. The major houses contain also two
isolated spots for green stocks, which are stopping places for this
group. The major house, extending from 30 to 60 contains a green
nest from 37 1/2 to 41 1/4 and another from 48 3/4 to 52 1/2; it has
isolated spots at 31 7/8 and at 59 1/8. Keeping the centre in mind at
all times we find it to be located at 45.
Supposing a stock makes a bottom at 31 7/8 as did Case
Threshing CTM in 1933, this stock will find its first resistance in
the green nest extending from 37 1/2 to 41 1/4. It most likely will
hold there for a while. Going through 41 1/4 on the upside, the
stock will have to swing on the other side of the dead point, 45 and
enter the nest of 48 ¾ to 52 ½ (note form method #1: 31 7/8 plus
Page 93

17 1/2 equals 49 3/8!!). The stock will stay there for a while,
possibly react below 48 3/4, calling for a reaction into the nest
extending from 37 1/2 to 41 1/4. Turning up once more, the stock
should pass through the nest 48 3/4 to 52 1/2 and come to a stop at
58 1/8, the exact distance from the mid-way point as was the point
of beginning to the mid-way point. The pendulum of this stock has
completed one full tick and is ready for the next. This was one
cycle.
The swinging process continues from one house to another,
with stations always in a nest or at an isolated spot for major and
for most minor moves. If a major move starts with a bottom at 63
3/4, the green comer in the lower part of the minor house,
extending from 60 to 75, then the move will assuredly find an
important resistance point at 116 3/4, from which point a sharp
reaction should set in, even though the stock goes higher
afterwards. The centre of the swing in this case is 90. Be it
understood, however, that there are numerous swings of minor
importance to and from many green nests and green isolated points
or combinations of them, possible, until the final price is reached.
It represents the goal, the price for a major change.
The major house from 30 to 60 contains the following nests
for red stocks: 31 7/8 to 35 5/8; 43 1/8 to 46 7/8; 54 3/8 to 58 1/8.
It has isolated spots for red stocks at 39 32/8, 50 5/8, marked with
R. You may have wondered at times why so many stocks stop at
39 7/8 and never make 40 and also why so many cross 50 and then
drop back.
The same major house contains two points for black stocks:
30 and 60; we have no nests for them proper, but they make their
temporary homes in the green nests. The minor houses have no
points for black stocks except the temporary resting places, the
green nests.
Blue stocks do not have any nests, just isolated spots. These
blue isolated spots are located solely in minor houses, 16 7/8, 28
1/8, 61 7/8.They are identified with a small dagger shaped triangle.
Page 94

These blue spots are at the same time isolated spots for red stocks.
This is why these points are marked BR (blue and red). Blue stocks
also use the green nests as resting places.
The four groups of stocks have their nests and isolated spots
placed in equal proportions all around the circle, wherein they
hibernate for periods and then switch from an up move to a down
move or vice-versa.
Of the black and blue stocks it is highly important that you
distinguish them from purely green stocks. They gather in green
nests just as if they belonged there. You may mistake them for
green stocks, causing unexpected losses. A distinction, aside of
their making major bottoms and tops at their identifying numbers,
such as 16 7/8, 28 1/8 for blue and 30, 60, 90 for black stocks
(occasionally also 15, 45, etc.) is their more radical movement,
their wider range, compared to normal green stocks.
Stocks exceeding a price of 360 will simply continue their
second circle by using the same houses over again, adding the
points to 360. Thus a green stock will have its first green nest
beyond 360 between 363 3/4 and 367 1/2. The second nest
between 378 3/4 and 380 5/8.
Most likely the thought will arise in your mind as to how this
method fits with Method # 1.
This method does not consider a time factor in the sense of
days, weeks or months. Its time factored hidden within the swings.
The time extends from one swing to the other; this time is
measured in amplitude. It does not consider gaps as such,
explained in the previous method. This method allows for nests in
which stocks can find a suitable eighth to alight, preferring corners
for roosting, while the other method allowed a leeway of 2 7/8 to 3
respectively in addition to their 17 1/2 and 8 3/4 points
movements. They agree with each other in locating only important
tops and bottoms, none of them being reliable for calculating the so
called "jiggles".
Page 95

An example, showing the operation of both methods combined to
give an increased degree of accuracy and safety in operations is
typified by Case Threshing CTM during 1933.
The bottom in March 1933 was 31 3/4, or 1/8 below the
isolated given spot 31 7/8. The top in July 1933 was at 103, exactly
1/8 below the isolated green spot 103 1/8. The motion was through
one complete major house, one minor house, and again one major
house. The points were the same each one an isolated green spot,
found in the lower part of a major house.
The reaction from this top reached 59 1/4, or l 1/8 points
short of the isolated spot 58 1/8, (compare the same stock how it
acted in 1931 when it dropped from 131 1/2 to 59 1/2 as shown in
previous example!). The first rally went to 76 (in 1931 it reached
77), where it was short 7/8 points from its isolated spot 76 7/8.
This shows the pendulum law nicely; short on one side caused
becoming short on the other side! The reaction came to 64 (in the
1931 movement it had reacted to 63 1/8); this belonged to the
green area 63 3/4 to 65 5/8. Then came a rally to 83 1/4, located in
the green nest 82 1/2 to 86 1/4.
This was followed by a strong reaction to 54 ½, moving from
October 16th to 21st, 1933 in a range from 54 1/2 to 63. Taking the
average, however, produces the centre of this lowest swing to have
been about 58 1/8, an isolated spot. This was followed by a rally to
76 1/4, short 5/8 points from the isolated green spot 76 7/8. A
reaction followed to 63 7/8, the green area, extending from 63 3/4
to 65 5/8. This was followed by a rise of 86 3/4, a half point
beyond the green area 82 1/2 to 86 1/4.
You cannot find a single change of importance that did not
occur in one of the green areas or green isolated spots. The red,
black and blue points were passed, ignored completely, non-
existing for that stock showing that they do not cause any
resistance to its movement whatever.
Going over the same period according to our Method # 1, we
Page 96

find the bottom at 37 1/4 and the top was 70 points away at 103
(twice 35). First reaction from 103 should have produced
resistance 17 1/2 points from the top. The stock went through that
point with lightening speed (I watched it myself!), the range that
day being 91 7/8 to 78. We had to figure 8 3/4 points further as the
next resistance point, providing no gap was made. There was no
gap. This brought resistance due at 76 3/4 (a green point is located
at 76 7/8!). It made 77 flat. Buying at the price would have made
us miss the bottom; we would have to buy at the market as it
approached.
The next day to our consternation the stock made a gap
downward instead of rallying as we figured it would. What was to
be done! We knew that 76 3/4 to 77 was critical. Breaking through,
simply meant: sell again what you bought go short once more and
take a three point loss; you cannot always be right with your
analysis. A gap down meant a big move was due right on top of the
other downward. It could not mean less than 17 1/2 points. So why
worry about three! The gap was made at 77. 77 less 17 1/2 meant
59 1/2 a figure we constantly meet with Case. The stock made 59
1/4 cheating the calculation by just a quarter. There was an isolated
spot as a major resistance just below it at 58 1/8. So as to satisfy
both methods, the stock stopped between these two points.
It is useless to keep on analyzing individual stocks any
further; the movements constantly repeat. Enough examples were
brought in the first method and this short example of Case, CTM
proves that the laws repeat. You may now proceed to test several
stocks in various periods yourself gaining the necessary
experience.
Do you still think that weather reports in the newspapers or
on the news ticker move Case up and down? If you do, it might be
true.
To be positive of the colour a stock uses, check back at least
one full year for the points at which tops and bottoms were made.
Page 97

I have found that in one comprehensive cycle, certain stocks work
on green, while in the next one they may work on red. At the
present time we find working on green: X, GM, CFG, DD, AC,
CTN, WX, CN. On red we find: UN, K, UP, ACD, UGI, PU; on
black we have A and IR; on blue, UAF, CLZ, & AAC.
One peculiarity must be noted that is found in higher priced
stocks; the higher they get, the more they get tempted to operate on
green for their major turns and stay on red for the minor. Bear in
mind that at 90 we enter a new quadrant.
---- ooOOOoo ----
The Ellipse Method (Method # 3)
The big progress of ethnology during the past forty years has
produced the most interesting phenomena and manifold forms of
superstition as exist today among cultured people.
Compared with the proportionate mythological ideas of
former times, we find many analogies, often of a common source
of origin and finally a real cause. They are found in the natural
causal necessity of reasoning, in the search for explanations of
unknown phenomena, by trying to locate causes. It is especially
true of mobile phenomena, which preclude danger and cause fright,
such as thunder, lightening, earthquakes, eclipses, breaks in the
stock market. The need for causal explanation of such phenomena
is found with the most primitive people; it even exists among the
higher mammals.
A dog, barking at the moon, at a sounding bell or a flag that
waves in the wind, not only shows fright of the unknown, but also
a subconscious desire to know the cause of the phenomenon.
Movements of stocks and commodities evidently belong to
Page 98
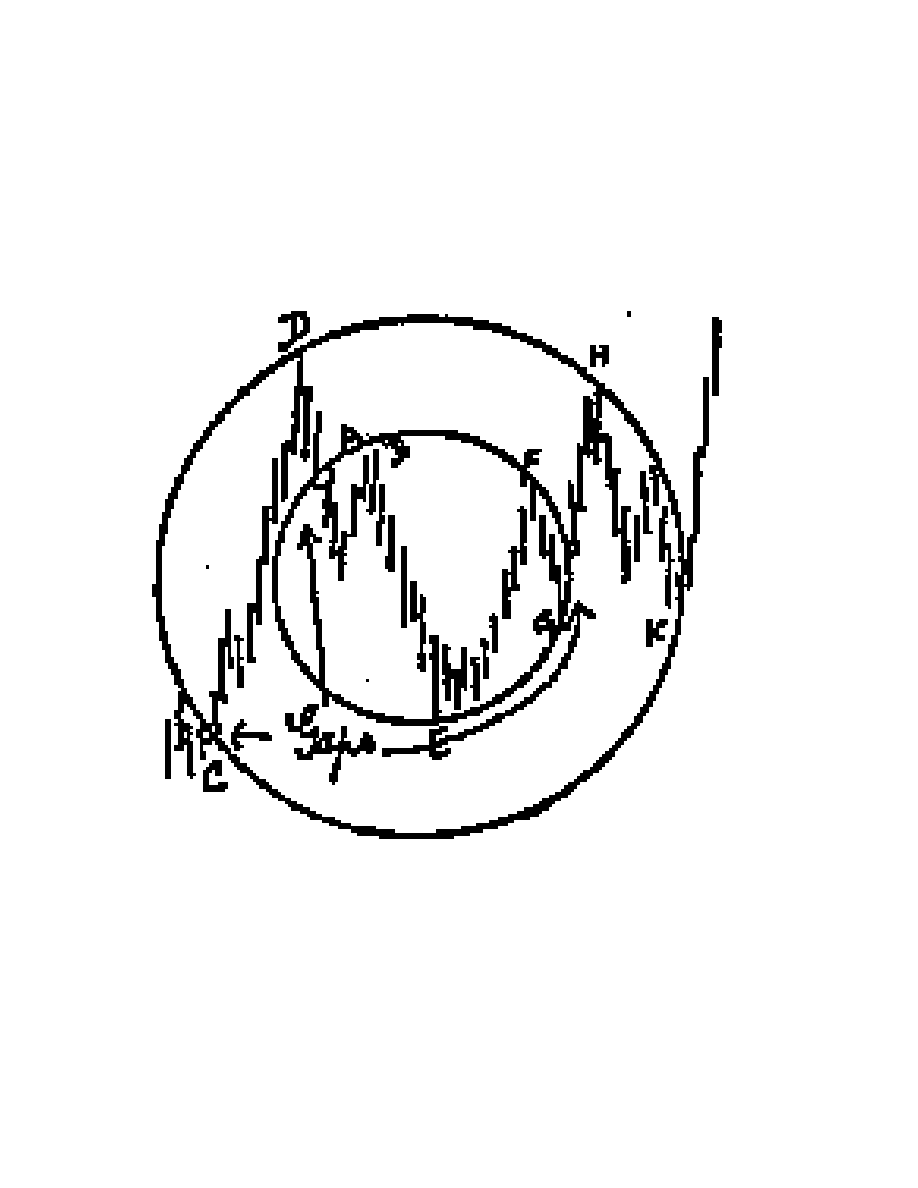
Page 99

the same group of mobile phenomena. The public as well as the
government is thoroughly scared of them. They react like a barking
dog, frightened scared curious, inquisitive but unable to grasp the
laws which, known to a few, are not recognized by the many. To
prove this contention, we all know of the investigations by the
government of stock exchanges, whereby every possible phase is
investigated at terrific cost except the right, the real cause.
There are thousands of mathematicians and astronomers in
our country who know of all the manifold laws of ellipses and their
equations, but none of them ever considered that each stock is
moving in pre-destined, pre-fixed elliptical paths!
Mathematics defines an ellipse as the locus of a point, which
moves in a path so that the sum of its distances from two fixed
points has a constant value. The two fixed points are called foci.
It has been proven that the planets move in space in ellipses around
the Sun, which is located in one of the foci.
This law gives the connecting link and is the reason I tried to
devise certain forms of ellipses, which could be of practical use in
chart reading. I do not claim that the theory developed herein is all
that is ultimately to be said by me concerning ellipses. It is far
from perfect the way it is presented. It is only given with the idea
of pointing out the direction, which can solve the problem with
which we are confronted in market movements. Therefore this
method is to be used in conjunction with methods # 1 and # 2.
Before touching the actual ellipse method we examine an
easier method first, closely related to it. It has to do with actual
circles. Each stock has two radii (See figure), two circles or
spheres of movement, which comprise a major and minor, sphere,
a major and minor radius. When a stock makes a gap, it passes into
a new sphere and all its activity will be in this new sphere until it
departs, either on the upside or on the downside into a new sphere.
Page 99

The two radii of each stock are found by simply measuring the
distance from a bottom to a top or from an important gap to a top.
The main radius never measures more than 9 7/8 points and not
less than 8 points. Beyond this range adjustments must be made to
proportion the radii to the higher or lower ranges as the case may
be. The minor radius contains between 2 7/8 to 4 3/4 points.
Supposing we have reached a bottom and passed beyond it,
as indicated by one or two days higher bottom for each day's
trading range. In this case, take the compass and draw from the
lowest price or bottom your two radii the large one and the small
one, to show the first lines of resistance areas. As the days pass by
on the so-called x-axis of your chart we constantly get closer to the
radius drawn in, i.e. to the line of resistance. Finally, the daily
fluctuations will reach the line. Then it will either jump this
resistance boldly, by making a gap, or it will react to the other line
of resistance, which lies within the circle and stop there.
The application of the circle law as shown in the figure is
somewhat different and can only be used when part of the
movement is over. This specific one is good beginning with A or B
at the latest. In this case, take the circles which fit your special
stock (made on celluloid) and fit the large circle so that it passes
through the lower gap at C and the top made at D; the small circle
to be fitted into the gap at A and if that should not prove to be
sufficient, then use point B for good measure. Automatically will
you then have located the following points: E, F, G, H, and K have
to form changes of trend just at the point where I drew them to;
what is meant by it is that whenever the stock in its movement hits
the line of the inner or the outer circle you can expect a change of
trend and act accordingly when other factors, method # 1 or # 2
agree. The method explaining critical degrees brought later is a
good indictor to be used in conjunction with this method.
Page 100
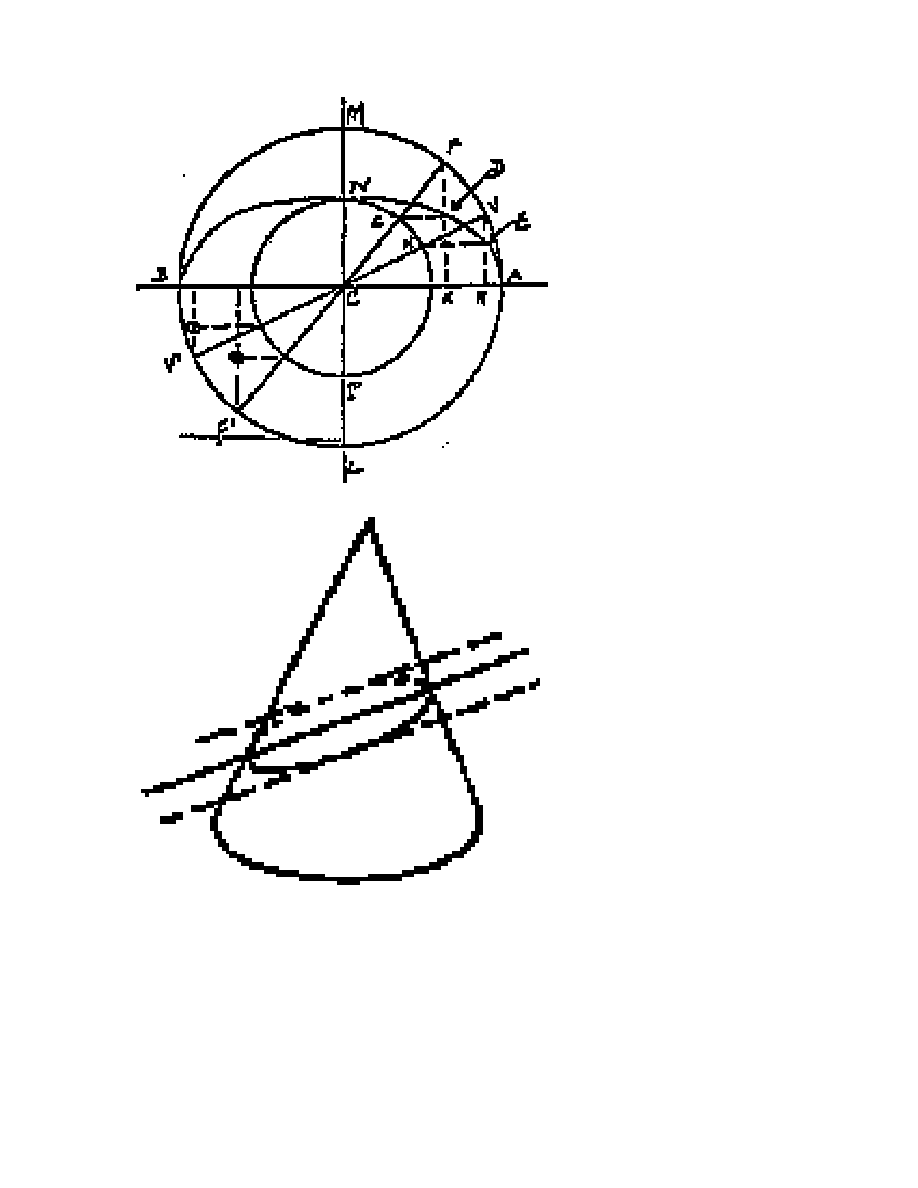
Page 101

From this rather simple method, the most important method shown
in this book grew up: the ellipse method.
The most painstaking work, exact, without errors, careful
plotting of charts is of prime importance. The next is the exact
ellipses as to size made on celluloid so that they are easily handled
and last a long time.
The construction of an ellipse with ruler and compass is done
as follows: Draw two circles around one common centre C.
The radius of the first (CA) represents one half the size of the
major axis AB of the ellipse to be constructed and the radius of the
second circle CN represents one half of the ellipse we intend to
construct. Both of these axes are known.
The line AB will become the major axis; rectangular to it
through the centre C we erect the minor axis, PN (ML). After that,
we draw many auxiliary lines through the centre C, all of which
reach the periphery of the large circle AMBL. From each
intersecting point such as F, F1, draw a line parallel to the minor
axis PN such as FK, VR and a line from each intersection point of
periphery of smaller circles with the lines FFI, VVI and others
drawn the same way, parallel to the major axis. These lines are
shown as GD, HE. These two lines will intersect a point D or E
and others, which lie on the ellipse desired. Continue construction
of more such lines and intersections through these points.
For better illustration of the important properties of an ellipse
one must know that if you lay a plane through a cone in such a way
that this plane forms to the base of the cone, an angle that lies
outside of the actual body of the cone, the periphery of the cut
produced by the plane on the cone is an ellipse. If the cone is cut
any other way, you will obtain similar curves, called hyperbola or
parabola respectively. An ellipse can be constructed
mathematically, when five points are given or known. The five
points must be either on the periphery proper or on the two axes.
Page 101

Astronomers find the elliptic path of a planet through accurate
observations at various intervals, five different positions at least.
By experimenting along time with this law of elliptic motion,
I have been able to construct two ellipses whose size and pro-
portions fit the actual motion of stocks perfectly, These synthetic
ellipses can only be used in connection with the special chart paper
recommended in the appendix, made by Keuffel & Esser of New
York, provided that one square of the chart is used as one point of
motion of the price of the stock. By laying these ellipses in such a
way that five points, five different bottoms and tops, in this case
also minor ones can be bought to full on the periphery of this
ellipse, then all other resistance points will automatically be found
either on the periphery of the ellipse or on its two axes.
A movement in one direction is not over until the stock reaches
a particular point, a situation that is similar to that of a gold fish in
its bowl-once in it, there is no way of escape, unless it jumps.
Opposite is a picture of wheat from January to July 1936. It is
only approximate to illustrate our points.
The beginning of a new ellipse is usually hidden within the
previous ellipse. The tentative direction of the new ellipse can be
discovered through fitting the periphery of the new ellipse into two
points of the old one, the last important low (6 and 11) and the
immediately preceding high (1 of our figure). On the ellipse that
extended from January to June 1938, we had as starting points the
following five in January. 1, 2, 3, 4, 5. The bottom #6 of April 3rd
met the ellipse on its periphery and caused a "bouncing back" to
the other side of the ellipse which was reached April 18th and
22nd, 1935, #7. From this point, a decline ensued until the lower
periphery wag reached once more at #8. Having walked across the
entire ellipses never leaving it, we were now ready for a big
movement. My advice to clients on June 5th was: A thirty cents
movement is coming in wheat on the upside; buy it immediately
Page 102

and sell it at 114 1/4 in August and make the date August 5th.
At that time (June 5
th
) we had point I and point II definitely
located. We had the little resistance at III and next day at IV which
I define with a permanent line that I put through the ellipse, the
cause or reason for it being unknown so far, except that I know it is
part of "my" ellipse. This gave me four definite points. The major
axis pointed straight up to August 5th and the end of the ellipse
showed the price required for that day to be 114 1/4, not more and
not less. It made 114 5/8 on August 6th, 1935, and the calculations
were wrong 3/8 in price and wrong one day in time. Kindly do not
ask how many people sold wheat short on June 5th and all the days
that followed. It must have been many; the fast movement later on
showed that they discovered their mistake and covered, pushing
prices up madly so that my predestined price could be on the day it
was due.
Some readers may, of course, interject and say: Bah, it was
the drought out West! My clients made $1500 for each $500
invested in wheat during these two months and some made even
more with pyramiding, and they ascribe it to immutable laws.
Irrespective of whether a drought, or floods or insect pest brought
about the event of a $.30 rise in wheat, Nature found a way to raise
the price and it was visible as to date and price on June 5th, 1936,
when the public did not want wheat. It proved that they did not
want it, because it sold between 84 and $.84 1/2 compared to 1.14
1/4 two months later.
Coming back to the ellipse and its position when a new
movement sets in, it seems as if the focus of the old ellipse
compared to the focus of the new ellipse had some relationship
with each other. Through one focus you can lay innumerable
ellipses, but only one ellipse through 5 points.
In method # 1, I made a special note that wheat likes to move
in 1/8 points and in 30 7/8 point moves. The last bottom of June
8th, 1936, was 84 1/4 for wheat. The first top from which a
Page 103

reaction(a 4 3/6 points reaction) ensued, was at 98 1/4 or a trifle
above 13 1/8 points. The next top was at 110 1/2 or 13 1/8 (very
close) points away from the previous top. And the actual top 114
5/8 was very nearly 38 5/8 points away from the low of June
7th-8th, 1936 and when we consider that the actual low for wheat,
the last low of the old ellipse and the low of the new one was 83
1/8, we obtain our full 38 5/8 points.
When a stock or wheat makes a gap over the major axis, this
point may be used to get the ellipse or adjust it, giving many times
the 5th missing point. For wheat I only use the small ellipse, as I
do for medium priced stocks. For high priced stocks I use a large
ellipse. They are used for daily or for weekly charts.
Their sizes are as follows :
large ellipse: major axis 9.75 in; minor axis: 0.925 in, x. 2
small ellipse: major axis 6.25 in; minor axis: 0.925 in, x. 2
If you make these ellipses for use, produce them first on
paper and then transfer them on to celluloid, which must be strong
enough to withstand constant use, yet be flexible at the same time.
The celluloid is placed over the drawing on paper and the lines
scratched in with the pin point of a compass. You require aside of
the periphery also the two axes.
Supposing there had been a long upward move. The bottom
formation where the move began gave the basis of how to place the
ellipse, by having it fitted to 5 bottoms or tops all located within
close vicinity of the end of the previous ellipse. The line of the
major axis will show the main trend the direction of the move. At
times while a movement is on, you will find that a stock moves in
the lower half of the ellipse, suddenly it will rush into the upper
half of the same ellipse, down to the lower part again, up once
more, and so gradually approach the end of the ellipse, never
leaving it while making the ascent or descent. You should buy
stocks when the lower periphery is reached and sell stocks short
when the upper periphery is touched or nearly so.
Near the top, where the ellipse ends, you will note sharp move-
Page 104

ments up and down from one side of the ellipse to the other as it
narrows down and there is no more playroom left until finally
emerges at the end of the ellipse or jumps over it, which ends the
specific cycle. Right there and then a new ellipse becomes
operative, which has its head hidden in this past formation of the
previous ellipse, predetermining the direction, the ellipse must be
placed to be fully drawn ahead.
While studying the Bible and our friend Noah with his ark, I
connected this ark immediately with my ellipse and simply put a
man into the ellipse of the 6.25 inch size given to you. Strange, the
head of the man shows the top or bottom formation just as
explained above; the hand of the man gives me important
resistance, both the right and left hand; the upper foot of the man is
usually the exact top; while the lower foot is the place where the
stock leaves the old ellipse and goes into a new one. I suggest that
you make a special ellipse wherein you draw the skeleton of a man
in the right proportion lay it over charts and you will see things
that will astonish you. The elbows, the knees and the shoulder
blade, all these points give you resistance in stocks or
commodities. This is why I suggest to you to just trade in a few
stocks or commodities and get to know them! We could start all
over here and divide stocks into elbow stocks knee stocks etc those
that stop at these points. They do and nothing can be done about it
except follow strictly the rules Nature laid down for us.
Some time ago, I found a point situated beyond the ellipse,
which promises to be one of the five points that may be used to fit
the ellipse into a new movement. The point is always located on a
line, which forms the continuation of the preceding major top or
bottom line (the day on which the last top or bottom was made). I
first lay the ellipse's periphery. Then I place the point formed by
the intersection of ellipse animator axis in a position so that it falls
on a point, which again lies on the continuation of the last major
bottom or top day, at the same time not changing the other points
Page 105

obtained by way of the periphery. This is done and continued until
the actual bottom or top just being formed shows enough points to
safely establish the angle in which the new ellipse lies.
Looking at past performance of the general market when
plotted on K&P special paper, we find that from the bear market
bottom of July 8th, 1932, we moved upward on small ellipse to the
September 8th top, 1932. From there, we declined one 9-inch
ellipse to the bank holiday; we rose one 9 inch ellipse to the July
18th top 1933, declined a 6-inch ellipse to the October 21st
bottom 1933, rose a small ellipse to April 20th, 1934 (from Jan.
8th low of 1934) and a 9-inch one measuring from Oct. 21st 1933.
We declined a 9-inch ellipse to the July 18th top, 1933 bottom,
moved up a small ellipse to May 20th top 1935, the reaction down
to June lst that year showed that a new ellipse formed upward and
we rose a 9-inch ellipse once more to the December 10th top,
1935. That way it keeps on in the major cycles and all we have to
do is use the ellipse.
Some mathematicians may object to my ellipses and say:
with what right do you use just these sizes and not others? The
answer is that everything I showed you so far, from Page One to
the very end came from studies of charts and of the Bible plus a
little bit of general education. Testing a long time on charts gave
me these sizes.
However, I recently just found that the large axis of the 6
inch ellipse divided by the small axis shows its value to be Z. Of
course, I also tried to combine the other methods with this ellipse
method. Strange facts were found possibly of great interest to
mathematicians. That some relationship would exist between the
two methods was evident, though invisible, until by accident I ran
across it. I grasped the idea of constructing isosceles right-angled
triangles whose equal sides I made 35 points long. Then I
attempted to fit into it the small ellipse whose diameter is 6.25
inches, and it proved to be exactly the one and only ellipse that
Page 106
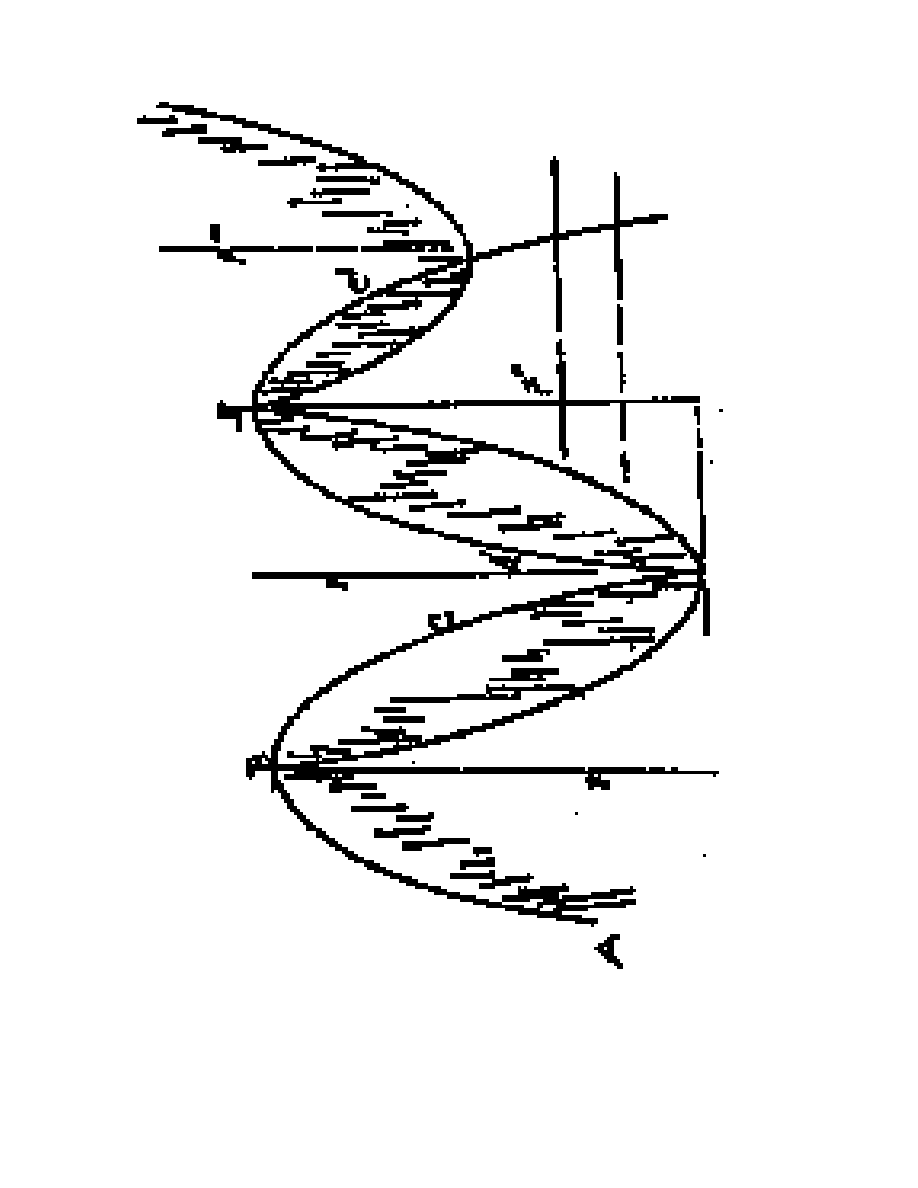
Page 107

could be inscribed.
The reason for stocks moving 17 1/2 points and 35 points
(explained to you right in the beginning) is given in Revelation and
in Daniel. The ellipses we may call the Ark of Noah. I would have
several more explanations for other factors, but we leave those
alone for some other time, else things would get too "un-
believable".
There is another way to use the 6-inch ellipse to determine a
change of trend in the market. Lay the ellipse at a bottom or at a
top in such manner that the major axis is placed on the low point, if
there be a bottom, or at the high point, if a top. You will find that
as soon as the stock gets to the periphery of the ellipse as time
moves on, it will either react from there or it will jump over it
when a gap is made if the move be an upward move and at the low
price of the day previous to the gap if the move be downward. The
higher priced stocks work best because their minor swings are of a
size befitting the small ellipse.
Extremely interesting and exact operation of this law can be
seen in U.S. Smelting and in the old stock of National Distillers,
both in 1933. You may copy the high and low prices from your
public library newspaper file. Use the months of May to October,
1933.
For this special law a second ellipse, or rather portions of it
are used that are built into the main ellipse of 6.25 inches. In our
figure, consider ABC to represent the periphery of our 6-inch
ellipse and A1, B1, C1 the same only carried over for operation
and measuring. Then the curve BD and DB1 are simply the "up-
side-down" of the same ellipse ABC. F, F1, F2 represent the major
axes of the ellipses. You begin measuring at B, the moment the top
is made. The trend is down and the motion of the stock will stay
within the two parts, the right periphery of the actual ellipse and
the inverted one which has its beginning also at B so long, until it
passes out of it, which usually happens where these two curves
meet on the low side. The time consumed to pass through is at the
Page 107

most 22 to 23 days. It is therefore used for swings, lasting 3, 7, 10,
13, 22 days or whatever time swings are possible within these
limits. When the lower curve is reached, you make commitments
for the upper; when the price reaches the upper, sell short for the
lower.
This is a method unusually suitable for high priced stocks
and for small swings lasting a few days. Dupont, in 1934, and
American Can from June, 1935, when these stocks had a sideways
movement within 8 to 12 points, gave turning signals uncannily
each time. The picture of Dupont in 1934 beginning with May,
1934, repeated our picture about 8 times absolutely correctly and
only dropped it when it finally made its big movement upward.
The range of Dupont for that period was between 78 and 90.
Of course this picture of Dupont for that time was again
encompassed in a large ellipse lying sideways, and tops as well as
bottoms would have been found by just using the rules of ellipses.
However, for small movements such as the combination ellipse is
able to indicate, you most likely would have missed two
movements out of three.
In trading, we must constantly try to make the best of
everything, to use everything that is able to bring profits. The
method above requires constant attention and checking of all
factors and cannot be used by a trader who for several days is
unable to follow the stock closely; he might find that in the
meantime, the stock has abandoned this type of motion and is
already 20 points away from him. Bear in mind that each time such
movement occurs in any stock a big move invariably will follow
out of it, up or down depending on factors which we know by now
how to discover. An example is brought herewith of UV (U.S.
Smelting):a bottom was made on June 5th, 1933 at 40 3/4, with the
intersecting point of the periphery and major axis of the ellipse
passing though this 40 3/4, brings the line of the major in
conjunction with the day's high and low price-line of the chart; in
Page108

this case 40 3/4-44 ½ (high and low). Following the curve of the
ellipse, you will find the next bottom made on June 10th to 11th at
43 on the ellipse. After this bottom was made place your ellipse
upon this new bottom, bringing the following bottom once again
into the ellipse. At some time, the reaction stops at the narrow
ellipse, while at other times it passes into the wider ellipse.
When a reaction does not fully meet an ellipse, but holds 3/8
to 1/2 point away from the line, then the next day it hesitates again
and holds in a narrow range it invariably indicates the coming of a
gap. This gap, however, is not toward the ellipse, or a jump over it,
but away from the ellipse and within the ellipse. This particular
fact is very important and should be studied with various cases.
June 26th, 1933 illustrates that situation clearly in UV. Lay the
ellipse at this day's bottom which was 50 1/2; this ought to give as
the next bottom on July 10th to 11th at the latest, a bottom at 53
1/8 for the first date and 53 3/4 for the second date. On July 10th,
the stock however, only made a low of 54. On the 11th of July it
stayed between 54 1/2 and 55, a range of one half point. The next
day it opened with a gap upward, having a low of 58 that day.
Operation on the downside is similar; let me adds, though,
that for some reason or other, unknown as yet, the upward moves
operate ideally, in fact almost 100% correctly but the downward
moves do not seem to operate so well. Extreme care should be
used in forming conclusions for the downside.
We now have combined three methods into one, all dealing
with ellipses and circles.
It must become evident by now that it is much easier to
discover the major movements than it is to fund the small ones.
The average trader is exactly looking for the reverse and always
loses. Hundreds of examples could be brought regarding the ellipse
laws. Since you have certain stocks in mind that you would like to
analyze, try the rules on several of them, using one method after
Page 109

the other, then combining them. To test the laws yourself, will be
of more positive help to you than one hundred various examples.
In making charts, a compass and a transparent protractor are
necessary. The finer the chart work, the better you can interpret it.
You gradually should read charts of stocks or commodities; the
sure way is your morning paper. You must be able to grasp
direction and time quickly, so that you can trace in your mind the
way ellipses should be placed without even drawing them. The
position of a gap on a certain day should tell you without further
investigation at what point the next resistance should be expected.
It has taken me years to shake off concrete facts, the idea that
Washington or France move the market, but once discarded a new
foundation had to be built.
The Bible was used as foundation and it proved to be a solid
one. For those who want further proof that the Bible is nothing but
an astrological book and proof that the writers of the Bible knew
more about astronomy than we ever will know and especially of
the influences of heavenly bodies upon human beings, I bring
Chapter 720 of Herschel's "Outlines of Astronomy", from my
copy, dated Philadelphia, Pa., 1849.
Now, although it is true that the mean motion of no planets
are exactly commensurate, yet cases are not wanting in which
there exists an approach to this adjustment. For instance in the
case of Jupiter and Saturn, a cycle composed of five periods of
Jupiter and two of Saturn, although it does not exactly bring about
the same configuration does so pretty nearly. Five periods of
Jupiter are 21663 days (hold this value for later!!), and two
periods of Saturn, 21519 days. The difference is only 146 days, in
which Jupiter describes, on an average 12
o
and Saturn about 5
o
;
so that after the lapse of the former interval they will only be 7
o
from a conjunction in the same parts of their orbits as before. If we
calculated the time that will exactly bring about, on the average,
three conjunctions of the two planets, we shall find it to be 21670
Page 110

days, their synodic period being 7255.4 days. In this interval
Saturn will have described 8
o
6' in advance of the preceding, which
is near enough to establish, not, it is true an identity with, but still
a great approach to the case in question. The excess action, for
several such triple conjunctions (seven or eight) in succession, will
lie the same way and at each of them the elements of P's orbit and
its angular motion will be similarly influenced (Note: the author
here states clearly that one planet influences the other two
enormously big bodies!!) so as to accumulate the effect upon its
longitude, thus giving rise to an irregularity of considerable
magnitude and very long period which is well known to
astronomers by the name of the great inequality of Jupiter and
Saturn.
The arc 8
o
6' is contained 44 4/9 times in the whole
circumference of 360
o
|; and accordingly, if we trace round this
particular conjunction we shall find that it will return to the same
point of the orbit in so many time 21760 days or in 2648 years. But
the conjunction we are about to consider is only one out of three.
The other two will happen at points of the orbit about 123
o
and
246
o
distant and these points will also advance by the same arc of
8
o
6' in 21760 days. Consequently the period of 2468 years will
bring them all around, and in the interval each of them will pass
through that point of the two orbits we commenced; hence a
conjunction (one or the other of the three) will happen at that point
once in one third of this period, or 883 years (remember this value
for later) and this is therefore the cycle in which the great
inequalities would undergo its full compensation, did the elements
of the orbits continue all that time invariable.
This is what Herschel has to say. A cycle, or rather the circle
has a length of 368
o
6'; one third of that circle is 122 42'. To prove
Astrology in the Bible is very difficult because of the clever
substitutes the writers have used. The maze of statements and
Page 111

stories, the individual meanings of each chapter and especially the
fact that everything that is measured therein in degrees, years or
days, is meant to be a part of 368
o
6' and not a part of 360
o
.
We find in the Book of Ezra, Chapter 2, verse 2 up, the
people who joined in the first expedition under Zerubbabel
(Jupiter), the number of the people of Israel (which again is
Jupiter) verse 2 tells us that Zerubbabel came with 10 other leaders
which are called by name, making a total of 11. We therefore use
only the first 11 tribes enumerated thereafter. Verses 3 to 13 gives
us their names and number:
Children of Paroah
2172 (note astronomer's value 21760! )
Children of Shephatiah
372
Children of Arab
775
Children of Pahathmoab 2812
Children of Elam
1254
Children of Zattu
945
Children of Zaccai
760
Children of Bani
642
Children of Bebai
623
Children of Azgad
1222
Children of Adonikam
666
Grand total of
12243 or 122 degrees 43'.
This shows the specific cycle of Jupiter divided in its parts, a
value which the astronomer found too.
The balance of the count refers to 37
o
10' and 82
o
36' cycles,
which latter value is shown when adding the tribes as 8196 (81
o
96'
= 82
o
36'). These cycles have not been discussed in this book at all.
However, adding all together gives us 242
o
29'. Chapter 2, verse 65
of Ezra states that the total number of men in the community was
42360; omit the 0 and you have 42
o
36'.
Page 112

In the Book of Numbers, chapter 26, verse 7 up, we also find
a count of population:
Tribe of Reuben
43730 people
Tribe of Simeon
22200
Tribe of Gad
48500
Tribe of Judah
76500
Tribe of Issachar
64300
Tribe of Zebulon
60500
Tribe of Manasseh
52700
Tribe of Benjamin
45600
Tribe of Dan
64400
Tribe of Asher
53400
Tribe of Naphtali
45400
Grand total
601730 people or 601
o
73' or 602
o
13'.
Deduct 360
o
from this value gives you the same as above, 243
o
13'.
Going back to the time of the Deluge, Genesis 8, 14, we may
find it strange that Noah kept a diary for posterity in all his
excitement the deluge brought him. He noted carefully, that it was
in the 2nd month on the 27th day of the month in the 601st year of
his life that the Earth dried. This value represents nothing but the
same cycle as shown above.
How close these ancient astrologers came to finding the in-
equalities between Saturn and Jupiter may be seen in the First
Book of Chronicles, Chapter 15 verse 5 up: the number of men that
carried the ark:
Uriel
120
men
Asaiah
220
men
Joel
130
men
Shemaiah
200
men
Eliel
80 men
Amminadabab
2 men
Grand total
862 men.
Page 113

We have shown that these men represent degrees of the
circle, but of the circle containing 368
o
6' (actual value is 368
o
10'
48"). When we turn these degrees of the 360
o
circle into degrees of
the 368
o
circle, we get:
120
o
equals
127
o
43' 36"
220
o
equals
224
o
59' 56"
130
o
equals
132
o
57' 14"
200
o
equals
204
o
32' 40"
80
o
equals
81
o
49' 04"
112
o
equals
114
o
32' 41"
Grand total:
882
o
35' 11"
These degrees we have to take as representing years; in that
case we have the great inequalities of Jupiter and Saturn just as the
astronomer found them 4000 years later.
The Book of Numbers, Chapter 2, gives us another account.
The writer of this particular Book seems to have done the work of
previous writers all over and found a figure that somewhat deviates
from others, and clearly shows that there was checking and
rechecking done of these values:
Tribe of Judah
74600
Issachar
54400
Zebulon
57400
Reuben
46500
Sharon
59300
Gad
45650
Ephraim
40500
Manasseh
32200
Benjamin
35400
Dan
62700
Asser
41500
Naphtali
53400
Grand total:
603750 or 603
o
75'
Chapter 2, verse 32 tells us that there were 603550.
Page 114

We wonder now what this value of 601
o
73' and 603
o
75'
respectively means. We know from astronomy that the lunar
apogee circulates in 3232.57 days. The moon's Node has a rate of
retreat each day of 3' 10.4" and is carried around the entire Zodiac
in 18.6 years.
When we divide now our 601730 by 3232.57, we obtain
18.615 years. It indicates that these parts of the Bible have to do
with the Moon's motion, or with astronomical laws. The stories,
however, that follow and precede have to do with effects of the
planets. They all denote astrological cycles and even though
universities or governments do not recognize a science that is
based on the greatest book in existence, the revolutionary action of
Neptune at this period may bring about a change of attitude.
As a final remark it may be said that these ancient prophets
had no telescopes, nor logarithmic tables nor any other facilities at
their disposal.
This last few lines may show you that I have gone much
deeper into market movements than I can bring forth in this
volume and I may state that I produce very accurate forecasts for
stocks or any commodity for any period, even without using any of
the laws given to you here. An analysis of the major movements of
the market for any one year including most of the intermediate
swings can be produced in less than one week, subject to an
occasional rectification of a plus or minus sign, which, however
can be detected before the event is due. To obtain such results
meant work that did not germinate in brokers’ offices and that
could not be learned from the usual text books.
End of method # 3
Page 115

Method # 4.
Two Important Angles
This method, on the surface has no relationship with the others
shown so far, It should be used only for high priced stocks or for
stocks (including commodities) that at times have strong moves. It
indicates when one cycle is over and another one starts.
Unfortunately, the event only can be seen a day late but in as much
as we know that a move extends over several days, this is of minor
importance, especially when it affords a check that cannot be had
any other way.
When a bottom is made in a stock or commodity (in wild
movements only), lay the transparent protractor in such manner
that the fine line that runs across the protractor from 0
o
to 180
o
i.e.
0 comes through the last eighth of this bottom and that the 90
o
angle falls in line with the day's price range. Scratch two lines on
the protractor with a pin point, one from the centre to the 82 1/2
o
angle and the other from the centre to the 71 l/4
o
angle. Fill the
grooves with ink. Do that on both left and right sides.
These lines or angles will constantly form resistance levels.
You will notice that the stocks will either rise and hold above the
82 1/2
o
angle as shown in our picture, or it will rise and hold above
the 71 1/4
o
angle as shown in minor move (the come back) in our
picture. Strong stocks will use the former angle, the weaker, the
latter. In the case of strong stocks, the first indication of weakness
is the breaking of the 82 1/2
o
angle. The stock invariably will catch
a hold on the 71 1/4
o
angle and most likely run upward along this
angle for a while, sometimes climbing above the 82 1/2
o
angle
again. The definite sign of a change of trend is shown, however
when the stock breaks the 71 1/4
o
angle and holds below this angle
for one full day. Thus, the trading range in that stock remains one
Page 116
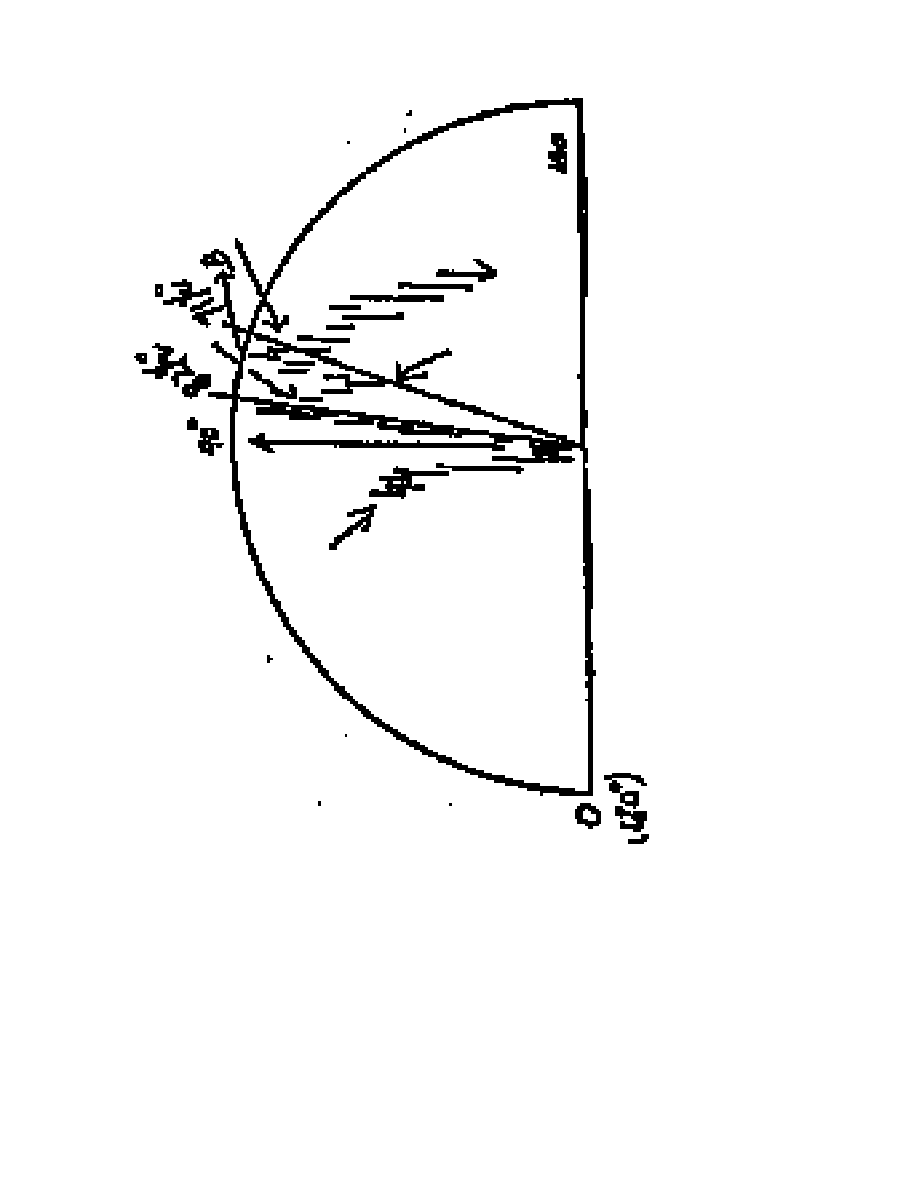
Page 116

full day below the 71 1/ 4
o
angle. In such a case we are in a
downtrend.
Then draw your angles of 71
o
and 82
o
from the newly-made
top, established a little while previously, running the lines from the
top eighth downward, at point B of our picture. The trend of the
stock will be bearish until the price is able to crawl above the 71
1/4
o
angle that leads down. It is very weak as long it holds below
the 82 1/2
o
angle. The up trend is only resumed when one full day's
trading is done completely above the 71
o
angle, drawn downwards
from the last top. If this happens, then draw your angles upward
again from the bottom eighth.
End of method # 4.
---|000000---
Method # 5
Planetary Influences Of Numbers
Numerology as discussed in text books does not seem to have any
virtue as far as stock market problems are concerned; just as little
as text books on Astrology can be used to discover the movements
of stocks. Thus I am not teaching numerology as such. However
the work of studying movements of stocks must produce at some
time or other the idea whether or not any connection does exist
between a number and the price of a stock.
Page 117

This idea was gone into when treating our method # 2. We found
four groups of stocks extremely sensitive to special prices or
special areas between two fixed prices.
The present method does not duplicate method # 2 in fact it
has no relation to it whatever. But, just as Nature always acts, our
conclusions coming out of the present method will arrive at the
same tops and bottoms as any of the foregoing methods. This
method deals with single stocks only. Before going into this
method we must understand a certain basic law, tear it apart
explain it, study it, broaden its application and apply it to stocks.
We have seen in our chapter on astronomy that planets rotate
around the Sun. This includes the Earth. The positions of these
planets are always found along an imaginary line or belt in space,
called the ecliptic. This is called the heliocentric view, whereby the
observer is on the Sun. On the other hand, if we take the geocentric
view, or the view as seen by an observer from the Earth, the Sun
seems to rotate around the Earth accompanied by the planets. In
the course of one year, the Sun passes through the entire ecliptic.
You may recall that this ecliptic is inclined to the world equator at
an angle of 23
o
27'. The ecliptic cuts the world equator at two
opposite points, which are called the Spring and Fall equinoxes.
The Sun travels upward from the Winter solstice (it is below the
Equator from the Fall equinox to the Spring equinox), toward the
Summer solstice and reaches during the period a moment when it
is exactly on the equator. This is the moment of the Spring
equinox, or entry of Spring.
To figure the positions of the planets, the entire ecliptic is
divided into 12 parts, the signs of the Zodiac, given in the prior
chapter. Ancient astrologers attributed a certain power, emanating
from a special planet to each of these signs or areas of the heavens.
Expressed in other words, they knew that specific planets had
special influences upon certain signs of the Zodiac. They called
that planet who was most powerful in a certain sign its ruler. At
this point we are not interested in how these forces operate or in
Page 118

showing what effect they have. This is a study in itself and would
cause too great a detour from our main subject. We must, however,
acquire the names of the rulers and the houses and the signs they
rule.
The first house (Aries) is ruled by Mars.
The second house (Taurus) is ruled by Venus.
The third house (Gemini) is ruled by Mercury.
The fourth house (Cancer) is ruled by the Moon.
The fifth house (Leo) is ruled by the Sun.
The sixth house (Virgo) is ruled by Mercury.
The seventh house (Libra) is ruled by Venus.
The eighth house (Scorpio) is ruled by Mars.
The ninth house (Sagittarius) is ruled by Jupiter.
The tenth house (Capricorn) is ruled by Saturn
The eleventh house (Aquarius) is ruled by Uranus.
The twelfth house (Pisces) is ruled by Neptune.
At this stage it is appropriate to acquaint ourselves with one
astrological rule, which we need later. Each house is supposed to
govern, according to astrological rules, certain phases of human
life, such as love, death, money, speculation, friends and sickness
etc. The only house we retain is the eighth house called the House
of Death, This house is ruled by Mars. That there exists enough
evidence to uphold the truth of such astrological statements will be
brought to light when we show how stocks act in Death House
numbers.
Trying all sorts of divisions of the circle so as to get to a point of
beginning (the same difficulty is faced in all such work), and to prove this
ancient wisdom is not a myth, and to apply its rules, if any, to market
movements I finally discovered that the number 27 was the number to use.
Twenty-seven is not a division of the circle, but some work of Nature. (This
particular paragraph was written a few years ago in its present wording;
since then I found the circle to be 368 10' and therefore 1/14 part of that
circle!!
Page 119

Note how laws can be found in a round about way!).
Let us call the movement of 27 points one complete cycle.
This cycle is divided into 4 equal parts producing quadrants of 6
3/4 points each. (Note the close relationship of this value to our
small ellipse and the biblical value of 601-603 to it.) The first
quadrant starts with 0, the second with 6 3/4, the third with 13 1/2,
the fourth with 20 1/4 and keeps on by adding 6 3/4 points to each
previous value.
Consider each of these quadrants one complete unit. Into
each unit we place a zodiac consisting of 12 signs or 12 houses and
equip each house with its ruling planet in accordance with the rules
given above.
When dividing 6 3/4 by 12 so as to arrive at the beginning of
each single house, we find it is impossible to obtain a number
ending in eighths, the smallest number used in trading. Therefore
we must take recourse to a range. The complete and correct
division of 6 3/4 will look as follows; adjoining each number the
ruling planets of these houses are inserted:
HOUSE
QUADRANT 1
RULER
1
0
Mars
2
1/2 to 5/8
Venus
3
1 1/8
Mercury
4
1 5/8 to 1 3/4
Moon
5
2 1/4
Sun
6
2 3/4 to 2 7/8
Mercury
7
3 3/8
Venus
8
3 7/8 to 4
Mars
9
4 1/2
Jupiter
10
5 to 5 1/8
Saturn
11
5 5/8
Uranus
12
6 1/8 to 6 1/4
Neptune
Page 120

QUADRANT 11
1
6 3/4
Mars
2
7 1/4 to 7 3/8
Venus
3
7 7/8
Mercury
4
8 3/8 to 8 1/2
Moon
5
9
Sun
6
9 1/2 to 9 5/8
Mercury
7
10 1/8
Venus
8
10 5/8 to 10 3/4
Mars
9
11 1/4
Jupiter
10
11 3/4 to 11 7/8
Saturn
11
12 3/8
Uranus
12
12 7/8 to 13
Neptune
Etc.
The exact rotation of the numbers and their houses is shown in a
simplified table on the facing page. The planet's names are omitted,
they are identified by their house numbers.
In the Table of Planets' Numbers, all the numbers of the
fifth house, i.e. all those numbers in the table of the column
marked 5, across, are ruled by the same planet, the one ruling the
5th house, which is the Sun. Any numbers falling into the 12th
house, such as 6 1/8 - 6 1/4, 12 7/8 to 13, 19 5/8 to 19 3/4 etc., are
ruled by the ruler of the 12th house, Neptune. Venus, Mercury and
Mars, however, rule each two houses. Venus rules the second and
seventh; Mercury, the third and sixth; Mars the first and eighth.
To detect the ruling planet of a stock, you must find the
lowest price at which the stock sold in the preceding bear market.
The planet found next to the lowest price (check off with the first
enlarged Table) is the ruling planet. In case a stock sold at a price
that is not a number ruled by any house, then use the number
below it (not the one above it) and call its planet the ruling planet.
A list of the most important stocks together with their bear
Page 121

market low price follows herewith:
DL 8 1/2 IL43/4
T 70
A 17 7/8
AF 3 1/8
LN 8 1/2 M 3 1/2 ATb 44 G 15 7/8
DH 1/2
BS 7 1/2 CP 7 1/4 AAC15 ALO 3 5/8
PU 10 1/2
AX 7 3/4 CN 8 3/4 K 5
11 12 3/8
AC 29 5/8
NP 5 1/8 C3
HR 10
RBC 1 7/8
WX 15 5/8
GL 8 1/8 VA 5 1/4 SX 6 1/2 ACD 42 1/2
X 21 1/8
BO 3 3/4 Z 22
CO 9 3/4 UP 27 5/8
CTM 16 3/4
Each ruler shows power whenever the stock gets to one of its
own numbers, that are HIS, his sphere, his aura. There you will
mostly find that resistance is met, be it temporary permanent. The
only time care must be exercised is at a time when a major top is
made from which a sharp reaction sets in. In such case, you must
be on your guard to note whether or not your stock has fallen prey
to some other ruler or governor, under whose influence it then will
be.
Checking carefully a large number of stocks as to their
rulership as they emerged from their bear market lows, it is
especially interesting to note that all stocks related to agriculture
such as CTM, HR, S, M, etc,. stopped at Venus numbers. Venus,
according to astrological rules governs crops, causes growth and
fruitfulness. On the other hand, it was noted that all the alcohol
stocks stopped at Neptune numbers, such are laws beyond
understanding of the average trader and, should you smile at these
strange laws and rules, just return to your statisticians and to news
reports. Serious thinkers will not shed a tear over a lost sheep. Let
him, before he leaves, remember from the Bible; that “many are
called, but few are chosen”.
Planets, like human beings, animals or other "beings'', radiate
forces, be these electric, magnetic, or both. Each individual being,
however, radiates its own unique forces. It has been proven that a
particular planet is pleased or displeased by the specific forces
Page 122
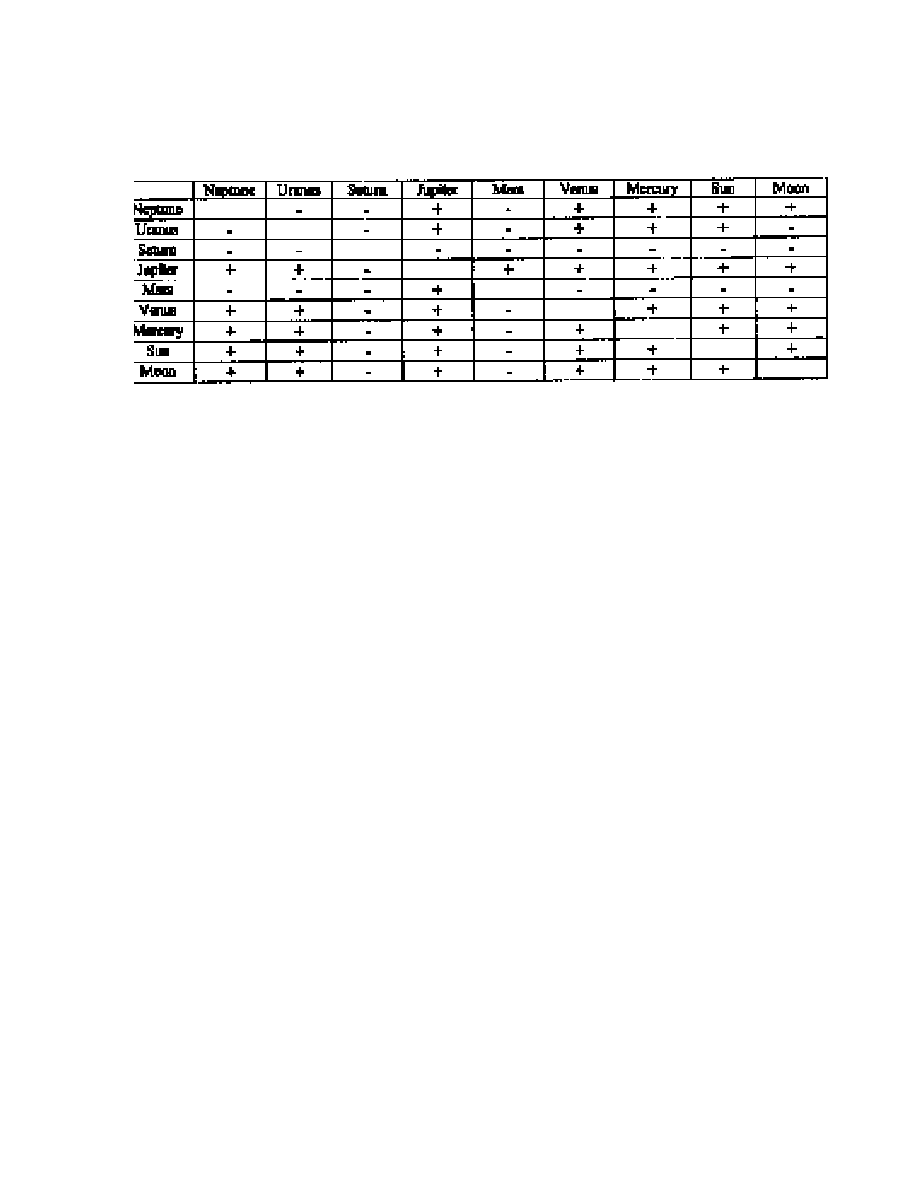
Table Of Attraction And Repulsion Of Planets
Page 123

emanated by some other planet. We are always forced to fall back
upon our old astrological laws found by the ancient wizards, those
keen observers of planetary influences, who were able to discern
these conditions without modern instruments and who were able to
establish true rules for the effects such conditions brought forth.
These forces either attract or repel. The list opposite shows
planetary likes and dislikes among the planets proper. I will use the
plus sign for attraction and the minus sign for repulsion.
Stocks that are ruled by Neptune, such as the alcohol stocks,
will find no difficulty and will meet no resistance at numbers
favouring Neptune, i.e. numbers belonging to a planet that has an
affinity to Neptune and therefore to the stocks belonging to it. We
see, when checking the above list, that Jupiter, Venus, Mercury,
Sun and Moon are in tune with Neptune. They will not try to stop
in its up move any stock belonging to Neptune.
On the other hand, the stocks belonging to Neptune will meet
resistance at all numbers belonging to the planets uncongenial to
Neptune during an up move. Planets resisting Neptune are Uranus,
Mars and Saturn or their equivalent in representative numbers.
This rule applies solely to upward movements of stocks.
It is quite the contrary, however, when stocks are on their
way downward. In this case the congenial planets try to uphold it,
try to stop the decline, while the uncongenial planets delight in
seeing him go down; they attempt to accelerate its downfall by
giving no support. Thus, congenial numbers will cause resistance
points, uncongenial numbers will have no effect whatever.
In this respect, when considering Saturn or Mars stocks, you
will at once notice that all planets are antagonistic to them, the
only exception being Jupiter which favours Mars. A Mars stock or
Saturn stock will find resistance all along the line upward.
This is why they go very slowly, like old men (see old black stocks
of method # 2) but they get where they are heading for. You also
will discover when carefully checking method # 1 that they do not
Page 123

respond very well to method # 1. It was impossible to mention this
fact when treating method # 1 because it required knowledge of
many laws to make this fact comprehensible.
Early in this chapter, particular attention was drawn to the 8th
house, which is called the Death House. Among the listed stocks
on the Board, there were not two stocks that stopped during the
bear market when making lowest prices at this death house
number. This truth should cause deep thought as to the cause of
this phenomenon. Death means death; stocks seemingly did not
like the idea and did not stop!
End of Method # 5.
Detecting The Change Of Trend By Means Of
Critical Degrees.
Measuring longitude on the Earth is measured from a fixed
meridian. Greenwich is usually taken. Longitude in this sense is
the angular distance through a place such as New York City, from
the fixed meridian that runs through Greenwich. It is always
measured from East to West. Astronomical books tell us that the
angular distance of a point from a great circle is the angle
subtended at the centre of the sphere by the intercept of the
secondary of the great circle through the point between it and the
great circle. The angular distance of one great circle from another
is the angle between two great circles. This is the same as the angle
subtended at the centre of the sphere by the intercept of their
common secondary, lying between them. Positions of cities are
determined that way.
Their explanation of celestial longitude is as follows: The
celestial longitude of a body is the arc of the ecliptic intercepted
between the first point of Aries.
Page 124

A given longitude of 85
o
15' means that the planet is 85
o
15'
distant from 0
o
Aries. The value would be shown in our ephemeris
as 25
o
15' Gemini, for we have the sign of Aries 30
o
long, the next
sign of Taurus also 30
o
in length, absorbing together 60
o
of our 85
o
15', leaving for the sign following, Gemini, 25
o
15'. In the
ephemeris, all the work is done already; they are given.
Using the Tables as shown in the ephemeris and checking
any possible relation between the longitudes of the various planets
to the stock market as a whole, I found critical degrees in the
Ecliptic. The effect of these critical degrees upon the market as a
whole is astonishing.
Whenever Mars or Jupiter arrives at these locations on the
Ecliptic in longitude, there is a change in the market, At times we
find several planets arriving on one and the same day at critical
degrees making a change of trend a surety. These critical degrees
are valid for each sign of the Zodiac. They are located at 0, 5, 17,
25 and 30
o
. Supposing Mars passes into the sign of Virgo as will
happen on September 26th, 1936. Then we should find changes
coming into the market the moment this planet passes over the first
degree, over the 5th, the 17 1/2th and the 25th degree. This
phenomenon occurs through every sign of the Zodiac.
The same is true with Jupiter. It also applies to other planets
in a minor way. A planet such as the Sun, Mercury or Venus, due
to their fast motion, teach these degrees so often and soon that they
cannot be used as indicators singly, but only in connection with
several hitting on one and the same day. It means a change, for
example, when Mercury happens to be at 5
o
of a sign, Venus
passes 17
o
30' of some sign and the Sun may enter into a new sign,
thus crossing 0
o
and this all on a single day. In case Mars or Jupiter
happens to pass one of these critical degrees also on that specific
day, you surely will have a change in the market.
Page 125

Under change, we understand a new cycle. Therefore, when
the movement happened to be upward until the day the change is
due, we should move downward or, when other indices allow it,
we can make a gap upward. You should have ample facilities on
hand to distinguish which has to happen, especially when you
know that the event is due on this day. In such a case watch your
method # 1, if an 8 3/4 move is complied; watch the volume as we
approach the time for the change; watch all the factors of the other
methods and combine those indicating a down move and
separately those indicating a possible gap upward and weigh
carefully.
We also must know that the various planets have various
effects in the different houses and you have to search old charts to
find what effect each planet and its ally have had in past cycles
upon the market. This is one reason why I find the movements of
the various commodities much easier and surer than those of
individual stocks. I have made myself charts for practically every
commodity for thirty, forty years on a daily basis such as wheat
cotton, cottonseed oil; it is from checking back the effect of the
planets that I arrive at what the effect should be now. With stocks
you only have a handful that are older than twelve or fifteen years.
They have not gone through a series of major cycles as yet and
therefore you have to rely on secondary factors, which as you may
well realize, are not absolutely safe.
This brings me once more to the statement that you should
concentrate on one or two single stocks or commodities because if
you know only one and well, you can make all the money you can
use and then some. Later on I will bring another reason to warrant
this statement.
The other tables given in the ephemeris are not required for
our work, such as latitude, declination. Thorough tests on my part
have revealed that they do not contain such critical points.
This method operates of course in harmony with the others. Many
times you will be able to detect small sharp moves that otherwise
Page 126

would not be understood and that would cause you uneasiness.
Explaining the simplest astrological methods you now will
note that we are drifting completely away from price and swing
into time only. We move away from the dollars that are in the
market and measure Nature's change of mind in the feelings of the
human trader.
Price changes become an "accident'' while time changes are
the concrete facts. These changes are caused by planetary positions
in the heavens and are known and the direction of the flow of the
tide can be easily arrived at. The planetary positions act only when
a definite degree, a definite minute and second is reached in the
Zodiac. Such events can be calculated to the second when they
must happen, not when they may happen. On such a day, hour,
minute and second all the cycles of our other methods will also
agree and produce a bottom or a top. On that day you then must
either buy or sell, as the case may be; ask no questions, accept no
replies. The time of the cycle is up, the public changes its mind, its
attitude towards stocks or commodities, a condition which cannot
be felt.
The markets are to the laymen a common gambling ground,
to a few an open book, consisting of rhythms of pre-destined
amplitudes, not a maze of uncertainly and guess work. Buildings,
twenty stories high, are filled with statisticians, selling analyses of
stocks on the strength of earnings and what-not to the greedy, by
the hundred thousands knowing as little as the statisticians
themselves: on the contrary, they recognize them as “Giants of
Finance and Economics" and pay them for their "information''
hundred of dollars each per year, which, as far as the market is
concerned is not worth the paper on which it is printed.
Millions of people are successful in their own lines of business. They
observe subconsciously the laws of Nature. The swings of business are not
so pronounced as those of the market. The same laws of course remain
underlying. Most businesses
Page 127

necessities of life and as long as we have people living, they must
purchase. Such enterprises are strictly limited by keen competition.
Man, as a rule, chooses the easiest way to earn a livelihood.
Comparatively few work out off this rut. These few, however, step
right into enormous difficulties, especially when entering the
markets. They try to operate in the market under the identical laws,
which they carried along from their line of business. But they find
that these laws will be insufficient and will gradually, but surely,
lose their money.
Still, the stock market and commodity market afford the
greatest possibility of making money constantly without much risk,
without much effort, provided the work is done exclusively within
certain laws and rules, however far-fetched and unbelievable they
may sound to the average businessman. This is the secret of the
market. The operations of the multitude are wrong and necessarily
so. Who else would carry the cost, commission, tares, the fairy-like
brokerage offices downtown? The proof is seen in the persistent
and steadily dribbling losses taken by the majority of investors,
speculators, traders, bankers and others. Only those who have
within themselves vibrations attuned to the market responding thus
automatically to tops and bottoms or those who have been able to
use Nature's laws, can measure with great exactness the dates of
change. The first group will never be able to forecast movements.
It simply is a “something” that causes them to buy or sell and
discover later that they were "right again". Their response is
spontaneous, but does not go beyond the present.
Making commitments in a stock, by either buying or selling it
short creates immediately thereafter a somewhat mixed feeling of
hope and fear within any man. Supposing he bought a stock, he
hopes the market will be favourable to the upside so that he can
realize a profit; at the same time he fears that the market might not
go up; in fact, he dreads a down move. To conquer this feeling is
almost impossible, at least with millions who merely guess which
Page 128

way "the cat might jump". Even with all the methods explained
herein, it is difficult to overcome this feeling, although it gradually
will wear off.
At times when an important move is in the making which is
about the only time to visit a broker's office, watch the crowd in
their psychology! This is more fun than a Broadway show. See
these creatures buck Nature's laws, respectively abiding to the
same whichever you may call it, buying stocks or commodities
right at the top of a move, happy as children who just received a
"gift", while on the other hand, when Nature provides a bottom in
the market these same crowds sell the erstwhile previous bargains
for the proverbial song far below actual values, fearing they might
go lower. Nature is generous, but wicked withal. The market
shows these sides in the truest fashion.
The law of critical degrees as given above refers to the
market as a whole and when following them in individual stocks
you are apt to take severe losses although you may be right as to
the trend of the general market.
Therefore, I had to do some more research to overcome this
difficulty. Here is the result: Each stock reacts (also commodities)
at specific degrees and minutes of the Zodiac to one or two planets
in one or two positions. Taking wheat for example we note that
Venus and Mars and no other planet brings about the changes.
These two planets as they cross 23
o
20’, respectively 12
o
16' of a
sign, produce changes. The stock Phillip Morris acts only on
Venus and the changes occur when Venus passes 17
o
30' of any
sign. Each stock must be searched over a period of time as the
planets bringing about the changes are decoded.
In 1935 wheat made its important tops and bottoms
exclusively the moment Mars passed 12
o
16' of a sign. A rough
sketch (see opposite) will show it.
Page 129

At the same time, Philip Morris (MOS) acted as follows:
Venus at 17
o
30' Aries gave a bottom on March 12th 1935.
Venus at 17
o
30' Gemini gave a bottom on April 30, 1935.
Venus at 17
o
30' Cancer gave a bottom on May 28th, 1935.
Venus at 17
o
30' Leo gave a top on June 21st 1935.
Venus at 17
o
30' Virgo gave atop on July 31st, 1935.
From August 18th, 1935, until September 30th, Venus moved
retrograde and her motion was very slow accounting for the
sideways movement in that specific stock during this period.
You may note in this example that in the sequence of the
signs, we miss the sign of Taurus. This sign does not bring about a
change in this stock. You further note that we have three bottoms
to begin with and two tops to end with, so that some other planet is
playing into this stock that brings about the reversal not found
quoted herein. You may plot the daily motion of this stock for
1935 and find that planet yourself and the degree and minute that
must be used.
I found that cottonseed oil responds to the motion of
Mercury-Neptune. That the prices of butter simply move up and
down according to the aspects of Jupiter-Venus and, aside of that,
in perfect ellipses.
End of Method # 6.
----00000----
This book is rather difficult for the man who is new to Wall Street.
There are no bulky chapters devoted to how to write buy-slips,
how long intakes to execute an order. Nothing is said about
commission rates, taxes or premiums. A day or two spent in a
brokerage office will enlighten you more about the "red-tape" than
the several volumes you can buy in bookstores. Of course, these
writers have nothing tangible to write, they use this to fill a book.
It is my belief, however, that inexperienced persons will
Page 130

master the contents of this work easier than the "experienced Wall
Street man'' who for years burdened himself with a heavy ballast of
exceptional, important economic statements. He undoubtedly will
find it difficult to forsake such information invaluable to him so
far. But to this man a complete reversal is the wisest course.
Just as we measure a cube by length, width and height, a star
by longitude, latitude and declination, so we measure the position
of a stock or a commodity by volume price and time. The river,
"Time", contains the boat called stock market and individual stocks
float along this river "Time" with millions of other little boats
around them. On the borders of this river are situated a number of
search lights or beacons that send forth rays to this little boats as
well as to the other boats, directing its motion.
These beacons are the planets. Each beacon contains a
specific type of ray, different from the others. The influence of
these rays upon the stock market boat has been explained causing
what is commonly known as tops and bottoms.
---ooOOOoo---
Page 131
Document Outline
- DEDICATED TO THE MEMBERS OF WHEELS
- IN THE SKY
- "A forum one can learn about Gann and other famous market forecasters".
- TIME FACTORS
- THE STOCK MARKET
- BY
- Preface
- January 2, 1937
- Page 1
- has convinced you that the animal called "horse" has four legs; not
- three, nor five. Moreover, you know that it walks on four legs, with the possible exception of a horse that has accidentally lost a limb or one that has been trained for a specific purpose, such as a horse in a circus. Similar comparisons can be made with other animals. in fact, with anything alive.
- Page 5
- Page 7
- Page 9
- Page 11
- Page 13
- Page 15
- Page 17
- Page 19
- Page 21
- Page 23
- Page 25
- Page 32
- BY
- Part 2
Wyszukiwarka
Podobne podstrony:
Being Warren Buffett [A Classroom Simulation of Risk And Wealth When Investing In The Stock Market]
1855 Six Sermons on the Inquiry Is There Immortality in Sin and Suffering (by George Storrs)
de bondt, thaler does the stock market overreact
a mathematician plays the stock market RAPJW6ZF5GDJGCUNRDPFGUL2BRZHSKXZVFFFKJA
Philosophy and Theology in the Middle Ages by GR Evans (1993)
Wall Street Meat My Narrow Escape from the Stock Market Grinder
Identifying Active Trading Strategies in the Bitcoin Market
[Форекс] The Cost of Technical Trading Rules in the Forex Market
Vladimir Daragan How To Win The Stock Market Game
Why Most People Lose Money in the Forex Market (Booker)
CRASHES AND CRISES IN THE FINANCIAL MARKETS, ekonomia III, stacjonarne
Handbook for the New Paradigm by George Green
Implement a QoS Algorithm for Real Time Applications in the DiffServ aware MPLS Network
The Stock Market for Dummies
CRASHES AND CRISES IN THE FINANCIAL MARKETS
Poultry Products and Processing in the International Market Place
#0276 – The Stock Market
więcej podobnych podstron