
Common $ense Commodities - All rights Reserved 1998-2003
Common $ense
Commodities
“A Common $ense Approach
To Trading Commodities”
Written By
David Duty CTA
Gulf Breeze, FL, USA
(850) 932-0937
dduty@davidduty.com
www.commonsensecommodities.com
Version 3.6
Charts Prepared Using Gecko Software’s
Track-n-Trade Pro Software
www.geckosoftware.com
THERE IS A RISK OF FINANCIAL
LOSS IN TRADING FUTURES AND OPTIONS

Common $ense Commodities - All rights Reserved 1998 - 2003
2
DISCLAIMER
THE INFORMATION CONTAINED HEREIN IS BELIEVED TO BE RELIABLE BUT
CANNOT BE GUARANTEED AS TO RELIABILITY, ACCURACY, OR
COMPLETENESS. COMMON SENSE COMMODITIES, AND/OR DAVID G. DUTY,
WILL NOT BE RESPONSIBLE FOR ANYTHING, WHICH MAY RESULT FROM
ONE’S RELIANCE ON THIS MATERIAL, NOR THE OPINIONS EXPRESSED
HEREIN.
DISCLOSURE OF RISK: THE RISK OF LOSS IN TRADING FUTURES AND
OPTIONS CAN BE SUBSTANTIAL; THEREFORE, ONLY GENUINE RISK FUNDS
SHOULD BE USED. FUTURES AND OPTIONS MAY NOT BE SUITABLE
INVESTMENTS FOR ALL INDIVIDUALS, AND INDIVIDUALS SHOULD
CAREFULLY CONSIDER THEIR FINANCIAL CONDITION IN DECIDING
WHETHER TO TRADE. OPTION TRADERS SHOULD BE AWARE THAT THE
EXERCISE OF A LONG OPTION WOULD RESULT IN A FUTURES POSITION.
HYPOTHETICAL PERFORMANCE RESULTS HAVE MANY INHERENT
LIMITATIONS, SOME OF WHICH ARE DESCRIBED BELOW.
NO REPRESENTATION IS BEING MADE THAT ANY PERSON WILL, OR IS
LIKELY TO, ACHIEVE PROFITS OR LOSSES SIMILAR TO THOSE SHOWN IN
THIS COURSE. IN FACT, THERE ARE FREQUENTLY SHARP DIFFERENCES
BETWEEN HYPOTHETICAL PERFORMANCE RESULTS AND THE ACTUAL
RESULTS SUBSEQUENTLY ACHIEVED BY ANY PARTICULAR TRADING
METHOD.
ONE OF THE LIMITATIONS OF HYPOTHETICAL PERFORMANCE RESULTS IS
THAT THEY ARE GENERALLY PREPARED WITH THE BENEFIT OF HINDSIGHT.
IN ADDITION, HYPOTHETICAL TRADING DOES NOT INVOLVE FINANCIAL
RISK, AND NO HYPOTHETICAL TRADING RECORD CAN COMPLETELY
ACCOUNT FOR THE IMPACT OF FINANCIAL RISK IN ACTUAL TRADING. FOR
EXAMPLE, THE ABILITY TO WITHSTAND LOSSES OR TO ADHERE TO A
PARTICULAR TRADING PROGRAM, IN SPITE OF TRADING LOSSES, ARE
MATERIAL POINTS WHICH CAN ALSO ADVERSELY AFFECT ACTUAL
TRADING RESULTS. THERE ARE NUMEROUS OTHER FACTORS RELATED TO
THE MARKETS, IN GENERAL, OR TO THE IMPLEMENTATION OF ANY
SPECIFIC TRADING PROGRAM WHICH CANNOT BE FULLY ACCOUNTED FOR
IN THE PREPARATION OF HYPOTHETICAL PERFORMANCE RESULTS AND ALL
OF WHICH CAN ADVERSELY AFFECT ACTUAL TRADING RESULTS.

Common $ense Commodities - All rights Reserved 1998-2003
3
Forward written by
Lan H. Turner, CEO of Gecko Software, Inc.
It is my pleasure and honor to be asked to write the forward for Common Sense
Commodities. David has been working closely with Gecko Software Inc. in
providing new and experienced traders with a further understanding of the
futures and commodities markets. It is a rare individual who can take their
trading talents and not only capitalize on them for self gain, but to also put them
into a simple to understand and enlightening educational format for all to learn
from.
David is not simply the author of a book; David has turned his vast trading
knowledge and experience into an educational course, loaded with examples,
charts, and in depth detailed personal experiences.
David is truly a genius at work, and it is an honor to be associated with him, his
course work, and his materials. Anyone who might have the opportunity of
spending time with David, and learn from one of the masters, is certainly in for
a knowledgeable and pleasurable experience
Good luck.
Lan Turner
CEO Gecko Software, Inc.
Logan, Utah USA
Lan Turner was the primary designer of the well-known futures charting application Gecko-
Charts and the Author of the multimedia CD-ROM seminar Track ‘n Trade. Mr. Turner has
been a champion of futures trading since 1995 and loves teaching people of the great
opportunities found in trading commodities
.

Common $ense Commodities - All rights Reserved 1998 - 2003
4
This Page Left
Blank Intentionally

Common $ense Commodities - All rights Reserved 1998-2003
5
Statement of Purpose
The purpose of this course is to teach you the basic fundamentals of trading
commodities. This course, nor any other course for that matter, won't teach you
to pick every top and bottom of every price move. What this course will try to
teach you is how to find and identify specific technical formations that have a
time-proven history of being profitable.
I’ve entitled this course “Common $ense Commodities” for a specific reason.
In my opinion, anyone with some plain old common sense can learn to trade.
Trading is not rocket science, although some people try to make it seem that
way.
As you will soon discover, all the charts in this course were done with Track-N-
Trade Pro from Gecko Software. As a subscribing student, you will get lessons
from time to time via e-mail that I have done in Track-N-Trade Pro. If you own
this software, you can open these lessons on your computer and update the
lesson with live data every day.
Throughout the course, I refer to Gecko Charts which is the same as Track-N-
Trade Pro as far as the course is concerned. The original version of this
software was named Gecko Charts whereas the new version is named Track-N-
Trade Pro.
There is a link on my homepage to get this software at a discount. I highly
recommend that you get this software if you don’t already own it.
I welcome you to join me in this fascinating journey, and I wish you the best
that life has to offer.
David Duty, CTA
Gulf Breeze, Florida USA

Common $ense Commodities - All rights Reserved 1998-2003
This Page Left
Blank Intentionally

___________________________________________________ Contents
Common $ense Commodities - All rights Reserved 1998-2003
7
Table Of Contents
Page #
Statement Of Purpose ...............................................................................5
Table Of Contents .....................................................................................7
Comments From The Students ................................................................13
Introduction ...............................................................................................17
Commodities - Yesterday - Today & Tomorrow ...................................19
Yesterday ...........................................................................................19
Today..................................................................................................20
Tomorrow ..........................................................................................23
Lesson One
Looking At The Markets ...........................................................................27
Monthly....................................................................................27
Weekly.....................................................................................27
Daily.........................................................................................28
Trading Lingo...................................................................................29
The
Chart
Itself ...............................................................................31
Taking A Position - The Long & Short of It ................................32
Technical Analysis - Does It Really Work?...................................33
Reward/Risk
Ratios ........................................................................34
The
Stop
Loss ..................................................................................35
Types
of
Orders ...............................................................................37
Homework
-
Lesson One ................................................................40
Lesson Two
Charting
In General .......................................................................45
Trends ...............................................................................................45
Drawing
Trendlines ........................................................................47
Confirming The Trend - Getting Three Hits ...............................47
What
Significance
Does This Have? ..............................................48
Redrawing
The
Trendline ..............................................................49
How To Tell If The Trend Is Actually Broken .............................50
The
Magnetic
Trendline .................................................................51
The Fan Principal ...........................................................................52
45 Degree Angles .............................................................................53

Contents ___________________________________________________
Common $ense Commodities - All rights Reserved 1998 - 2003
8
Homework
Lesson Two ..................................................................55
Lesson Three
Support
&
Resistance Levels .........................................................59
Market
Corrections
& Why They Happen ...................................60
The
Common
Number or CN ........................................................62
The Even Number Phenomena ......................................................63
Headed Home - The 50% Levels ..................................................65
Internal 50% Retracements ...........................................................67
Trading
Ranges ...............................................................................71
Channels
In General .......................................................................73
Narrow
Sideways Channels ...........................................................73
Ascending & Descending Channels ...............................................76
How Far Should Prices Move? .......................................................78
Gaps
.................................................................................................79
Spikes.................................................................................................85
Homework
Lesson Three ................................................................88
Lesson Four - Reversal Patterns
Common Threads.............................................................................91
The 123 Method................................................................................92
Reversal Days ...................................................................................100
Two
Day
Reversals...........................................................................103
Blips
.................................................................................................104
Blip
Reversals ..................................................................................107
An Alternate Way To Trade Blips .................................................109
Blips on Weekly & Monthly Charts ..............................................110
Head & Shoulder Formations.........................................................110
V-Tops & V-Bottoms ......................................................................113
Double & Triple Tops......................................................................116
Double & Triple Bottoms ...............................................................118
Rounded
Tops
& Bottoms ..............................................................119
The Island Formation .....................................................................119
Homework
-
Lesson Four ...............................................................121

___________________________________________________ Contents
Common $ense Commodities - All rights Reserved 1998-2003
9
Lesson Five - Continuation Patterns
Triangles ...........................................................................................125
Wedges ..............................................................................................128
Flags
&
Pennants .............................................................................129
Homework
-
Lesson Five ................................................................134
Lesson Six - Entering A Trending Market
Using Little 123’s To Confirm The Trend ....................................137
A
Quartet
.........................................................................................138
Taking
Profits...................................................................................139
Cut Your Losses & Add To Your Winners ..................................140
Pyramiding - The Wrong Way To Add To Your Winners .........141
Pillaring - The Correct Way To Add To Your Winners..............142
What
Price
Am
I Short From? ......................................................143
Using Alerts Rather Than Open Orders ......................................144
Buying Support & Selling Resistance ...........................................145
Slippage ............................................................................................146
Which Commodity & Contract Month Do You Trade ................147
Homework
Lesson Six ....................................................................149
Lesson Seven - Understand & Managing Risk
Targets...............................................................................................153
Short-Term Profit Taking ..............................................................161
Trailing
Stops ..................................................................................163
50% Levels as Targets ....................................................................166
More 50% Retracements.................................................................168
Support
&
Resistance
Levels As Targets.......................................170
How To Use Options As Protection ...............................................174
Homework
Lesson Seven ................................................................180
Lesson Eight
Computers ........................................................................................183
Charting
Software ...........................................................................183
Using
Indicators
For Confirmation ...............................................183
Volume
&
Open Interest .................................................................184

Contents ___________________________________________________
Common $ense Commodities - All rights Reserved 1998 - 2003
10
Momentum
Indicators .....................................................................187
Stochastics ..............................................................................187
Williams %R ..........................................................................191
Williams AD ...........................................................................192
Relative
Strength Index – RSI..............................................194
MACD.....................................................................................196
Volatility
Studies .............................................................................198
Bollinger Bands......................................................................198
Directional Studies ...........................................................................199
Moving
Averages ..................................................................199
Trend
Studies ...................................................................................201
Gann
Lines
& Angles ...........................................................201
Fibonacci ................................................................................204
Homework
Lesson Eight ................................................................207
Lesson Nine
C
ommitment Of Traders Report ..................................................211
Money
Management .......................................................................212
Get
Rich
Quick? ...............................................................................214
Streaks
..............................................................................................215
Fear
&
Greed....................................................................................217
Overtrading ......................................................................................218
Papertrading.....................................................................................218
Trading
Journal ..............................................................................219
Finding The Right Broker ..............................................................221
Commissions ....................................................................................222
Homework
Lesson Nine...................................................................223
Lesson Ten - Putting It All Together
Some More Guidelines.....................................................................227
Putting The Puzzle Together...........................................................228
What Do You Do Now? ...................................................................234
Charting
Software
- Is It For Me? .................................................237
Papertrading - How Do I Do It ......................................................238
Some Pros & Cons To Papertrading .............................................239
Pulling
The
Trigger .........................................................................240
Homework
Lesson Ten ...................................................................242

___________________________________________________ Contents
Common $ense Commodities - All rights Reserved 1998-2003
11
Lesson Eleven
The Study Charts ............................................................................245
Answers To Homework
.................................................................277
Reference Section (Red Tabs)
From The Website
Triangles ...........................................................................................287
Papertrading: A Traders Most Important Tool ..........................291
Introduction
To Seasonality............................................................295
Abbreviations, Points &Symbols
Types
Of
Orders ..............................................................................329
Psychology
Of Trading ...................................................................331
Essential Characteristics of A Successful Trader .........
339
Barriers To Successful Trading......................................................340
Trading Types .................................................................................341
Your
Trading Profile ......................................................................341
Identify & Develop Your Trading Style .......................................342
Traits Of A Successful Trader........................................................342
In My Opinion .................................................................................343
Your Trading Plan ..........................................................................346
Forty-Eight Rules To Trade By .....................................
349
Don’t Be Afraid To Be A Sheep......................................................349
Use Discipline To Overcome Impulse Trading ............................350
Cut
Losses Short ..............................................................................350
Let
Profits Run ................................................................................351
Learn To Trade From The Short Side...........................................353
Standing
Aside
Is
A Position ..........................................................353
Client & Broker Must Have Rapport ...........................................353
Thrill
Seekers
Usually Lose ...........................................................354
Have A Businesslike Approach To The Markets..........................354

Contents ___________________________________________________
Common $ense Commodities - All rights Reserved 1998 - 2003
12
Answers About Options
.................................................................357
Glossary Of Terms...........................................................
371
Internet Sites ...................................................................
409
Recommended Reading ..................................................
411
Study Charts Expanded .................................................
429
From The Website ...........................................................
445

___________________________________________________ Comments
Common $ense Commodities - All rights Reserved 1998-2003
13
Comments From Students
Each topic was very thoroughly covered. I also feel that your choice on the
technical analysis selections was right on. It's taken me YEARS, not to mention
thousands of hard-earned dollars, to learn what you are offering your students
with this manual. I am very pleased with this course. The foundation is in place
to really bring something new to traders. Your chosen direction is right on
mark.
Raghee H. - (Full-time Commodities Trader) - Coral Springs FL, USA
I'll take this opportunity to drop you a word of thanks for a ton of knowledge I
picked up in your class. I am a full time trader, and in my three years of trading
with a lot of hours and money invested and lost in numerous courses, nothing
beats your course. The truth of the matter is it's very easy to understand and if
you apply the concepts learned, there is no reason why one shouldn't have a
competitive edge required to trade efficiently. In my case, it is everything I've
always searched for.
Peter L. - Denver, CO USA
I thoroughly enjoyed the class, I thought it was very informative, gave me a
great foundation to build on, and instilled a sense of confidence and a
willingness to learn further, or, to say it another way, it demystified the
commodities markets to some extent. I have been paper-trading since taking the
class and at least on paper, have had winning trades, or the underlying
commodity actually went in the direction I thought it would.
Bruce K. - Longmont, CO USA
The pamphlet I received in the mail from another commodities trader made it
sound like I would be smoking cigars and wearing a Stetson in no time at all if I
took his course and followed his teachings. Wrong! It was no more than a basic
introduction to the market. Then I discovered "Common $ense Commodities",
and really learned how to trade the market.
Mike K. - Denver, CO USA
I have finally fallen into somewhat of a routine for watching all the charts. It
takes me about an hour, depending on how many interruptions I have of course,
but at least I’m getting through them.

Comments___________________________________________________
Common $ense Commodities - All rights Reserved 1998 - 2003
14
I know I’ve said this before, but I can still hardly believe how easy your system
is!! There are some things that I’m still having problems with (figuring
profits/loses) but I read your book again this past weekend, and more of the
techniques have gotten easier to recognize.
This morning, I found 8 trades to put on (paper-trading), and that amazes me.
Last week I put on 18 paper-trades, of which 16 completed the formations, and
I would have been in the market/in a contract. Of those 16, NONE were losers.
That just really amazes me. NONE were losers.
Terry S. - Colorado Springs, CO USA
I lost $300 in the actual trading of July wheat for the period of 1/5 - 2/23 by just
using 123 bottom and trailing stops according to the instruction by TWMPMM
course. But, after reading the chapter of "Ascending & Descending Channels"
of your book, I reviewed the same trade of my July wheat, and realized that I
would have made more than $1,400 by implementing the analysis in your
textbook.
Masamichi Y. Chicago, IL USA
This is the best course I've taken so far, because it is so comprehensive. Had I
started with this course, it may have seemed overwhelming. But having had
some exposure to trading, your lessons made sense, and give very good value
for the money. Like new formations. Blips. Like the 123 Top/Bottom rule,
which makes a lot of sense. Also I believe your strategy for entering market
that breaks out of a channel - or whatever, a blip, too - is incredibly wise.
Douglas M. Beverly Hills, CA USA
The seminar in Denver was well worth every penny and every minute. If you
are serious about learning to trade, or improving your trading, I STRONGLY
suggest you attend. David is not only sincere, but knowledgeable and helpful.
The seminar drew an excellent group of people, also. I learned a good deal from
fellow students as well. Where’s the next one?
Larry S. Long Island, NY USA
David, before I comment on the seminar, I wish to say that meeting you and
your wife was truly a pleasure. You both are a very caring and genuine people,
concerned for your students and the people you meet. I feel privileged to know

___________________________________________________ Comments
Common $ense Commodities - All rights Reserved 1998-2003
15
you. I was very impressed by the extension of yourself to us, and making us
feel at home in Denver.
The seminar was fantastic. I learned a lot. The new concepts and information
will FOREVER change my future trades. Learning key concepts, such as:
entering and exiting the market, charting and properly reviewing my
Reward/Risk level, was key. After Saturday, I had a new level of confidence in
my trading ability.
Finally, the limit of 10 students provided a very intimate atmosphere for us to
both learn and interact. It was a great networking time to share past and future
trades. I learned quite a bit from my fellow students. I truly appreciated the time
I was able to spend with them.
Again David, THANKS. I received good value for my time and money and
would never hesitate to recommend the seminar to any other person.
Chris M. La Palma, CA USA
For anyone who is considering going to one of David’s' seminars, I just have
one piece of advice- DO IT. It was a very rich and rewarding experience for
me. David has a way of presenting the different facts of this business in a very
clear and understandable manner. You will quickly see the gift that he has for
teaching the material that he covers, and the genuine love that he possesses for
it and the people that he is working with, you the student. The network of
people that you will meet is worth the price of admission alone. Thank you
David, and all the people that you brought with you, who by the way came on
their own without monetary compensation, simply because they truly enjoy
what they do.
Jim K. Corneal, NY USA
I was getting frustrated that my trades weren't working out overall, so I went to
the seminar to try to find out why. It was very helpful, and I discovered some of
the mistakes I was making.
David was eager to answer our questions and give us his time 'round the clock.
The options day was great too. I have always shied away from options, because
I didn't understand them. They are actually a great way to go in many markets,

Comments___________________________________________________
Common $ense Commodities - All rights Reserved 1998 - 2003
16
and a needed strategy for my account. Thanks David. Just the networking alone
was worth it.
Zachery R. Boulder, CO USA
Great learning experience. It was a dynamic seminar, with very knowledgeable
leaders. David presented a comprehensive, two-day, "hands-on" program that
was packed full of information and strategies.
I came away with a better understanding of how to read charts and use them to
find better trading opportunities. The extremely informative session on options
gave me super risk management and money management tools that I need for
successful trading.
The most impressive thing about this seminar is that the instructors are
experienced traders - They didn't give us "theory or sugar coated". It was
straight from the shoulder, real world stuff!
Carole J. Oakland, CA USA
Well, I came all the way from Toronto, and it is was worth every cent. David is
not only, knowledgeable, helpful, and caring, but a heck of a nice guy. I finally
understood a whole bunch of concepts that had been very blurry before.
The second day on Options was also HUGELY informative. It was also very
cool to meet 9 other students from around the world. I could go on and on and
on about good stuff about the seminar, but it is 5:00 am, and a cup of coffee is
calling my name!!!!
Keith A. Toronto, ONT Canada
Anyone interested on trading commodities should attend your seminar. There
were no negative comments in conversations with other participants, only
positive. I think you knocked yourself out to make sure that everything was
perfect for us, including accommodations, meals, and transportation. The
seminar was great in clarifying information I'd already read but didn't fully
understand, in teaching new (to me) trading techniques, in gaining insight from
other students. Most of all, you just have to "be there". The hands on experience
is priceless.
Claudia W. St. Paul, MN USA

___________________________________________________ Introduction
Common $ense Commodities - All rights Reserved 1998-2003
17
Introduction
I started trading a few years ago and have found that it’s the most exciting
business I’ve ever been in. Yes, I said business. It’s not a game; it’s a business.
If you don’t treat it like a business, you are doomed from the start.
This course is designed to help you learn to trade, but it, as well as all other
courses out there, has its limitations. This course is a starting place, not an end-
all. You must study the material in this book over and over until you grasp it,
and then you must study and learn other techniques being taught.
In the reference section, you will have books to choose from to further your
education. Each and every one has something of value. There are many ways to
learn how to trade, and this course is just a starting place for most.
Some other people who sell courses will tell you that their course is all you will
ever need to be a full-time, successful trader. Hogwash! There is no one course
that will teach you everything you need to know in order to trade successfully,
mine included. I do feel that this course has a vast amount of useful
information. My students have told me that they learned more from this course
than from any other course they have ever taken; some of which cost several
times as much.
Get In Or Get Out
“If You Can’t Get 100% Into What You’re Doing, Then You’d Better Get
100% Out Of What You’re Doing.”
(Quote From Zig Zigler)
Before I learned (yes, I said learned again) to trade, I had several different
businesses. Some were successful, some not so successful, and some went
straight down the tubes along with more money than I care to remember. Then,
one day, I looked at what I was doing with my life, and discovered I wasn’t
happy, wasn’t satisfied, and I wasn’t making any significant money. Ever been
there? It’s called “burnout.” That’s when I decided to get 100% out of what I
was doing. But I didn’t think I had many choices at the time. Little did I know
that my life was about to change, and change in a big way.

Introduction ___________________________________________________
Common $ense Commodities - All rights Reserved 1998 - 2003
18
I was introduced to trading through an offer in the mail, and like many others,
bought a mail order course. I learned enough to be dangerous. I thought that
was all I needed to know because the author told me that his course was “All I
ever needed to know. ” Boy, oh boy, was I wrong. I hadn’t even learned the
basics but jumped in anyway and started trading. I won’t go into all the details,
but I will say that I “paid” over $10,000 for that $200 course. This is one of the
reasons I wrote, and teach, this course: so that others don’t do the stupid things
that I did when I first started trading.
I later learned that the person who put out that course was a great promoter, but
his trading methods were a far cry from what someone needed to know to trade
for a living. I then went to work reading and studying everything I could about
commodities. I invested the time to learn. I invested in good books. I invested
in good tapes, good videos, and spent a year studying and paper-trading. Paper-
trading is simply trading an account on paper, without using real money. It’s a
great learning tool.
What I found is that most of the books and courses talk about many of the same
things, they just explain it in a little different way. That’s when I realized that
there are some basic principals, rules, if you will, that anyone can learn, and
once you do, like others before you, you can become a successful trader.
The intent of this course is to teach you many of the basics, and to give you a
good foundation to build on. Learning anything is a continuing process, and the
longer and harder you work at it, the better you become.
I hope you enjoy and learn from this course. It has been an ongoing “labor of
love”. I want to give special thanks to my wife Ludmila, who has kept the
coffee hot for me on many a long night while I wrote this.
If you have comments and/or suggestions on how I can improve this course,
please let me know. There is also a little questionnaire that I have included with
the course. If you could fill it out and drop it back in the mail to me, I would
appreciate it greatly.
There is a risk of loss in trading futures and options.

___________________________________________________ Introduction
Common $ense Commodities - All rights Reserved 1998-2003
19
Commodities
Yesterday-Today-Tomorrow
Yesterday
Back in the mid-1800’s, the McCormick reaper was invented, which greatly
enhanced the production of wheat in America. About the same time, Chicago
was becoming a major commercial center. Wheat farmers from across the
country were coming to Chicago to sell their wheat to the grain dealers, who
then sold it to commercial buyers all over the county.
At that time, Chicago had almost no place to store wheat and had poor methods
for weighing and grading it. This left the farmer at the mercy of the grain
dealers.
In 1848, a central exchange was formed where farmers and dealers could meet
to deal in “spot” grain, which is selling wheat for cash and immediate delivery.
Soon after this, farmers and dealers began to deal in “futures contracts.” This
simply means that the farmer (seller) would contract with a dealer (buyer), to
deliver wheat at a specific date in the future for a pre-determined price. Hence,
the name “futures” trading evolved. This worked well for both parties, as the
farmer knew in advance how much he was going to be paid in the future, and
the buyer knew his future cost beforehand.
These contracts became so common that banks started to take them as collateral
for loans. Sometimes the farmer might not want to deliver the wheat, and would
sell his contract to another farmer, who would take on the obligation to deliver.
Other times the dealer might not want to take delivery, and would sell his
contract to someone who wanted to take delivery. Before long, speculators,
who saw an opportunity to buy and sell these contracts, hopefully at a profit,
came into play. These were the first commodities “traders” as we know them
today, and they had no intention of ever taking actual delivery of the wheat.
They began trading these contracts among each other, hoping to buy low, and
sell high, or sell high, and buy low.

Introduction ___________________________________________________
Common $ense Commodities - All rights Reserved 1998 - 2003
20
Today
If you start to trade thinking that you are going to get rich overnight, you’ll
probably lose all that you invest.
Commodity trading is a business like any other, and must be treated like a
business. If it is not, you won’t see success. However, if you are diligent in your
studies, and have the persistence and fortitude to learn what’s needed, this can
greatly contribute to your success as a trader.
Becoming wealthy in the commodities business is not uncommon. Many people
have done it before, and many more will do it in the future. Even if you don’t
have a lot of money to start trading with, you can still be successful. Richard
Dennis, as an example, borrowed $1,600 and turned it into $200 million dollars
in about ten years. He didn’t do it overnight and without tremendous effort. He
studied, applied himself, and made a plan, and followed his plan exactly.
Millions of dollars have been lost by people who enter the commodities market
without sufficient training with the idea of getting rich overnight. When they
don’t get rich, and even worse, lose all their money, they blame the
commodities market itself. The person they should blame is themselves. This
accounts for the negative stigma associated with commodity trading. Many
people see it only as a form of gambling. In some ways it is, but we can stack
the odds in our favor.
Trading commodities is different than trading stocks. When you buy a stock, or
a piece of real estate, you actually own it. When you buy, or sell, a futures
contract, you are speculating on the future direction of the price without ever
really owning anything. You simply own the right to buy or sell the commodity,
at or before a future delivery date, at a pre-determined price.
As a speculator, this right to own is sold back to the market before delivery
obligations are triggered. If you “buy,” then you are considered “long”, and are
speculating that prices will rise. If you “sell”, you would be “short”, and
speculating the prices will decline. In other words, you are trying to buy low
and sell high, or to sell high, and buy low. We will be discussing this in detail
later.

___________________________________________________ Introduction
Common $ense Commodities - All rights Reserved 1998-2003
21
There are three positions in trading: long, short, and out. Most of the time the
third position is the correct position, but it’s not used often enough.
To understand how you, a speculator, fit into the picture, let’s look at a
commodity from start to finish. Now, put your farmer hat on for a minute, and
hop on the plane to Wyoming. You’re a wheat farmer now, and you planted
your crop about three months ago. In a few months it will be ready to harvest.
After careful analysis, you figured out that it cost you about $2.00 a bushel to
grow it, including paying for your entire overhead. Anything you can sell it for
over $2.00 a bushel is profit for you.
Let’s assume that right now, wheat is selling for $3.00 a bushel, but the price
has been going down over the last few weeks. Since it’s going to be three
months before your crop is ready for harvest, what can you do to assure
yourself a profit on your crop? You are concerned that if the price continues to
drop, in three months the price may be lower than $2.00 a bushel, which is what
it cost you to grow it. Now what do you do? You sell your future crop by
calling a commodities broker and selling a futures contract for $3.00 a bushel to
be delivered three months from now, in December, as an example.
Your risk in doing this is that, if the price of wheat goes up to $3.50 a bushel
during the next three months, you are going to get only $3.00 a bushel because
you pre-sold it today for $3.00 a bushel. But, on the other hand, if the price of
wheat drops below $3.00, you have locked in your price of $3.00 a bushel. You
feel this is a good way to go, since the price of wheat has been going down, not
up, in the last few weeks. This process is called “hedging.” You have probably
heard that term before.
When you called your broker to “sell” (also called “going short”) a contract, he
acted as a middleman, and helped find someone to “buy” (also called “going
long”) your contract. Now who would want to buy your wheat contract at $3.00
a bushel? It could be a large company, like Wonder Bread, who is buying wheat
and is concerned that the price of wheat will go up, not down, three months
from now, and they want to protect themselves in case of a price increase. Of
course it could be a speculator who is looking to make a profit.
So you sold a contract to lock in your profits, the other person bought a contract
to guarantee their price, and your broker, acting as a middleman, earned a
commission for doing this, and you slept a little better that night.

Introduction ___________________________________________________
Common $ense Commodities - All rights Reserved 1998 - 2003
22
Let’s change hats again. You fly back home, and put your speculator hat on.
You carefully analyze your charts on wheat, and, yes indeed, the price has been
dropping, but it looks like the price is going to stop dropping and start to go
back up again. You think that in three months, it’s going to be $3.50 a bushel,
not $3.00 a bushel that it’s selling for today. (You will learn later how to
analyze charts to get a good idea where prices may head.)
You sense an opportunity to be able to buy a contract at today’s price of $3.00 a
bushel and sell it a few months later for $3.50 a bushel. If you are correct and
the price goes up, you are making a profit on your commodities contract. When
you buy the contract at today’s price of $3.00, you are guaranteed that price by
the person who sold you the contract. They must honor their end of the
agreement, and sell it to you for $3.00 a bushel at the end of the contract, even
if the price goes up.
On the other hand, if the price of wheat goes down, you lose money. How
would you lose money? If the price of wheat three months from now is $2.50 a
bushel and you agreed to buy it for $3.00 a bushel, you have lost 50¢ a bushel,
for the total number of bushels in your futures contact, which in the case of
wheat is 5,000 bushels.
The major difference between stocks and commodities is leverage. I’ll show
you what I mean. A contract in wheat is for 5,000 bushels. You don’t actually
buy or sell 5,000 bushels, you just control 5,000 bushels. You would put up a
“deposit” with your broker for the right to do this. In the case of wheat, that
“deposit” which is also called your “margin,” is only $540. So $540 controls
one contract for 5,000 bushels of wheat.
If you had paid all cash rather than buying a futures contract, you would have to
spend $3.00 X 5,000 bushels or $15,000. This is the power of leverage. With a
futures contract you still control 5,000 bushels, yet you only put up a deposit of
$540 to do so. It’s almost a 30-to-1 leverage in wheat.
Let’s look at how much you would have made by paying cash for 5,000 bushels
if the price went up
.
Bushels
purchased
5,000
Current Price
x $3.00
______
Total Cash Paid
$15,000

___________________________________________________ Introduction
Common $ense Commodities - All rights Reserved 1998-2003
23
If the price of wheat went up to $3.50 per bushel, you would make 50¢ per
bushel, or $2,500 profit (5,000 x 50¢). A 17% return on your investment in just
3 months. Not bad.
Let’s take a look at what your return would be if you had bought a futures
contract (went long), rather than paying all cash. Remember the margin, or
deposit, on a wheat contract that controls the same 5,000 bushels is just $540. If
wheat did in fact go up to $3.50 a bushel and you sold it, you would of course
still make 50¢ a bushel, just like you would have if you had paid cash for 5,000
bushels, or the same $2,500. The difference is that you made a 463% return in
three months with the futures (because you only put up a deposit of $540)
verses a 17% return for cash. That’s what I call leverage! This, by the way, is a
huge move in the price of wheat and I use it only as an example.
Anytime you have the potential of making a profit, you also incur the potential
of taking a loss. Keep in mind that your potential loss is also leveraged. In
the example above, if the price of wheat dropped 50¢, to $2.50, you would have
lost $2,500 (50¢ a bushel X 5,000 bushels). Now for the good news! You can in
some ways limit your losses. In other words, you can stack the odds in your
favor. There are several ways to do this, and you will learn about them as you
go through the course.
Tomorrow
Many people who trade commodities are average hard-working people,
probably a lot like you, who are just trying to supplement their income and
trade on a part-time basis. Based on my experience, I’d bet that less than 1% of
the speculative traders are full time.
There are basically two types of traders, although some people mix a little of
both in their trading style.
The fundamental trader, or a fundamentalist, is someone who studies the
supply and demand of a given commodity. They look at things like the weather
patterns around the world, droughts or floods for example, that would affect the
world’s supply of a commodity like wheat. Remember that commodities are a
worldwide market, not just here in the USA. As a fundamentalist, you might
buy a wheat contract because you think there is going to be a drought this

Introduction ___________________________________________________
Common $ense Commodities - All rights Reserved 1998 - 2003
24
summer in Russia, causing the price of wheat to go up because the supply will
be down.
The technical trader, or a technician, bases his decisions on current and past
market trends that are reflected on charts. Let’s say that you are looking at a
chart and you see that the price of wheat is the lowest that its been in 20 years.
Based on that and other technical indicators, you might “go long” on a futures
contract in wheat, thinking that the price is going up.
In this course, you are going to learn about technical trading. One of the
advantages of being a technical trader is that you don’t have to become an
expert in the fundamentals of the underlying commodity. Technical trading is
trading based upon technical information found on the charts. Let’s say
that you wanted to trade Cocoa. As a technical analyst you don’t have to know
anything about where Cocoa comes from, weather conditions, etc. That’s why I
like to teach people to trade using technical analysis.
When you are ready to trade, you can open an account with as little as $1,000. I
always recommend that you never start with more than $10,000, no matter how
much money you have. The reason is, that if you can’t learn to make money
with $10,000, then you probably won’t make it with $50,000 either. If you are
doing well and want to add to your account later, you can do that, but learn to
crawl before you walk, and walk before you run. Take it easy! Learning to
trade is a marathon, not a sprint. Also, before investing any real money you
must learn to paper-trade. This is how you practice and learn to trade. If you
can’t make money “on paper”, you can’t make it with real money either.
Also, don’t invest more than you can afford to lose, and assume you will
lose it all. If you can’t live with that thought, then don’t trade at all.
You might find this hard to believe but when you first start trading, you’ll
probably spend less than 30 minutes a day, maybe an hour, on your trades. If
you are trading on a full-time basis, you will spend two or three hours a day,
more on some days and less on others. Until you start to paper-trade, you won’t
understand just how little time it really takes.
You might be wondering what kind of equipment and supplies you need. How
about a telephone, a computer, and some inexpensive software? That’s all you
really need.

___________________________________________________ Introduction
Common $ense Commodities - All rights Reserved 1998-2003
25
In this course, you will learn dozens of techniques to interpret charts. Once you
learn to do this correctly, you could make a comfortable living in the
commodities market. Some may even do much better.
You must learn to limit your risk to a level that is within your own comfort
zone. You will be able to use several techniques to do this. Learning to control
risk is equally, if not more, important than learning how to make profits.
Knowing when to take profits is a key to making a fortune is this business. If
you don’t know when to take profits, you can end up giving back everything
you make. Even more important than taking profits is knowing how to control
your losses. You also will learn some powerful techniques to do this.
Again, I want to stress that you must first learn to paper-trade. You can practice
trading on paper without risking a penny. You can paper-trade for weeks or
months if you like. After you feel confident that you know what you are
doing, and are consistently making money on paper, then, and only then,
should you put real money in the market. Trust me on this, as I speak from
experience! I won’t sugarcoat anything and I’ll tell you right now that you can
lose your shirt, your pants, your socks and your shoes, and no one but you will
care.
Do you want a discount broker or a full-service broker? What is a fair
commission to pay? How do you know if you’ve got a good broker? All of this
and more is covered to some extent in this course.
You’ll also gain a good understanding of how to trade by the time you finish
this course. As a matter of fact, I think you’ll know more than many people
who have been trading for years!
I hope this course is just the beginning for you. Every day you trade, you’ll
learn a little more. You will also want to read a few good books from time to
time. The Reference Section contains a list of books that will help you
increase your understanding, and supplement what you learn in this
course.

Introduction ___________________________________________________
Common $ense Commodities - All rights Reserved 1998 - 2003
26
As a Student, you’ll receive my personal support in several ways.
1. Free phone support: Feel free to call me if you have a question. I’ll
be happy to talk to you about what you are doing and will do my best to
answer your questions. If I don’t have an answer, I’ll try my best to find
one. (During your support period only)
2. Forum: We have a forum for questions as well as a chat room. The
Website is also available to you as a Student.
3.Website: I also have my own Website up that has lots of information to
help further your education. You can find it at
www.commonsensecommodities.com.
4. E-mail: You will also be getting a lot of e-mail support and ongoing
training.
5. Seminars: Several times a year I do a seminar and you can check the
Website for dates, and locations.
An old Chinese Proverb says “A teacher may open the door, but you have to
walk through it by yourself.” I truly believe that I can open the door for you,
but only you can walk through it. So, let’s open that door, together, right now.
End of Introduction
Lesson One
Common $ense Commodities - All rights Reserved 1998-2003
27
Lesson One
Looking At The Markets - The Charts
There are three “views” for each commodity.
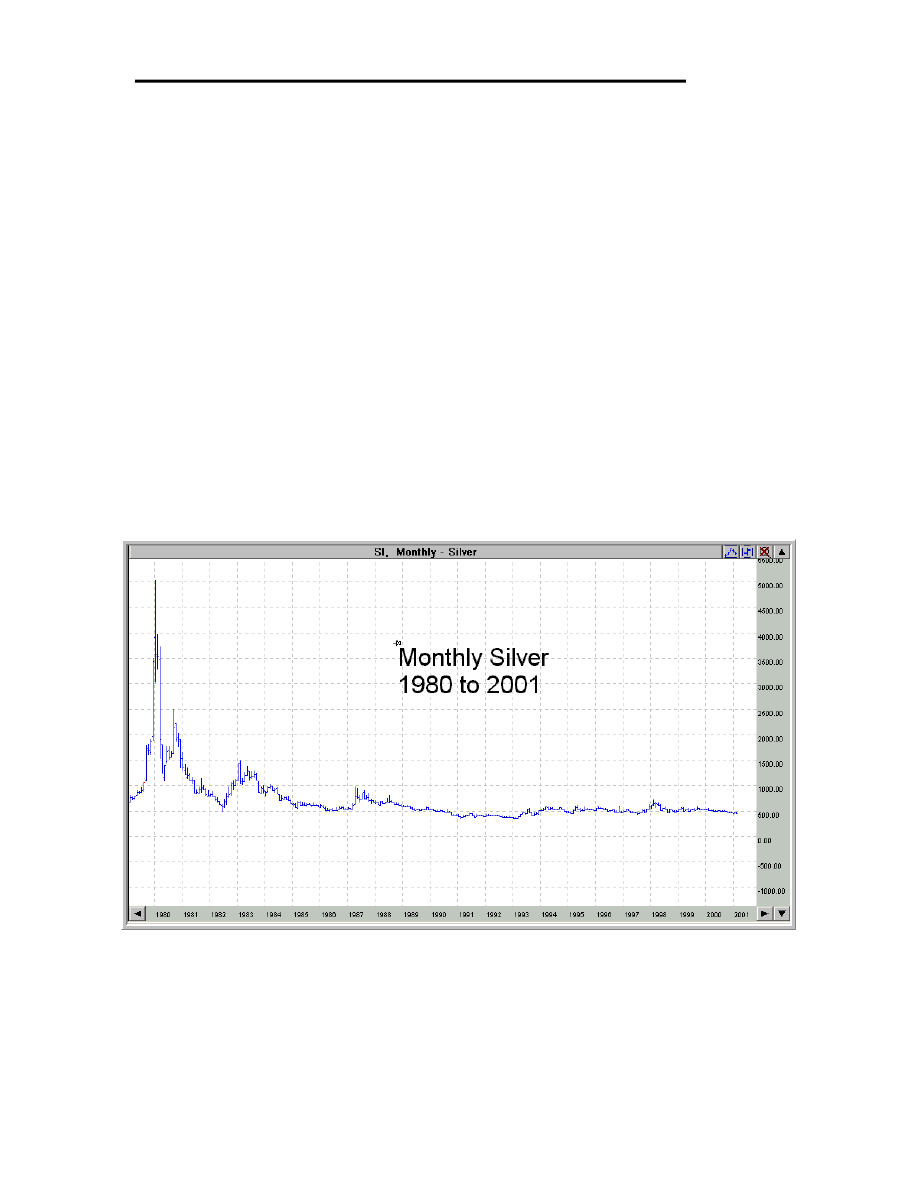
Monthly. The longest-range view is the monthly chart, which shows the price
movement over the last 10 to 30 years. Each vertical line, called a “bar” on this
chart, represents one month’s price movement. The monthly chart is very
important to get a long-term view over a period of many years.
Take a look at the monthly chart below. It shows the price of Silver over the
last 20 years. The highest price paid was about $50.00 an ounce in 1980, and
the lowest price was $3.80 an ounce in 1972.
Weekly. The next view is the weekly chart. It shows the same type information
as the monthly chart, except it is for a shorter time frame and shows the price
fluctuation week by week. Each “bar” represents one week’s prices, just like the
monthly chart represents monthly prices, but on a weekly basis.

Lesson One ___________________________________________________
Common $ense Commodities - All rights Reserved 1998 - 2003
28
The weekly chart will also prove to be invaluable in planning your long-term
trades. Later, I’ll show you later how to use both of them.
Take a look at the weekly chart for Silver below. As you can see, the lowest
price on the chart is $4.20, and the highest price is $7.20.
Daily: Let’s look at the daily chart for Sept 99 Silver on the next page.
Each commodity trades in a specific contract month (see Reference Section for
a list). This particular chart is for September 1999 Silver. This means when you
place an order for Silver, you would instruct the broker which contract month
(delivery month) you wished to buy or sell a contract in. As an example, the
following Silver contract for September 1999 Silver started trading back in July
1998 and expired 14 months later.
Delivery months for each commodity are in the Reference Section.
Now, you might want to trade another contract month that is “further out,” a
more distant month, like December 1999 Silver. The delivery month is the
month that you are contracting to either deliver, or take delivery, of the
commodity. (As a speculator, you will never take delivery, though.) We will
discuss the pros and cons of doing this later in the course. For now, I just want
you to understand the different “views” that you can see of a particular
commodity.

Lesson One
Common $ense Commodities - All rights Reserved 1998-2003
29
There are a few terms that you will need to become familiar with. Most of these
will be shown in the legend of the chart. Gecko Charts has this listed and is
available at a click of a mouse.
While I’m thinking about it, every chart in this course was prepared using
Gecko Charts 2000 software. I’m in “love” with this software and could not
imagine anyone trading without it.
Trading Lingo
The following is an explanation of several different terms, and I’ll explain a
little about each one of them.
The Contract Month: As you can see, the daily chart reads, SI, 1999U,
September - Silver . The last part is pretty obvious: Sept. 1999 Silver. This
means that this contract, or delivery month, is for the month of July 1999. The
“code” SI 1999U means the same thing and I have included a list in the
reference section that shows you what these codes stand for. (SI=Silver &
“U”=September.
Trading Hours: (Not shown on most charts.) The trading hours simply tell you
when the market is open for that particular commodity. You can buy or sell
only during these hours. Some charts also show you the exchange that it trades
on. In the case of Silver, it’s the COMEX where all the metals are traded. You

Lesson One ___________________________________________________
Common $ense Commodities - All rights Reserved 1998 - 2003
30
don’t need to worry about this, as your broker who places your trades knows
which exchange trades which specific contracts.
Margin: This is the “deposit” amount that you need to put up in order to buy,
or sell, each contract. If you wanted to trade two contracts, you would put up
twice as much, three times as much for three, etc. Currently, the margin on
Silver is $1,620 per contract. Remember, your margin is just a deposit to
offset any loses you might incur. You don’t actually spend that money. If you
make a profit on the trade, 100% of your margin money is credited back to your
account. On the other hand, any loses will come out of your “deposit.” (Also
see Margin Call in the Glossary section.)
Contract Size: This tells you how much of the commodity that you actually
control for each contract purchased. In this case, its 5,000 Troy Ounces of
Silver. This is where the leverage comes into play. You are controlling 5,000
ounces of Silver for just $1,620. If Silver is currently selling for $5.00 an ounce,
that means you are controlling $25,000 in Silver for a deposit of $1,620.
Point Value - 1¢ = $50: This means that each 1¢ change in the price of Silver
either makes or loses you $50. As an example, if the price moved up 10¢ and
you were “long”, then you made $500, and you lost $500 if the price went
down 10¢. Pretty simple!
Daily Limit: This is the maximum amount that the price can go up or down in
one day. In the case of Silver, there is NO daily limit. It could go from $4.00 to
$10.00, or more, in a day. Be careful trading contracts that don’t have a
daily limit. The reason is that without a daily limit, your losses can’t be
controlled as well, even when using a stop loss that you will learn about shortly.
Min. Move: 1/10¢ = $5: This means that the minimum the price can go up or
down is 1/10 of a cent. It’s not possible for it to move 1/20 of a cent, in other
words. People refer to this as “one tick”.
Quoted in CTS/OZ (1¢=$50): As stated earlier, 1¢ move in price reflects a
profit or loss of $50.
FND: 4/30/99: This is First Notice Day which means that you will get a notice
of intent to accept delivery (and pay for the full contract amount) of the specific
commodity. In the case of Silver, that means you would take delivery of 5,000
ounces of Silver. To avoid taking delivery, you must liquidate any long

Lesson One
Common $ense Commodities - All rights Reserved 1998-2003
31
position before this date. If you are irresponsible and miss this date, your
broker can make arrangements to sell your contract, but you will be charged a
fee for doing so. Don’t miss the FND date! Your broker should keep you
abreast of this upcoming date.
LTD 5/26/99: This is the Last Trading Date for this specific contract. You can’t
buy or sell after this date. All short contracts not closed by this date will be
settled by actual delivery.
Opt. Exp: 4/9/99: This is the date that options expire for this contract. Notice
that options expire quite a bit earlier than the contract expires. You will also
learn a little about options later in the course too.
Mini Contracts Traded: This means you can purchase a contract that controls
a smaller amount of the commodity and put up a smaller deposit. As an
example, you might buy a mini silver contract that controls 1,000 ounces of
Silver, rather than a full contract that controls 5,000 ounces. Of course you
make, in this example, 1/5 of the profits, since you only control 1/5 as much
Silver. By the way, you still pay a full commission when you purchase a mini
contract. Unfortunately, there is no such thing as a “mini commission”.
The Chart Itself
Dates at the bottom: This is the day of the week on the daily contract. It starts
on Monday, ends on Friday, and shows prices daily, except for certain holidays
and weekends. Weekly and monthly charts show the prices by the week or
month.
Vertical Prices: This is the price that Silver has been trading at each day.
These prices are listed on the right side of the chart.
Bars: The prices are reflected each day via a “bar.” This is where we get the
name “bar chart.” In the following diagram, I will show you how to read a
“bar.”

Lesson One ___________________________________________________
Common $ense Commodities - All rights Reserved 1998 - 2003
32
As you can see, there are four different prices reflected here. The first is the
“Open.” This is the price that it opened for trading that day. The next is the
“Low.” This is the lowest price it traded for that day. Next is the “High” or the
highest price it traded for that day, and last we have the “Close,” or the last
price paid that day. Many people feel the closing price is the most important
price of the day. On this bar, the price closed higher than it opened.
The reason is that every day, there is a battle going on with the bulls and the
bears. The bulls want to see the price go up and the bears want to see the
price go down. The closing price shows you who won that day.
Taking a Position - The Long and Short of It
When you place a trade, you are either long or short the market. When you are
long, you expect the price to go up; and if it does, you make money. When you
are short the market, you expect the price to go down; and if it does, you make
money.
When you buy a contract, you are long, and expect the price to go up.
When you sell a contract, you are short, and expect the price to go down.
So, going long is buying, and going short is selling. Of course, if you are long
and the market goes down, you lose money. Just the opposite if you are short.
The key is to be in the right trade: long when the market is rising, and short
when the market is dropping. You are going to learn techniques that will help
you understand which way the market may go. Remember, these techniques
are not foolproof, but they can be pretty darn accurate.
You’re going to learn to find your profit targets, which is where you feel the
price should go. Before we do that, let’s learn a little about some of the risk you
High
Open
Low
Close

Lesson One
Common $ense Commodities - All rights Reserved 1998-2003
33
will incur when trading. If you can learn good risk management, you can be
successful at trading. It’s the most important area of trading.
Keep in mind too, that without people like you, we would not have a
commodities market as we know it today. The reason is, we provide liquidity
for everyone.
Technical Analysis - Does It Really Work?
In the opinion of myself and many others, technical trading is the best way to
trade commodities. I could care less about the news! That’s a bold statement,
so let me explain why I say that. By the time you read or hear the news, it’s
already happened. You see, you and I are on the bottom of the news chain. If
you think otherwise, I’m sorry—you’re wrong!
To give you an example, as I was writing this, the price of gold dropped
because some countries were “dumping,” or selling off, their gold reserves.
There were people who knew this was going to happen beforehand. These
people took advantage of this information and sold Gold (went short), because
they knew that when these countries started to dump their Gold supply, the
price would go down. So, by the time you hear about it on the news, it’s too late
to do much about it. However, if you had been watching the charts, you would
have seen the price start dropping and could have made a trading decision,
based on technical rather than fundamental information.
Also, fundamental traders have to be aware of the weather patterns around the
world and how they might effect production. They also have to be aware of
world “inventory,” and who’s dumping product on the market, etc. It would be
a full-time job just to keep up with one commodity, much less with dozens that
you might want to keep an eye on.
There are times, however, when certain fundamental information can be
incorporated into your trading. The study of seasonal patterns is one thing that
is not difficult to learn and can prove helpful at times. I have included a
section on “Seasonals” in the Reference Section.
Now, on the other hand, we have technical analysis. I love the charts! I feel
they tell you almost everything you need, once you understand how to read
them.

Lesson One ___________________________________________________
Common $ense Commodities - All rights Reserved 1998 - 2003
34
You’re going to learn a lot about technical trading in this course, and I hope you
can master it. It’s not rocket science, it’s an art— but it’s not as complicated as
you might think.
Reward/Risk Ratios
In any trades you make, you should always know your reward/risk ratio. How
much are you willing to risk? What’s your upside (what you think you might
make)? What’s your downside (the amount you might lose)? How much of
your trading account should you risk on any one trade? It’s not as much as
you might think!
Although no one can control which way the market is going, you can
usually control your risk. If you don’t control your risk in trades, you won’t
be around very long to have to worry about it. Would you risk $5,000 to make a
possible $1,000? Those are horrible odds, yet I’ve seen people do this over and
over until they are broke. However, would you risk $1,000 to make $5,000 if
the odds were in your favor? Probably.
The key is to understand the reward/risk ratio on every trade you do and
only trade the ones that have a lot more reward than risk. One way to look
at reward/risk is by remembering the coin toss game we’ve all played as
children. If you played with a nickel and your opponent played with a dime, and
each time you won, he gave you a dime, and each time you lost, you gave him a
nickel, who is going to win in the long run? Of course, you would. You might
lose the first 5, or even 10 tosses in a row, but over time, you would win twice
as much as your opponent, because your risk was 1/2 as much as his. Right?
That’s exactly what we want to do when trading. We want the risk to be in our
favor.
Just like in the coin toss example, we want the odds in our favor before we
make a trade. Personally, I like my students to see a risk/reward ratio of 2:1 or
better. In other words, if you have a chance of making at least $1,500 if your
target is hit, then you don’t want to risk more than $750 on the trade. I’ve seen
trades that have 3:1 or even a 4:1 ratio. I like to see these trades, and you will
too. At times, you can put on a short term trade where you can have a little less
than a 2:1 Reward/Risk ratio, but don’t do it all the time.

Lesson One
Common $ense Commodities - All rights Reserved 1998-2003
35
You are going to learn how to figure your profit targets and when to get into a
trade a little later. You will also learn how to protect yourself, and how to
control your risk. To do this, you need to know how to use stops.
The Stop Loss
“Stops” are simply orders to exit a trade at a predetermined price. Let’s say that
you think the price of a certain commodity is going up, so you want to buy a
contract (go long).
The stop loss is an order that is opposite of your entry order. In other
words, if you go long on a contract, you would place a stop (an order to sell the
contract and exit the trade) somewhere below your entry price. Let’s look at a
generic example of going long on the following chart.
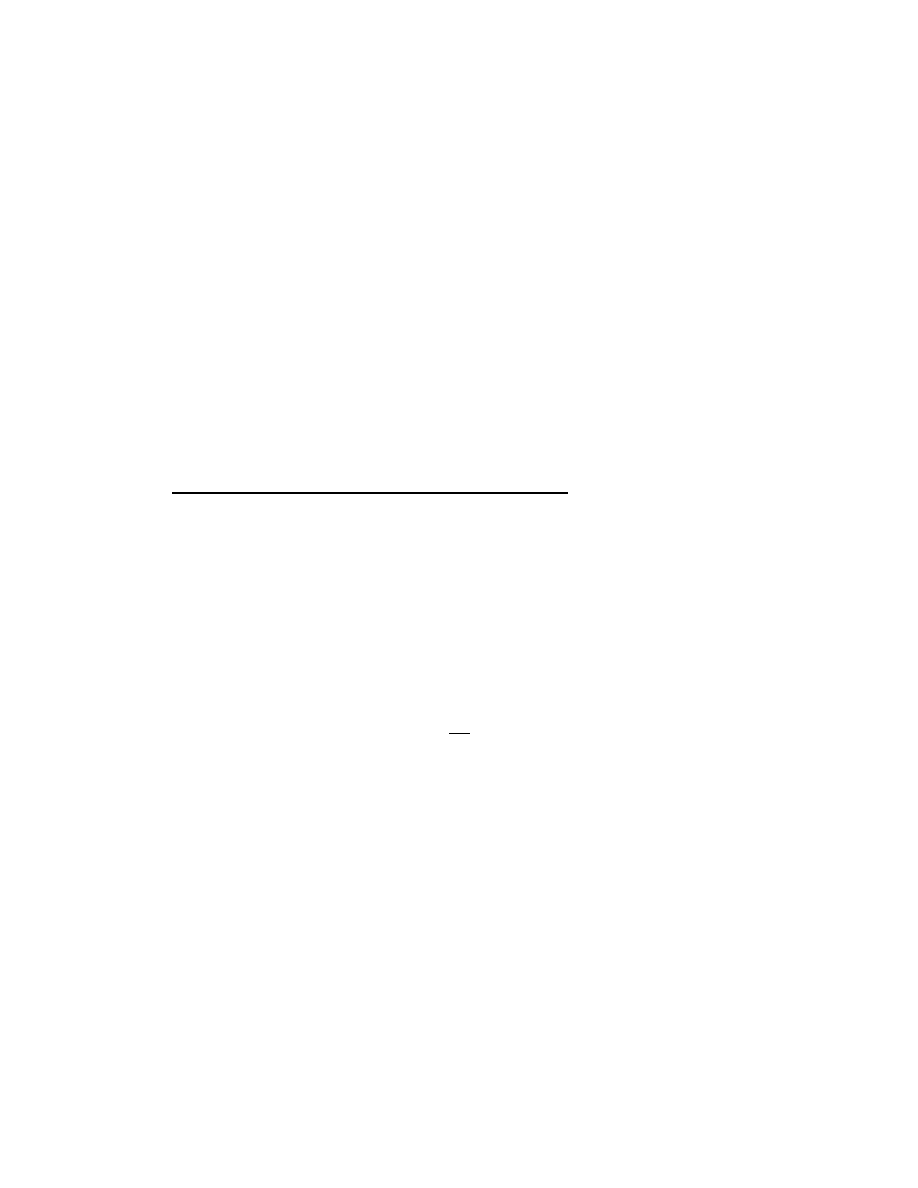
Since you expected the price to go up, you “bought” a contract to “go long.”
You make money when the price goes up. But if the price goes down, you want
to protect yourself. You want to limit your losses. In this example, you risked
108 points because you entered long from 56.41 and your stop loss (your sell
order) was at 55.33. This means if the price went down to 55.33 or below, you
would be “stopped out” with a loss of 108 points, because if the price dropped
and “hit” your stop, your contract would be sold for a loss at that price. This
loss would be paid from your margin “deposit.” Stops are just one way you can
limit your losses when trading. We will cover other ways a little later.
Lesson One ___________________________________________________
Common $ense Commodities - All rights Reserved 1998 - 2003
36
THERE ARE CERTAIN TIMES THAT EVEN A STOP LOSS WILL
NOT PROTECT YOU.
As an example, let’s say you were long the Silver market from $3.50 and you
had a protective stop at $3.25. This means if the market drops down to $3.25,
you would be stopped out with a loss of .25 cents, or $1,250 (25 X $50). But
what happens if you go to bed one night, wake up the next morning, and the
price of Silver opened at $3.00? It never “hit” your stop in this case and you
were stopped out at the opening price of $3.00, for a loss of .50 cents, or
$2,500! Don’t ask me how I know! It’s just one of the many risks in trading
and something you need to be aware of. There’s not much you can do about it,
either. It probably won’t happen to you at all, or not very often anyway, but you
should be aware of it. (Remember my promise not to “sugarcoat” anything).
Every time you place an order, you should always place a stop at the same
time. Never trade without a stop loss of some kind. Later in the course, you
will learn to use options as a stop. You don’t want to put your stops too close to
your entry price, because if you do, you will get “stopped out” during the
normal day-to-day price fluctuations. I’ll cover the best place to put your stops
later in the course. Right now, I just want you to be familiar with how they
work.
Of course, the opposite would hold true if you were short, expecting the price to
go down. If you place your “sell order” to go short Silver at $3.50, then you
would want to place a buy stop at maybe $3.75, which means you will get
stopped out for a loss if the price went up to $3.75. Again, this will be covered
in more detail later.
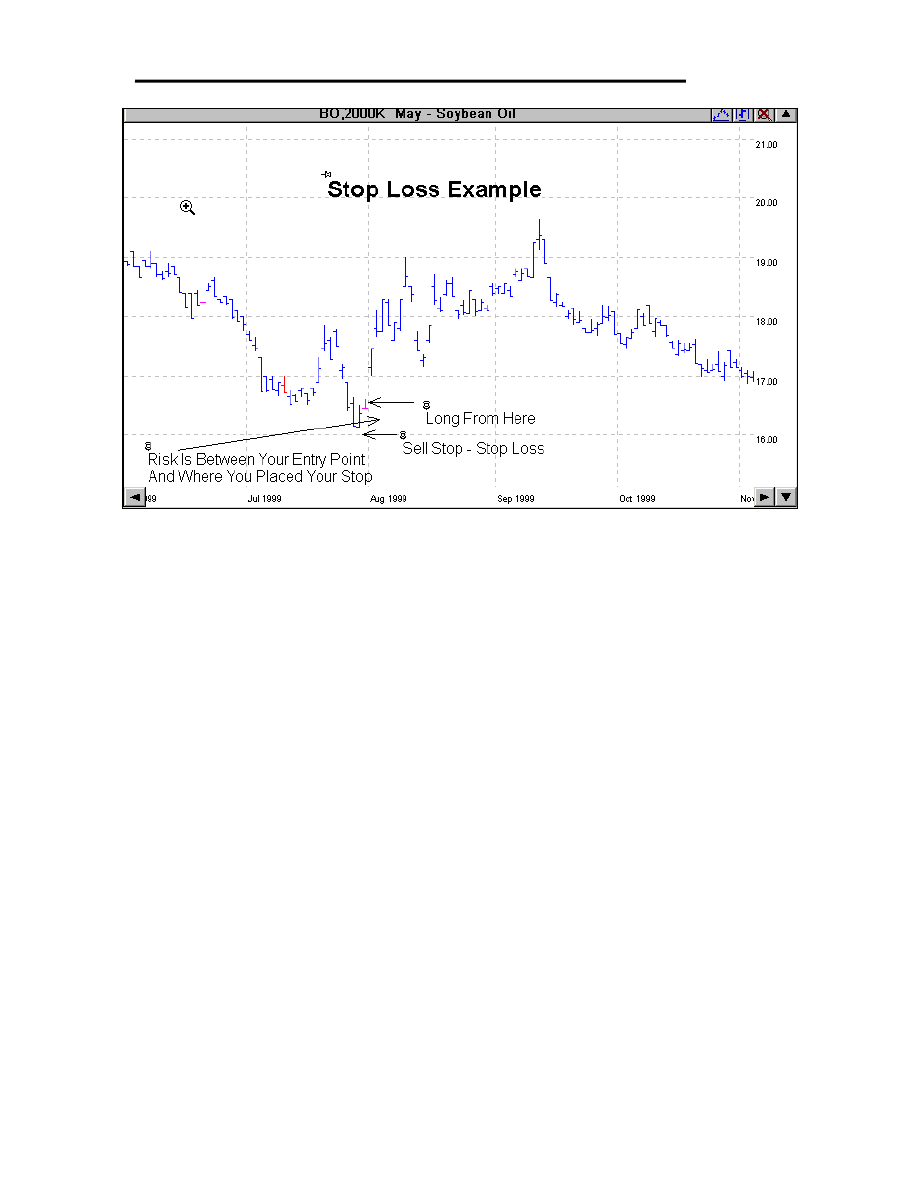
Remember, I told you that sometimes the price may “open” the next day at a
much higher or lower price than high or the low of the day before? This is
called a Gap and you will learn a lot about them later. Notice on the following
chart, the price did just that— it “gapped” open the next morning. In this case it
worked in your favor, since you were “long” the market.
Your fill price would be where the market opened the next day (about 17.10 in
this example), not from where you had your order placed to go long. This
would be considered a bad “fill” price in this case since you are now long from
a higher price due to the gap. We will talk more about this later in the course.
Lesson One
Common $ense Commodities - All rights Reserved 1998-2003
37
Types of Orders
(Also see Reference Section
)
There are many different ways to place an order, and I want to give you some
specific explanations of the most common types of orders.
Which type of order you use will depend on several different factors, based on
your objectives for each particular trade. It is extremely important that you and
your broker understand the type of order you are placing. Millions of dollars
have been lost by entering the wrong types of orders. Once placed, it’s a
done deal. Mistakes can be very costly, but they can be avoided by having a
good understanding of what you are doing. Make sure your broker has a clear
understanding of what kind of order you are placing.
With Track-n-Trade charting software, you can actually place your comments
on a chart with your entry price, stops, etc. and e-mail it to your broker. This is
a great way to avoid “miscommunications” that sometimes happen.
Make sure you broker repeats your order back to you. If you are not
certain that what he or she is telling you is what you meant, stop right
there and get it straight! Tomorrow is too late!

Lesson One ___________________________________________________
Common $ense Commodities - All rights Reserved 1998 - 2003
38
The following are the most common types of orders:
Market Order. This is the most common type of order. When you enter a
market order, you do not specify a specific price. You simply state that you
want to go long, or short, “at market.” When you place this type of order, it
goes to the trading floor and is filled at whatever the current price may be.
Most of the time, it’s filled fairly close to what the price was when you placed
the order, but in “fast” or “thinly traded” markets it could be very different, so
be careful, and learn about the markets you are trading. This is also known as
“slippage.”
Limit Orders. Limit orders simply state a price limit that your order must be
filled. In other words, it must be filled at the price you specify, or better. Limit
orders have the advantage that you will know the worst price that you will pay.
One disadvantage is that you might not get filled at all if the price that day does
not trade within the price you requested.
Stop Orders. Stop orders are not executed until the price reaches a specific
point. When the price reaches that point, the stop order becomes a market
order. Most of the time, stop orders are used to exit a trade. You may have a
stop order to get out if the market hits 65.00, as an example. When the market
hits 65.00, your stop order becomes an open order at 65.00 to exit the trade.
You will probably “get out” at that price or very close to it.
You can have a “buy stop” order, which means you want to buy a contract, or
go long, and you can have a “sell stop” order, which means you want to sell a
contract, or go short. This way, your order is filled at that price or better.
Day Order. Day orders are good for only one day, the day you place the order.
Let’s say you want to go long Sept. 1999 Sugar. You call your broker and place
a day order (as a limit order or a buy stop order) at 6.50. This order would be
good only for the day you placed it. If the market did not reach 6.50 that day,
your order would not be filled. As an example, if the highest price Sugar
reached that day was 6.49, and your order was at 6.50, your order would not be
filled. Sugar could open the next day at 6.50, and rally to 7.00, but you would
not be in the market since your order the previous day was a day order and good
only on that day. If a Day order is not filled the day you place it, it’s
canceled at the end of the day. You have to place the order again the next
day.

Lesson One
Common $ense Commodities - All rights Reserved 1998-2003
39
.Good Till Canceled (GTC). A GTC order simple means that you place your
order and it “sits there” until it’s filled. It’s also called an open order. You
must tell your broker that it’s a GTC order, or he/she might place it as a day
order, and you might not want that to happen. I don’t suggest that you use
these very often. You will learn why later.
As an example, you want to go long September Wheat at 290 because of
something you see on the chart, and if it reaches that price, you want to be long
the market. You would call your broker and place an open order GTC to go
long, just above 290. This order sits there until it’s filled, even if it takes three
months to fill it. The order is always “open” until you cancel it or the contract
expires.
You must keep a very close watch on your open orders. If you place an open
order and forget about it, it may get filled weeks later, and that might not be
what you want at the time. Again, don’t ask me how I know about this! You
should keep a list of all your open orders and look at it every day. If you decide
that you no longer want one of these as an open order, you have to call
your broker and cancel it. It’s your responsibility to keep track of your
open orders.
Also, when you place a stop loss order, make sure it’s a GTC Order, or
your broker might think that it's a one-day order, which means it's only good for
one day, and the next day, you don’t have a stop loss order at all. Needless to
say, a mistake like this can be costly. Don’t ask me how I know this either!
End Of Lesson One

Lesson One ___________________________________________________
Common $ense Commodities - All rights Reserved 1998 - 2003
40
Homework Lesson One
1. Commodity trading in the USA started in the 1840s in which city?
a. __ Chicago
b. __ St. Louis
c. __ New York
d. __ Kansas City
2. There are three positions one can take when trading commodities. One is
“Long,” the second is “Short,” and the third one is _____________.
Hint: most people don’t take the last one often enough.
3. Commodity trading is also known as ____________________ trading.
4. When you “go long” the market, you expect the prices to:
a. ___ Go up
b. ___ Go down
5. When you “short” the market, you expect the prices to:
a. ___ Go up
b. ___ Go down
6. When you “sell” a contract, are you going long or short?
a. ___ Long
b. ___ Short
7. When you “buy” a contract, are you going long or short?
a. ___ Long
b. ___ Short
8. As a “Speculator” in the market, when would you take delivery of a
commodity?
a. ___ At the expiration date of the contract
b. ___ 30 days before the contract expires
c. ___ You would never take delivery
Lesson One
Common $ense Commodities - All rights Reserved 1998-2003
41
9. When someone “sells” a contract and keeps it until the end of the contract,
he/she is committing to _____________ (Hint: Remember the farmer)
a. ___ Deliver the commodity
b. ___ Purchase the commodity
c. ___ Neither one
10. The role of the speculator in the market is to provide:
a. ___ Actual buyers and sellers of the commodity
b. ___ Cash so that farmers can make a living
c. ___ Liquidity for everyone in the market
11. If you are “long” the market, and the price goes down, you:
a. ___ Lose money
b. ___ Make money
12. If you bought a futures contract in wheat that controls 5,000 bushels, and
the price went up 50¢ a bushel, how much money did you make?
a. ___ Nothing. I lost $5,000
b. ___ I made $250
c. ___ I made $2,500
13. There are basically two types of speculators. One is the ______________
trader and the other is the _________________ trader.
(Hint: some people use a little of both.)
14. The chart with the longest price history is the __________ chart. The chart
that shows today’s price is the ____________ chart.
15. The margin on a contract is like a good faith deposit.
a. ____ True
b. ____ False
16. Daily Limit is:
a. ___ The maximum amount that the price can go up or down in a day.
b. ___ The minimum amount that the price can go up or down in a day.
c. ___ The daily amount that I have to keep in my margin account.
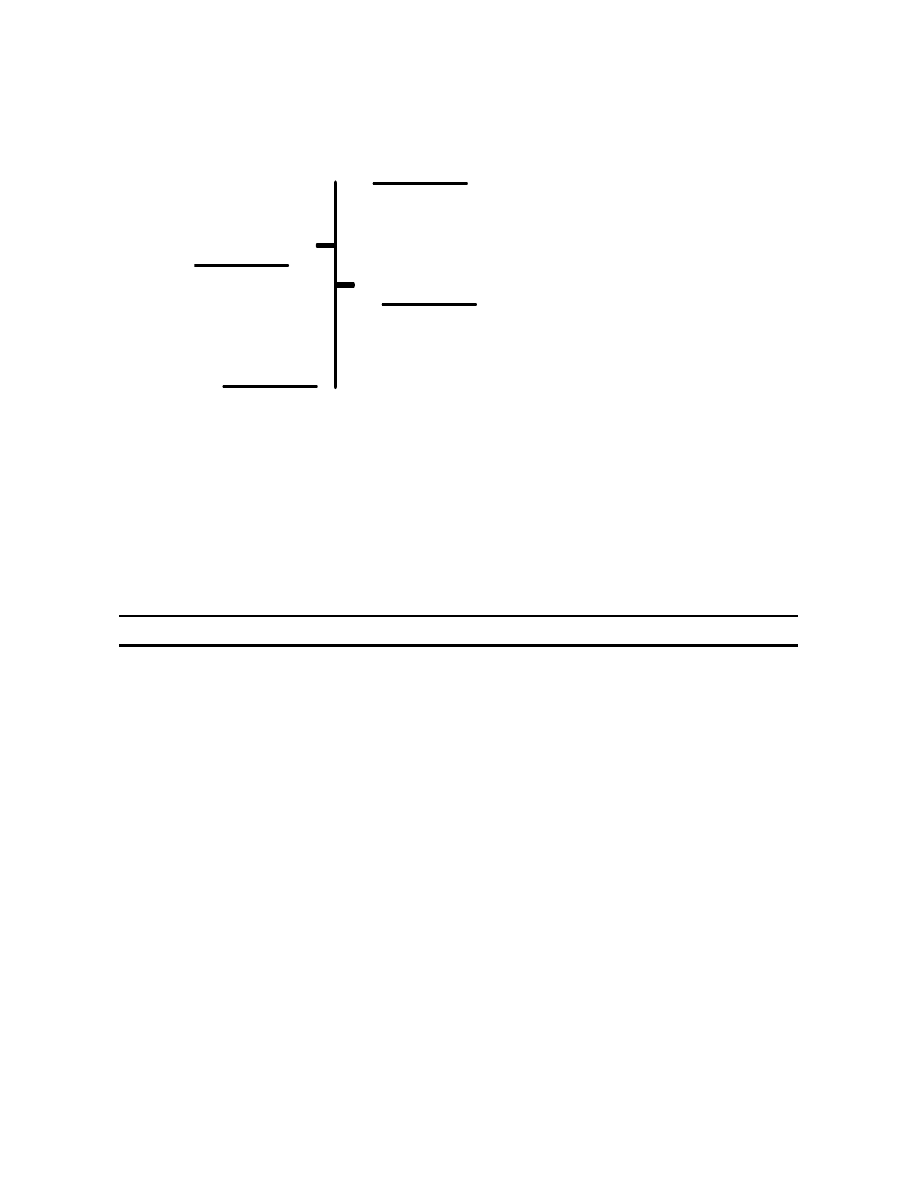
Lesson One ___________________________________________________
Common $ense Commodities - All rights Reserved 1998 - 2003
42
17. On the price bar shown below, fill in where the high, low, open, and close
would be.
18. What price do most people think is the most important price of the day?
a. ___ Open
b. ___ High
c. ___ Low
d. ___ Close
Why? _________________________________________________________
19. If you are long the market, what did you do?
a. ___ Bought a contract
b. ___ Sold a contract
20. A stop is used to limit risk.
a. ___ True
b. ___ False
21. On page 35, the diagram shows that your risk was 20 points. If each point
was worth $50, how much risk in actual dollars is it? $_________
ANSWERS ARE IN BACK OF THE COURSE, BUT DON’T CHEAT

Lesson One
Common $ense Commodities - All rights Reserved 1998-2003
43
Notes

Lesson Two_______________________________________________
Common $ense Commodities - All rights Reserved 1998 - 2003
44
Notes

_____________________________________________________ Lesson Two
Common $ense Commodities - All rights Reserved 1998-2003
45
Lesson Two
Charting In General
The charts can be effective tools to help you learn to trade with confidence if
you know how to “read” and analyze them correctly. Once you finish this
course, I think you will understand why I feel the charts contain almost all the
information you need to trade. You will learn to get a “feel” for charts and learn
to “hear” what they are telling you. Sometimes they will even “shout” at you!
In this lesson, we are going to look at several different formations. Don’t worry
about the specific ways to trade them right now. We will cover this a little later.
Right now, I just want you to see the charts—follow along with me for a little
while.
Trends
“The Trend Is Your Friend.” What this means is that the price may trend in
one direction for a long time. You usually want to trade with the trend. Usually
if the long-term trend is down, you want to be short; and if the long-term trend
is up, you want to be long.
There Are Three Types Of Trends
1. The Major Trend
2. The Minor Trend
3. The Near Term Trend (also called The Current Trend)
The Major Trend. Charles Dow, author of the Dow Theory, said that the
major trend lasts a year or longer. However he was referring to stocks when he
said this. When looking at a commodities chart, you can shorten that to six
months. However, some long-term trends can last for years.
The Minor Trend. Most people look at the minor trend as being between three
weeks and three months.
The Current Trend. This is sometimes referred to as the near-term trend, and
should be looked at as the trend in the last two or three weeks.
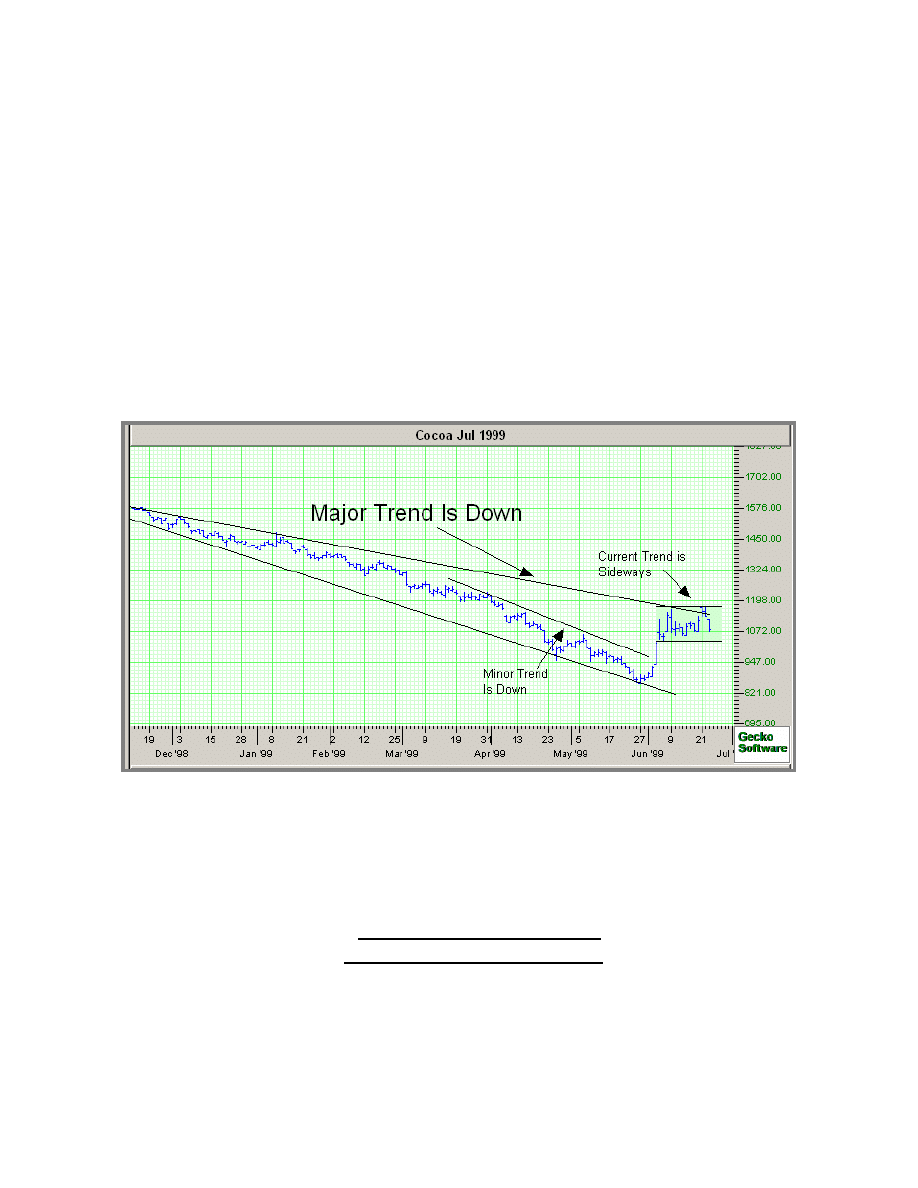
Lesson Two_______________________________________________
Common $ense Commodities - All rights Reserved 1998 - 2003
46
When you look at charts, you will notice that in the major trend, you will see
minor trends that could be opposite the major trend. Within the minor trend,
you will see near-term trends that could be opposite the minor trend.
Look at the very long-term downtrend in Cocoa on the following chart. It’s
obvious that the major trend is down, but you will also notice that during the
downtrend, the price rallied several times for a week or so. This is quite normal,
as you will soon see.
The price was way up at the start of the contract, and then changed trend as the
price began to drop. This downtrend started in November, hit “bottom” in May,
and then headed back up.
Obviously, if you had caught this trend back in November and stayed with it
until June, you could have made a lot of money.
Learning to draw trendlines is important in learning to trade correctly. To
understand what a trend is, you need to define it first. A downtrend, as shown
on this chart, is a series of lower highs and lower lows. An uptrend is just
the opposite—a series of higher highs and higher lows.
An uptrend can be intact until a previous support has been broken. Support is a
place the price has a hard time breaking past or through. Same thing for
resistance. You will learn a lot about this in Lesson Three. In the case of a
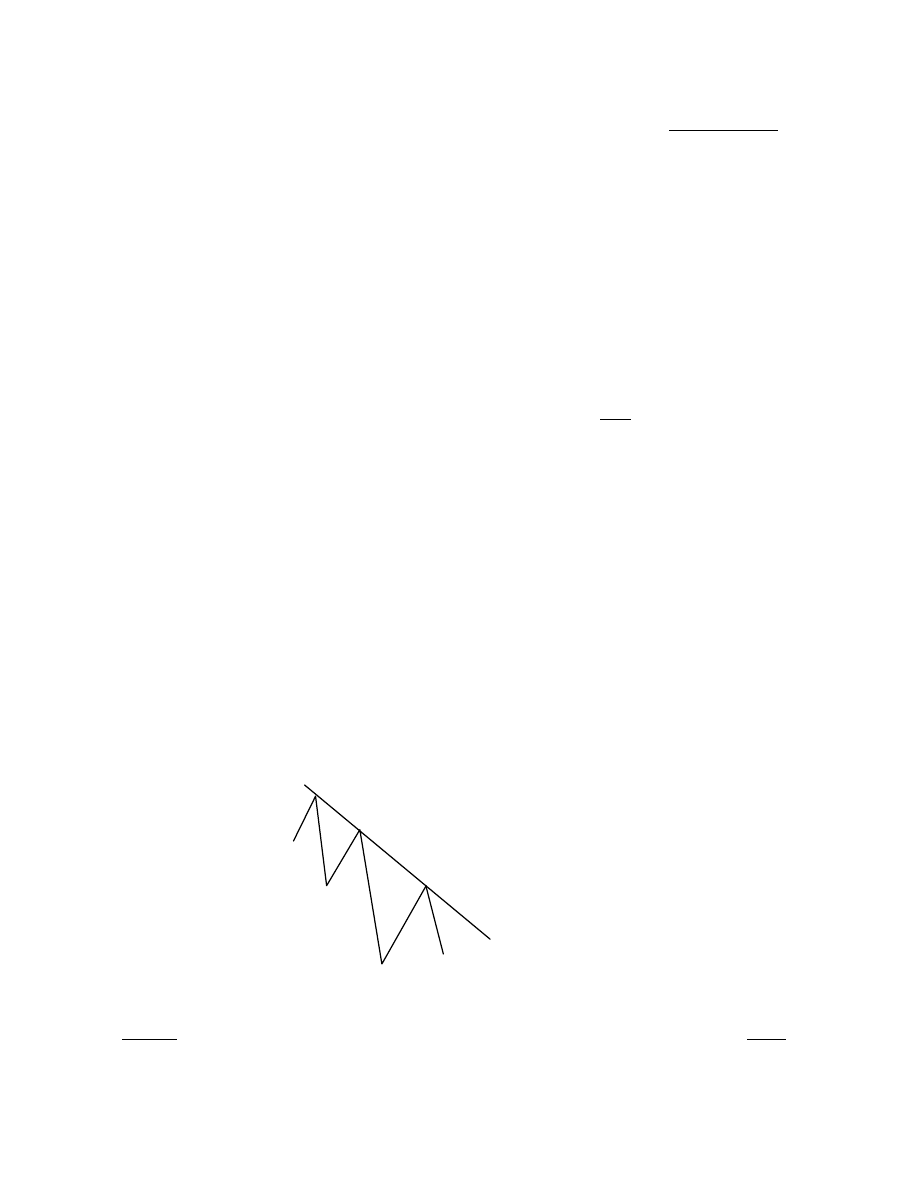
_____________________________________________________ Lesson Two
Common $ense Commodities - All rights Reserved 1998-2003
47
downtrend, a breakout to the top of the trendline (when the price closes above
the trendline for more than two consecutive days) is a good indicator that the
trend might be broken. Of course the opposite holds true for an uptrend.
When the price jumps above or below the trendline for one or more days but the
closing price remains within the trendline, it’s called a “False Breakout,” and
the trend is still considered to be intact.
By drawing trendlines, you can see when the price breaks out, and when the
trend may be broken. Look again at the previous chart for July 1999 Cocoa.
I’ve drawn the trendlines for you. It’s obvious when this trend ended and the
price reversed direction. When the price reversed and went up, you would have
wanted to get out of all your short trades and go long, or buy a contract.
Drawing Trendlines
I like to draw my trendlines across the tops AND the bottom prices. I feel this
gives me a better visual feel for what the trend is doing. You don’t have to draw
both lines if you don’t want to. Look back at the Cocoa chart and you can see
that I drew both lines on this chart. I think it’s just easier to “see” the trend this
way.
Confirming The Trend - Getting Three Hits
When you draw your trendlines, you must get three “hits” in order to confirm
the trend. Let’s look at the following diagram to see what I mean.
1
3
2
Hits 1 & 2 Begin The Trend
And Hit #3 Confirms It
As you can see, the first two times the price hit the top of the trendline, it
started the downtrend. However, it takes the price hitting the trendline the third
time for the trend to be confirmed. Of course, the same holds true of an uptrend.

Lesson Two_______________________________________________
Common $ense Commodities - All rights Reserved 1998 - 2003
48
What Significance Does This Have?
Remember in school—we learned that a body in motion tends to stay in
motion? The same holds true for trends. It takes a lot of energy, or momentum,
to reverse a trend.
You might be wondering how to determine the strength of a trend. There are
several ways I like to do this:
1. Number of hits
2. How long the trend has been established
3. Rate of ascent or descent
Number of hits. The more times the price touches or hits the trendline, the
more valid the trend. This is just plain old common sense again. Ten hits are
more important that three hits. Right? Of course they are. Look at how many
times the trendline was hit on the Cocoa chart.
How long has the trend been established? A trend that is six months old is
obviously stronger than a trend that is six-weeks old; again, just common sense.
Of course, a trendline on a monthly chart is stronger than a trendline on a
weekly or daily chart.
Rate of ascent or descent. One of my students is a pilot, and we were talking
about this once. He used the analogy of how fast a plane is descending. A plane
on a 10% descent is much easier to pull out of the dive than one on a 30%
descent. So keep this in mind when you are looking at trends. Is the trendline on
a nice steady slow descent, or is it in a nose-dive?
Redrawing the Trendlines
Sometimes “Old Man Trend” will try and fool you. Let’s use some common
sense and see if we can stay on track. In the following diagram, in Example
One, you will notice that the prices kept hitting the trendline over and over, and
then it suddenly breaks out of the trend one day (point #4 in Example One).
What do you do? Is the trend broken? Do you redraw the trendline? The
following diagram may help in your decision-making process.

_____________________________________________________ Lesson Two
Common $ense Commodities - All rights Reserved 1998-2003
49
The way that I suggest is to wait until the fourth or fifth “hit.” In Example Two
below, the next hit would confirm that the trendline should be raised, and
connected between points 1, 4, and 5.
On the other hand, if the price did not rise (Example Three), then I would
continue the trendline as it was in Example One, and would consider point #4
where it broke out of the trend as a false breakout.
How To Tell If The Trend Is Actually Broken
There is no absolute way to be 100 percent sure except to just wait and see. One
way that might help is to watch the closing price each day. If the closing price
is beyond the trendline for two or more days, then it is a good chance the trend
is broken.
Never trade the first day the price breaks the trendline. Wait at least two
days to confirm the trend is broken. Look at the following diagram to see
what I mean.
1
2
3
4
1
2
3
4
5
1
2
3
4
5
Example One
Example Three
Example Two

Lesson Two_______________________________________________
Common $ense Commodities - All rights Reserved 1998 - 2003
50
In the above diagram, the top example shows you that the trend is still intact
since the price did not close below the trendline for two consecutive days.
The bottom example shows the trend being broken, since the price did close
below the trendline for two consecutive days. Hopefully, this will keep you out
of some bad trendline breakouts. Sometimes the third day is the one that tells
the true story.
The Magnetic Trendline
Many times you will see the trendline act like a magnet. Look at the following
diagram to see what I mean.
Many times, the trend will reverse from up to down, or down to up. When it
does, you will often see the price hover around the trendline again. In other
words, support becomes resistance, or resistance become support. The prices
tend to hover around the trendline, like it’s a magnet.
Trend Broken
Trend Intact

_____________________________________________________ Lesson Two
Common $ense Commodities - All rights Reserved 1998-2003
51
.
One way to profit by this is to use the trendline as support or resistance for
entering trades or for placing your stops.
You can see that this happened three times on the following chart of Aug. 2000
Hogs. Isn’t this interesting! So keep your old trendlines on the charts, as they
may act like a magnet and draw prices to them. We will cover this later in more
detail.
Support Becomes Resistance
Resistance Becomes Support
(Prices Hover Around The Trendline)
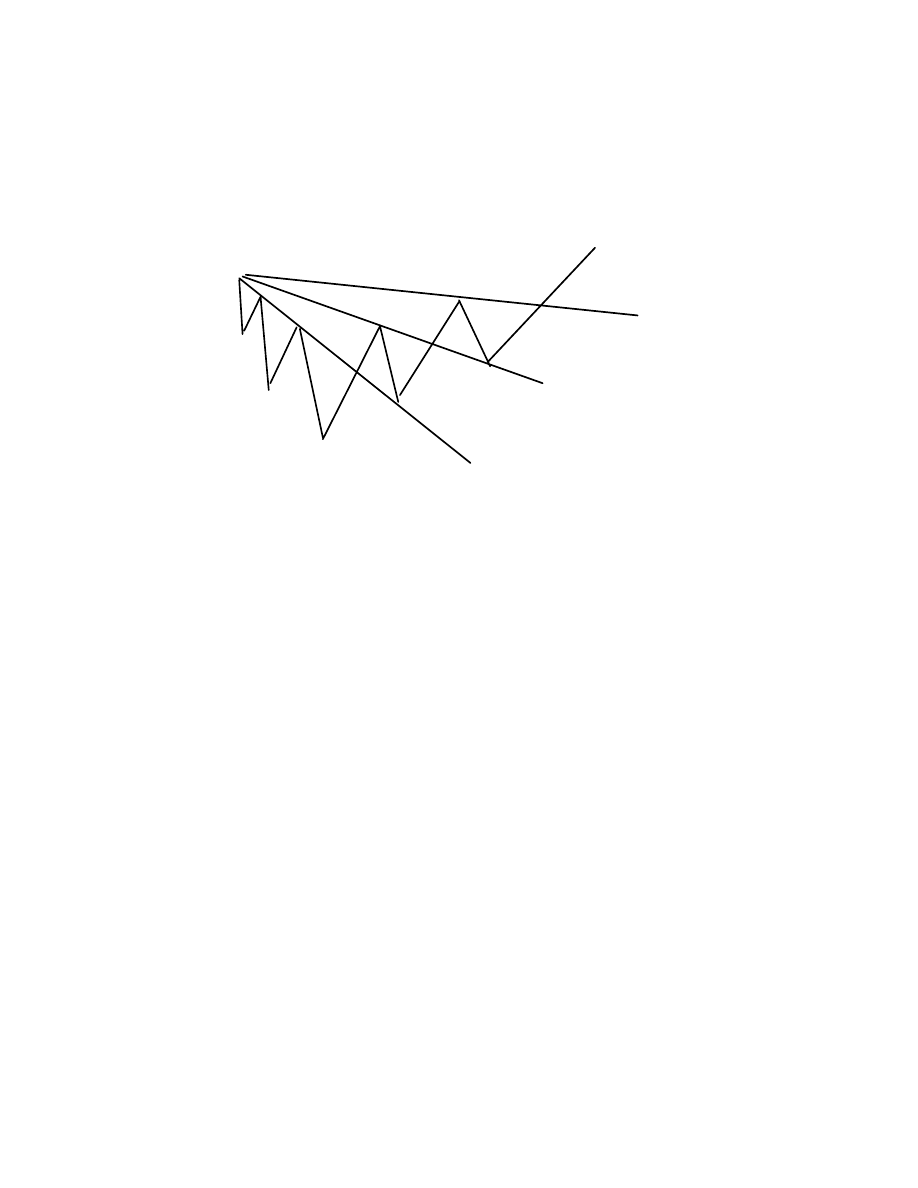
Lesson Two_______________________________________________
Common $ense Commodities - All rights Reserved 1998 - 2003
52
The Fan Principle
As you have seen, prices will often bounce between trendlines. Let’s look at an
uptrend diagram.
As we have discussed, prices will tend to bounce back and forth between these
trendlines. Many chartists believe that in order to confirm a trend reversal, the
trendline must be broken three times. Look back on some of your own charts to
see how uncannily accurate it is.
In John Murphy’s Book, Technical Analysis Of The Futures Market (highly
recommended reading, by the way), he talks about the importance of the
number three. He says that the Fan Principle has three points, major bull and
bear markets go through three phases, (Dow Theory and Elliott Wave Theory),
there are three types of Gaps, there are Triple Tops and Triple Bottoms, Head
and Shoulders that have three main peaks, three classes of trends that we talked
about earlier, three trend directions (up, down and sideways), three types of
triangles, and there are three principal sources of information— price, volume,
and open interest. We will discuss all of these items later in the course. I just
find it very interesting and did not want to forget to mention it.
45 Degree Angles
W.D. Gann liked to use 45-degree angles with all his trendline projections. His
theory was that most “true” trendlines would angle at an almost perfect 45
degrees. If the angle is greater than or less than that, then it won’t hold.
1
2
3

_____________________________________________________ Lesson Two
Common $ense Commodities - All rights Reserved 1998-2003
53
Look at the following chart to get an idea of what Mr. Gann was talking about.
So when you see a trendline that is just too slow, or too fast, don’t trust it in
most cases. The trendline on the following chart was a perfect 45-degree angle
and as you can see, it lasted for several months.
Too High or Fast
Too Low or Slow
Optimal 45 Degrees
A
B
C
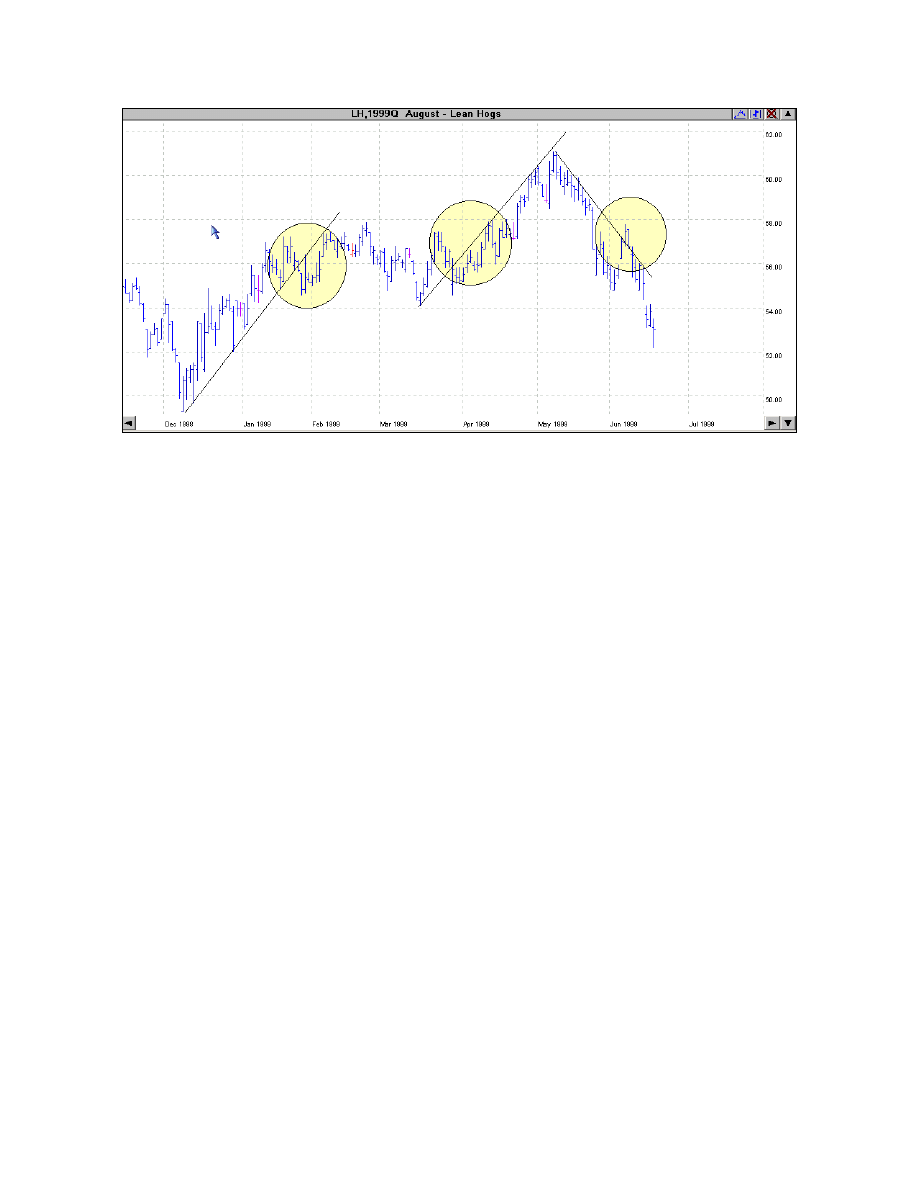
Lesson Two_______________________________________________
Common $ense Commodities - All rights Reserved 1998 - 2003
54
Remember this chart? Look at the three lines I drew on it. As you can see, all
three of them were approximately a 45-degree angle and they all lasted for two
to three months. Aren’t these charts interesting?
End of Lesson Two

_____________________________________________________ Lesson Two
Common $ense Commodities - All rights Reserved 1998-2003
55
Homework Lesson Two
1. “The Trend is your _______________________.”
2. What are the three types of trends?
A.
_____________________
B.
_____________________
C.
_____________________
3. Most people look at the minor trend being between three ___________ to
three _______________.
4. An uptrend can be intact until a previous ___________________ has been
broken.
5. Sometimes the ___________________ trend is referred to as the near term
trend.
6. There are several ways to determine the strength of a trend. Name three.
A.
___________________________________________
B.
___________________________________________
C.____________________________________________
7. How many “hits” does it take to confirm a trend? ____________
8. One way that might help you to see if a trendline is really broken, is to watch
the __________________ price each day. If this price is beyond the trendline
for ______________ days, then the chance is pretty good the trend may be
broken.

Lesson Two_______________________________________________
Common $ense Commodities - All rights Reserved 1998 - 2003
56
9. Many times, the trendline will act like a magnet.
True
______
False
______
10. The Fan Principle has how many points? ____________
11. Many chartists believe that in order for a trend to be reversed, the trendlines
must be broken ______ times in order to confirm the trend reversal.
12. “Perfect” trendlines have an angle of _______ degrees.
13. You should always trade on the first day a trendline is broken.
True
___
False
___
Answers are in the back of the course, but don’t cheat.

_____________________________________________________ Lesson Two
Common $ense Commodities - All rights Reserved 1998-2003
57
Notes

Lesson Two_______________________________________________
Common $ense Commodities - All rights Reserved 1998 - 2003
58
Notes
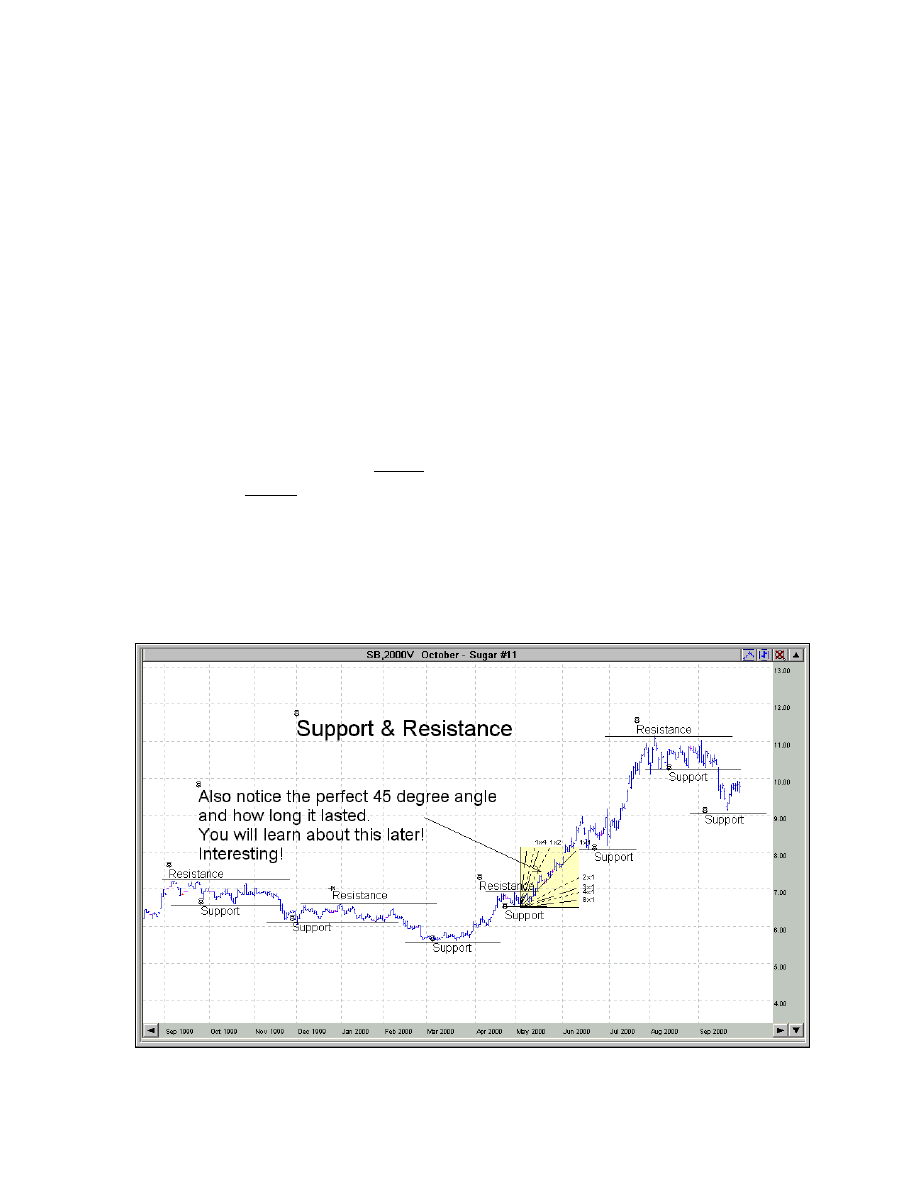
_________________________________________________ Lesson Three
Common $ense Commodities - All rights Reserved 1998-2003
59
Lesson Three
Support and Resistance Levels
Support and resistance are important terms to understand. They will
play a major role in learning when and where to place your orders, when to
get out of a trade, and where you might want to place your stops. Think of
support as the “floor” and resistance as the “ceiling.”
It’s important to understand that these support and resistance levels are there
for a reason. It simply means that the price reached a point that it could not,
or had difficulty, going through. This is why people refer to it as “resistance”
when the price could not go above this point, and “support” when the price
could not go below this point.
For now, just understand that prices are like a rubber ball and they will tend
to bounce between these support and resistance levels until they break
through. Now, let’s look at some support and resistance levels on the
following chart. Remember, support is the floor, and resistance is the ceiling.

Lesson Three_______________________________________________
Common $ense Commodities - All rights Reserved 1998 - 2003
60
In this lesson, you’re going to learn when to place some trades and where to
place them. You will learn how to read these charts and to understand some
technical formations that take place, as well as how to take advantage of
them. Soon, you’re going to learn to use these support and resistance levels
in placing your orders and your stops. For now, I just want you to be able to
see them and label them.
On the following chart, take a ruler and a pen and draw the support and
resistance levels yourself, just like I did on the previous chart. It may seem
like a simple exercise, and it is; but it’s important to learn how to do it.
Market Corrections - Why They Happen
There are just three types of traders if you think about it. Those who are
long, those who are short, and those who are uncommitted. The people who
are long are, of course, those who have purchased contracts, while the
opposite holds true for those who are short, who have sold contracts. Then
there are those who have not committed themselves either way.

_________________________________________________ Lesson Three
Common $ense Commodities - All rights Reserved 1998-2003
61
Have you ever wondered why the prices sometimes just bounce up and
down between these support and resistance levels? I’ll give you a Common
Sense viewpoint.
How many times have you seen prices hover around a support area for days,
weeks, or even months, and then the price starts to rally all of a sudden? The
people who are holding long contracts are very happy. The only thing they
are regretting at this point is that they did not buy more when the price was
lower. They are hanging around, waiting for a small market correction (price
to drop back), so they can buy additional contracts at a lower price.
On the other hand, we have the people who were short the market. They are
not real happy about this because they wanted the price to drop. About this
time, they are thinking they are on the wrong side of the trade, and it might
be time to get out with a small loss rather than risking even greater losses.
But they are waiting for the same market correction that the longs are
waiting for, so that they can get out at a better price and have a smaller loss.
The thing is, both the longs and the shorts want the same market correction
to take place! Think about that for a moment. Both sides of the market want
the correction to take place, just for different reasons.
The other group, the “undecideds”, sees that the market is taking off, but
they too want to see a price correction take place before they jump in. So
now we have everyone, the longs, the shorts, and the undecideds, wanting
the price to reverse a little. Each one has a different motive, however.
So now you have everyone trying to push the price down. That’s why you
see these pullbacks. Of course, the opposite scenario holds true if the market
is in an uptrend and the trend reverses. Everyone wants the price to go back
up a little for the same reasons.
But what happens if the price goes back down? Glad you asked. Previously,
we talked about the price going up and then dropping back down a little.
This, by the way, is also called a “pullback.” When everyone started buying
contracts on this pullback, this created another support area, didn’t it? If this
pullback continues and the previous support is broken, then the following
scenario takes place.
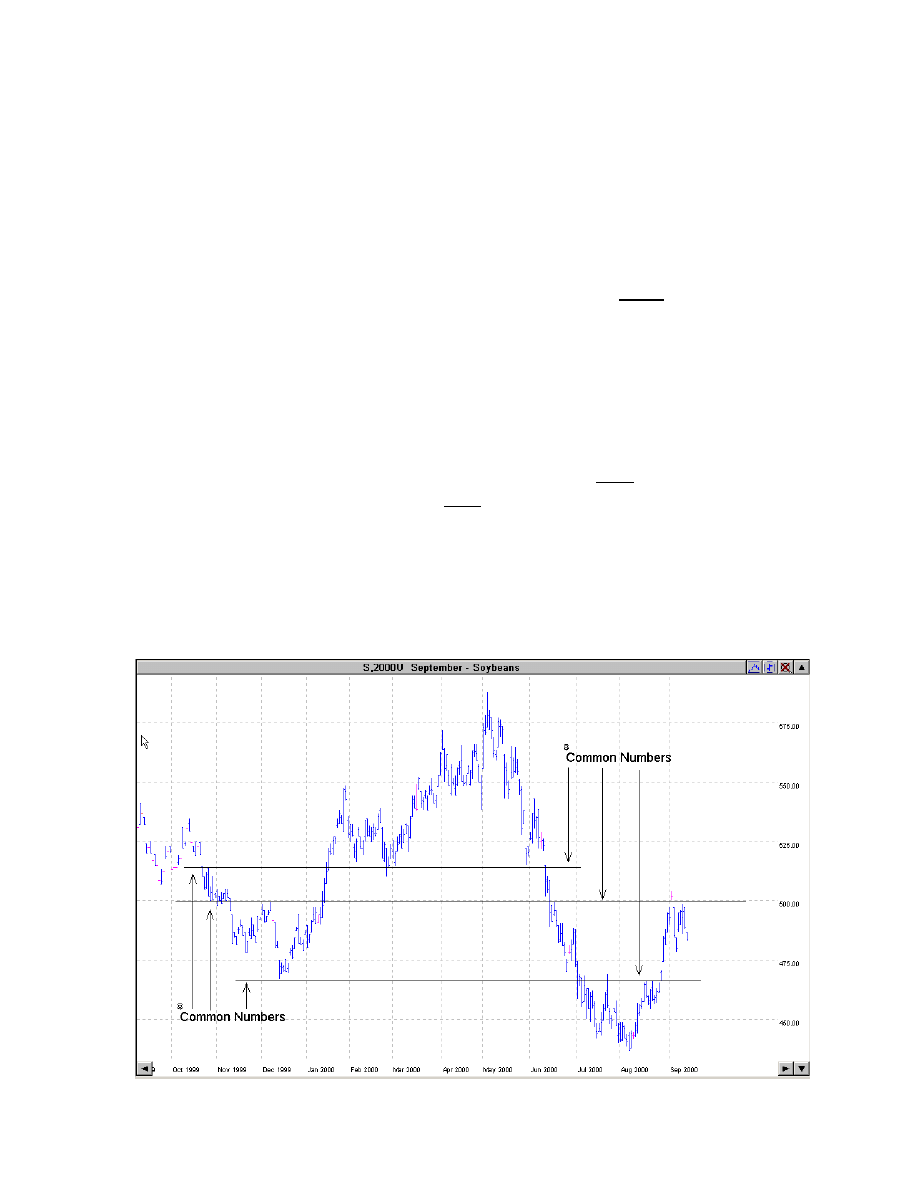
Lesson Three_______________________________________________
Common $ense Commodities - All rights Reserved 1998 - 2003
62
Everyone who was buying is now looking at it like they made a mistake, and
they want to get out of their long positions by selling their contracts. The
shorts, on the other hand, wish they had not bailed out, and want to go short
again, or at least add to their positions if they did not get out already.
This “yo-yo” effect is what keeps prices hovering around the trendline so
much of the time. So keep in mind, when a trend is deeply penetrated, it took
a lot of energy to do it. This is one of the reasons that the third time the
trend is broken is usually a really good indicator that the trend has changed
direction.
The Common Number or “CN”
Many times there will be a major common number, or a “CN,” on a chart.
What I mean is, there is a specific price that will show both support and
resistance during the contract over a long period of time. This is a very
powerful indicator. Many times, the 50% level (you will learn about this
next) becomes a CN.
When looking at any chart, be sure to watch for CNs. It’s a very good place
to place your order and/or your stops.

_________________________________________________ Lesson Three
Common $ense Commodities - All rights Reserved 1998-2003
63
Think about it for a moment. I bet you have already figured out several ways
that you can use the CN to place trades. Remember, we talked about buying
on support and selling on resistance. That’s really all we are doing here,
except that the CN is a very powerful level of both support and resistance.
When looking for the CN, be sure to check the CN on the weekly and
monthly charts too, as they are even stronger indicators than the daily
chart.
Go back to charts in the previous lessons and see if you can find some of
these CNs. How accurate would they have been as indicators?
Later in the course, you will learn how to use these CNs in placing your
trades. Right now, just understand they happen quite often.
The Even Number Phenomenon
For some reason, prices tend to find major support and resistance at even
numbers. Many times the price will rally or decline, and stop at an exact
even number. Many times it will be a multiple of 10: like 10, 20, 50, 100,
150, etc.
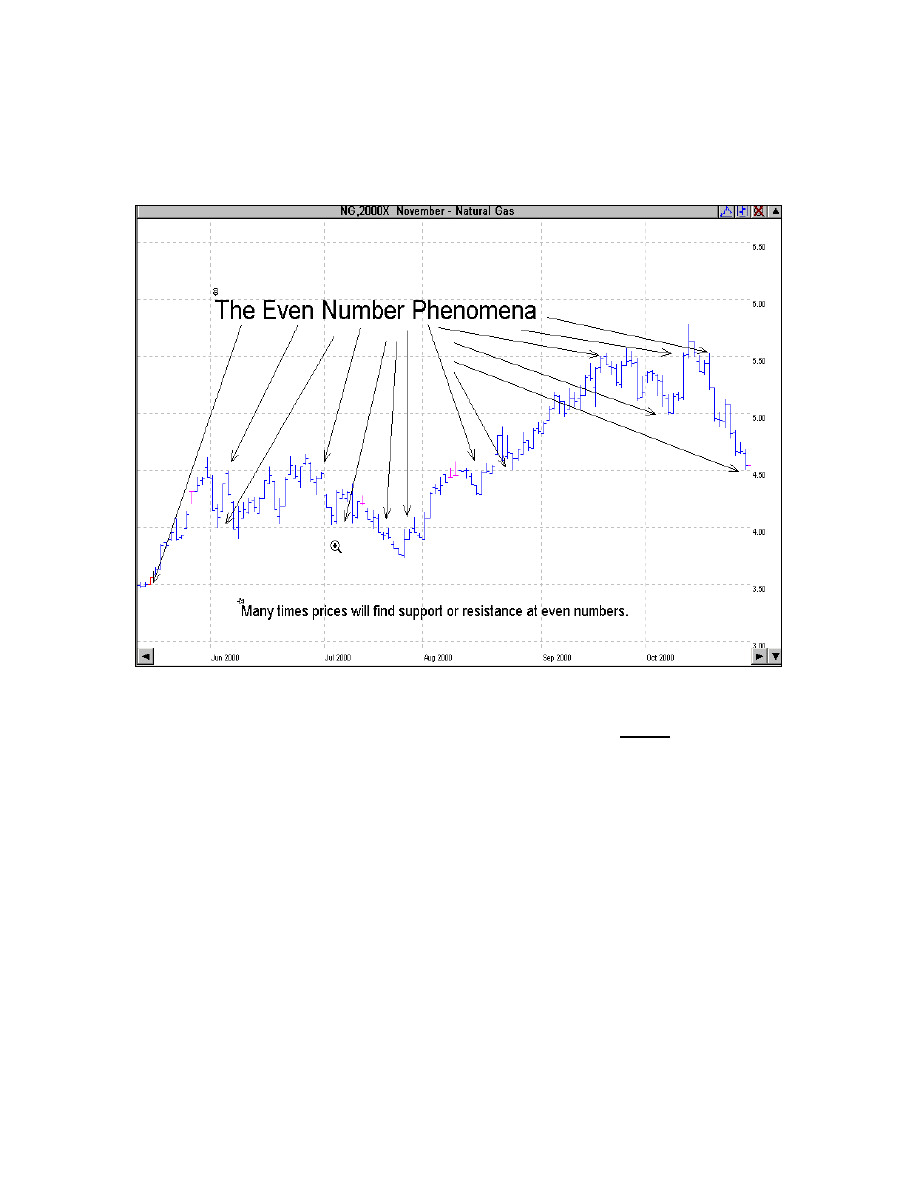
Lesson Three_______________________________________________
Common $ense Commodities - All rights Reserved 1998 - 2003
64
I’m not sure why this actually happens. I’ve just noticed it many times on
charts. Go back to your own charts and see for yourself. Look at the
following chart.
The question is, how do you use this to better your trades? There are several
ways to do this. One is in placing your stops. You should never place a stop
at an exact even number. You should place it just below an even number if
you are long, or just above an even number if you are short, especially if that
even number is a multiple of 10.
The reason you don’t want your stops at an even number is that many times
the price will come up and touch this even number, stop you out, and then
head back in the same direction. Also, by their very nature, even numbers
tend to be an exact support or resistance level more often than odd numbers.
Another way is to look at them is for profit or exit targets. Think about it for
a few minutes and I’m sure you will find other ways to use them. A simple
way to remember this is to always “be odd” when placing your stops.
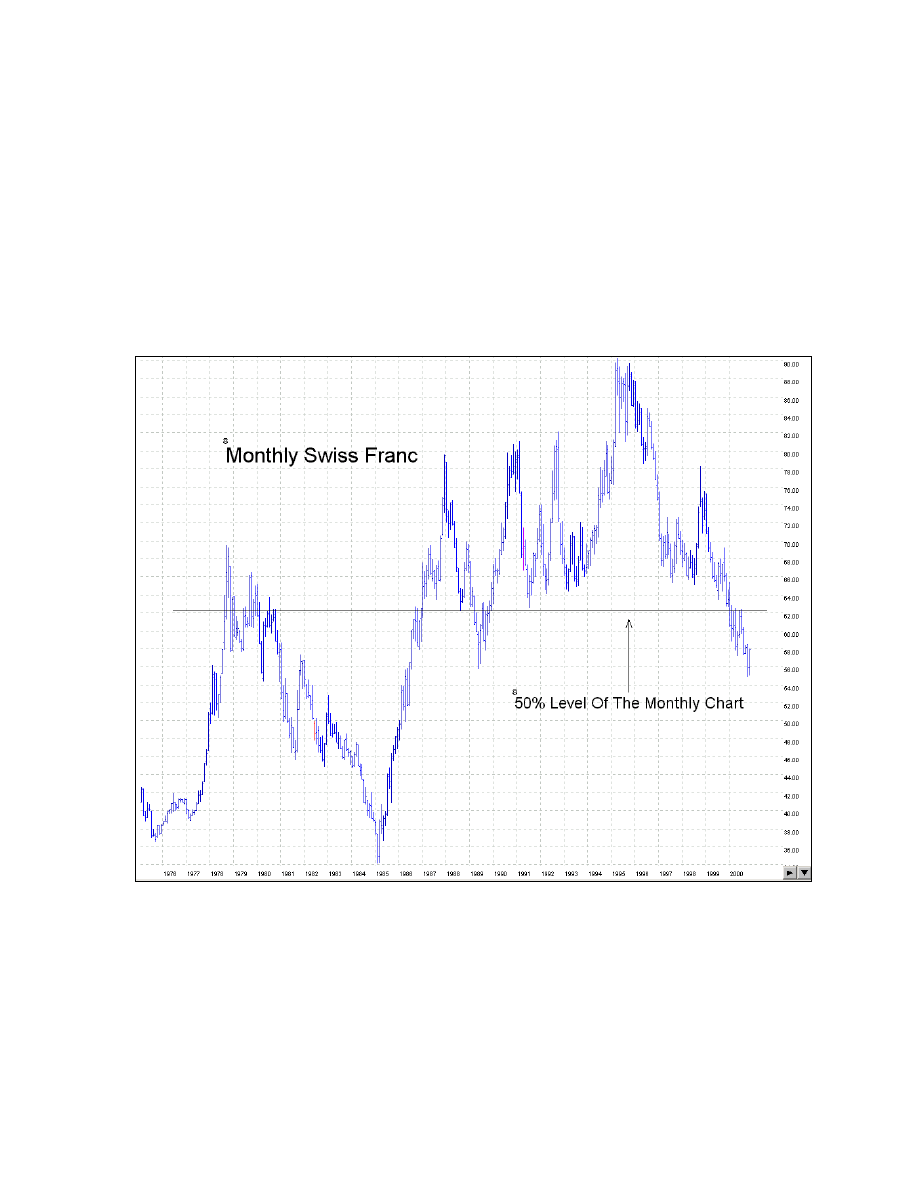
_________________________________________________ Lesson Three
Common $ense Commodities - All rights Reserved 1998-2003
65
Heading Home - The 50% Levels
The 50% level is simply the average price that was paid during a specific
time frame, and it’s simple to calculate. I call this price “home.”
To start, let’s calculate a 50% level on a monthly chart on the Swiss Franc.
This particular chart reflects the prices paid over the last 25 years. You can
see the lowest price paid was in 1985 (34.00), and the highest price paid was
in 1996 (90.00).
It’s simple to find the 50% level. Just add the highest price together with the
lowest price, and divide by two. The low of 34 plus the high of 90 equals
124, divided by 2 equals 62. So the 50% level of the Monthly Swiss Franc is
62.00.

Lesson Three_______________________________________________
Common $ense Commodities - All rights Reserved 1998 - 2003
66
This calculation does not have to be exact, as we are just trying to get a good
idea of where prices have been and where they may go in the future.
All prices will do a 50% retracement of their last major move. We just
don’t know how long it will take for that 50% retracement to take place.
What this means is that the price should turn around, or reverse its trend, and
then head back up or back down, and meet or exceed the 50% level. Notice
that the previous chart shows prices hovering around the 50% level on
several occasions.
We can easily figure the 50% level and use it to our advantage. We can
figure the 50% level on monthly, weekly, and daily charts. For long-term
trades, I always figure the 50% level on the monthly chart first. This is
where prices will eventually head. It may take months, or in some cases
years, to get there, but it will always head there. It’s just a matter of time.
Next, I figure the 50% level of the weekly chart, then the 50% level of the
daily chart. I then plan all my long-term trades using these 50% levels as
profit targets. Then I mark those points on my daily chart. Now, let’s
calculate the 50% level of the weekly chart.
The highest price paid was 91.00 in 1995, and the lowest price paid was
56.00 in November 2000. We figure it the same way we did on the monthly
chart: 91 plus 56 equals 147, divided by 2 equals 73.50. So 73.50 is the
50% level of the Weekly Swiss Franc.
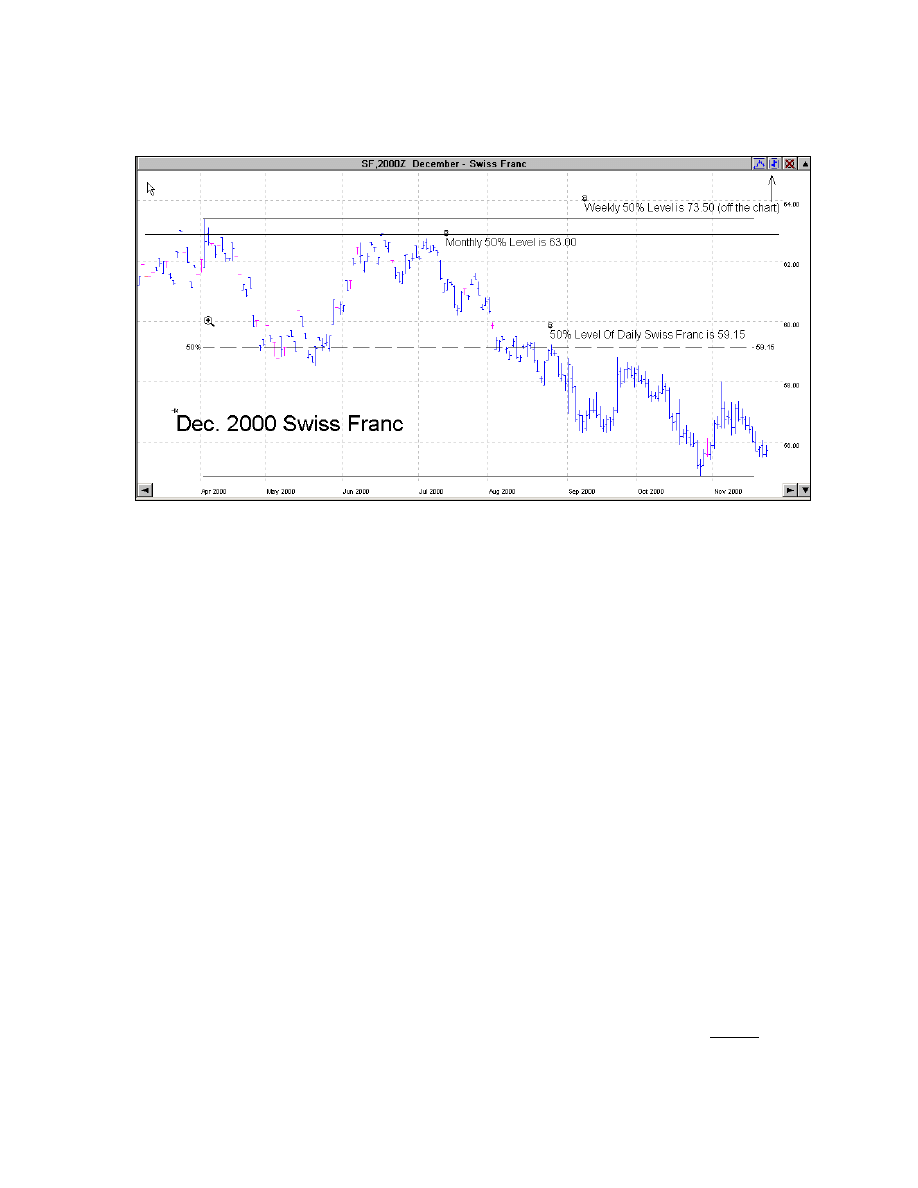
_________________________________________________ Lesson Three
Common $ense Commodities - All rights Reserved 1998-2003
67
Finally, let’s do the 50% level of the daily chart below.
Without knowing anything else, it’s not hard to see that prices are at record
lows on this chart. It’s only a matter of time before they head back up and do
a Retracement of 50% or more.
At some time, prices will do a 50% Retracement of the daily, then the
weekly, and then monthly charts, but not always in that order. On the
previous chart of the Swiss Franc, they would have to make a 50%
Retracement of the daily, then the monthly, and lastly, the weekly.
As you might guess, the key is to know when the price is going to turn
around and head back towards the 50% level, so that you can take advantage
of it.
That’s the tricky part, but I’m going to show you later how to predict when
this “reversal” might take place, or at least when to be watching for it.
Internal 50%
Retracements
Just like on the monthly, weekly, and daily charts, you will find that prices
make a 50% Retracement within the short-term as well. How can you profit
from this knowledge? Simple. By figuring the 50% level of the last major
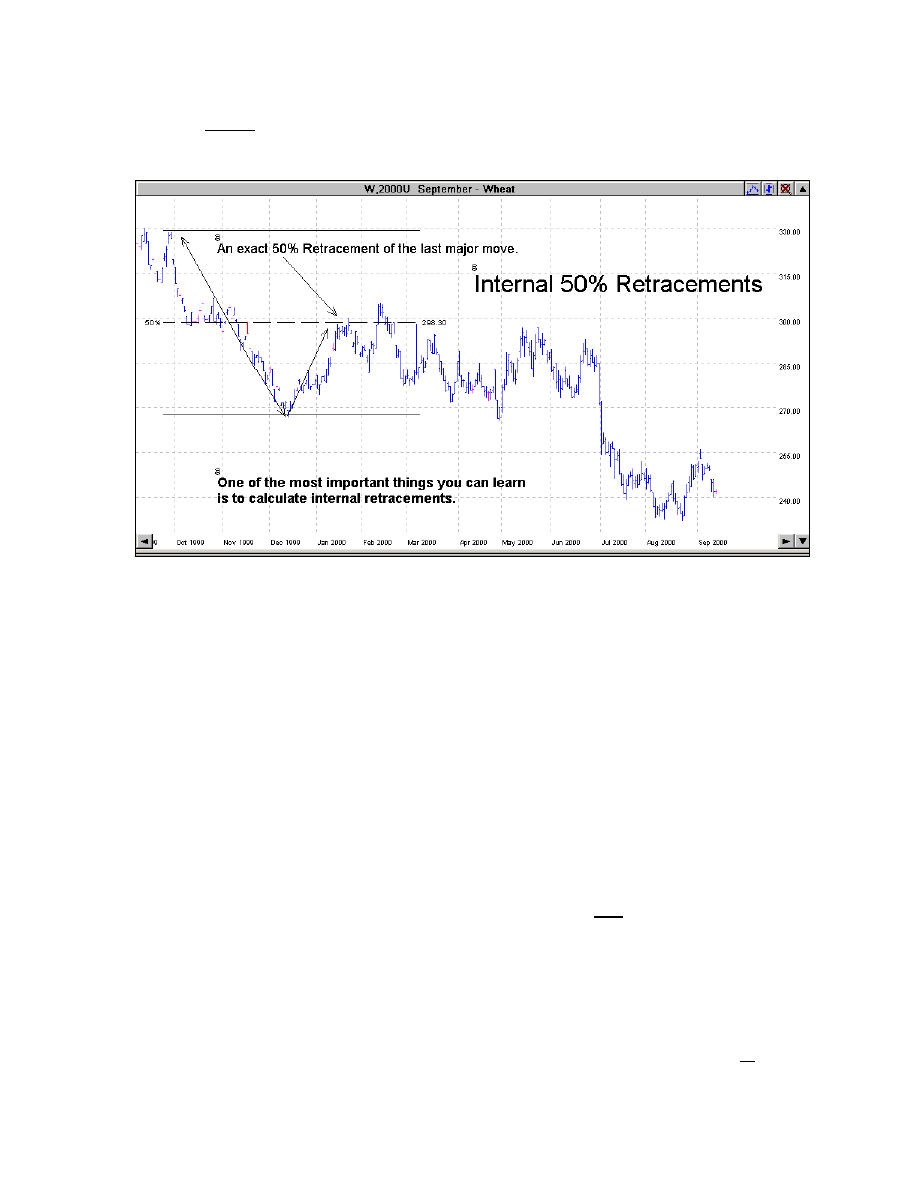
Lesson Three_______________________________________________
Common $ense Commodities - All rights Reserved 1998 - 2003
68
and last minor price moves, you can predict where the current price should
head.
Let’s look at the previous chart to see how these 50% internal retracements
work, and then I’ll show you how to profit from them.
As you can see on the previous chart, the price of Sept 2000 Wheat had a
major price move between October and December, from 330 down to 270. I
drew an arrow for you so you can see it more easily. The important thing
to understand is that almost all major and minor price moves make at
least a 50% retracement. I’ll show you what I mean.
The move on the previous chart, between October and December, made an
internal 50% Retracement—exactly 50% (back up to 300), as you can see.
You will soon discover that 50% Retracements happen all the time, whether
it is a major move, like a monthly or weekly 50% level, or a less major
move, like in the above chart. Retracements that are not from a contract
high to a contract low are called internal Retracements.
I’m going to show you the same chart as above, September 2000 Wheat, in
several different views. I want you to notice how many times these internal
50% Retracements take place. Many times they will make more than a 50%
Retracement. The point to remember is that most of the time they make at
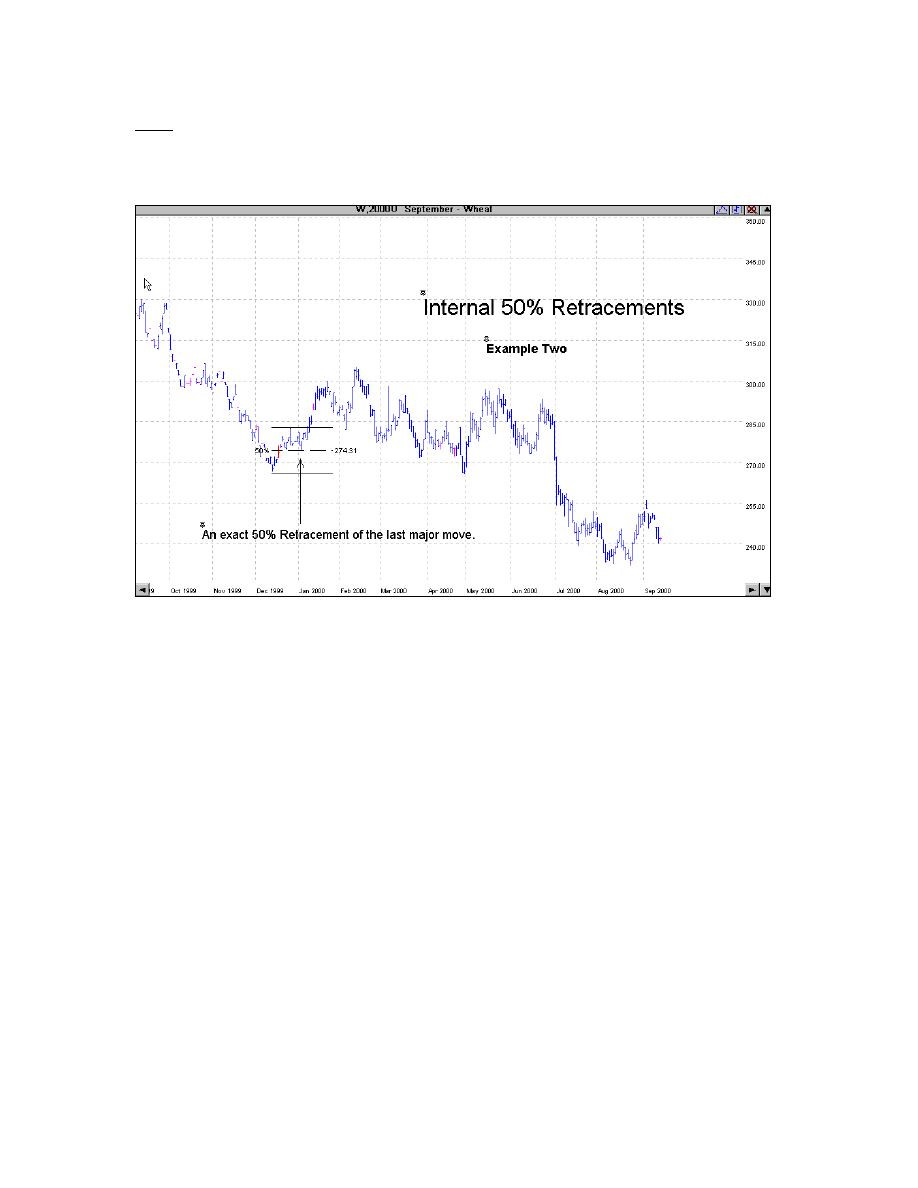
_________________________________________________ Lesson Three
Common $ense Commodities - All rights Reserved 1998-2003
69
least a 50% retracement before turning back around again. We will study
more on the different areas of price movement when we discuss Fibonacci
later in the course.
Let’s look at another example of the same chart below. This concept is
important to understand. I will show you how to take advantage of it later.
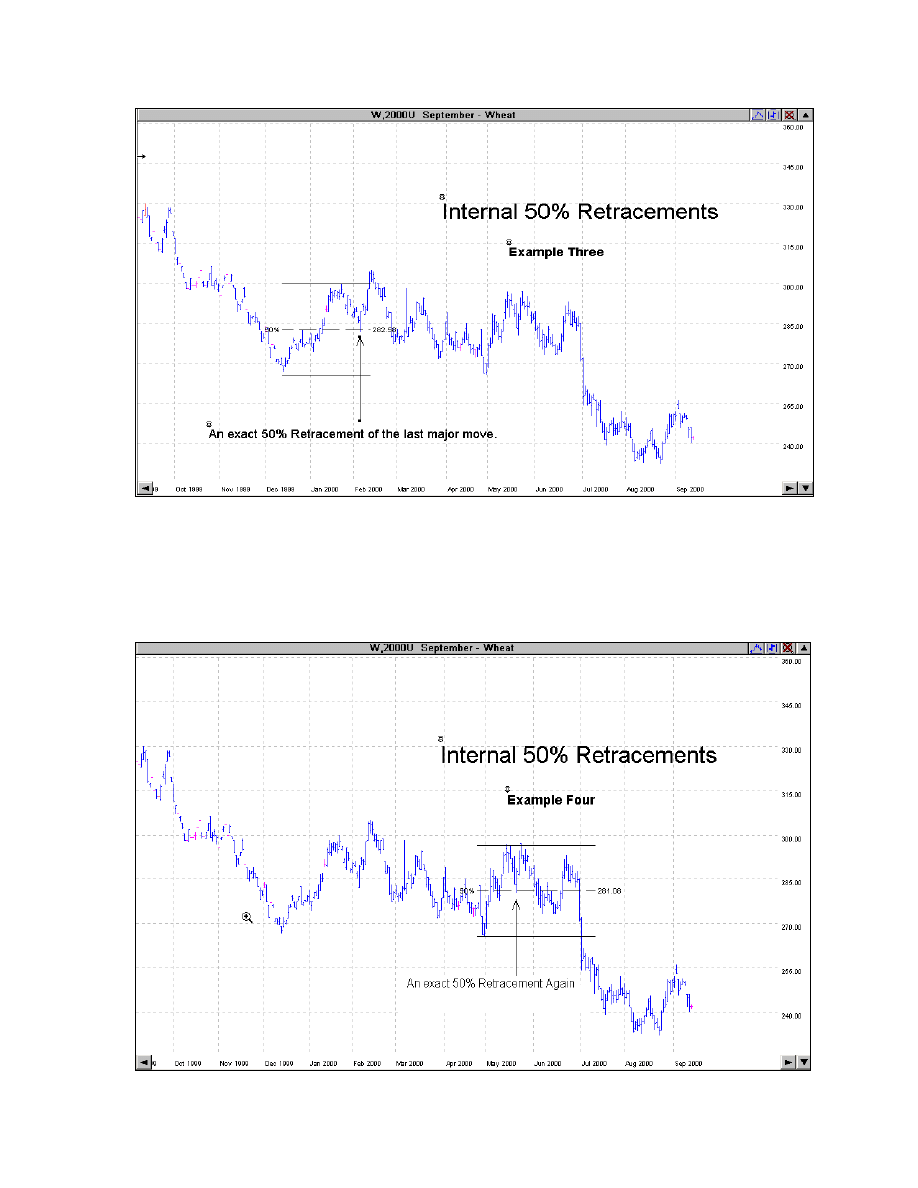
Lesson Three_______________________________________________
Common $ense Commodities - All rights Reserved 1998 - 2003
70
Do you see another retracement on the following chart? This time it did
make a 50% retracement, and then some. Actually, it made a 62% and a
76% retracement on the nose. We will get into this in much detail in our
study of Fibonacci Numbers in a later lesson.
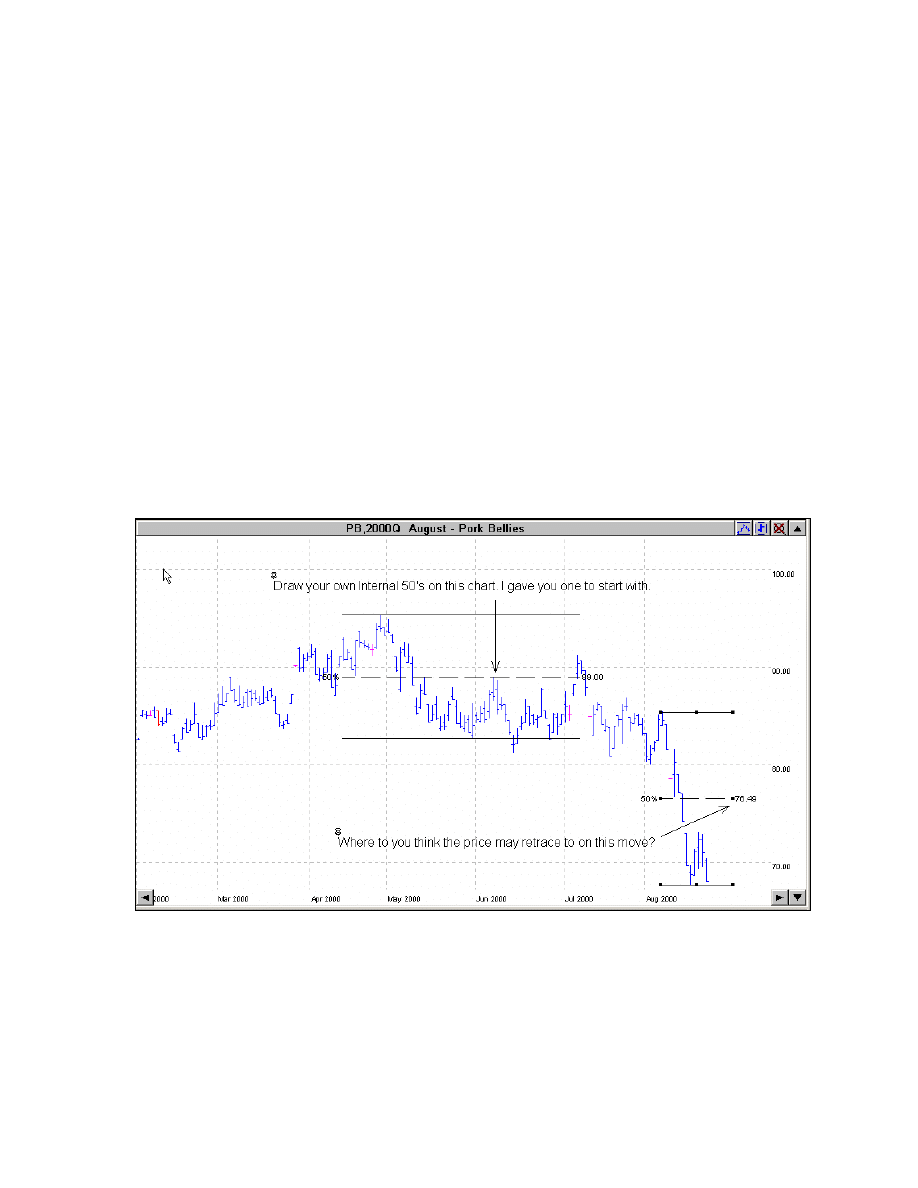
_________________________________________________ Lesson Three
Common $ense Commodities - All rights Reserved 1998-2003
71
Are you starting to catch on to how important these 50% internal
retracements are? If not, don’t worry about it too much right now. We will
discuss it again in more detail later in the course. Right now, just be aware of
them.
On the following chart I would like you to draw out some internal 50%
retracements that have already taken place. Then, on the last major move
that took place, do you think it might also make a 50%, or more, internal
retracement? Get use to drawing these out on the charts. By the way,
Gecko Charts does this for you. Just select the 50% tool and drag it
from the high to the low, and presto—you’ve got the exact 50% level
drawn for you!
If you are serious about trading or learning to trade, an investment in Gecko
Charts will pay you back many times over. There is a link on my Website to
order the software at a discount.
Trading Ranges
Many times the price will not be in a long-term trend. The price will move
up and down between specific support and resistance levels. A trading range
is a horizontal “channel” that contains the price for an extended period of

Lesson Three_______________________________________________
Common $ense Commodities - All rights Reserved 1998 - 2003
72
time. Most of the time, prices tend to spend their lives within a trading
range. Trading ranges are difficult for a new person to trade, and a good rule
of thumb is not to trade within a trading range unless you are day-trading or
very short-term trading. We’ll also talk more about that later.
For most new traders, it’s best to wait until the price breaks out of this range
and then enter a trade. The top of the range is its resistance level, and the
bottom of the range is its support level. Once the price breaks out of this
trading range, it is usually a good indication that it will continue in that
direction, at least for a time.
Let’s look at the following daily chart of July 2000 Orange Juice to see what
a trading range looks like.
On the above chart, the top of this range is 85.00, and the bottom of the
range is just above 80.00. Also notice that the price has been in this range for
almost three months.
The key to trading a range like this is to be prepared for a breakout.
You always want to be prepared for a “false breakout,” which is when the
price breaks out of a trading range and then jumps right back into the range
again. A safeguard, is to never trade the first day that it breaks out of the
trading range. I always suggest you wait until the second or third day

_________________________________________________ Lesson Three
Common $ense Commodities - All rights Reserved 1998-2003
73
before placing an order. This way, you’re more assured that it’s a true,
not a false, breakout. Remember too, it’s the closing price that you
should be looking at.
There is one thing to be aware of, and that is the length of time the market
has been within a certain range before you can call it a trading range. A
good rule of thumb that I use is 10 trading days, or periods, depending
on whether it’s a daily, weekly, or a monthly chart.
In the example above, you would have been long (bought a contract) when
the breakout to the top occurred, and you could have placed your stop just
below the bottom of the trading range, depending upon the reward/risk ratio.
You will learn a little later to calculate your reward/risk ratios on all your
trades.
As you can see, the width of this trading range is about 5 cents, and each 1-
cent move in Orange Juice is $150 in profits. So the width in dollars is about
$750, which is the amount you risk if you place your stop just below the
range and enter the market just above the range. Later in the course, you will
learn some other methods to reduce your risk even more.
Channels In General
There are several types of channels, and I love them all! They are some of
the most reliable formations you will find on any chart. They don’t happen
often, so you won’t get to trade them much, but when you do, you’ll learn to
love them like I do.
The difference in channels and trading ranges are that trading ranges
tend to be wider in price than channels, although channels are in
themselves a narrow trading range. Also, channels can ascend and
descend, whereas trading ranges go across the charts between two high and
low prices. You will want to trade channels like you would trade trading
ranges, as far as putting in your stops and your orders.
Narrow Sideways Channels
There are only three directions that prices can go. I’m sure you know two of
them: up or down, right? But how about sideways? That’s right! Sideways.
Let’s look at the following chart.
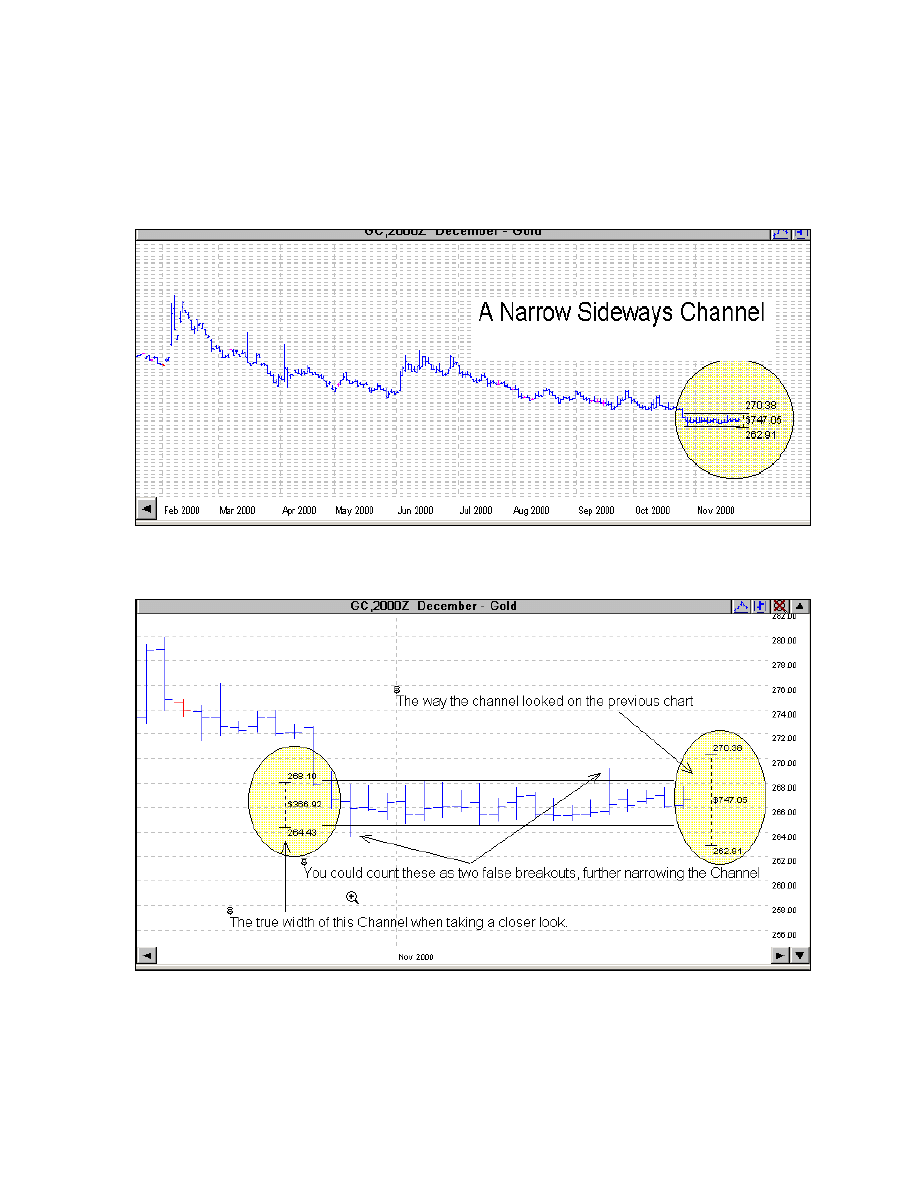
Lesson Three_______________________________________________
Common $ense Commodities - All rights Reserved 1998 - 2003
74
I have included two charts on December Gold 2000. The first chart shows
you a longer time frame so that you can see just how narrow the channel
really is. The second chart of the same contract is enlarged so that you can
see the channel prices a little better.
The following chart is also of December Gold 2000. It’s just enlarged.
One of my favorite features of Gecko Charts 2000 is that you can enlarge the
charts like I did above. If you were not able to really “see” the width of this

_________________________________________________ Lesson Three
Common $ense Commodities - All rights Reserved 1998-2003
75
channel (like on paper charts), you could be placing your orders and your
stops too far apart, therefore increasing your risk needlessly.
When trading a channel, you would place your order to buy (go long) on a
breakout to the top of the channel, and an order to sell (go short) on a
breakout to the bottom of the channel. You could put your stop on the
opposite side of the channel from your order. If you were long, your stop
would be just under the bottom of the channel; and if you were short, your
stop would be just above the top of the channel.
On this particular channel, your risk would be about $366 plus commissions.
For Gold, this is a very small risk. Gold usually trades in a much wider range
than this. Like I said, channels don’t happen often.
Keep in mind that you never want to trade the first day of the breakout, since
many times it will be a false breakout. Wait at least two days, if not three
days, before entering the market. Notice the two false breakouts on the
previous enlarged chart. By waiting for a day or two, you would have saved
yourself from a bad trade, because the price jumped back into the channel.
When you place open orders, this means that they are just “sitting there”
waiting to be filled. Most of the time, I will use alerts rather than open
orders. An alert is just as the name implies—it alerts you when something
happens. To use alerts, you would call your broker (most are set up to do
this) and ask him/her to alert you when the price of Gold (in this example)
goes above 268.20 (the top of the channel) or when it goes below 264.50
(the bottom of the channel). This way you can watch it more closely and get
ready for a trade. Of course if you have Gecko Charts, you can draw this out
on your own chart, just like I did here, and you can watch it every day
yourself.
Keep this in mind—if it looks like a channel, it probably is a channel.
Sometimes, it’s hard to tell the difference between a trading range and a
narrow sideways channel. Really, the only difference is the width of the
formation.
On the following chart of July 2000 Sugar, I have drawn out three
formations for you. One is an obvious trading range, one is an obvious
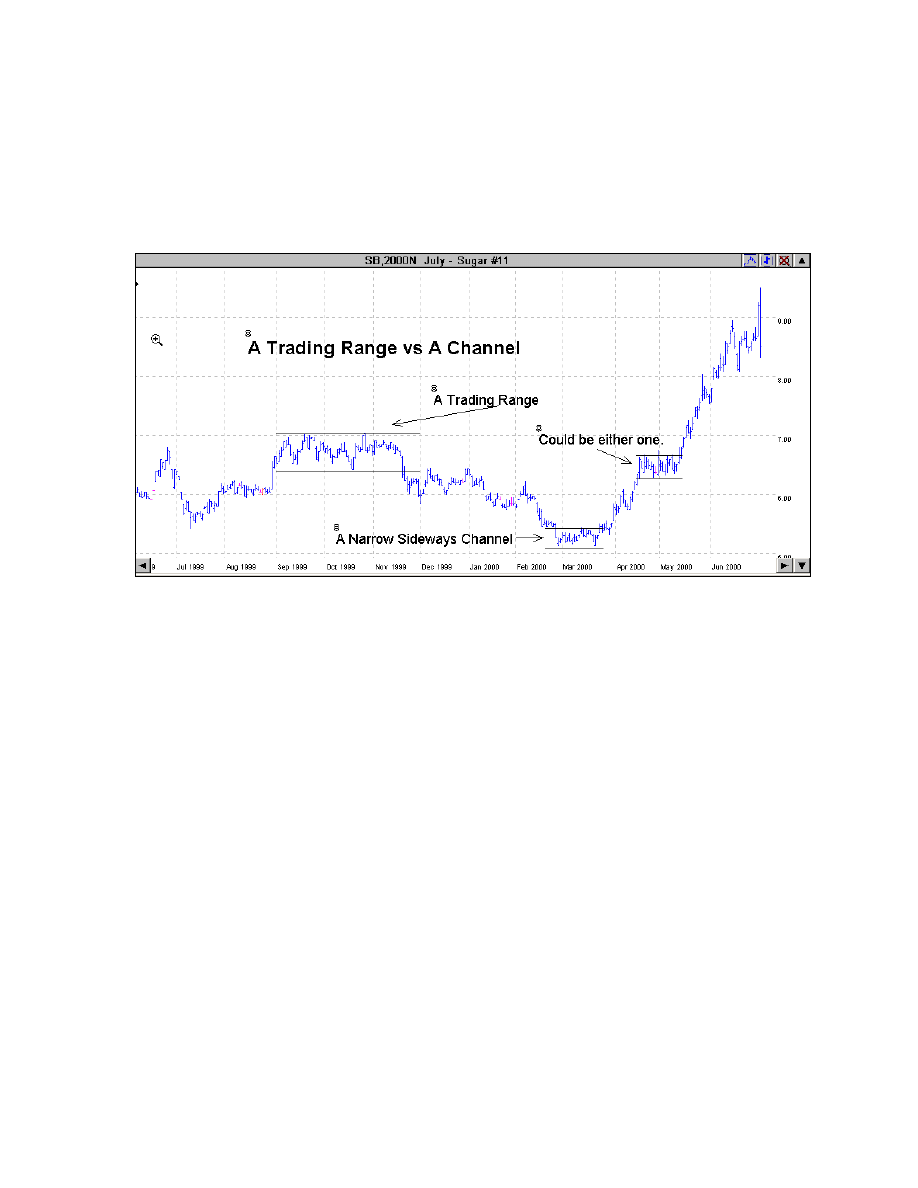
Lesson Three_______________________________________________
Common $ense Commodities - All rights Reserved 1998 - 2003
76
narrow sideways channel, while the other one could be either. Remember,
it’s an art, not a science.
Do you see another trading range on the following chart? How about
another narrow sideways channel?
Ascending and Descending Channels
Ascending and descending channels look like narrow sideways channels, but
can be wider in price and, of course, they are either ascending or descending.
At some time the price will break out of this channel. When it does, you
want to be long if it breaks out to the top, and short if it breaks out to the
bottom of the channel.
Just like in narrow sideways channels, wait one or two days after the
breakout to make sure it’s not a false breakout. The small amount of money
that you sometimes lose by waiting will be made back many times over by
the amount of money you save by not jumping into bad trades early.
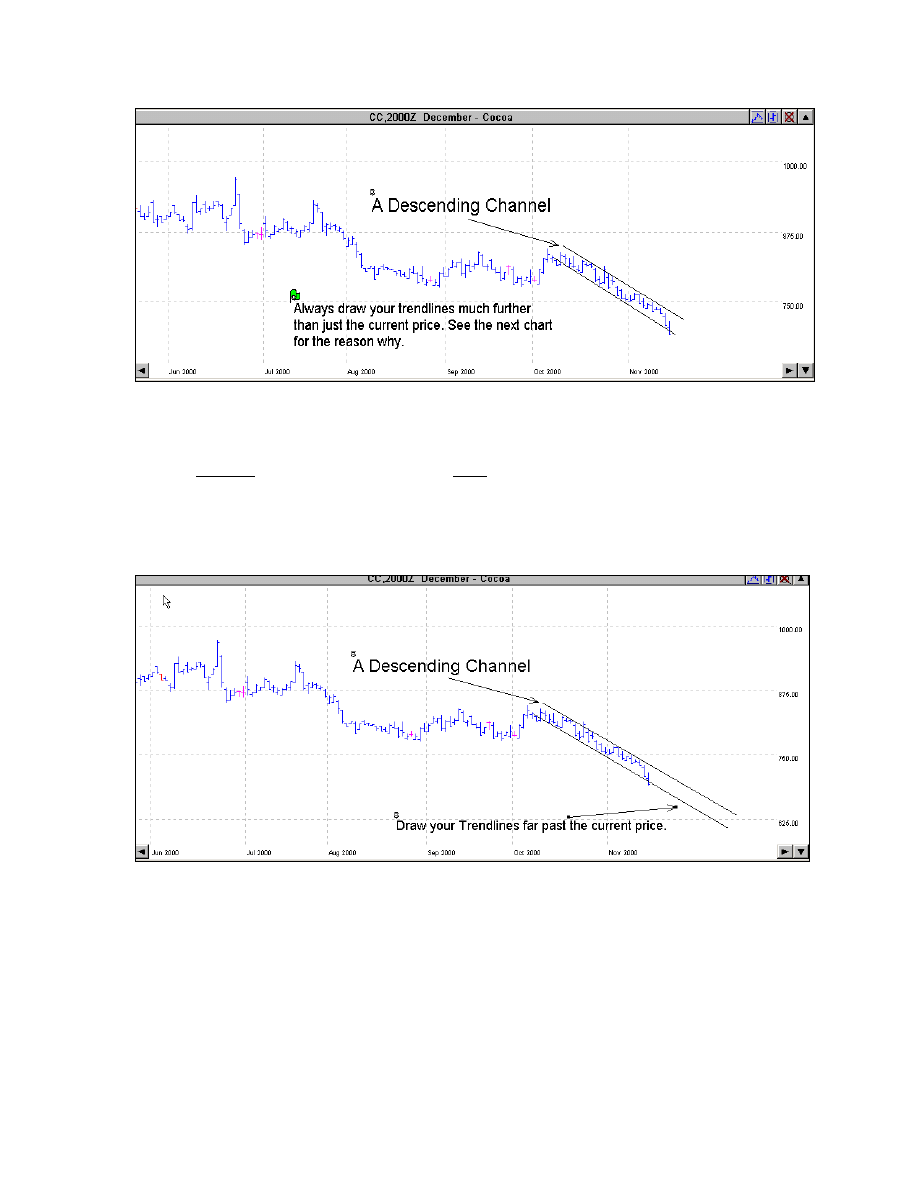
_________________________________________________ Lesson Three
Common $ense Commodities - All rights Reserved 1998-2003
77
When I first started learning to draw trend lines, I would not draw them past
the current price on the chart. I found this to be an error in judgment. You
should always draw the Trendline far past the current price. Notice on the
previous chart, I just drew the Trendline to the current daily price. On the
following chart, I drew the Trendline far past the current daily price. (Gecko
Charts are great at doing this, by the way.)
On the first chart, it looks like we may see a breakout to the downside. If
you had placed your order the first day of the breakout (the last day on the
above chart), we can see what would have happened by taking a look at the
next chart.
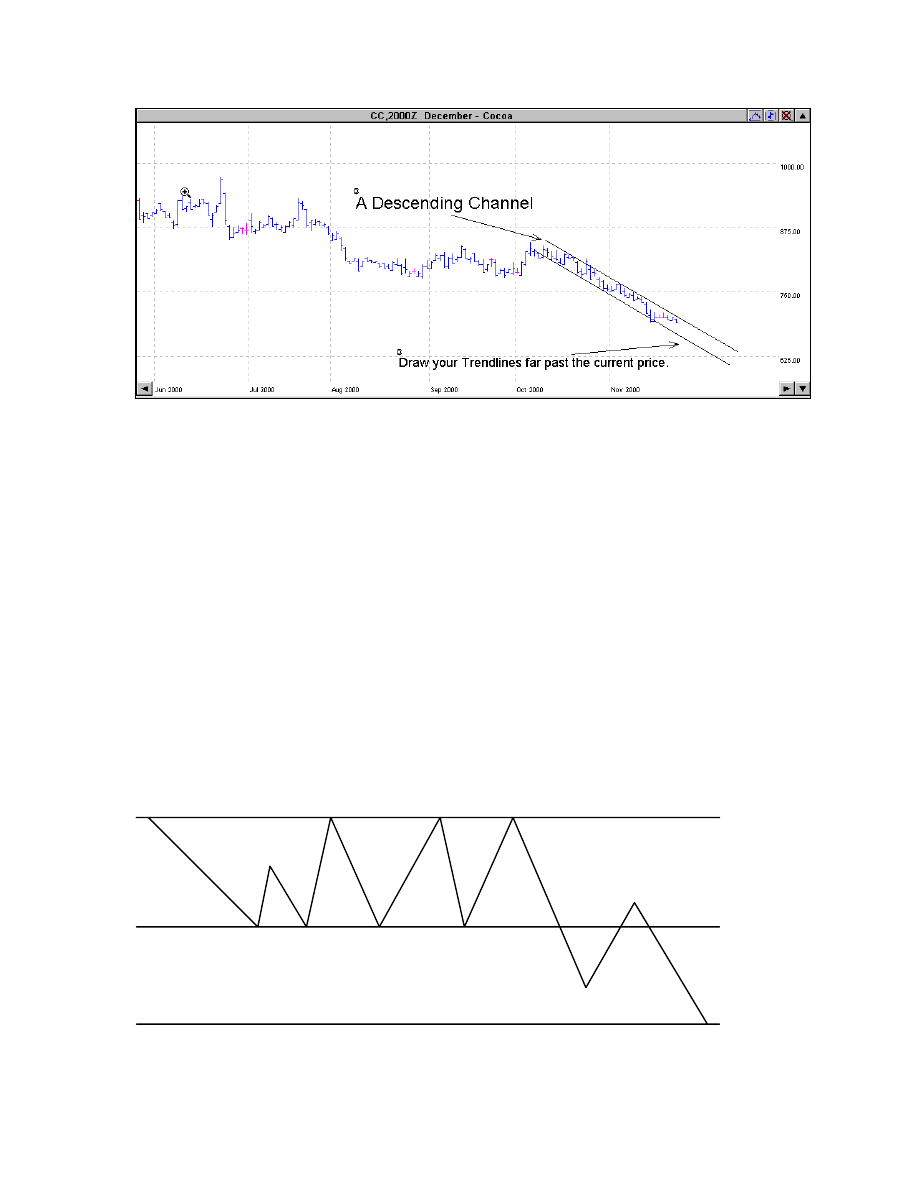
Lesson Three_______________________________________________
Common $ense Commodities - All rights Reserved 1998 - 2003
78
As you can see, the price went sideways and is still in the channel as of the
date of this writing. It will be interesting to see which way it goes when it
does breakout of this channel.
You would place an order to go long above the breakout and an order to go
short below the breakout. Your stops would be on the opposite side of the
channel in this example.
How Far Should Prices Move?
When the price finally breaks out of a sideways channel or a trading range, it
should continue the distance that is the width of the channel it just broke out
of.
Let’s look at the following diagram for a visual look at this rule.
150.00
140.00
130.00
Once The Breakout Occurs
The Price Should Travel
An Equal Distance Of The Channel
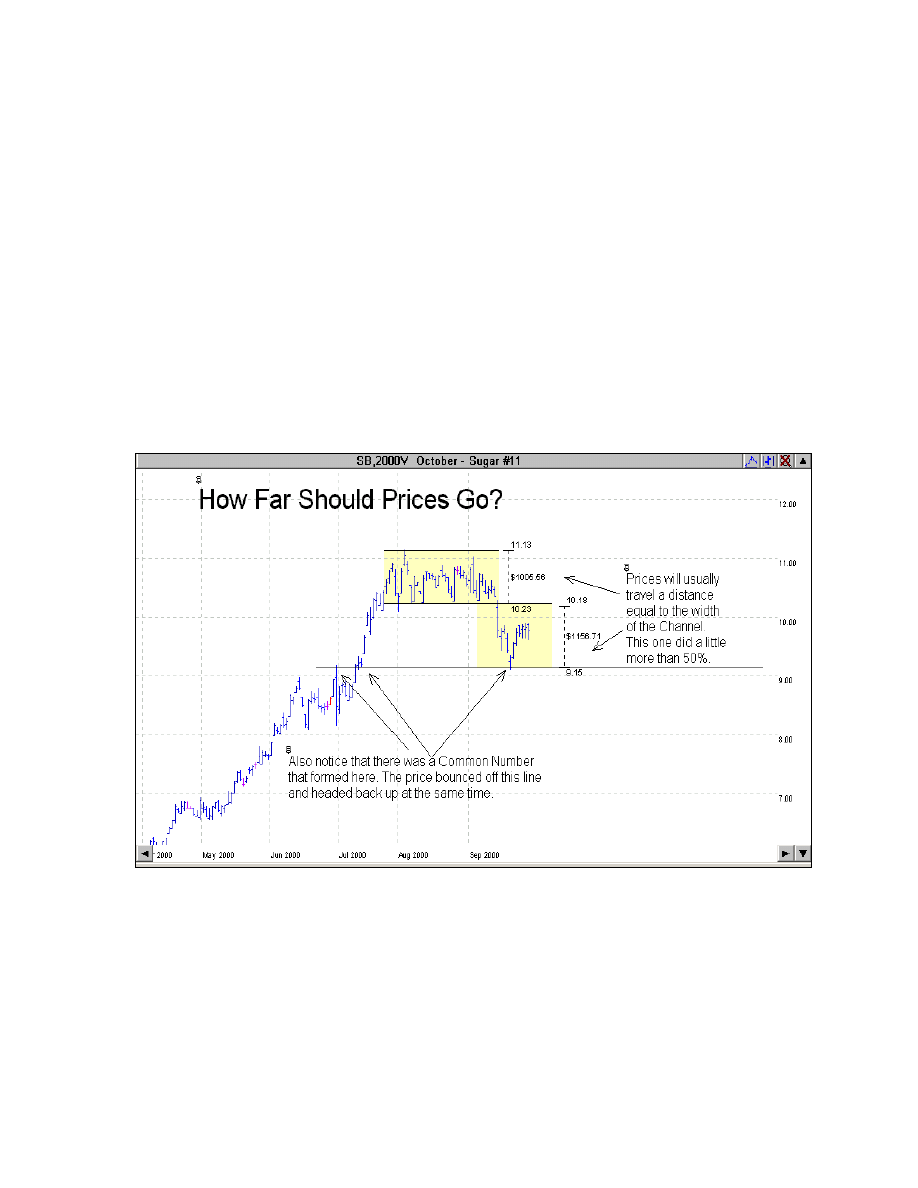
_________________________________________________ Lesson Three
Common $ense Commodities - All rights Reserved 1998-2003
79
Let’s also look at a perfect example on the following chart. Notice the
distance the price rallied once it broke out of this trading range. It is almost
exactly the width of the channel that it broke out of. You can use this rule to
anticipate where you might want to take profits, and if it goes past this point,
you can also consider adding another contract.
Another interesting factor to consider is that when the price did turn around
and head back up again after the breakout, it did so almost exactly at the
place a common number formed. Common numbers will act as both
support and resistance numbers on the same chart. I always draw out my
support and resistance lines as well as any common numbers I see on any
chart that I am studying. Again, Gecko Charts does a great job at this.
Knowing that the price should go at least as far as the width of the channel,
or trading range, that it just broke out of, how can you use this knowledge in
your trades? Think about this for a moment! How about using this price
point as a profit target, a place to add contracts (if the price breaks through),
or a place to reverse your position (if the price hits this point and bounces off
as it did in the chart above)?
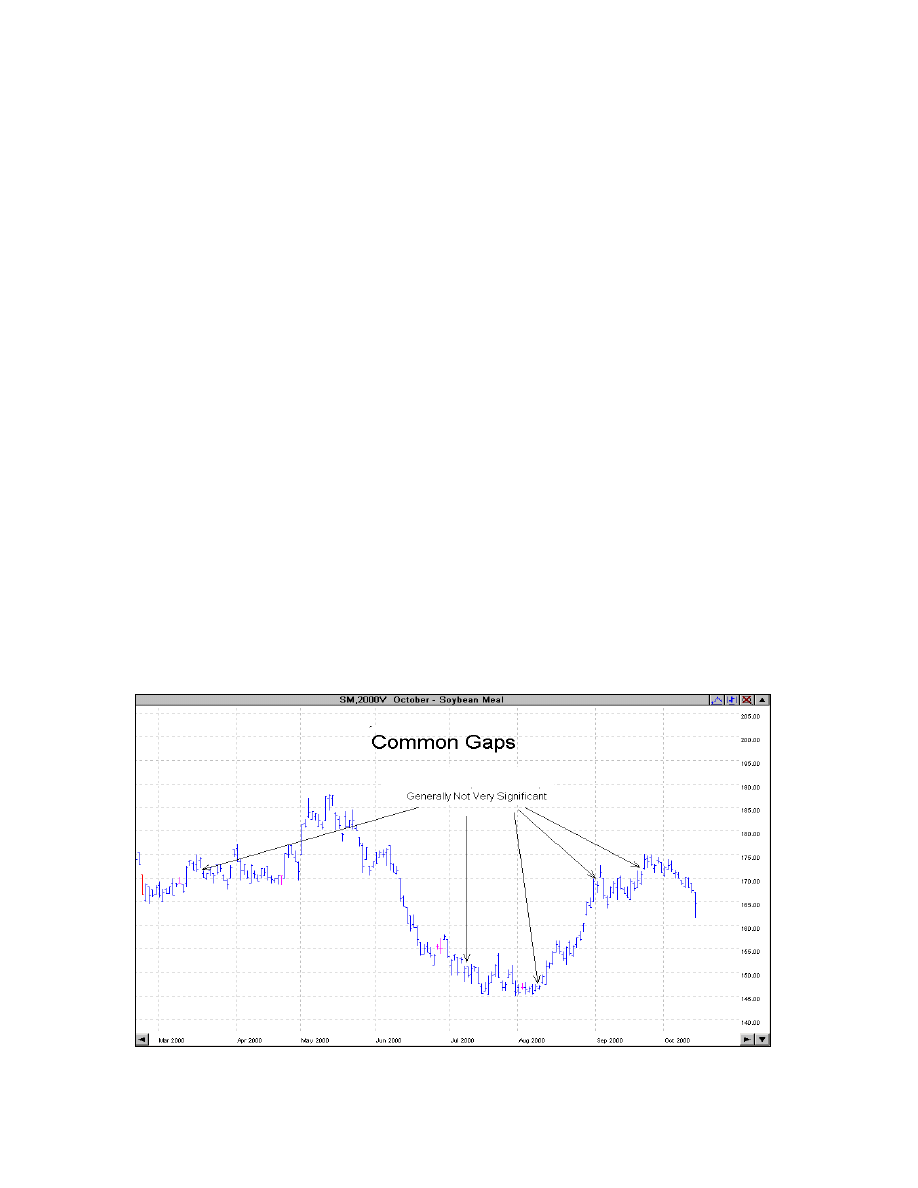
Lesson Three_______________________________________________
Common $ense Commodities - All rights Reserved 1998 - 2003
80
Gaps
There are four types of gaps. I’ll give you a short explanation and a chart of
each of them. Many people think that all gaps are filled. That’s not true.
Some gaps are not expected to fill, but many will. We will cover each one of
them.
Gaps are simply places on a chart that did not have a price action that day.
As an example, say the low today for Sugar was 9.00, and the next day it
opened at 8.00 and did not go above that. There would be a gap (space) in
the price that day of 1 cent, between 9 cents and 8 cents. Not complicated at
all.
You will find out that some types of gaps are important indicators, and
others are not important at all.
1. Common Gaps. These usually occur within a trading range and are not
indicative of a major price move. In other words, they are usually
insignificant.
Some people feel they occur because of a simple lack of interest in the
market that day. We will talk about looking at volume (the number of orders
placed that day) a little later.
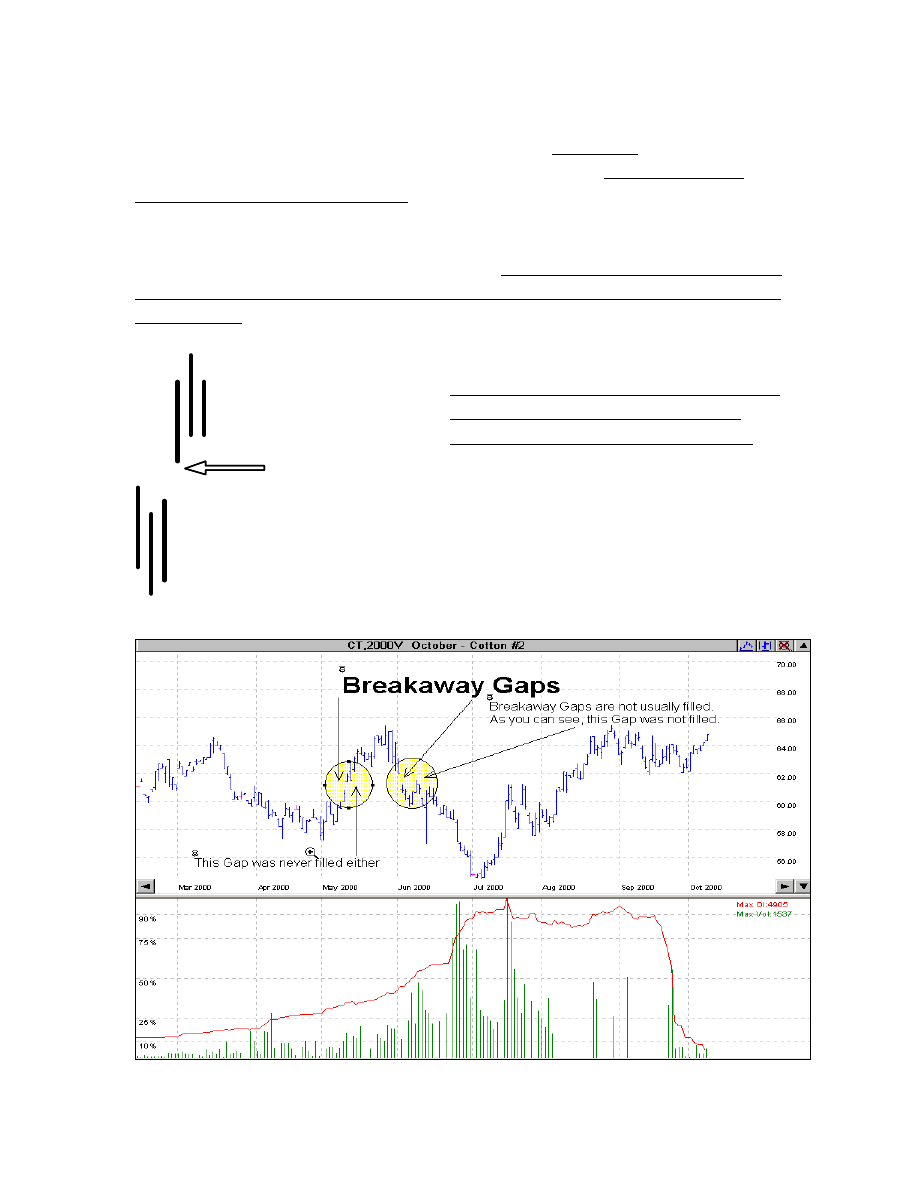
_________________________________________________ Lesson Three
Common $ense Commodities - All rights Reserved 1998-2003
81
2. Breakaway Gaps. A breakaway gap is an extremely reliable indicator.
These often occur when a particular price pattern completes. When they do
occur, they leave a space that has not been filled in yet. They are usually
indicative of a big market move.
Also, when these gaps occur, you will usually, but not always, see a
significant increase in the volume that day. Breakaway gaps are not expected
to be filled, and the heavier the volume the day it gaps, the less chance that it
will be filled.
On the occasions that a Breakaway gap
does fill, it’s a good sign that it’s a
false gap and the trend will not hold.
Look for the gap to become a support
or resistance area later, too. Let’s look
at the following diagram to get a better
idea of what this means.
Look for this area to
become a support
area if the price
reverses.
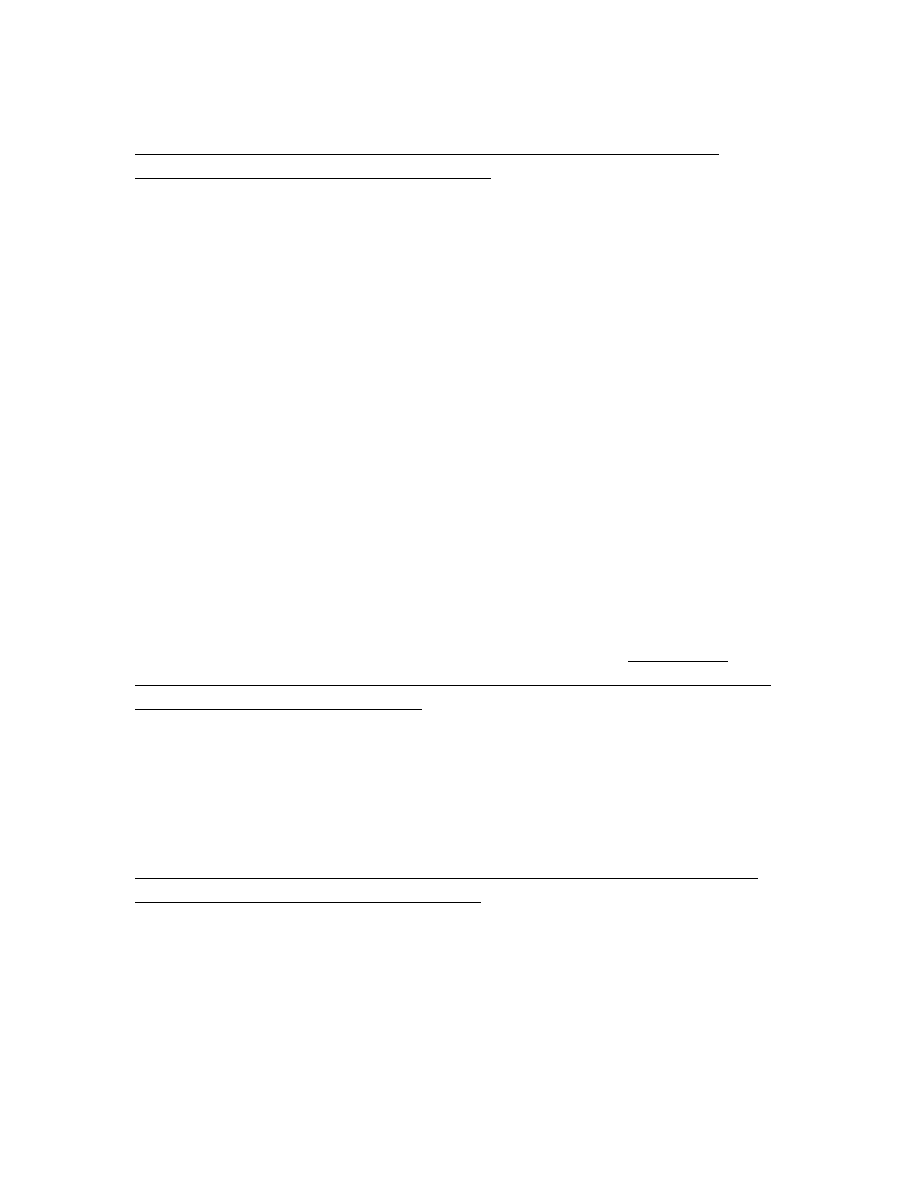
Lesson Three_______________________________________________
Common $ense Commodities - All rights Reserved 1998 - 2003
82
The vertical lines at the bottom of the previous chart reflect the volume.
Volume is always a day late on the charts. As an example, volume on
Tuesday reflects trading done on Monday. We will study volume in more
detail later in the course. Notice, the first breakaway gap did not have much
of an increase in volume, but the second one did.
The wavy line on the bottom section of the chart reflects the open interest on
this contract. Why do you think we see a big drop in open interest (the total
number of “open” contracts) starting in September in this contract?
Answer: because the contract is about ready to expire, and everyone is
probably trading the next contract month and not this one. So you should
also be looking to trade the next contract month, not this one. Pay close
attention to this when placing your orders. Make sure the contract has at
least 30 days before FND. Your broker can give you the exact dates.
Do you notice a nice trading range forming at the end of the chart? Do you
think the resistance at the top of this range is strong or weak? How many
times has the price come up to just above the current price, and headed back
down again? Do you see a potentia opportunity to short the market if the
price hits the top of this range and bounces off again? You should if you
don’t.
3. Runaway Gaps (sometimes called Measuring Gaps). These don’t
happen as often, but when they do, it usually indicates an accelerating trend
and a strong bull (or bear) market. Many times these gaps happen in limit-up
days, or limit-down days (the maximum amount they allow the price to
move, but some markets don’t have any limits), and may continue for
several days. Unlike other formations, it does not take large volume for them
to take place either on the upside or the downside. As a matter of fact, they
usually start on moderate volume.
Most of the time these gaps are not filled, but if they are, it's an indication
that the move has lost a lot of its strength.
The reason that these are sometimes referred to as measuring gaps are that
they will take place midway in a trend. So, if that’s the case, you can
“measure” the expected move. Since they often start in the middle of a trend,
when you see one you can expect the price to increase an equal distance
from the start of the most recent trend to the first runaway gap. In other

_________________________________________________ Lesson Three
Common $ense Commodities - All rights Reserved 1998-2003
83
words, when the move is over, the first gap will have occurred in the middle
of the trend.
4. Exhaustion Gaps. These occur when the price has been rallying or
declining over an extended period of time. Exhaustion gaps are not
indicative of a continued bull or bear market. As a matter of fact, sometimes
just the opposite happens and you will see a trend reversal. Be careful when
you see these, because you might think they are the start of a runaway gap.

Lesson Three_______________________________________________
Common $ense Commodities - All rights Reserved 1998 - 2003
84
Exhaustion gaps don’t happen that often, so don’t waste a lot of time looking
for them. To give you an example, I looked through all my charts for over an
hour to find two of them to show you.
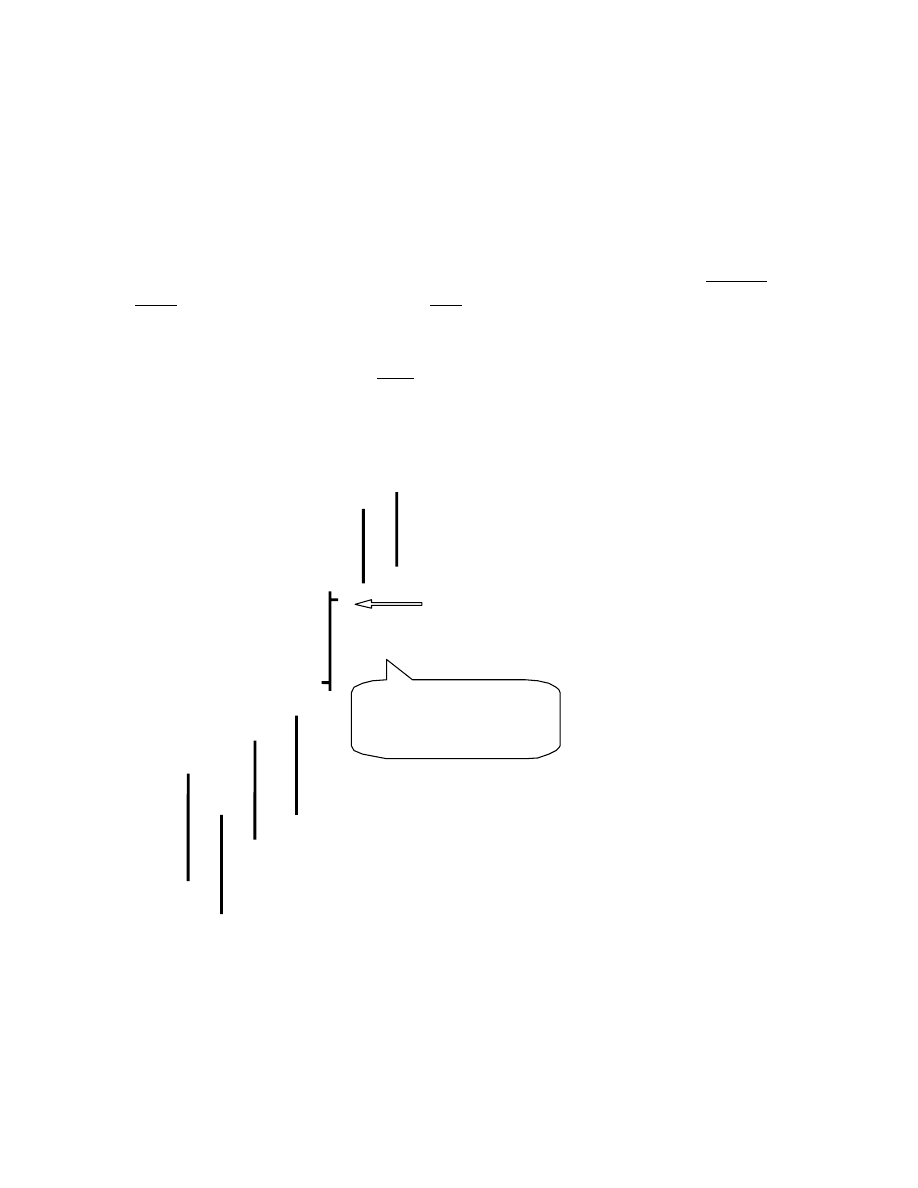
_________________________________________________ Lesson Three
Common $ense Commodities - All rights Reserved 1998-2003
85
Spikes
Spikes are wonderful indicators and I love watching for them. Everyday I
look at my charts to see if a spike occurred that day.
A high spike day is when the current day’s high is “way” above the high of
the previous day. When a high spike day occurs, look and see if the closing
price that day is within 25% of the low reached that day. If it is, most likely
you will have a price reversal the next day, and the prices will head back
down. The opposite is true of a low spike day, so look and see if the close of
the day is within 25% of the high reached that day. If it is, look for a price
reversal the next day and for the price to head back up.
Notice in the diagram below, where we had a high spike day, the trend did
not reverse.
An indicator that the
trend might continue
was that the closing
price on the spike day
was in the upper 25%
of the day’s trading
range. This indicates a
possible continuation of
the trend and not a
reversal.
If the price had closed
in the lower 25% of the
day’s trading range,
then you would look for
a possible trend reversal
to take place the
following day.
Spikes are easy to spot, and offer a good trading opportunity. Watch closely
for these formations to take place. In the following diagram, you will see a
high spike day that closed in the lower 25% of its trading range.
Watch Where
It Closes
For The Day
The close was near the high of
the spike.This could indicate a
coninuation of the trend
of a bull market.
It closed high
for the day
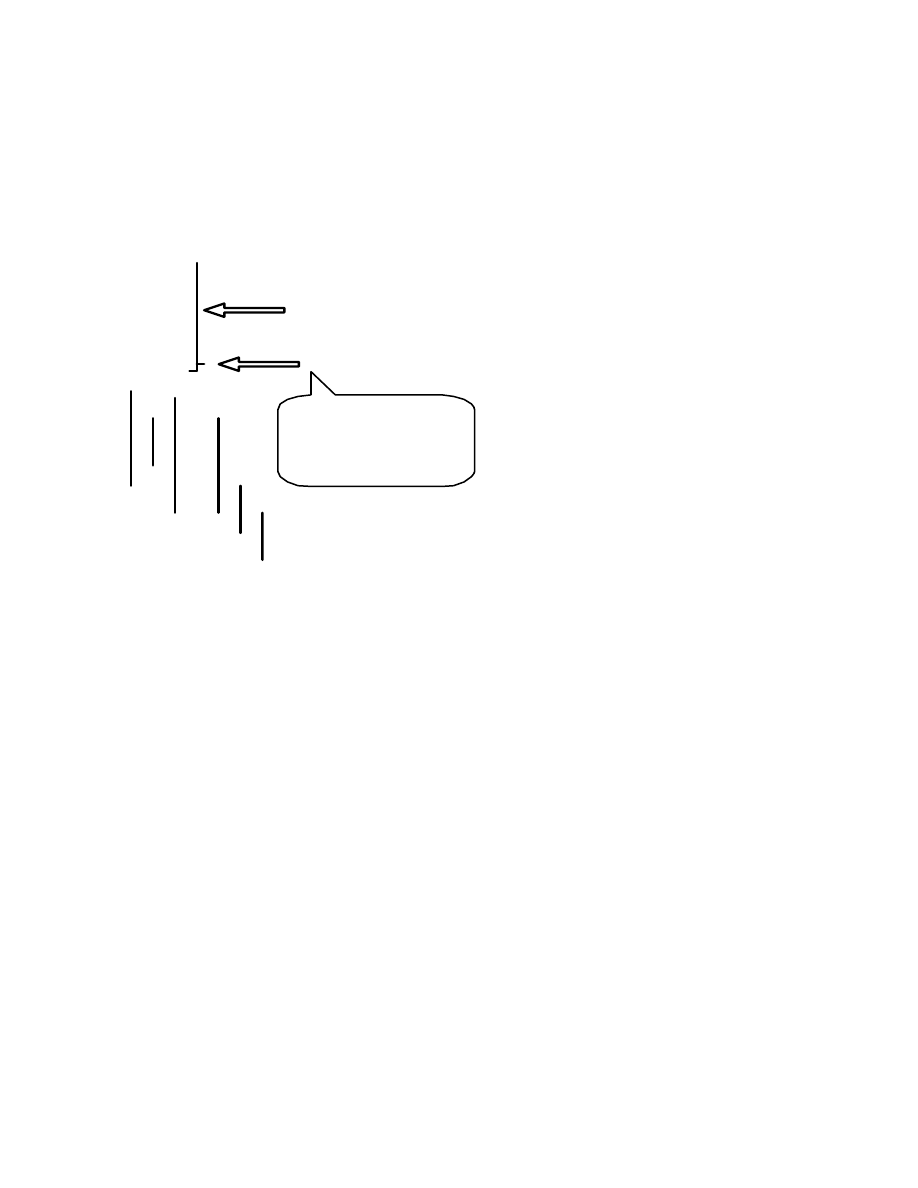
Lesson Three_______________________________________________
Common $ense Commodities - All rights Reserved 1998 - 2003
86
When this happens, it might continue going up the next day, but in many
cases, it’s going to reverse trend and head south. When it does close in the
lower 25% of its trading range, I suggest you place an open order to go
short at market the following day, but keep tighter stops than usual.
Trading Spikes: Spikes offer
some of the best opportunities for
making money that you can find.
As you know, there are spike-up
days and spike-down days. Both
can be great opportunities if you
learn to trade them correctly.
If a spike-down day closes high, I
suggest you place an order to buy
(go long) the next morning at the
opening price, because it will
usually rally the following day.
Now, where should you place your stops? Your initial stop should be below
the low of the spike-down day from the day before, provided it meets your
reward/risk ratio. If not, you should look at placing it below the low of the
day, before the spike-down day.
On the other hand, if the spike-down day closes in the lower 25% of that
day’s range, I suggest you place an order to go short the next day at a break
below the low of the spike-down day. I don’t suggest you place an order to
go short at the opening price, but rather use a sell-stop order to go short, just
below the low of spike down day.
Let’s look at some examples of some spike days on the following chart to
see what they look like.
A Spike Up Day
A spike up day is one where
the high is far above the previous
day’s high but where it closes
near the bottom that day. It’s a
good indication of a reverse in
the trend. and that a major high
has been reached.
It closes low for the day

_________________________________________________ Lesson Three
Common $ense Commodities - All rights Reserved 1998-2003
87

Lesson Three_______________________________________________
Common $ense Commodities - All rights Reserved 1998 - 2003
88
Homework Lesson Three
1. Think of _____________________ as the floor, and _________________
as the ceiling.
2. The _________ level sometimes becomes both support and resistance
level.
3. A _________________ number is a price point where both support and
resistance have formed, just at different times.
4. Prices tend to find major support or resistance at even numbers.
True
_____
False______
5. The 50% level simply represents the ___________________ price over a
specific period of time.
6. All prices will do a 50% retracement over a period of time.
True
_____
False______
7. The 50% level is a valuable key to technical trading.
True
_____
False______
8. You can use 50% internal retracements to figure entry and/or exit targets.
True
_____
False______
9. A __________________________ is a wide horizontal channel that
contains the price for an extended period of time.

_________________________________________________ Lesson Three
Common $ense Commodities - All rights Reserved 1998-2003
89
10. You should usually wait how many days to place a trade after a breakout
of a trading range. ________________
11. The difference in _________________ and trading ranges are that
trading ranges are wider in price.
12. There are three ways a price can go: up, down and
___________________.
13. You would place an order to _________________ if the price breaks out
of the top of the channel, and _________________ if the price breaks out of
the bottom of the channel.
14. In a sideways channel or a trading range, when the price finally breaks
out, it should continue a distance that is the ______________ of the channel
it just broke out of.
15. List the four types of gaps:
A.
_______________________________
B.
_______________________________
C.
_______________________________
D.
_______________________________
16. Which of these gaps is usually insignificant? ____________________.
17. __________________ gaps are usually indicative of a big market move.
18. Runaway gaps are also called ____________________________.
19. _________________ gaps occur when the price has been rallying or
declining over an extended period of time.
20. Spikes are not good trading opportunities and should be avoided.
True _____ False_____

Common $ense Commodities - All rights Reserved 1998 - 2003
90
I hope you enjoyed my mini-course.
The full version of this course is almost 450
pages, printed, bound, and mailed to you.
It can be ordered at my web-site:
http:\\www.commonsensecommodities.com
If you have not yet done so, please e-mail
David Duty at
dduty@davidduty.com
and ask to be put on the guest list. This
way, you can have a full 30 days of e-mail
lessons and support at no charge.
If you have any questions, call the author,
David Duty, in Gulf Breeze, FL USA
(850) 932-0937
Try and call between 9:00 AM & 6:00 PM CST
Except on Sunday
Please feel free to pass this Mini-Course
along to anyone you think could benefit from it.

Common $ense Commodities - All rights Reserved 1998-2003
91
Answers to Homework
Lesson One
1. A
2. Out or Flat
3.
Futures
4.
A
5.
B
6.
B
7.
A
8.
C
9.
A
10.
C
11.
A
12.
C
13. Technical / Fundamental
14. Monthly / Daily
15.
A
16.
A
17.
High
Open
Close
Low
18. D / It shows who won that day, the bulls or the bears
19.
A.
20 A.
21.
$1,000
Lesson Two
1. Friend
2. Major / Minor / Current or Short Term
3. Three weeks to three months
4.
Support
5. Current Trend

Common $ense Commodities - All rights Reserved 1998 - 2003
92
6. Number of Hits / How long has it been established / Rate of
Ascent
or
Descent
7. Three
8. Closing / Two
9. True
10. Three
11. Three
12. 45 degrees
13. False
Lesson Three
1. Support / Resistance
2. 50%
3. Common Number or CN
4. Tops
5. Average
6. True
7. True
8. True
9. Trading Range
10. Three
11. Channel
12. Sideways
13. Go Long or Buy / Go Short or Sell
14. Width of the highest point
15. Common / Breakaway/ Runaway / Exhaustion
16. Common
17. Breakaway
18. Measuring
19. Exhaustion
20. False
Wyszukiwarka
Podobne podstrony:
Kenneth Hagin, A Common sense Guide to Fasting
Podstawy systemu Common law; Introduction to common law syllabus (j polski i j angielski)
500 common words Spanish to English
Alan Dean Foster Commonwealth 05 Sentenced to Prism
Jaekle Urban, Tomasini Emlio Trading Systems A New Approach To System Development And Portfolio Opt
Alan Dean Foster Commonwealth 04 Voyage To The City of the Dead
a sociological approach to the simpsons YXTVFI5XHAYBAWC2R7Z7O2YN5GAHA4SQLX3ICYY
Jaffe Innovative approaches to the design of symphony halls
Approaches To Teaching
My philosophical Approach to counseling
A Statistical Information Grid Approach to Spatial Data
20th Century Approaches to Translation A Historiographical Survey
Alternative approaches to cervical cancer screening — kopia
European approaches to IR theory
08 Genetic Approaches to Programmed Assembly
Greenberg Two approaches to language universals
approaches to teaching grammar
Altman, A Semantic Syntactic Approach to Film Genre
więcej podobnych podstron