
Measurement of audience seat absorption for use
in geometrical acoustics software
Jason E. Summers
Program in Architectural Acoustics, School of Architecture, Rensselaer Polytechnic Institute, Troy, New York 12180
summej2@rpi.edu
Abstract: Systematic errors in the high frequency predictions of
geometrical acoustics software can result from the use of seat absorption
coefficients derived by traditional measurement methods based on diffuse-
field assumptions. This analysis treats in-situ measurement methods in
which seat absorption coefficients are calculated by a diffuse-field model
from reverberation time measurements made in auditoria. Computer
models illustrate that the nonuniform distributions of absorption in auditoria
result in significant differences between the absorption coefficients derived
by an in-situ measurement method and the true random-incidence
absorption coefficients. Proposals are made for methods to be used when
measuring seat absorption coefficients for use in geometrical acoustics
software.
©2003 Acoustical Society of America
PACS numbers: 43.55.Dt, 43.55.Ka
Date Received: 4 September 2002
Date Accepted: 17 March 2003
1. Introduction
Development of room-acoustical prediction software based on the principles of geometrical
acoustics (GA) has enabled improved prediction accuracy at high frequencies in spaces for
which the diffuse-field assumptions inherent to statistical acoustics models are not strictly
valid. The accuracy of the output generated by a GA algorithm is limited, however, by the
choice of the input parameters.
1
Current practices for the modeling of seat absorption in GA
software, which use data derived from reverberation time measurements by means of
statistical acoustics models, can introduce systematic errors into the simulation process. Seat
absorption coefficients used in GA computer models should instead be measured by a method
that does not artificially impose diffuse-field assumptions.
To give accurate predictions, a computer model of a room must represent the
geometry of the room with a level of detail consistent with the assumption of geometrical
reflection.
2,3
The model must also accurately simulate scattering and absorption that occur at
the room surfaces.
In GA software, the Lambert model of diffuse reflection
4
is typically used to treat
scattering due to surface roughness and other effects.
5
Inclusion of surface scattering by this
approach substantially improves the accuracy of predictions.
5,6
In the Lambert model, a
scattering coefficient s is defined as the fraction of energy that is not specularly reflected.
Scattering coefficients have been assessed by comparison of predictions with
measurements
5,7,8
and can be estimated from consideration of the length scale of surface
roughness in relation to wavelength.
Absorption coefficients of surfaces are typically taken from values published in the
literature. These are usually derived from reverberation-room measurements using one of the
statistical acoustics models of reverberation. Most GA computer models assume angle-
independent absorption coefficients. This simplification is generally valid in reverberant
enclosures with a sufficient degree of surface scattering.
9
Considering that porous absorbers
Summers et al.: Acoustics Research Letters Online
[DOI 10.1121/1.1582072]
Published Online 5 May 2003
77 ARLO 4(3), July 2003
1529-7853/03/4(3)/77/6/$19.00
(c)2003 Acoustical Society of America 77

show less variation in absorption coefficient with incident angle at high frequencies (i.e. large
normal absorption coefficient),
3
the assumption is particularly appropriate for GA models.
Despite its significance, the absorption coefficient of seating is typically the least
well known of all the surfaces in an auditorium. Improved methods for the measurement of
seat absorption coefficient in reverberation chambers have been proposed.
3,10-12
Alternative
methods using an in-situ approach, in which the absorption coefficients of seating are
extracted from reverberation time measurements made in auditoria using a statistical
acoustics model, have also been proposed.
13,14
Beranek and Hidaka
15
recently reported results
of using such an in-situ method to measure the absorption coefficients of occupied and
unoccupied seating in a number of auditoria. Contrary to their intended purpose,
15
these data
have been recommended for use in GA computer models.
1
Presentations made at the special
sessions on computer modeling in acoustical consulting, hosted at the 143
rd
meeting of the
Acoustical Society of America, indicated that these or similarly derived values are commonly
used in GA computer models.
2. Causes of systematic error
The measurement method presented by Beranek and Hidaka, like most in-situ methods, treats
the auditorium as a reverberation chamber and extracts the absorption coefficients from
measurements of reverberation time made before and after the installation of seats by using
the Sabine model. Although this method is appropriate for its intended purpose of predicting
reverberation time using the Sabine model, the absorption coefficients obtained by this, or
other similar methods, should not be used in GA software.
One source of error in doing so is the different treatment of the edge effects
associated with seating blocks in the two models. Although edge effects are significant, they
have already been the subject of a number of studies.
10,11
This study instead focuses on a less
frequently addressed, but equally significant, source of error. The error originates in the
relationships between statistical acoustics models and GA models in rooms that are not
ideally diffuse. Though the Sabine decay model in conjunction with the Beranek-Hidaka seat
absorption coefficients has been found to give accurate predictions of reverberation time in
many halls,
15
this is not verification that the Sabine model is strictly valid in auditoria. The
predictions of GA reduce to those of the Sabine model only if the enclosure under
consideration is ergodic, sufficiently mixing, and weakly absorbing.
16
A typical auditorium
cannot meet all of these criteria, due primarily to the strong, nonuniform absorption presented
by the seating. The actual decay curve will differ from that predicted by the Sabine model in
a manner that is dependent on the geometry and surface properties of the room. In many
cases, the anisotropy of the sound field will result in a decay that is steeper than that predicted
by the Sabine model.
4,17
In other cases, and particularly if the enclosure is weakly mixing, the
decay will be longer than that predicted by the Sabine model.
4,17
As a result, the value of
extracted by use of the Sabine model will be either larger or smaller than the true random-
incidence absorption coefficient. The same observations hold true for the Eyring model.
Essentially, the absorption coefficients extracted from measurements made in a space that is
not perfectly diffuse using a decay model that assumes idealized diffuse-field conditions will
reflect the departure from those idealized conditions. In GA computer models the departure
from diffuse-field conditions is addressed by the modeling software itself. Therefore, if
angle-independent absorption coefficients are used in GA software, they should be the true
random-incidence absorption coefficients.
This source of error is different than the effect described by Nishihara et al.
3
As they
described, departure from ideal diffuse-field conditions affects the isotropy of the sound field
and thus invalidates the assumption that the probability density function P(
) describing the
incidence angles of sound is given by sin(
). Whereas this is primarily a low-frequency
effect, the effect described by this paper is applicable to all frequencies for which GA is valid.
Summers et al.: Acoustics Research Letters Online
[DOI 10.1121/1.1582072]
Published Online 5 May 2003
78 ARLO 4(3), July 2003
1529-7853/03/4(3)/77/6/$19.00
(c)2003 Acoustical Society of America 78
3. Computations and results
If the Sabine model were to be strictly valid in concert halls, using the Sabine model to
extract from a decay curve computed by a GA computer model would return the same as
used in the computation; this is not typically the case. The goal of this initial study is to
suggest the extent to which the departure from the ideal diffuse-field condition affects the
values measured by in-situ methods. To investigate the relationship between the true random-
incidence absorption coefficient and the absorption coefficient measured by in-situ
methods—in particular, the method proposed by Beranek and Hidaka—a series of computer
simulations were conducted using the software
CATT
-
ACOUSTIC
Version 8.0a.
18
This software
uses a variant of cone-axis tracing with surface scattering of reflections above second order
implemented by the well studied probabilistic interpretation of Lambert’s law.
5,17
Tail
correction procedures account for loss of reflections in the late decay by assuming a quadratic
growth of reflection density. Although the results presented are limited to the output of this
particular computer model, they should be representative of other GA computer models that
account for surface scattering in a similar manner. Previous work has shown the predictions
of
CATT
-
ACOUSTIC
agree well with measurements and other algorithms.
1,18
In addition, using
a modification of the algorithm, in which the late portion was computed by ray tracing
without tail correction, produced no change in the predictions for the models studied here.
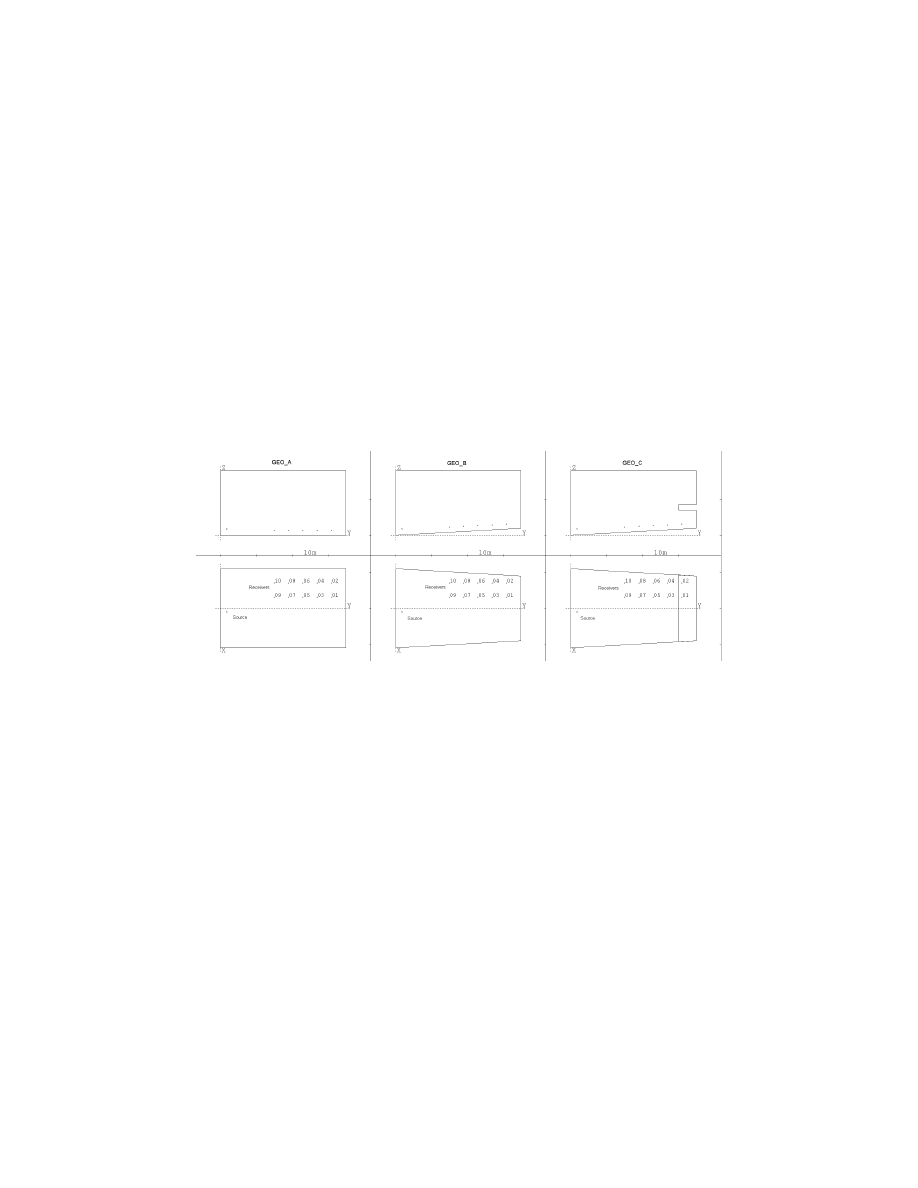
Fig. 1. Plans and sections of the three computer models with source and receiver positions marked.
Three room geometries were considered, with volumes in the range 11 789-13 860
m
3
. For the first geometry, GEO_A, a simple rectangular parallelepiped was chosen. This
geometry is not ergodic given a specular reflection law and weakly mixing in other conditions
but, being the subject of previous studies,
5,17
served as a reference. Moreover, in this
geometry, the assumptions of the tail-correction procedure employed in
CATT
-
ACOUSTIC
are
known to be exact.
4
The two additional geometries, GEO_B and GEO_C, introduced a raked
floor and a slight inverse-fan shape. GEO_C included a small balcony at the rear of the hall.
A single source position and ten receiver positions were used in each of the models. GEO_C
included two receiver positions under the balcony. The reverberation times computed at these
locations did not differ significantly from those computed at other locations in the room.
Plans and transverse sections of each of the models with the source and receiver positions
marked are shown in Fig. 1. 60 000 cones were traced for each simulation with the truncation
time set to exceed the reverberation time. Air absorption is neglected in these simulations
because it obscures the effect being studied. Being a continuous absorption process, the
decay due to air absorption is described exactly by the Sabine model, and therefore increases
the agreement between the Sabine model and the GA computer model.
Because only the effects resulting from the failure of the statistical acoustics
assumptions and not those from different methods of modeling edge absorption were to be
Summers et al.: Acoustics Research Letters Online
[DOI 10.1121/1.1582072]
Published Online 5 May 2003
79 ARLO 4(3), July 2003
1529-7853/03/4(3)/77/6/$19.00
(c)2003 Acoustical Society of America 79

considered, the seating surfaces were modeled as plane surfaces having no exposed edges.
Five input values of seating absorption coefficient
a
were considered in the range 0.6-0.8.
The residual surfaces were assigned an absorption coefficient
r
of 0.08. The scattering
coefficient of the seating s
a
was set to be 0.7 in all cases, based on the findings of Lam.
7
Three values were used for the residual scattering coefficient of the remaining surfaces,
s
r
= 0.2, 0.4, and 0.6, based on typical ranges found in prior studies
5,7,8
. For the case in which
the seating was removed, the floor was assumed to have an absorption coefficient of 0.02 and
a scattering coefficient of 0.10. These values are consistent with those of large surfaces of
smooth concrete.
7,15
Reverberation time T30 was computed at each of the ten receiver
positions. These were averaged, and the seat absorption coefficients extracted from the
spatially averaged reverberation time following Beranek and Hidaka’s procedure. The results
of these calculations are compiled in Table 1. The percentage error for each measured
absorption coefficient
m
is reported relative to the input value,
a
:
(
)
a
a
m
−
=
error
.
Table 1. The absorption coefficients calculated from the GA simulations by the Beranek-Hidaka method, values in
italics are taken from markedly nonlinear decay curves.
a
0.6
0.65
0.7
0.75
0.8
geometry s
r
s
a
m
(% error)
GEO_A 0.2 0.7 0.57 (- 5.3%) 0.60 (- 8.3%) 0.59 (-16 %) 0.63 (-15 %) 0.66 (-17%)
0.4 0.7 0.68 ( 13 %) 0.75 ( 15 %) 0.80 ( 14 %) 0.86 ( 14 %) 0.94 ( 17%)
0.6 0.7 0.71 ( 19 %) 0.78 ( 20 %) 0.86 ( 22 %) 0.93 ( 24 %) 1.00 ( 25%)
GEO_B 0.2 0.7 0.57 (- 5.4%) 0.59 (- 9.1%) 0.64 (- 8.6%) 0.70 (- 7.2%) 0.65 (-18%)
0.4 0.7 0.67 ( 12 %) 0.75 ( 15 %) 0.81 ( 16 %) 0.87 ( 16 %) 0.93 ( 16%)
0.6 0.7 0.70 ( 17 %) 0.79 ( 21 %) 0.86 ( 23 %) 0.92 ( 23 %) 1.01 ( 26%)
GEO_C 0.2 0.7 0.53 (-11 %) 0.56 (-14 %) 0.58 (-17 %) 0.61 (-18 %) 0.64 (-20%)
0.4 0.7 0.65 ( 7.6%) 0.70 ( 8.2%) 0.76 ( 8.8%) 0.82 ( 9.7%) 0.89 ( 12%)
0.6 0.7 0.68 ( 13 %) 0.75 ( 15 %) 0.82 ( 17 %) 0.89 ( 19 %) 0.98 ( 22%)
In the low surface scattering case, s
r
= 0.2, all of the enclosures considered were too
weakly mixing to overcome the effects of long-lived paths and, as a result, yielded nonlinear
decay curves having decay rates that decreased with time. These fit to linear decays having
reverberation times longer than those predicted by the Sabine model; therefore values of
a
were consistently underpredicted. In contrast, for s
r
≥
0.4 the enclosures were sufficiently
mixing to prevent the dominance of long-lived paths. Consequently, the anisotropy in the
sound field caused by nonuniform absorption resulted, for these absorption configurations, in
essentially linear decay curves steeper than those predicted by the Sabine model. Thus, for
s
r
≥
0.4, values of
a
were overpredicted. In the higher surface scattering cases (s
r
≥
0.4), the
difference between the decay predicted by the GA computer model and the Sabine model
generally increased as the absorption coefficient of the seating was increased, due to the
greater degree of anisotropy in the sound field. For s
r
≥
0.4, the difference between the two
models also increased as s
r
increased. As the enclosures became more mixing, fewer long-
lived paths existed to balance the reverberation-time-decreasing effects of these nonuniform
absorption configurations. The addition of the shallow balcony gives a more uniform
distribution of absorption by separating the seating area into two planes. Comparing the
results of GEO_B and GEO_C, this greater uniformity appears to have reduced the anisotropy
of the sound field, allowing for a more accurate prediction of the seat absorption coefficient.
Further studies in more realistic geometries are necessary to confirm the
observations made here. More realistic geometries are typically more mixing than simple
geometries. As such, the effects of anisotropy will dominate, resulting in decay curves
steeper than those predicated by the Sabine model. Therefore, it is expected that Beranek-
Hidaka seat absorption coefficients or those that are similarly derived will typically be larger
than the true random-incidence absorption coefficients. This should be especially true in the
case of occupied seating or unoccupied, highly absorbing seats, for which the anisotropy will
Summers et al.: Acoustics Research Letters Online
[DOI 10.1121/1.1582072]
Published Online 5 May 2003
80 ARLO 4(3), July 2003
1529-7853/03/4(3)/77/6/$19.00
(c)2003 Acoustical Society of America 80

be most severe. This conclusion appears to be supported by recent studies that show that low
estimates of seat absorption gave the best results for the prediction of reverberation time in
GA software.
1
Actual auditoria typically have seating areas that are distributed more
uniformly than the test cases, by means of multiple balconies. This should reduce the degree
of anisotropy in the sound field and mediate the tendency toward overestimation of the
absorption coefficients.
4. Conclusions and recommendations
Based on the subjective difference limen of reverberation time, Davies et al.
11
have proposed
that seat absorption should be measured to an accuracy of 5%. However, the findings of this
study suggest that absorption coefficients measured by typical in-situ methods are unlikely to
satisfy this criterion. This problem might be aggravated in computer models used for
auralization, which may require even stricter standards of accuracy.
Use of other statistical acoustics models cannot solve this problem. In conditions
that violate the assumptions of the Sabine model, additional information beyond the volume,
surface area, and average absorption coefficient of the room is required to yield a true first-
order correction to the Sabine model.
19
As such, other commonly used decay models (e.g.,
Eyring) cannot yield predictions that are consistently more accurate than those of the Sabine
model in all room geometries. Thus, some systematic error will be caused by all methods of
measuring seat absorption that rely on statistical acoustics models.
Therefore, an alternative computational method should be used to measure seat
absorption coefficients for use in GA software. Benedetto and Spagnolo
20
suggested such a
method for measuring the true random-incidence absorption coefficient in reverberation
chambers for which the diffuse-field assumptions are violated due to the presence of a highly
absorbing test sample. By using a ray-tracing model to compute the reverberation time T of
the reverberation chamber with a fixed sample size and placement for a range of sample
absorption coefficients, a calibration curve T( ) is computed. The absorption coefficient of
the sample in a particular frequency band is then extracted by comparing the measured T in
that band with T( ). The omission of nonspecular reflection in their work seriously limits its
validity.
5
However, by including the modeling of surface scattering, such a procedure can be
applied to in-situ measurement of seat absorption coefficients in auditoria.
Before the installation of seats in an auditorium the majority of surfaces are highly
reflective, and their true random-incidence absorption coefficients can be estimated with
sufficient accuracy from published data. The scattering coefficients of residual surfaces s
r
can be determined by comparing T measured in an auditorium before the installation of seats
with T computed in an appropriately rendered GA computer model and adjusting the
scattering coefficients in a process of iterative refinement. Although the computed
reverberation time is, in general, ill-conditioned with respect to the input parameters,
beginning the iterative process with scattering coefficients chosen according to physical
criteria should be sufficient to assure that the iterations operate in the region of and ultimately
converge to the true values of s
r
. Before the installation of seats, the reverberation time in
these spaces may depend weakly on the scattering coefficient of the surfaces.
5
This will
increase the uncertainty of s
r
determined by this method. With the absorption and scattering
coefficients of the residual surfaces established, T( ) for the seating can be computed in the
GA computer model by assuming a value for the scattering coefficient of the seating s
a
. The
degree of variation in the extracted seat absorption coefficient
a
resulting from this
uncertainty in s
a
is unlikely to be large. At high frequencies s
a
is expected to be in the range
0.6-0.9.
1,7
Small changes of scattering coefficient around these values will have little effect
on the decay curve.
5,17
With T( ) computed,
a
can be determined by comparing T( ) with T
measured in the auditorium after the installation of seats. The inclusion of surface scattering
gives T( ) implicit frequency dependence through the frequency dependence of the scattering
coefficients. Thus, the procedure must be repeated for each frequency band. This proposed
Summers et al.: Acoustics Research Letters Online
[DOI 10.1121/1.1582072]
Published Online 5 May 2003
81 ARLO 4(3), July 2003
1529-7853/03/4(3)/77/6/$19.00
(c)2003 Acoustical Society of America 81

method has not been used in practice and should be tested first in existing auditoria before it
is generally applied. In the case of nonlinear decay curves, T does not parameterize the decay
well, and the procedure should be altered. One possible approach replaces the use of T( )
with a more general, automated procedure that seeks to optimize a goodness-of-fit parameter.
In many instances, a GA computer model of an auditorium is created before
construction. In lieu of in-situ data, the proposed method can be adapted to reverberation-
chamber measurements. However, any technique that does not require that the assumptions
of a particular statistical acoustics model of reverberation be satisfied can be used. The
methods described in Refs. 3 and 12, when applied to high frequency measurements, should
also give absorption coefficients suitable for use in GA software.
Acknowledgments
This work was supported by the Bass Foundation and the Rensselaer Polytechnic Institute
School of Architecture. The author acknowledges the helpful comments of B.-I. L.
Dalenbäck, Y. Shimizu, and R. R. Torres.
References
1
I. Bork, “A comparison of room simulation software – the 2
nd
round robin on room acoustical computer
simulation,” Acustica 86, 943-956 (2000).
2
J. H. Rindel, H. Shiokawa, C. L. Christensen, and A. C. Gade, “Comparisons between computer simulations of
room acoustical parameters and those measured in concert halls,” in Proc. of 137
th
Meeting of ASA, 2
nd
Convention of EAA, and 25
th
DAGA conference, Berlin (1999). [J. Acoust. Soc. Am. 105, 1173 (A) (1999).]
3
N. Nishihara, T. Hidaka, and L. L. Beranek, “Mechanism of sound absorption by seated audience in halls,” J.
Acoust. Soc. Am. 110, 2398-2411 (2001).
4
H. Kuttruff, Room Acoustics, 4
th
Ed., (Spon Press, New York, 2000), pp. 110-111, 137-141, 97-98.
5
M. Hodgson, “Evidence of diffuse surface reflections in rooms,” J. Acoust. Soc. Am. 89, 765-771 (1991).
6
M. Vorländer, “International round robin on room acoustical computer simulations,” in Proc. of the 15
th
ICA,
Trondheim, Norway (1995), pp. 689-692.
7
Y. W. Lam, “The dependence of diffusion parameters in a room acoustics prediction model on auditorium sizes
and shapes,” J. Acoust. Soc. Am. 100, 2193-2203 (1996).
8
G. Cammarata, A. Fichera, A. Pagano, and G. Rizzo, “Acoustical prediction in some Italian theaters,” Acoust.
Res. Lett. Online 2, 61-66 (2001).
9
H. Kuttruff, “Zum Einfluß eines winkelabhängigen Schallabsorptionsgrades auf die Nachhallzeit” (On the
influence of an angle-dependent sound absorption coefficient on reverberation time), Acustica 42, 187-188 (L)
(1979).
10
J. S. Bradley, “Predicting theater chair absorption from reverberation chamber measurements,” J. Acoust. Soc.
Am. 91, 1514-1524 (1991).
11
W. J. Davies, R. J. Orlowski, and Y. W. Lam, “Measuring auditorium seat absorption,” J. Acoust. Soc. Am. 96,
879-888 (1994).
12
F. Kawakami and T. Sakai, “Deep-well approach for canceling the edge effect in random incident absorption
measurement,” J. Acoust. Soc. Jpn. (E) 19, 327-338 (1998).
13
C. W. Kosten, “New method for the calculation of the reverberation time of halls for public assembly,”
Acustica 16, 325-330 (1965).
14
L. L. Beranek, “Audience and chair absorption in large halls,” J. Acoust. Soc. Am. 45, 13-19 (1969).
15
L. L. Beranek and T. Hidaka, “Sound absorption in concert halls by seats, occupied and unoccupied, and by the
hall’s interior surfaces,” J. Acoust. Soc. Am. 104, 3169-3177 (1998).
16
J. D. Polack, “Modifying chambers to play billiards: the foundations of reverberation theory,” Acustica 76,
257-272 (1992).
17
H. Kuttruff and Th. Straßen, “Zur Abhängigkeit des Raumnachhalls von der Wanddiffusität und von der
Raumform” (On the dependence of reverberation time on the ‘wall diffusion’ and on room shape), Acustica 45,
246-255 (1980).
18
B.-I. L. Dalenbäck, ‘‘Verification of prediction based on randomized tail-corrected cone-tracing and array
modeling,’’ in Proc. of 137
th
Meeting of ASA, 2
nd
Convention of EAA, and 25
th
DAGA conference, Berlin
(1999). [J. Acoust. Soc. Am. 105, 1173 (A) (1999).]
19
W. B. Joyce, “Power series for the reverberation time,” J. Acoust. Soc. Am. 67, 564-571 (1980).
20
G. Benedetto and R. Spagnolo, “Evaluation of sound absorbing coefficients in a reverberant room by computer-
ray simulation,” Appl. Acoust. 17, 365-378 (1984).
Summers et al.: Acoustics Research Letters Online
[DOI 10.1121/1.1582072]
Published Online 5 May 2003
82 ARLO 4(3), July 2003
1529-7853/03/4(3)/77/6/$19.00
(c)2003 Acoustical Society of America 82
Wyszukiwarka
Podobne podstrony:
Suture Materials and Suture Selection for Use in Exotic Pet Surgical
A parallel String Matching Engine for use in high speed network intrusion detection systems
Assessment of balance and risk for falls in a sample of community dwelling adults aged 65 and older
notes for use of cattle docks v3
BAT Guidance Note for Use of Solvents
Heron, Shapira (2003) Time to log of New diagnostic criteria for problematic Internet use
Ando Acoustical Design And Measurement Of A Circular Hall, Improving A Spatial Factor At Each Seat
the development and use of the eight precepts for lay practitioners, Upāsakas and Upāsikās in therav
The development and use of the eight precepts for lay practitioners, Upāsakas and Upāsikās in Therav
Principles of Sigma Delta Conversion for Analog to Digital Converters
iraq book of iraq dodipp intelligence for military personnel 543NE5VSFEJ27BZY4ZHZFOZ3PIEZBN7S3XKQI7
LAB1 MN, AutarKaw Measuring of errors
Types of A V Aids and relevance for LT
Design of a 10 kW Inverter for a Fuel Cell
In hospital cardiac arrest Is it time for an in hospital chain of prevention
The use of Merit Pay Scales as Incentives in Health?re
więcej podobnych podstron