
SQL Server 2012 Tutorials:
Analysis Services - Tabular
Modeling
SQL Server 2012 Books Online
Summary: This tutorial provides lessons on how to create a SQL Server 2012 Analysis
Services tabular model running in In-Memory mode by using SQL Server Data Tools
(SSDT).
Category: Quick Step-By-Step
Applies to: SQL Server 2012
Source: SQL Server Books Online (
E-book publication date: June 2012

Copyright © 2012 by Microsoft Corporation
All rights reserved. No part of the contents of this book may be reproduced or transmitted in any form or by any means
without the written permission of the publisher.
Microsoft and the trademarks listed at
http://www.microsoft.com/about/legal/en/us/IntellectualProperty/Trademarks/EN-US.aspx are trademarks of the
Microsoft group of companies. All other marks are property of their respective owners.
The example companies, organizations, products, domain names, email addresses, logos, people, places, and events
depicted herein are fictitious. No association with any real company, organization, product, domain name, email address,
logo, person, place, or event is intended or should be inferred.
This book expresses the author’s views and opinions. The information contained in this book is provided without any
express, statutory, or implied warranties. Neither the authors, Microsoft Corporation, nor its resellers, or distributors will
be held liable for any damages caused or alleged to be caused either directly or indirectly by this book.

Contents

4
Tabular Modeling (Adventure Works Tutorial)
This tutorial provides lessons on how to create a SQL Server 2012 Analysis Services
tabular model running in Tabular (in-memory) mode by using SQL Server Data Tools
(SSDT).
What You Will Learn
During the course of this tutorial, you will learn the following:
How to create a new tabular model project in SQL Server Data Tools.
How to import data from a SQL Server relational database into a tabular model
project.
How to create and manage relationships between tables in the model.
How to create and manage calculations, measures, and Key Performance Indicators
that help users analyze model data.
How to create and manage perspectives and hierarchies that help users more easily
browse model data by providing business and application specific viewpoints.
How to create partitions that divide table data into smaller logical parts that can be
processed independent from other partitions.
How to secure model objects and data by creating roles with user members.
How to deploy a tabular model in Tabular mode to a sandbox or production instance
of Analysis Services.
Tutorial Scenario
This tutorial is based on Adventure Works Cycles, a fictitious company. Adventure Works
Cycles is a large, multinational manufacturing company that produces and distributes
metal and composite bicycles to commercial markets in North America, Europe, and Asia.
The headquarters for Adventure Works Cycles is in Bothell, Washington, where the
company employs 500 workers. Additionally, Adventure Works Cycles employs several
regional sales teams throughout its market base.
To better support the data analysis needs of sales and marketing teams and of senior
management, you are tasked with creating a tabular model for users to analyze internet
sales data in the AdventureWorksDW2012 sample database.
In order to complete the tutorial, and the Adventure Works Internet Sales tabular model,
you must complete a number of lessons. Within each lesson are a number of tasks;
completing each task in order is necessary for completing the lesson. While in a
particular lesson there may be several tasks that accomplish a similar outcome; however,
how you complete each task is slightly different. This is to show that there is often more
5
than one way to complete a particular task, and to challenge you by using skills you
learned in previous tasks.
The purpose of the lessons is to guide you through authoring a basic tabular model
running in Tabular mode by using many of the features included in SQL Server Data
Tools. Because each lesson builds upon the previous lesson, you should complete the
lessons in order. Once you have completed all of the lessons, you will have authored and
deployed the Adventure Works Internet Sales sample tabular model on an Analysis
Services server.
After you complete the tutorial, you can add to your model, or create additional models
using the same AdventureWorksDW2012 sample database. The database includes an
extensive collection of tables and data that can apply to a wide range of sample models.
This tutorial does not provide lessons or information about managing a deployed
tabular model database by using SQL Server Management Studio, or using a
reporting client application to connect to a deployed model to browse model
data.
Prerequisites
In order to complete this tutorial, you must have the following prerequisites installed:
SQL Server 2012 Analysis Services (running in Tabular mode).
SQL Server Data Tools (SSDT) - installed as part of SQL Server 2012.
AdventureWorksDW2012 sample database. This sample database includes the data
necessary to complete this tutorial. To download the sample database, see
http://go.microsoft.com/fwlink/?LinkID=220093
Microsoft Excel 2003 or later (for use with the Analyze in Excel feature in lesson 11)
Lessons
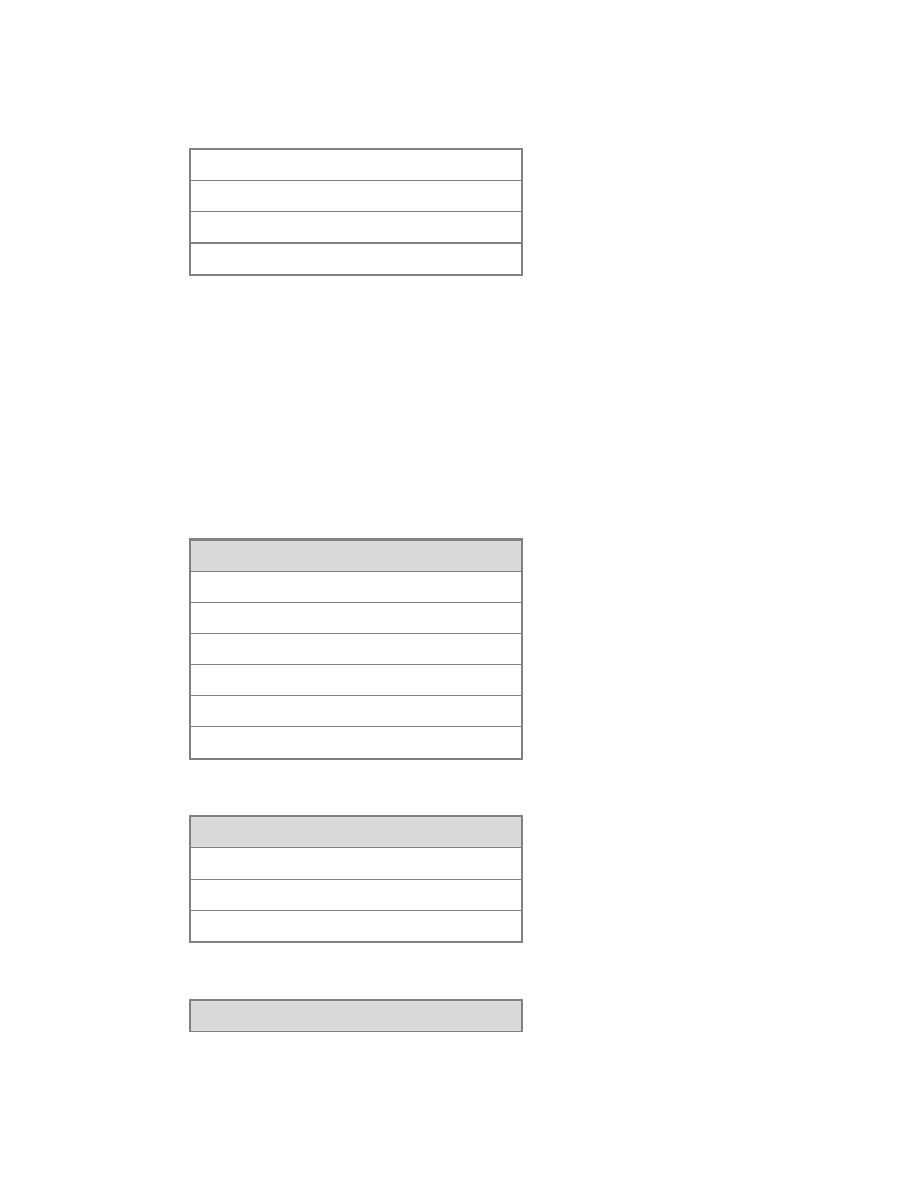
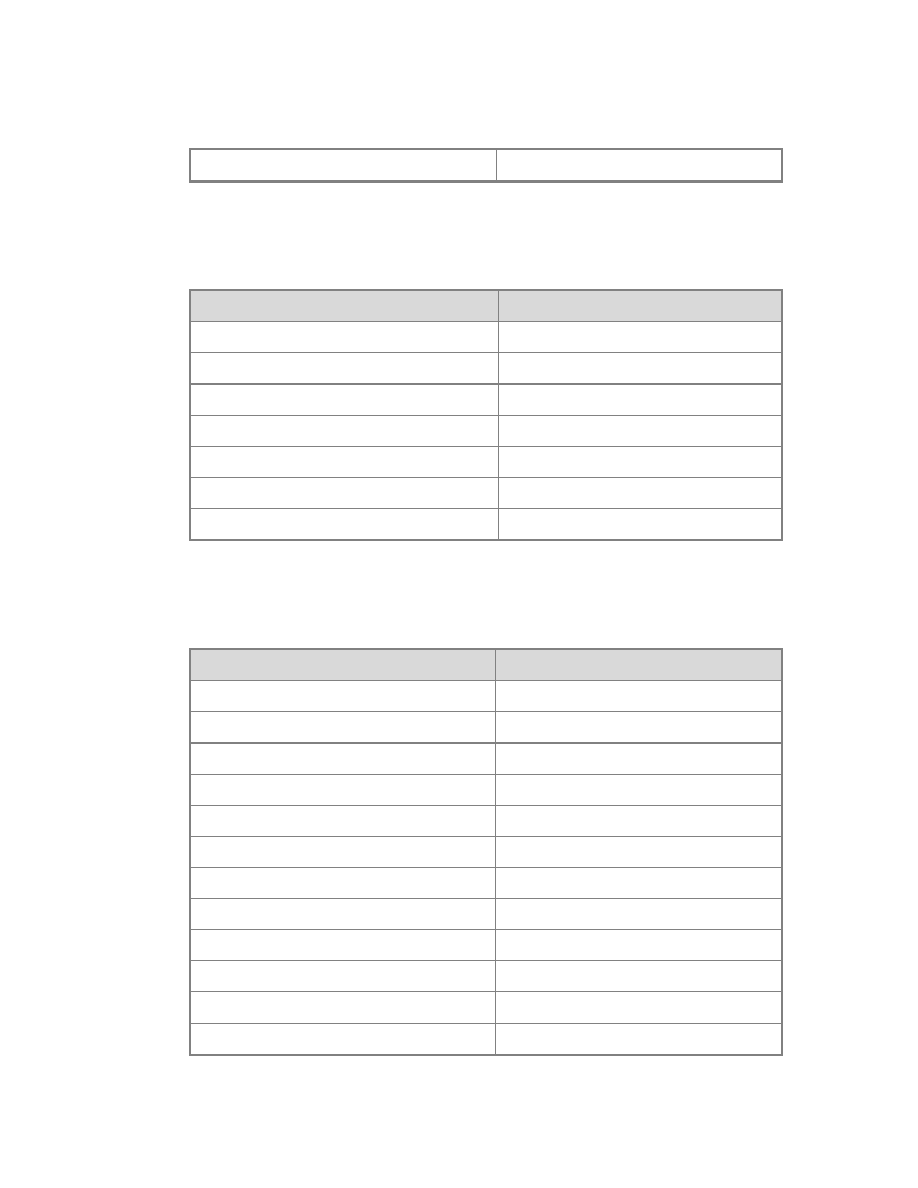
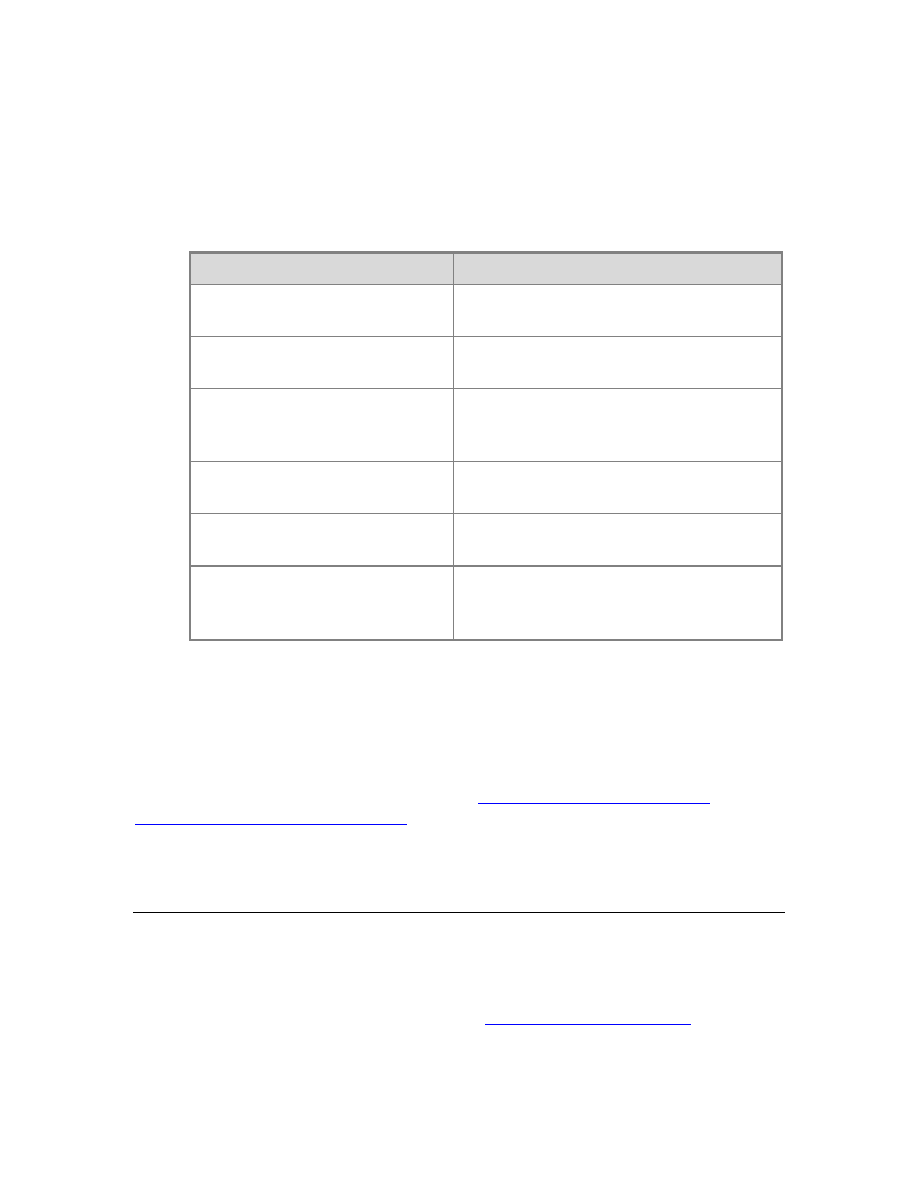
This tutorial includes the following lessons:
Lesson
Estimated time to complete
Lesson 1: Create a New Tabular Model
Project
10 minutes
20 minutes
20 minutes
3 minutes
Lesson 5: Create Relationships
10 minutes
Note
6
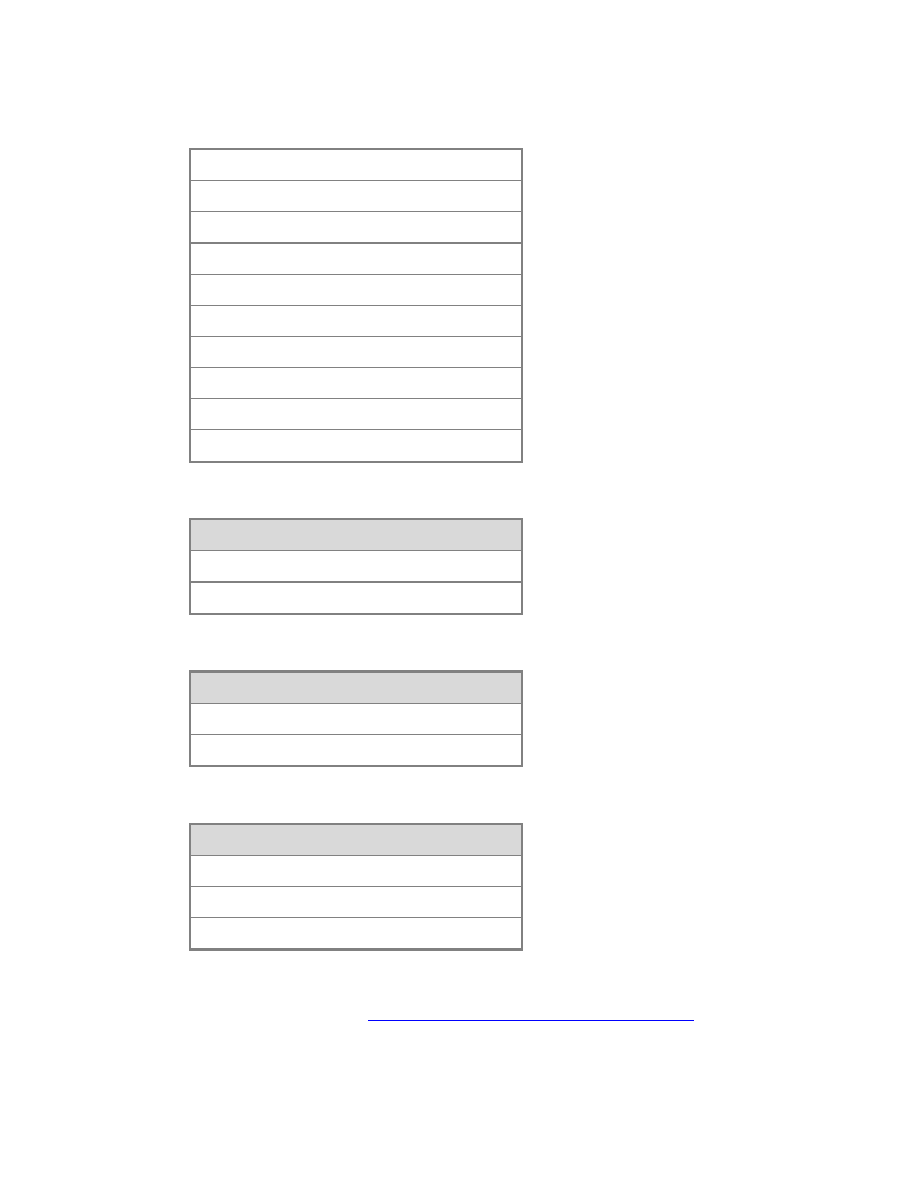
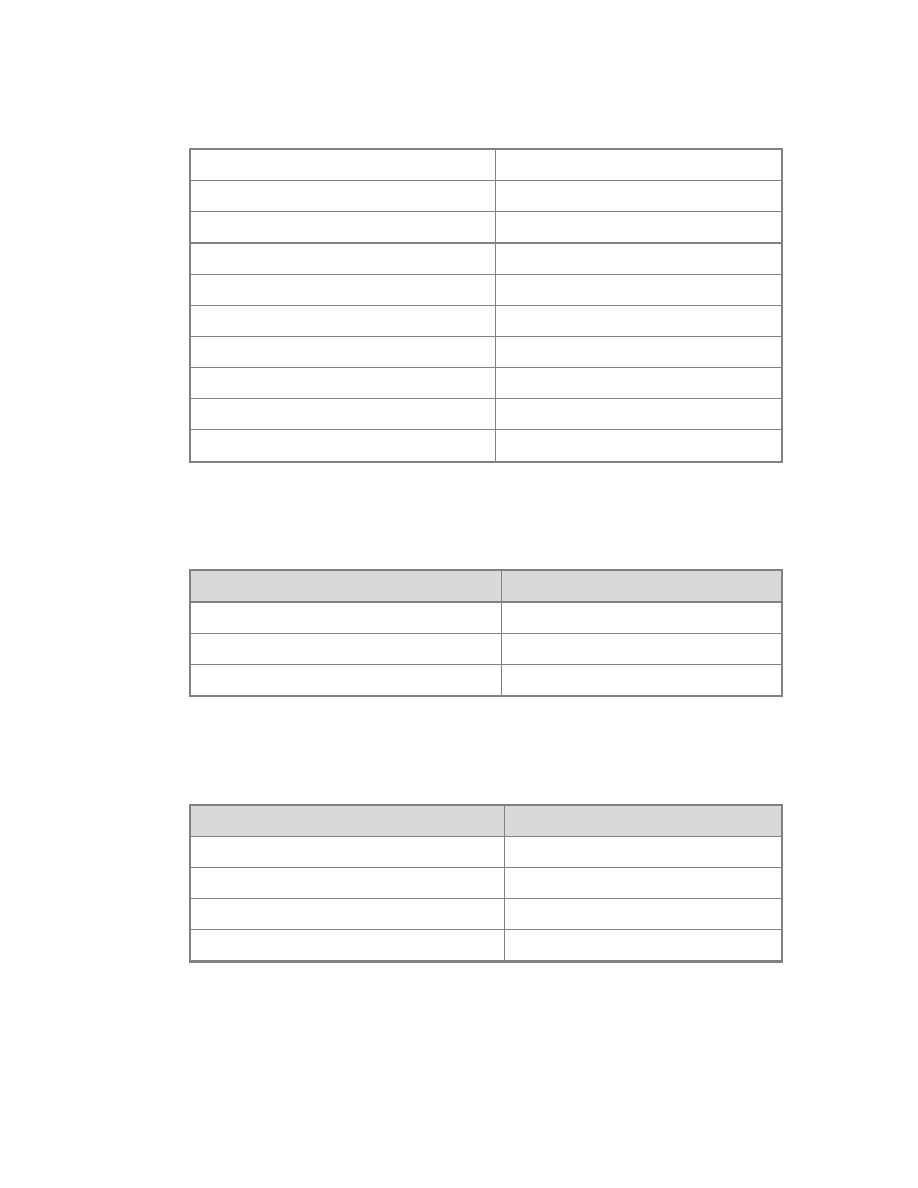
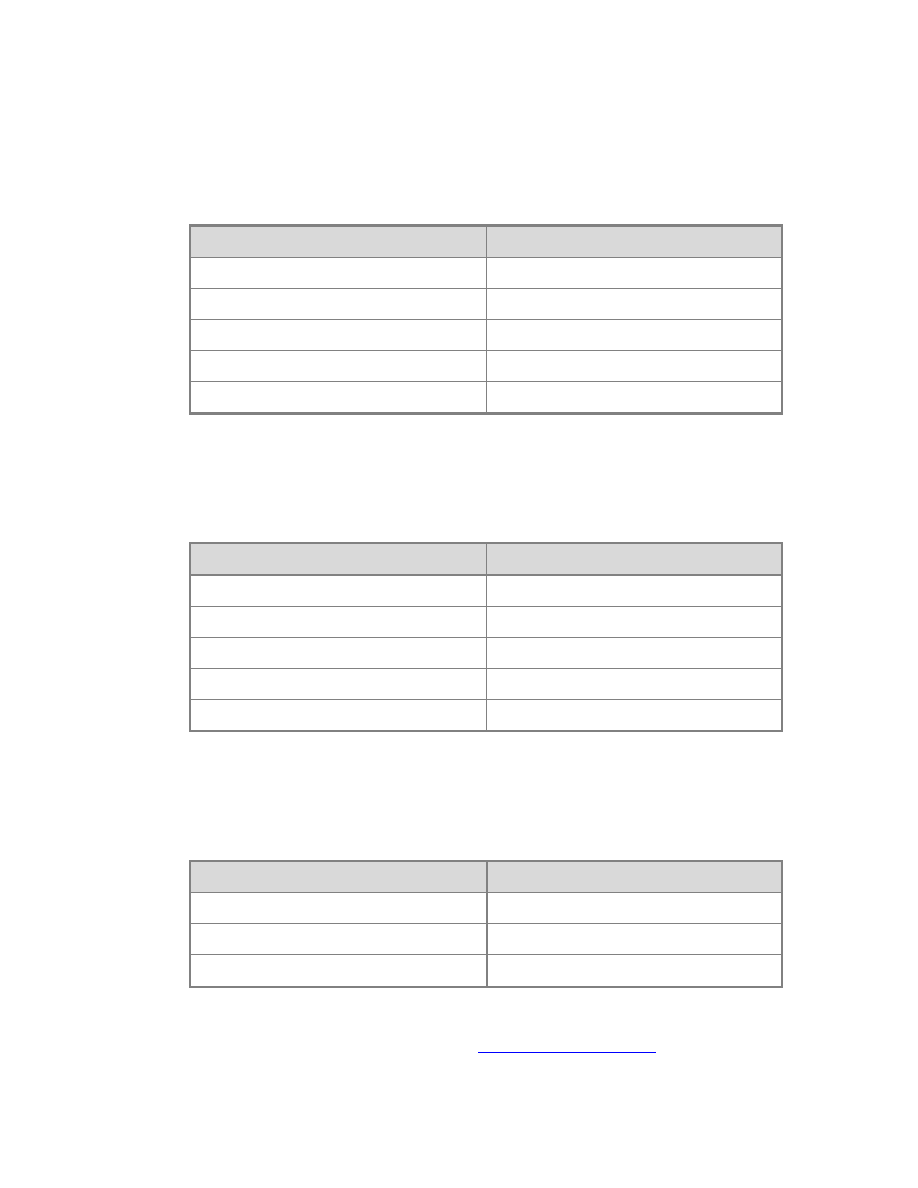
Lesson
Estimated time to complete
Lesson 6: Create Calculated Columns
15 minutes
30 minutes
Lesson 8: Create Key Performance
Indicators
15 minutes
5 minutes
20 minutes
15 minutes
15 minutes
20 minutes
5 minutes
Supplemental Lessons
This tutorial also includes
. Topics in this section are not required
to complete the tutorial, but can be helpful in better understanding advanced tabular
model authoring features.
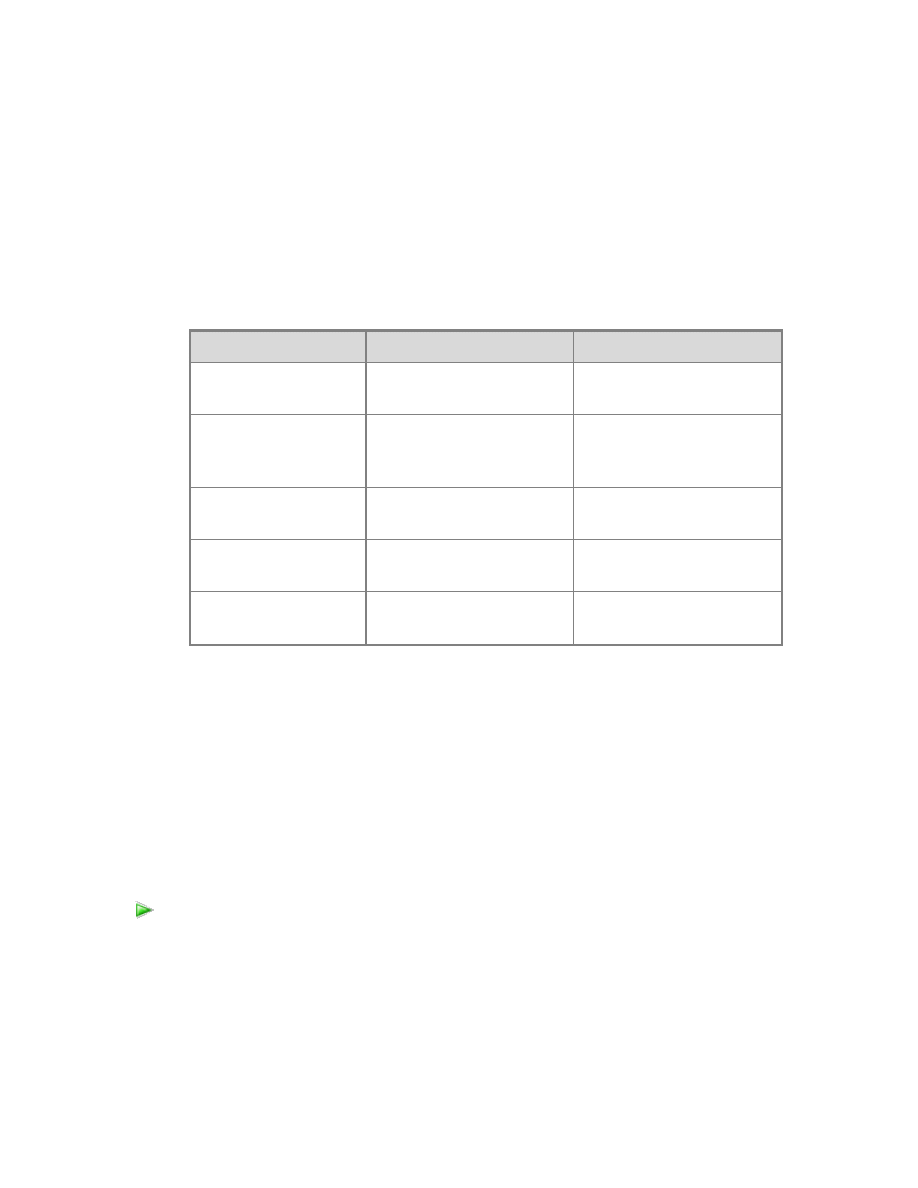
This tutorial includes the following supplemental lessons:
Lesson
Estimated time to complete
Implement Dynamic Security by Using Row
Filters
30 minutes
Next Step
To begin the tutorial, continue to the first lesson:
Lesson 1: Create a New Tabular Model
Lesson 1: Create a New Tabular Model Project
In this lesson, you will create a new, blank tabular model project in SQL Server Data Tools
(SSDT). Once your new project is created, you can begin adding data by using the Table
Import Wizard. In addition to creating a new project, this lesson also includes a brief
introduction to the tabular model authoring environment in SQL Server Data Tools.

7
To learn more about the different types of tabular model projects, see
. To learn more about the tabular model authoring environment, see
Estimated time to complete this lesson: 10 minutes
Prerequisites
This topic is the first lesson in a tabular model authoring tutorial. To complete this
lesson, you must have the AdventureWorksDW2012 database installed on a SQL Server
instance. For more information, see
Tabular Modeling (Adventure Works Tutorial)
Create a New Tabular Model Project
1. In SQL Server Data Tools, on the File menu, click New, and then click Project.
2. In the New Project dialog box, under Installed Templates, click Business
Intelligence, then click Analysis Services, and then click Analysis Services
Tabular Project.
3. In Name, type AW Internet Sales Tabular Model, then specify a location for
the project files.
By default, Solution Name will be the same as the project name, however, you
can type a different solution name.
4. Click OK.
Understanding the SQL Server Data Tools Tabular Model Authoring
Environment
Now that you’ve created a new tabular model project, let’s take a moment to explore the
tabular model authoring environment in SQL Server Data Tools (Visual Studio 2010).
After your project is created, it opens in SQL Server Data Tools. An empty model will
appear in the model designer and the Model.bim file will be selected in the Solution
Explorer window. When you add data, tables and columns will appear in the designer. If
you don’t see the designer (the empty window with the Model.bim tab), in Solution
Explorer, under AW Internet Sales Tabular Model, double click the Model.bim file.
You can view the basic project properties in the Properties window. In Solution
Explorer, click AW Internet Sales Tabular Model. Notice in the Properties window, in
Project File, you will see AW Internet Sales Tabular Model.smproj. This is the project
file name, and in Project Folder, you will see the project file location.
In Solution Explorer, right-click the AW Internet Sales Tabular Model project, and
then click Properties. The AW Internet Sales Tabular Model Property Pages dialog
box appears. These are the advanced project properties. You will later set some of these
properties when you are ready to deploy your model.
To create a new tabular model project

8
Now, let’s look at the model properties. In Solution Explorer, click Model.bim. In the
Properties window, you will now see the model properties, most important of which is
the DirectQuery Mode property. This property specifies whether or not the model is
deployed in In-Memory mode (Off) or DirectQuery mode (On). For this tutorial, you will
author and deploy your model in In-Memory mode.
When you create a new model, certain model properties are set automatically according
to the Data Modeling settings that can be specified in the Tools\Options dialog box.
Data Backup, Workspace Retention, and Workspace Server properties specify how and
where the workspace database (your model authoring database) is backed up, retained
in-memory, and built. You can change these settings later if necessary, but for now, just
leave these properties as they are.
When you installed SQL Server Data Tools, several new menu items were added to the
Visual Studio 2010 environment. Let’s look at the new menu items that are specific to
authoring tabular models. Click on the Model menu. From here, you can launch the
Table Import Wizard, view and edit existing connections, refresh workspace data, browse
your model in Microsoft Excel with the Analyze in Excel feature, create perspectives and
roles, select the model view, and set calculation options.
Click on the Table menu. Here, you can create and manage relationships between tables,
create and manage, specify date table settings, create partitions, and edit table
properties.
Click on the Column menu. Here, you can add and delete columns in a table, freeze
columns, and specify sort order. You can also use the AutoSum feature to create a
standard aggregation measure for a selected column. Other toolbar buttons provide
quick access to frequently used features and commands.
Explore some of the dialogs and locations for various features specific to authoring
tabular models. While some items will not yet be active, you can get a good idea of the
tabular model authoring environment.
Next Steps
To continue this tutorial, go to the next lesson:
Lesson 2: Add Data
In this lesson, you will use the Table Import Wizard in SQL Server Data Tools to connect
to the AdventureWorksDW2012 SQL database, select data, preview, and filter the data,
and then import the data into your model workspace.
By using the Table Import Wizard, you can import data from a variety of relational
sources: Access, SQL, Oracle, Sybase, Informix, DB2, Teradata, and more. The steps for
importing data from each of these relational sources are very similar to what is described
below. Additionally, data can be selected using a stored procedure.

9
To learn more about importing data and the different types of data sources you can
import from, see
Estimated time to complete this lesson: 20 minutes
Prerequisites
This topic is part of a tabular modeling tutorial, which should be completed in order.
Before performing the tasks in this lesson, you should have completed the previous
lesson:
Lesson: Create a New Tabular Model Project
Create a Connection
1. In SQL Server Data Tools, click on the Model menu, and then click Import from
Data Source.
This launches the Table Import Wizard which guides you through setting up a
connection to a data source. If Import from Data Source is greyed out, double
click Model.bim in Solution Explorer to open the model in the designer.
2. In the Table Import Wizard, under Relational Databases, click Microsoft SQL
Server, and then click Next.
3. In the Connect to a Microsoft SQL Server Database page, in Friendly
Connection Name, type Adventure Works DB from SQL.
4. In Server name, type the name of the server you installed the
AdventureWorksDW2012 database.
5. In the Database name field, click the down arrow and select
AdventureWorksDW2012, and then click Next.
6. In the Impersonation Information page, you need to specify the credentials
Analysis Services will use to connect to the data source when importing and
processing data. Verify Specific Windows user name and password is selected,
and then in User Name and Password, enter your Windows logon credentials,
and then click Next.
nNote
Using a Windows user account and password provides the most secure
method of connecting to a data source. For more information, see
Impersonation (SSAS - Tabular Models)
7. In the Choose How to Import the Data page, verify Select from a list of tables
and views to choose the data to import is selected. You want to select from a
list of tables and views, so click Next to display a list of all the source tables in
the source database.
8. In the Select Tables and Views page, select the check box for the following
To create a connection to a the AdventureWorksDW2012 database
10
tables: DimCustomer DimDate, DimGeography, DimProduct,
DimProductCategory, DimProductSubcategory, and FactInternetSales.
9. We want to give the tables in the model more easily understood names. Click on
the cell in the Friendly Name column for DimCustomer. Rename the table by
removing “Dim” from DimCustomer.
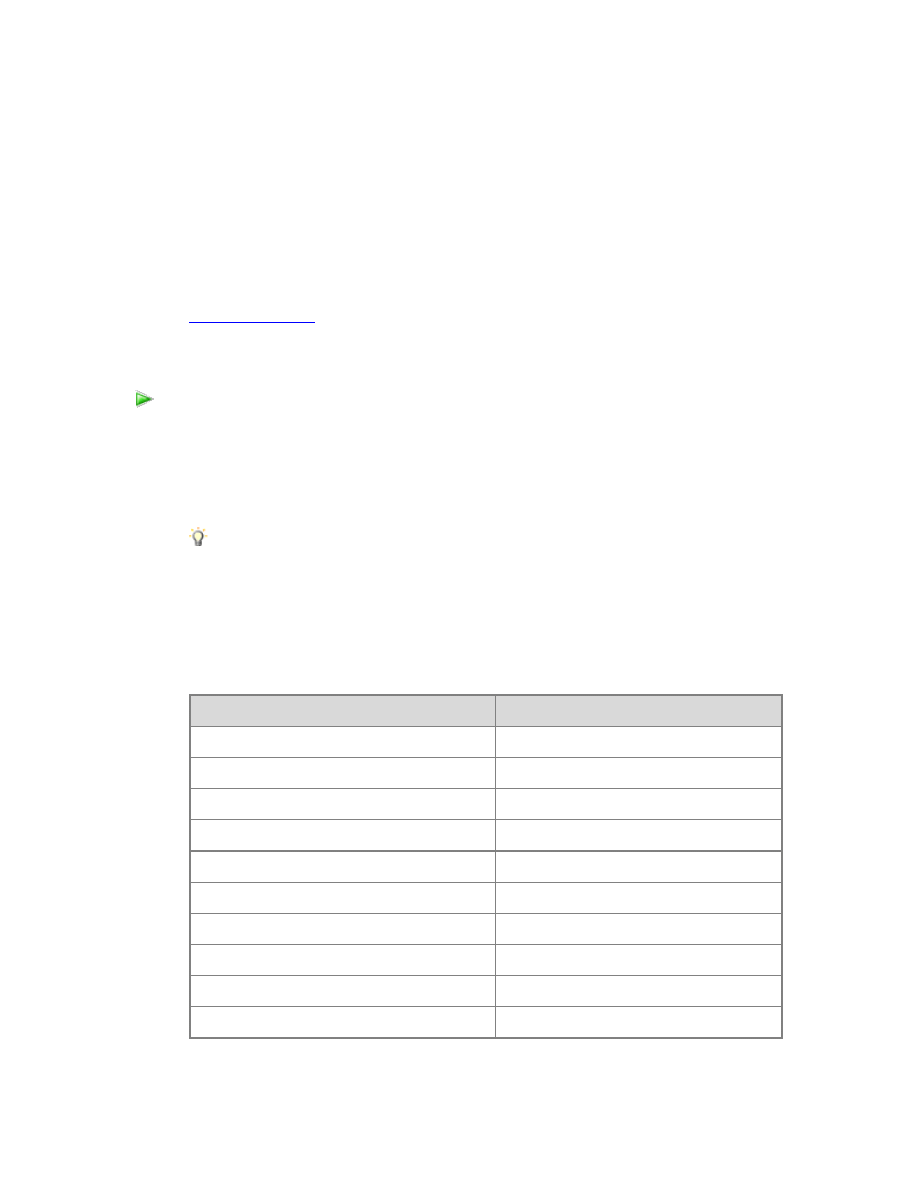
10. Rename the other tables:
Source name
Friendly Name
DimDate
Date
DimGeography
Geography
DimProduct
Product
DimProductCategory
Product Category
DimProductSubcategory
Product Subcategory
FactInternetSales
Internet Sales
DO NOT click Finish.
Now that you have connected to the database, selected the tables to import, and
given the tables friendly names, go to the next section,
Filter the Table Data prior to
Filter the Table Data
The DimCustomer table that you are importing from the database contains a subset of
the data from the original SQL Server Adventure Works database. You will filter out some
of the columns from the DimCustomer table that aren’t necessary. When possible, you
will want to filter out data that will not be used in order to save in-memory space used
by the model.
1. Select the row for the Customer table, and then click Preview & Filter. The
Preview Selected Table window opens with all the columns in the DimCustomer
source table displayed.
2. Clear the checkbox at the top of the following columns:
Customer
To filter the table data prior to importing
11
SpanishEducation
FrenchEducation
SpanishOccupation
FrenchOccupation
Since the values for these columns are not relevant to Internet sales analysis,
there is no need to import these columns. Eliminating unnecessary columns will
make your model smaller.
3. Verify that all other columns are checked, and then click OK.
Notice the words Applied filters are now displayed in the Filter Details column
in the Customer row; if you click on that link you’ll see a text description of the
filters you just applied.
4. Filter the remaining tables by clearing the checkboxes for the following columns
in each table:
Date
DateKey
SpanishDayNameOfWeek
FrenchDayNameOfWeek
SpanishMonthName
FrenchMonthName
DateTimeAlternateKey
Geography
SpanishCountryRegionName
FrenchCountryRegionName
IpAddressLocator
Product
12
SpanishProductName
FrenchProductName
FrenchDescription
ChineseDescription
ArabicDescription
HebrewDescription
ThaiDescription
GermanDescription
JapaneseDescription
TurkishDescription
Product Category
SpanishProductCategoryName
FrenchProductCategoryName
Product Subcategory
SpanishProductSubcategoryName
FrenchProductSubcategoryName
Internet Sales
OrderDateKey
DueDateKey
ShipDateKey
Now that you have previewed and filtered out unnecessary data, you can import the
data. Go to the next section

13
Import the Selected Tables and Column Data
You can now import the selected data. The wizard imports the table data along with any
relationships between tables. New tables and columns are created in the model using
the friendly names you specified, and data that you filtered out will not be imported.
1. Review your selections. If everything looks OK, click Finish.
While importing the data, the wizard displays how many rows have been fetched.
When all the data has been imported, a message indicating success is displayed.
Tip
To see the relationships that were automatically created between the
imported tables, on the Data preparation row, click Details.
2. Click Close.
The wizard closes and the model designer is visible. Each table has been added as
a new tab in the model designer.
Save the Model Project
It is important to frequently save your model project.
In SQL Server Data Tools, click on the File menu, and then click Save All.
Next Step
To continue this tutorial, go to the next lesson:
Lesson 3: Rename Columns
In this lesson, you will rename many of the columns in each table you imported.
Renaming makes columns more identifiable and easier to navigate in both the model
designer as well by users selecting fields in a client application. To learn more, see
Rename a Table or Column (SSAS)
Renaming columns is not necessary to complete this tutorial; however, remaining
lessons, in particular those that include creating relationships and creating
calculated columns and measures using DAX formulas, refer to the column
friendly names described in this lesson. If you choose not to rename columns,
To import the selected tables and column data
To save the model project
Important
14
you will have to edit the DAX formulas in lessons 5, 6, and 7 to use the original
source column names provided in this lesson.
Estimated time to complete this lesson: 20 minutes
Prerequisites
This topic is part of a tabular modeling tutorial, which should be completed in order.
Before performing the tasks in this lesson, you should have completed the previous
lesson:
Rename Columns
1. In the model designer, click the Customer table (tab).
When you click a tab, that table becomes active in the model designer window.
2. Double click the CustomerKey column name, then type Customer Id, and then
press ENTER.
Tip
You can also rename a column in the Column Name property in the
column’s Properties window, or in Diagram View.
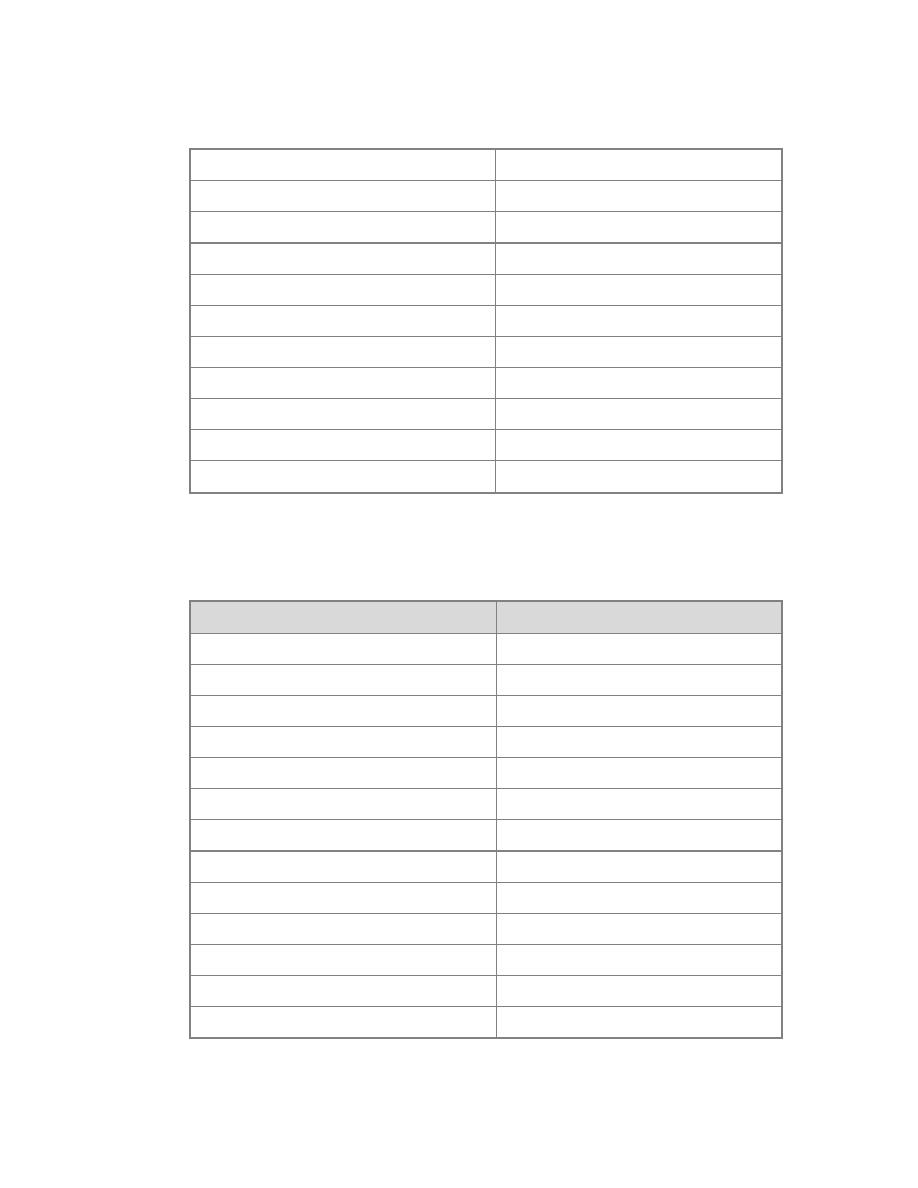
3. Rename the remaining columns in the Customer table, as well as the columns in
the remaining tables, replacing the source name with the friendly name:
Customer Table
Source Name
Friendly Name
GeographyKey
Geography Id
CustomerAlternateKey
Customer Alternate Id
FirstName
First Name
MiddleName
Middle Name
LastName
Last Name
NameStyle
Name Style
BirthDate
Birth Date
MaritalStatus
Marital Status
EmailAddress
Email Address
YearlyIncome
Yearly Income
To rename columns
15
TotalChildren
Total Children
NumberChildrenAtHome
Number of Children At Home
EnglishEducation
Education
EnglishOccupation
Occupation
HouseOwnerFlag
Owns House
NumberCarsOwned
Number of Cars Owned
AddressLine1
Address Line 1
AddressLine2
Address Line 2
Phone
Phone Number
DateFirstPurchase
Date of First Purchase
CommuteDistance
Commute Distance
Date
Source Name
Friendly Name
FullDateAlternateKey
Date
DayNumberOfWeek
Day Number of Week
EnglishDayNameOfWeek
Day Name
DayNumberOfMonth
Day of Month
DayNumberOfYear
Day of Year
WeekNumberOfYear
Week Number of Year
EnglishMonthName
Month Name
MonthNumberOfYear
Month
CalendarQuarter
Calendar Quarter
CalendarYear
Calendar Year
CalendarSemester
Calendar Semester
FiscalQuarter
Fiscal Quarter
FiscalYear
Fiscal Year
16
FiscalSemester
Fiscal Semester
Geography
Source Name
Friendly Name
GeographyKey
Geography Id
StateProvinceCode
State Province Code
StateProvinceName
State Province Name
CountryRegionCode
Country Region Code
EnglishCountryRegionName
Country Region Name
PostalCode
Postal Code
SalesTerritoryKey
Sales Territory Id
Product
Source Name
Friendly Name
ProductKey
Product Id
ProductAlternateKey
Product Alternate Id
ProductSubcategoryKey
Product Subcategory Id
WeightUnitMeasureCode
Weight Unit Code
SizeUnitMeasureCode
Size Unit Code
EnglishProductName
Product Name
StandardCost
Standard Cost
FinishedGoodsFlag
Is Finished Product
SafetyStockLevel
Safety Stock Level
ReorderPoint
Reorder Point
ListPrice
List Price
SizeRange
Size Range
17
DaysToManufacture
Days to Manufacture
ProductLine
Product Line
Dealer Price
Dealer Price
ModelName
Model Name
LargePhoto
Large Photo
EnglishDescription
Description
StartDate
Product Start Date
EndDate
Product End Date
Status
Product Status
ProductImage
Product Image
Product Category
Source Name
Friendly Name
ProductCategoryKey
Product Category Id
ProductCategoryAlternateKey
Product Category Alternate Id
EnglishProductCategoryName
Product Category Name
Product Subcategory
Source Name
Friendly Name
ProductSubcategoryKey
Product Subcategory Id
ProductSubcategoryAlternateKey
Product Subcategory Alternate Id
EnglishProductSubcategoryName
Product Subcategory Name
ProductCategoryKey
Product Category Id
Internet Sales

18
Source Name
Friendly Name
ProductKey
Product Id
CustomerKey
Customer Id
PromotionKey
Promotion Id
CurrencyKey
Currency Id
SalesTerritoryKey
Sales Territory Id
SalesOrderNumber
Sales Order Number
SalesOrderLineNumber
Sales Order Line Number
RevisionNumber
Revision Number
OrderQuantity
Order Quantity
UnitPrice
Unit Price
ExtendedAmount
Extended Amount
UnitPriceDiscountPct
Unit Price Discount Pct
DiscountAmount
Discount Amount
ProductStandardCost
Product Standard Cost
TotalProductCost
Total Product Cost
SalesAmount
Sales Amount
TaxAmt
Tax Amt
CarrierTrackingNumber
Carrier Tracking Number
CustomerPONumber
Customer PO Number
OrderDate
Order Date
DueDate
Due Date
ShipDate
Ship Date
Next Step
To continue this tutorial, go to the next lesson:

19
Lesson 4: Mark as Date Table
In Lesson 2: Add Data, you imported a dimension table named DimDate. You then
renamed the DimDate table, in Lesson 3: Rename Columns, to simply, Date. While in your
model this table is now named Date, it can also be known as a Date table, in that it
contains date and time data.
Whenever you use Time Intelligence functions in calculations, as you will do when you
create measures a little later, you must specify a Date table and a unique identifier Date
column in that table. You can then create valid relationships between other tables and
the Date table; necessary for calculations using DAX time intelligence functions.
In this lesson, you will mark the imported and renamed Date table as the Date table and
the Date column (in the Date table) as the Date column (unique identifier). All the use of
the name Date can get kind of confusing, but you’ll soon get the idea.
Estimated time to complete this lesson: 3 minutes
Prerequisites
This topic is part of a tabular modeling tutorial, which should be completed in order.
Before performing the tasks in this lesson, you should have completed the previous
lesson:
Procedures
1. In the model designer, click the Date table (tab).
2. Click the Table menu, then click Date, and then click Mark as Date Table.
3. In the Mark as Date Table dialog box, in the Date listbox, select the Date
column as the unique identifier.
Next Steps
To continue this tutorial, go to the next lesson:
Lesson 5: Create Relationships
Lesson 5: Create Relationships
In this lesson, you will verify the relationships that were created automatically when you
imported data and add new relationships between different tables. A relationship is a
connection between two tables that establishes how the data in those tables should be
correlated. For example, the Product table and the Product Subcategory table have a
To set Mark as Date Table

20
relationship based on the fact that each product belongs to a subcategory. To learn
more, see
Relationships (SSAS - Tabular Models)
Estimated time to complete this lesson: 10 minutes
Prerequisites
This topic is part of a tabular modeling tutorial, which should be completed in order.
Before performing the tasks in this lesson, you should have completed the previous
lesson:
Review Existing Relationships and Add New Relationships
When you imported data by using the Table Import Wizard, you imported seven tables
from the AdventureWorksDW2012 database. Generally, if you import data from a
relational source, existing relationships are automatically imported for you together with
the data. However, before you proceed with authoring your model you should verify
those relationships between tables were created properly. For this tutorial, you will also
add three new relationships.
1. In SQL Server Data Tools, click on the Model menu, then point to Model View,
and then click Diagram View.
The model designer now appears in Diagram View, a graphical format displaying
all of the tables you imported with lines between them. The lines between tables
indicate the relationships that were automatically created when you imported the
data.
Use the minimap controls in the upper-right corner of the model designer to
adjust the view to include as many of the tables as possible. You can also click
and drag tables to different locations, bringing tables closer together, or putting
them in a particular order. Moving tables does not affect the relationships already
between the tables. To view all of the columns in a particular table, click and drag
on a table edge to expand or make it smaller.
2. Click on the solid line between the Customer table and the Geography table.
The solid line between these two tables show this relationship is active, that is, it
is used by default when calculating DAX formulas.
Notice the Geography Id column in the Customer table and the Geography Id
column in the Geography table now both each appear within a box. This shows
these are the columns used in the relationship. The relationship’s properties now
also appear in the Properties window.
Tip
In addition to using the model designer in diagram view, you can also use
the Manage Relationships dialog box to show the relationships between
To review existing relationships
21
all tables in a table format. Click on the Table menu, and then click
Manage Relationships. The Manage Relationships dialog box shows
the relationships that were automatically created when you imported
data.
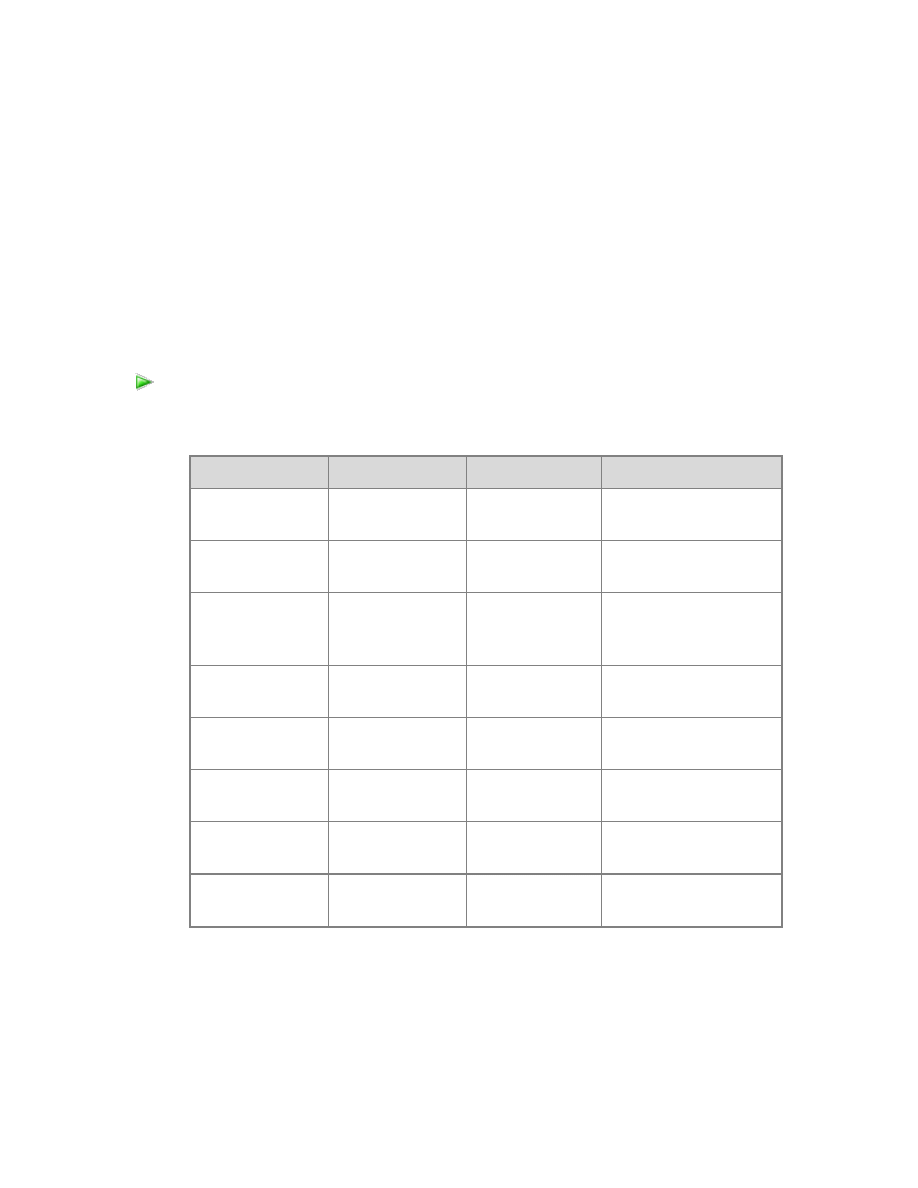
3. Use the model designer in diagram view, or the Manage Relationships dialog
box, to verify the following relationships were created when each of the tables
were imported from the AdventureWorksDW2012 database:
Active
Table
Related Lookup Table
Yes
Customer [Geography
Id]
Geography [Geography
Id]
Yes
Product [Product
Subcategory Id]
Product Subcategory
[Product Subcategory
Id]
Yes
Product Subcategory
[Product Category Id]
Product Category
[Product Category Id]
Yes
Internet Sales [Customer
Id]
Customer [Customer Id]
Yes
Internet Sales [Product
Id]
Product [Product Id]
If any of the relationships in the table above are missing, verify that your model includes
the following tables: Customer, Date, Geography, Product, Product Category, Product
Subcategory, and Internet Sales. If tables from the same data source connection are
imported at separate times, any relationships between those tables will not be created
and must be created manually.
In some cases, you may need to create additional relationships between tables in your
model to support certain business logic. For this tutorial, you need to create three
additional relationships between the Internet Sales table and the Date table.
1. In the model designer, in the Internet Sales table, click and hold on the Order
Date column, then drag the cursor to the Date column in the Date table, and
then release.
A solid line appears showing you have created an active relationship between the
Order Date column in the Internet Sales table and the Date column in the Date
To add new relationships between tables

22
table.
Note
When creating relationships, the order between the primary table and the
related lookup table is automatically put in the correct order.
2. In the Internet Sales table, click and hold on the Due Date column, then drag
the cursor to the Date column in the Date table, and then release.
A dotted line appears showing you have created an inactive relationship between
the Due Date column in the Internet Sales table and the Date column in the
Date table. You can have multiple relationships between tables, but only one
relationship can be active at a time.
3. Finally, create one more relationship; in the Internet Sales table, click and hold
on the Ship Date column, then drag the cursor to the Date column in the Date
table, and then release.
A dotted line appears showing you have created an inactive relationship between
the Ship Date column in the Internet Sales table and the Date column in the
Date table.
Next Step
To continue this lesson, go to the next lesson:
Lesson: Define Calculated Columns
Lesson 6: Create Calculated Columns
In this lesson, you will create new data in your model by adding calculated columns. A
calculated column is based on data that already exists in the model. To learn more, see
You will create five new calculated columns in three different tables. The steps are
slightly different for each task. This is to show you there are several ways to create new
columns, rename them, and place them in various locations in a table.
Estimated time to complete this lesson: 15 minutes
Prerequisites
This topic is part of a tabular modeling tutorial, which should be completed in order.
Before performing the tasks in this lesson, you should have completed the previous
lesson:

23
Create Calculated Columns
1. In SQL Server Data Tools, click the Model menu, then point to Model View, and
then click Data View.
Calculated columns can only be created by using the model designer in Data
View.
2. In the model designer, click the Date table (tab).
3. Right-click the Calendar Quarter column, and then click Insert Column.
A new column named CalculatedColumn1 is inserted to the left of the Calendar
Quarter column.
4. In the formula bar above the table, type the following formula. AutoComplete
helps you type the fully qualified names of columns and tables, and lists the
functions that are available.
=RIGHT(" " & FORMAT([Month],"#0"), 2) & " - " & [Month Name]
When you have finished building the formula, press ENTER.
Values are then populated for all the rows in the calculated column. If you scroll
down through the table, you will see that rows can have different values for this
column, based on the data that is in each row.
Note
If you receive an error, verify the column names in the formula match the
column names you changed in
5. Rename this column to Month Calendar.
The Month Calendar calculated column provides a sortable name for Month.
1. With the Date table still active, click on the Column menu, and then click Add
Column.
A new column is added to the far right of the table
2. In the formula bar, type the following formula:
=RIGHT(" " & FORMAT([Day Number Of Week],"#0"), 2) & " - " & [Day
Name]
When you have finished building the formula, press ENTER.
3. Rename the column to Day of Week.
4. Click on the column heading, and then drag the column between the Day Name
column and the Day of Month column.
Tip
Create a Month Calendar calculated column in the Date table
Create a Day of Week calculated column in the Date table

24
Moving columns in your table makes it easier to navigate.
The Day of Week calculated column provides a sortable name for the day of week.
1. In the model designer, select the Product table.
2. Scroll to the far right of the table. Notice the right-most column is named Add
Column (italicized), click the column heading.
3. In the formula bar, type the following formula.
=RELATED('Product Subcategory'[Product Subcategory Name])
When you have finished building the formula, press ENTER.
4. Rename the column to Product Subcategory Name.
The Product Subcategory Name calculated column is used to create a hierarchy in
the Product table which includes data from the Product Subcategory Name column
in the Product Subcategory table. Hierarchies cannot span more than one table. You
will create hierarchies later in Lesson 7.
1. With the Product table still active, click the Column menu, and then click Add
Column.
2. In the formula bar, type the following formula:
=RELATED('Product Category'[Product Category Name])
When you have finished building the formula, press ENTER.
3. Rename the column to Product Category Name.
The Product Category Name calculated column is used to create a hierarchy in the
Product table which includes data from the Product Category Name column in the
Product Category table. Hierarchies cannot span more than one table.
1. In the model designer, select the Internet Sales table.
2. Add a new column.
3. In the formula bar, type the following formula:
=[Sales Amount]-[Total Product Cost]
When you have finished building the formula, press ENTER.
4. Rename the column to Margin.
5. Drag the column between the Sales Amount column and the Tax Amt column.
The Margin calculated column is used to analyze profit margins for each (product)
row.
Create a Product Subcategory Name calculated column in the Product table
Create a Product Category Name calculated column in the Product table
Create a Margin calculated column in the Internet Sales table

25
Next Step
To continue this lesson, go to the next lesson:
Create Measures (Adventure Works
Lesson 7: Create Measures
In this lesson, you will create measures to be included in your model. Similar to the
calculated columns you created in the previous lesson, a measure is essentially a
calculation created using a DAX formula. However, unlike calculated columns, measures
are evaluated based on a filter; a user selection, for example, a particular column or slicer
added to the Row Labels field in a PivotTable. A value for each cell in the filter is then
calculated by the applied measure. Measures are powerful, flexible calculations that you
will want to include in almost all tabular models, to perform dynamic calculations on
numerical data. To learn more, see
Measures (SSAS -Tabular Models)
To create measures, you will use the Measure Grid. By default, each table has an empty
measure grid; however, you typically will not create measures for every table. The
Measure Grid appears below a table in the model designer when in Data View. To hide or
show the measure grid for a table, click the Table menu, and then click Show Measure
Grid.
You can create a measure by clicking on an empty cell in the measure grid, and then
typing a DAX formula in the formula bar. When you click ENTER to complete the formula,
the measure will then appear in the cell. You can also create measures using a standard
aggregation function by clicking on a column, and then clicking on the AutoSum button
(∑) on the toolbar. Measures created using the AutoSum feature will appear in the
measure grid cell directly beneath the column, but can be moved if necessary.
In this lesson, you will create measures by both entering a DAX formula in the formula
bar and by using the AutoSum feature.
Estimated time to complete this lesson: 30 minutes
Prerequisites
This topic is part of a tabular modeling tutorial, which should be completed in order.
Before performing the tasks in this lesson, you should have completed the previous
lesson:
Lesson: Create Calculated Columns
Create Measures
1. In the model designer, click the Date table.
2. If an empty measure grid does not already appear beneath the table, click on the
To create a Days Current Quarter to Date measure in the Date table

26
Table menu, and then click Show Measure Grid.
3. In the measure grid, click the top-left empty cell.
4. In the formula bar, above the table, type the following formula:
=COUNTROWS( DATESQTD( 'Date'[Date]))
When you have finished building the formula, press ENTER.
Notice the top-left cell now contains a measure name, Measure 1, followed by
the result, 30. The measure name also precedes the formula in the formula bar.
5. To rename the measure, in the formula bar, highlight the name, Measure 1, then
type Days Current Quarter to Date, and then press ENTER.
Tip
When typing a formula in the formula bar, you can also first type the
measure name followed by a colon (:), followed by a space, and then
followed by the formula. Using this method, you do not have to rename
the measure.
1. With the Date table still active in the model designer, in the measure grid, click
the empty cell below the measure you just created.
2. In the formula bar, type the following formula:
Days in Current Quarter :=COUNTROWS( DATESBETWEEN( 'Date'[Date],
STARTOFQUARTER( LASTDATE('Date'[Date])),
ENDOFQUARTER('Date'[Date])))
Notice in this formula you first included the measure name followed by a colon
(:).
When you have finished building the formula, press ENTER.
When creating a comparison ratio between one incomplete period and the previous
period; the formula must take into account the proportion of the period that has
elapsed, and compare it to the same proportion in the previous period. In this case,
[Days Current Quarter to Date]/[Days in Current Quarter] gives the proportion
elapsed in the current period.
1. In the model designer, click the Internet Sales table (tab).
If the measure grid does not already appear, right-click the Internet Sales table
(tab), and then click Show Measure Grid.
2. Click on the Sales Order Number column heading.
3. On the toolbar, click the down-arrow next to the AutoSum (∑) button, and then
To create a Days in Current Quarter measure in the Date table
To create an Internet Distinct Count Sales Order measure in the Internet Sales
table
27
select DistinctCount.
The AutoSum feature automatically creates a measure for the selected column
using the DistinctCount standard aggregation formula.
Notice the top cell below the column in the measure grid now contains a
measure name, Distinct Count Sales Order Number. Measures created using
the AutoSum feature are automatically placed in the top-most cell in the measure
grid below the associated column.
4. In the measure grid, click the new measure, and then in the Properties window,
in Measure Name, rename the measure to Internet Distinct Count Sales Order.
1. By using the AutoSum feature, create and name the following measures:
Measure Name
Column
AutoSum (∑)
Formula
Internet Order
Lines Count
Sales Order Line
Number
Count
=COUNT([Sales Order
Line Number])
Internet Total
Units
Order Quantity
Sum
=SUM([Order
Quantity])
Internet Total
Discount
Amount
Discount
Amount
Sum
=SUM([Discount
Amount])
Internet Total
Product Cost
Total Product
Cost
Sum
=SUM([Total Product
Cost])
Internet Total
Sales
Sales Amount
Sum
=SUM([Sales Amount])
Internet Total
Margin
Margin
Sum
=SUM([Margin])
Internet Total
Tax Amt
Tax Amt
Sum
=SUM([Tax Amt])
Internet Total
Freight
Freight
Sum
=SUM([Freight])
2. By clicking on an empty cell in the measure grid, and by using the formula bar,
create and name the following measures:
To create additional measures in the Internet Sales table
28
iImportant
You must create the following measures in order; formulas in later
measures refer to earlier measures.
Measure Name
Formula
Internet Previous Quarter Margin =CALCULATE([Internet Total
Margin],PREVIOUSQUARTER('Date'[Date]))
Internet Current Quarter Margin
=TOTALQTD([Internet Total
Margin],'Date'[Date])
Internet Previous Quarter Margin
Proportion to QTD
=[Internet Previous Quarter Margin]*([Days
Current Quarter to Date]/[Days In Current
Quarter])
Internet Previous Quarter Sales
=CALCULATE([Internet Total
Sales],PREVIOUSQUARTER('Date'[Date]))
Internet Current Quarter Sales
=TOTALQTD([Internet Total
Sales],'Date'[Date])
Internet Previous Quarter Sales
Proportion to QTD
=[Internet Previous Quarter Sales]*([Days
Current Quarter to Date]/[Days In Current
Quarter])
Measures created for the Internet Sales table can be used to analyze critical financial
data such as sales, costs, and profit margin for items defined by the user selected
filter.
Next Step
To continue this tutorial, go to the next lesson:
Lesson: Create Key Performance
Indicators (Adventure Works Tutorial)
Lesson 8: Create Key Performance Indicators
In this lesson, you will create Key Performance Indicators (KPIs). KPIs are used to gauge
performance of a value, defined by a Base measure, against a Target value, also defined
by a measure or by an absolute value. In reporting client applications, KPIs can provide
business professionals a quick and easy way to understand a summary of business
success or to identify trends. To learn more, see
Estimated time to complete this lesson: 15 minutes

29
Prerequisites
This topic is part of a tabular modeling tutorial, which should be completed in order.
Before performing the tasks in this lesson, you should have completed the previous
lesson:
Create Key Performance Indicators
1. In the model designer, click the Internet Sales table (tab).
2. In the measure grid, click an empty cell.
3. In the formula bar, above the table, type the following formula:
Internet Current Quarter Sales Performance :=IFERROR([Internet Current
Quarter Sales]/[Internet Previous Quarter Sales Proportion to
QTD],BLANK())
When you have finished building the formula, press ENTER.
This measure will serve as the Base measure for the KPI.
4. In the measure grid, right-click the Internet Current Quarter Sales Performance
measure, and then click Create KPI.
The Key Performance Indicator dialog box opens.
5. In the Key Performance Indicator dialog box, in Define Target Value, select the
Absolute Value option.
6. In the Absolute Value field, type 1.1, and then press ENTER.
7. In Define Status Thresholds, in the left (low) slider field, type 1, and then in the
right (high) slider field, type 1.07.
8. In Select Icon Style, select the diamond (red), triangle (yellow), circle (green) icon
type.
Tip
Notice the Descriptions expandable field below the available icon styles.
You can type descriptions for the various KPI elements to make them
more identifiable in client applications.
9. Click OK to complete the KPI.
In the measure grid, notice the icon next to the Internet Current Quarter Sales
Performance measure. This icon indicates that this measure serves as a Base
value for a KPI.
1. In the measure grid for the Internet Sales table, click an empty cell.
To create an Internet Current Quarter Sales Performance KPI
To create an Internet Current Quarter Margin Performance KPI

30
2. In the formula bar, above the table, type the following formula:
Internet Current Quarter Margin Performance :=IF([Internet Previous
Quarter Margin Proportion to QTD]<>0,([Internet Current Quarter Margin]-
[Internet Previous Quarter Margin Proportion to QTD])/[Internet Previous
Quarter Margin Proportion to QTD],BLANK())
When you have finished building the formula, press ENTER.
3. In the measure grid, right-click the Internet Current Quarter Margin
Performance measure, and then click Create KPI.
4. In the Key Performance Indicator dialog box, in Define Target Value, select the
Absolute Value option.
5. In the Absolute Value field, type 1.25.
6. In Define Status Thresholds, slide the left (low) slider field until the field displays
0.8, and then slide the right (high) slider field, until the field displays 1.03.
7. In Select Icon Style, select the diamond (red), triangle (yellow), circle (green) icon
type, and then click OK.
Next Step
To continue this tutorial, go to the next lesson:
Create Perspectives (Adventure Works
Lesson 9: Create Perspectives
In this lesson, you will create an Internet Sales perspective. A perspective defines a
viewable subset of a model that provides focused, business-specific, or application-
specific viewpoints. When a user connects to a model using a perspective, they see only
those model objects (tables, columns, measures, hierarchies, and KPIs) as fields defined
in that perspective.
The Internet Sales perspective you create in this lesson will exclude the Customer table
object. When you create a perspective that excludes certain objects from view, that
object still exists in the model; however, it is not visible in a reporting client field list.
Calculated columns and measures either included in a perspective or not can still
calculate from object data that is excluded.
The purpose of this lesson is to describe how to create perspectives and become familiar
with the tabular model authoring tools. If you later expand this model to include
additional tables, you can create additional perspectives to define different viewpoints of
the model, for example, Inventory and Sales Force.
To learn more, see
Perspectives (SSAS -Tabular Models)
Estimated time to complete this lesson: 5 minutes

31
Prerequisites
This topic is part of a tabular modeling tutorial, which should be completed in order.
Before performing the tasks in this lesson, you should have completed the previous
lesson:
Lesson: Create Key Performance Indicators
Create Perspectives
1. In the model designer, click the Model menu, and then click Perspectives.
2. In the Perspectives dialog box, click New Perspective.
3. To rename the perspective, double-click the New Perspective 1 column heading,
and then type Internet Sales.
4. In Fields, select the following tables Date, Geography, Product, Product
Category, Product Subcategory, and Internet Sales.
Notice you excluded the Customer table and all of its columns from this
perspective. Later, in Lesson 12, you will use the Analyze in Excel feature to test
this perspective. The Excel PivotTable Field List will include each table except the
Customer table.
5. Verify your selections, making sure the Customer table is not checked, and then
click OK
Next Steps
To continue this tutorial, go to the next lesson:
Lesson: Create Hierarchies (Adventure
Lesson 10: Create Hierarchies
In this lesson, you will create hierarchies. Hierarchies are groups of columns arranged in
levels; for example, a Geography hierarchy might have sub-levels for Country, State,
County, and City. Hierarchies can appear separate from other columns in a reporting
client application field list, making them easier for client users to navigate and include in
a report. To learn more, see
Hierarchies (SSAS -Tabular Models)
To create hierarchies, you will use the model designer in Diagram View. Creating and
managing hierarchies is not supported in the model designer in Data View.
Estimated time to complete this lesson: 20 minutes
To create an Internet Sales perspective

32
Prerequisites
This topic is part of a tabular modeling tutorial, which should be completed in order.
Before performing the tasks in this lesson, you should have completed the previous
lesson:
Create Hierarchies
1. In the model designer, click on the Model menu, then point to Model View, and
then click Diagram View.
Tip
Use the Minimap controls at the top-right of the model designer to
change how you can view objects in Diagram View. If you reposition
objects in Diagram View, that view will be retained when you save the
project.
2. In the model designer, right-click the Product table, and then click Create
Hierarchy. A new hierarchy appears at the bottom of the table window.
3. In the hierarchy name, rename the hierarchy by typing Category, and then press
ENTER.
4. In the Product table, click the Product Category Name column, then drag it to
the Category hierarchy, and then release on top of the Category name.
5. In the Category hierarchy, right-click the Product Category Name column, then
click Rename, and then type Category.
Note
Renaming a column in a hierarchy does not rename that column in the
table. A column in a hierarchy is just a representation of the column in the
table.
6. In the Product table, right-click the Product Subcategory Name column, then in
the context menu, point to Add to Hierarchy, and then click Category.
7. Rename Product Subcategory Name to Subcategory.
8. By using click and drag, or by using the Add to Hierarchy command in the
context menu, add the Model Name and Product Name columns (in order) and
place them beneath the Product Subcategory Name column. Rename these
columns Model and Product, respectively.
1. In the model designer, right-click the Date table, and then click Create
Hierarchy.
To create a Category hierarchy in the Product table
To create hierarchies in the Date table
33
2. Rename the hierarchy to Calendar.
3. Add the following columns, in-order, and then rename them:
Column
Rename to:
Calendar Year
Year
Calendar Semester
Semester
Calendar Quarter
Quarter
Month Calendar
Month
Day Of Month
Day
4. In the Date table, repeat the above steps, creating a Fiscal hierarchy, including
the following columns:
Column
Rename to:
Fiscal Year
Year
Fiscal Semester
Semester
Fiscal Quarter
Quarter
Month Calendar
Month
Day Of Month
Day
5. Finally, in the Date table, repeat the above steps, creating a Production
Calendar hierarchy, including the following columns:
Column
Rename to:
Calendar Year
Year
Week Number Of Year
Week
Day Of Week
Day
Next Steps
To continue this tutorial, go to the next lesson:

34
Lesson 11: Create Partitions
In this lesson, you will create partitions to divide the Internet Sales table into smaller
logical parts that can be processed (Refreshed) independent of other partitions. By
default, every table you include in your model has one partition which includes all of the
table’s columns and rows. For the Internet Sales table, we want to divide the data by
year; one partition for each of the table’s five years. Each partition can then be
processed independently. To learn more, see
Partitions (SSAS -Tabular Models)
Estimated time to complete this lesson: 15 minutes
Prerequisites
This topic is part of a tabular modeling tutorial, which should be completed in order.
Before performing the tasks in this lesson, you should have completed the previous
lesson:
Create Partitions
1. In the model designer, click on the Internet Sales table, then click on the Table
menu, and then click Partitions.
The Partition Manager dialog box opens.
2. In the Partition Manager dialog box, in Partitions, click the Internet Sales
partition.
3. In Partition Name, change the name to Internet Sales 2005.
Tip
Before continuing to the next step, notice the column names in the Table
Preview window display those columns included in the model table
(checked) with the column names from the source. This is because the
Table Preview window displays columns from the source table, not from
the model table.
4. Select the Query Editor button just above the right side of the preview window.
Because you want the partition to include only those rows within a certain period,
you must include a WHERE clause. You can only create a WHERE clause by using
a SQL Statement.
5. In the SQL Statement field, replace the existing statement by pasting in the
following statement:
SELECT
[dbo].[FactInternetSales].[ProductKey],
To create partitions in the Internet Sales table

35
[dbo].[FactInternetSales].[CustomerKey],
[dbo].[FactInternetSales].[PromotionKey],
[dbo].[FactInternetSales].[CurrencyKey],
[dbo].[FactInternetSales].[SalesTerritoryKey],
[dbo].[FactInternetSales].[SalesOrderNumber],
[dbo].[FactInternetSales].[SalesOrderLineNumber],
[dbo].[FactInternetSales].[RevisionNumber],
[dbo].[FactInternetSales].[OrderQuantity],
[dbo].[FactInternetSales].[UnitPrice],
[dbo].[FactInternetSales].[ExtendedAmount],
[dbo].[FactInternetSales].[UnitPriceDiscountPct],
[dbo].[FactInternetSales].[DiscountAmount],
[dbo].[FactInternetSales].[ProductStandardCost],
[dbo].[FactInternetSales].[TotalProductCost],
[dbo].[FactInternetSales].[SalesAmount],
[dbo].[FactInternetSales].[TaxAmt],
[dbo].[FactInternetSales].[Freight],
[dbo].[FactInternetSales].[CarrierTrackingNumber],
[dbo].[FactInternetSales].[CustomerPONumber],
[dbo].[FactInternetSales].[OrderDate],
[dbo].[FactInternetSales].[DueDate],
[dbo].[FactInternetSales].[ShipDate]
FROM [dbo].[FactInternetSales]
WHERE (([OrderDate] >= N'2005-01-01 00:00:00') AND
([OrderDate] < N'2006-01-01 00:00:00'))
This statement specifies the partition should include all of the data in those rows
where the OrderDate is for the 2005 calendar year as specified in the WHERE
clause.
6. Click Validate.
Notice a warning is displayed stating that certain columns are not present in
source. This is because in
, you renamed those
columns in the Internet Sales table in the model to be different from those same
columns at the source.

36
1. In the Partition Manager dialog box, in Partitions, click the Internet Sales 2005
partition you just created, and then Copy.
2. In Partition Name, type Internet Sales 2006.
3. In the SQL Statement, in-order for the partition to include only those rows for the
2006 year, replace the WHERE clause with the following:
WHERE (([OrderDate] >= N'2006-01-01 00:00:00') AND
([OrderDate] < N'2007-01-01 00:00:00'))
1. In the Partition Manager dialog box, click Copy.
2. In Partition Name, type Internet Sales 2007.
3. In Switch To, select Query Editor.
4. In the SQL Statement, in-order for the partition to include only those rows for the
2007 year, replace the WHERE clause with the following:
WHERE (([OrderDate] >= N'2007-01-01 00:00:00') AND
([OrderDate] < N'2008-01-01 00:00:00'))
1. In the Partition Manager dialog box, click New.
2. In Partition Name, type Internet Sales 2008.
3. In Switch To, select Query Editor.
4. In the SQL Statement, in-order for the partition to include only those rows for the
2008 year, replace the WHERE clause with the following:
WHERE (([OrderDate] >= N'2008-01-01 00:00:00') AND
([OrderDate] < N'2009-01-01 00:00:00'))
1. In the Partition Manager dialog box, click New.
2. In Partition Name, type Internet Sales 2009.
3. In Switch To, select Query Editor.
4. In the SQL Statement, in-order for the partition to include only those rows for the
2009 year, replace the WHERE clause with the following:
WHERE (([OrderDate] >= N'2009-01-01 00:00:00') AND
([OrderDate] < N'2010-01-01 00:00:00'))
To create a partition for the 2006 year in the Internet Sales table
To create a partition for the 2007 year in the Internet Sales table
To create a partition for the 2008 year in the Internet Sales table
To create a partition for the 2009 year in the Internet Sales table

37
Process Partitions
In the Partition Manager dialog box, notice the asterisk (*) next to the partition names
for each of the new partitions you just created. This indicates that the partition has not
been processed (refreshed). When you create new partitions, you should run a Process
Partitions or Process Table operation to refresh the data in those partitions.
1. Click OK to close the Partition Manager dialog box.
2. In the model designer, click the Internet Sales table, then click the Model menu,
then point to Process (Refresh), and then click Process Partitions.
3. In the Process Partitions dialog box, verify the Mode is set to Process Default.
4. Select the checkbox in the Process column for each of the five partitions you
created, and then click OK.
If you are prompted for Impersonation credentials, enter the Windows user name
and password you specified in Lesson 2, step 6.
The Data Process dialog box then appears and displays process details for each
partition. Notice that a different number of rows for each partition are
transferred. This is because each partition includes only those rows for the year
specified in the WHERE clause in the SQL Statement. There is no data for the
2010 year.
Next Steps
To continue this tutorial, go to the next lesson: Lesson:
Lesson 12: Create Roles
In this lesson, you will create roles. Roles provide model database object and data
security by limiting access to only those Windows users which are role members. Each
role is defined with a single permission: None, Read, Read and Process, Process, or
Administrator. Roles can be defined during model authoring by using the Role Manager
dialog box in SQL Server Data Tools. After a model has been deployed, you can manage
roles by using SQL Server Management Studio. To learn more, see
Creating roles is not necessary to complete this tutorial. By default, the account
you are currently logged in with will have Administrator privileges on the model.
However, to allow other users in your organization to browse the model by using
To process Internet Sales partitions
Note

38
a reporting client application, you must create at least one role with Read
permissions and add those users as members.
You will create three roles:
Sales Manager – This role can include users in your organization for which you want to
have Read permission to all model objects and data.
Sales Analyst US – This role can include users in your organization for which you want
only to be able to browse data related to sales in the US (United States). For this role,
you will use a DAX formula to define a Row Filter, which restricts members to browse
data only for the United States.
Administrator – This role can include users for which you want to have Administrator
permission, which allows unlimited access and permissions to perform administrative
tasks on the model database.
Because Windows user and group accounts in your organization are unique, you can add
accounts from your particular organization to members. However, for this tutorial, you
can also leave the members blank. You will still be able to test the effect of each role
later in Lesson 12: Analyze in Excel.
Estimated time to complete this lesson: 15 minutes
Prerequisites
This topic is part of a tabular modeling tutorial, which should be completed in order.
Before performing the tasks in this lesson, you should have completed the previous
lesson:
Create Roles
1. In SQL Server Data Tools, click on the Model menu, and then click Roles.
2. In the Role Manager dialog box, click New.
A new role with the None permission is added to the list.
3. Click on the new role, and then in the Name column, rename the role to Internet
Sales Manager.
4. In the Permissions column, click the dropdown list, and then select the Read
permission.
5. Optional: Click on the Members tab, and then click Add.
6. In the Select Users or Groups dialog box, enter the Windows users or groups
from your organization you want to include in the role.
7. Verify your selections, and then click OK
To create a Sales Manager user role
To create a Sales Analyst US user role

39
1. In SQL Server Data Tools, click on the Model menu, and then click Roles.
2. In the Role Manager dialog box, click New.
A new role with the None permission is added to the list.
3. Click on the new role, and then in the Name column, rename the role to Internet
Sales US.
4. In the Permissions column, click the dropdown list, and then select the Read
permission.
5. Click on the Row Filters tab, and then for the Geography table only, in the DAX
Filter column, type the following formula:
=Geography[Country Region Code] = "US"
A Row Filter formula must resolve to a Boolean (TRUE/FALSE) value. With this
formula, you are specifying that only rows with the Country Region Code value of
“US” be visible to the user.
When you have finished building the formula, press ENTER.
6. Optional: Click on the Members tab, and then click Add.
7. In the Select Users or Groups dialog box, enter the Windows users or groups
from your organization you want to include in the role.
8. Verify your selections, and then click OK
1. In the Role Manager dialog box, click New.
2. Click on the new role, and then in the Name column, rename the role to Internet
Sales Administrator.
3. In the Permissions column, click the dropdown list, and then select the
Administrator permission.
4. Click on the Members tab, and then click Add.
5. Optional: In the Select Users or Groups dialog box, enter the Windows users or
groups from your organization you want to include in the role.
6. Verify your selections, and then click OK
Next Steps
To continue this tutorial, go to the next lesson: Lesson:
Lesson 13: Analyze in Excel
In this lesson, you will use the Analyze in Excel feature in SQL Server Data Tools to open
Microsoft Excel, automatically create a data source connection to the model workspace,
To create an Administrator role

40
and automatically add a PivotTable to the worksheet. The Analyze in Excel feature is
meant to provide a quick and easy way to test the efficacy of your model design prior to
deploying your model. You will not perform any data analysis in this lesson. The purpose
of this lesson is to familiarize you, the model author, with the tools you can use to test
your model design. Unlike using the Analyze in Excel feature, which is meant for model
authors, end-users will use client reporting applications such as Excel or Power View to
connect to and browse deployed model data.
In order to complete this lesson, Excel must be installed on the same computer as SQL
Server Data Tools. To learn more, see
Analyze in Excel (SSAS -Tabular Models)
Estimated time to complete this lesson: 20 minutes
Prerequisites
This topic is part of a tabular modeling tutorial, which should be completed in order.
Before performing the tasks in this lesson, you should have completed the previous
lesson:
Browse using the Default and Internet Sales perspectives
In these first tasks, you will browse your model by using both the default perspective,
which includes all model objects, and also by using the Internet Sales perspective you
created in Lesson 8: Create Perspectives. The Internet Sales perspective excludes the
Customer table object.
1. In SQL Server Data Tools, click the Model menu, and then click Analyze in Excel.
2. In the Analyze in Excel dialog box, click OK.
Excel will open with a new workbook. A data source connection is created using
the current user account and the Default perspective is used to define viewable
fields. A Pivot table is automatically added to the worksheet.
3. In Excel, in the PivotTable Field List, notice the Date and Internet Sales
measures appear, as well as the Customer, Date, Geography, Product, Product
Category, Product Subcategory, and Internet Sales tables with all of their
respective columns appear.
4. Close Excel without saving the workbook.
1. In SQL Server Data Tools, click the Model menu, and then click Analyze in Excel.
2. In the Analyze in Excel dialog box, leave Current Windows User selected, then
in the Perspective drop-down listbox, select Internet Sales, and then click OK.
Excel opens.
3. In Excel, in the PivotTable Field List, notice the Customer table is excluded from
To browse by using the Default perspective
To browse by using the Internet Sales perspective

41
the field list.
Browse Using Roles
Roles are an integral part of any tabular model. Without at least one role, to which users
are added as members, users will not be able to access and analyze data using your
model. The Analyze in Excel feature provides a way for you to test the roles you have
defined.
1. In SQL Server Data Tools, click the Model menu, and then click Analyze in Excel.
2. In the Analyze in Excel dialog box, in Specify the user name or role to use to
connect to the model, select Role, and then in the drop-down listbox, select
Internet Sales Manager, and then click OK.
Excel will open with a new workbook. A Pivot table is automatically created. The
Pivot Table Field List includes all of the data fields available in your new model.
Next Steps
To continue this tutorial, go to the next lesson:
Lesson 14: Deploy
In this lesson, you will configure deployment properties; specifying a deployment server
instance of Analysis Services running in Tabular mode, and a name for the model you
deploy. You will then deploy the model to that instance. After it is deployed, users can
connect to the model by using a reporting client application. To learn more, see
Model Solution Deployment (SSAS)
Estimated time to complete this lesson: 5 minutes
Prerequisites
This topic is part of a tabular modeling tutorial, which should be completed in order.
Before performing the tasks in this lesson, you should have completed the previous
lesson:
Deploy the Model
1. In SQL Server Data Tools, in Solution Explorer, right-click on the Adventure
Works Internet Sales Tabular Model project, and then in the context menu,
To browse by using the Internet Sales Manager user role
To configure deployment properties

42
click Properties.
2. In the AW Internet Sales Tabular Model Property Pages dialog box, under
Deployment Server, in the Server property, type the name of an Analysis
Services instance running in Tabular mode. This will be the instance your model
will be deployed to.
Important
You must have Administrator permissions on a remote Analysis Services
instance in-order to deploy to it.
3. Verify the Query Mode property is set to In-Memory.
Note
The model created by using this tutorial is not supported in DirectQuery
mode.
4. In the Database property, type Adventure Works Internet Sales Model.
5. In the Cube Name property, type Adventure Works Internet Sales Model.
6. Verify your selections and then click OK.
1. In SQL Server Data Tools, click the Build menu, and then click Deploy AW
Internet Sales Tabular Model.
The Deploy dialog box appears and displays the deployment status of the
metadata as well as each table included in the model.
Conclusion
Congratulations! You are finished authoring and deploying your first Analysis Services
tabular model. This tutorial has helped guide you through completing the most common
tasks in creating a tabular model. Now that your Adventure Works Internet Sales Model
is deployed, you can use SQL Server Management Studio to manage the model; create
process scripts and a backup plan. Users can connect to the model using a reporting
client application such as Microsoft Excel or Power View.
Additional Resources
To learn more about tabular model properties that support Power View reports, see
http://go.microsoft.com/fwlink/?LinkId=220897
To see a tutorial about how to configure tabular model reporting properties for Power
View, see
http://go.microsoft.com/fwlink/?LinkId=219995
See Also
To deploy the Adventure Works Internet Sales tabular model
43
Configure Default Data Modeling and Deployment Properties (SSAS)
Tabular Model Databases (SSAS)
Supplemental Lessons
This section provides additional information and lessons on how to use advanced tabular
model features.
Additional lessons and information may be added to this section on an on-going
basis. Check back often.
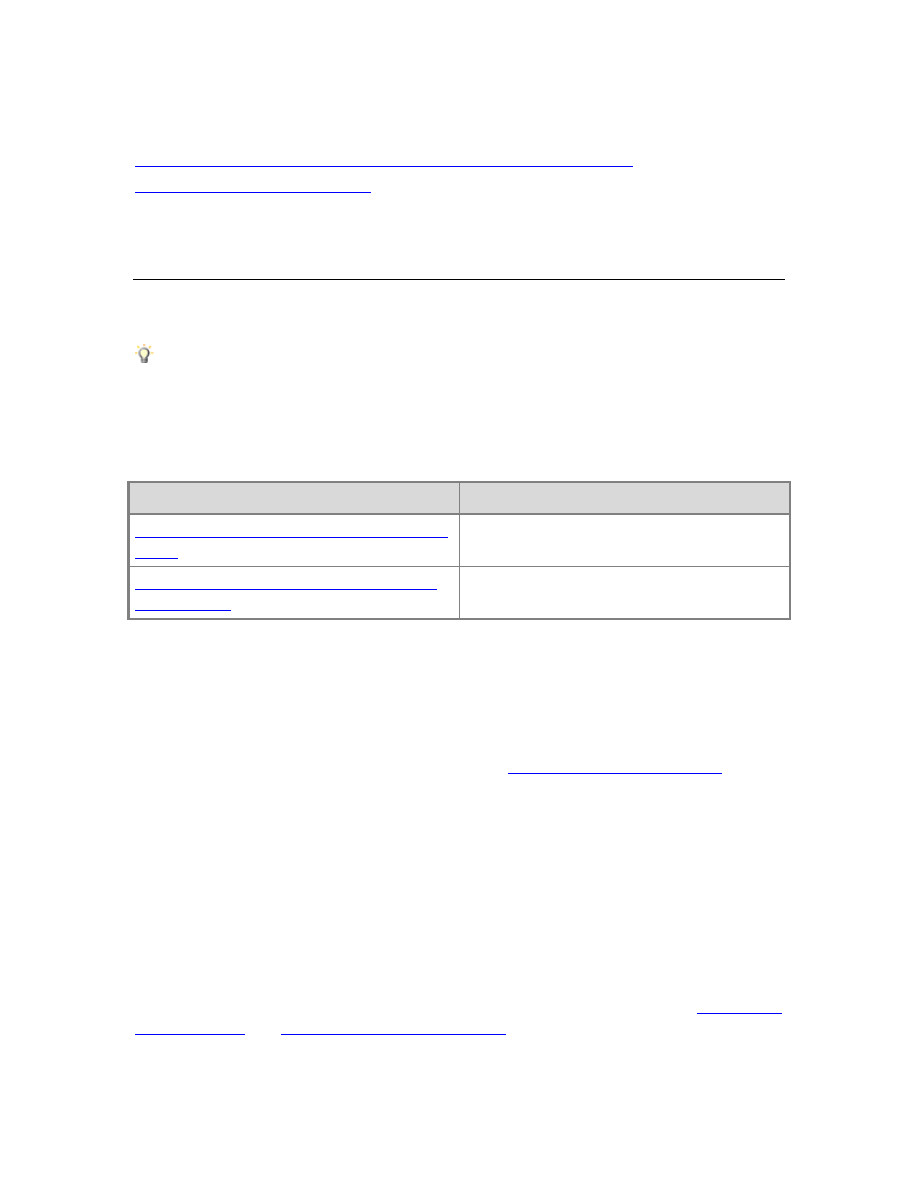
Supplemental Lessons
Lesson
Time to complete
Implement Dynamic Security by Using Row
Filters
30
Configure Reporting Properties for Power
View Reports
30
Implement Dynamic Security by Using Row Filters
In this supplemental lesson, you will create an additional role that implements dynamic
security. Dynamic security provides row-level security based on the user name or login id
of the user currently logged on. To learn more, see
To implement dynamic security, you must add a table to your model containing the
Windows user names of those users that can create a connection to the model as a data
source and browse model objects and data. The model you create using this tutorial is in
the context of Adventure Works Corp.; however, in order to complete this lesson, you
must add a table containing users from your own domain. You will not need the
passwords for the user names that will be added. To create an Employee Security table,
with a small sample of users from your own domain, you will use the Paste feature,
pasting employee data from an Excel spreadsheet. In a real-world scenario, the table
containing user names you add to a model would typically use a table from an actual
database as a data source; for example, a real dimEmployee table.
In order to implement dynamic security, you will use two new DAX functions:
. These functions, applied in a row
filter formula, are defined in a new role. Using the LOOKUPVALUE function, the formula
Tip

44
specifies a value from the Employee Security table and then passes that value to the
USERNAME function, which specifies the user name of the user logged on belongs to
this role. The user can then browse only data specified by the role’s row filters. In this
scenario, you will specify that sales employees can only browse internet sales data for the
sales territories in which they are a member.
In order to complete this supplemental lesson, you will complete a series of tasks. Those
tasks that are unique to this Adventure Works tabular model scenario, but would not
necessarily apply to a real-world scenario, are identified as such. Each task includes
additional information describing the purpose of the task.
Estimated time to complete this lesson: 30 minutes
Prerequisites
This supplemental lesson topic is part of a tabular modeling tutorial, which should be
completed in order. Before performing the tasks in this supplemental lesson, you should
have completed all previous lessons.
Add the dimSalesTerritory table to the AW Internet Sales Tabular Model
Project
In order to implement dynamic security for this Adventure Works scenario, you must add
two additional tables to your model. The first table you will add is dimSalesTerritory (as
Sales Territory) from the same AdventureWorksDW2012 database. You will later apply a
row filter to the Sales Territory table that defines the particular data the logged on user
can browse.
1. In SQL Server Data Tools, click on the Model menu, and then click Existing
Connections.
2. In the Existing Connections dialog box, verify the Adventure Works DB from
SQL data source connection is selected, and then click Open.
If the Impersonation Credentials dialog box appears, type the impersonation
credentials you used in Lesson 2: Add Data.
3. On the Choose How to Import the Data page, leave Select from a list of
tables and views to choose the data to import selected, and then click Next.
4. On the Select Tables and Views page, select the DimSalesTerritory table.
5. In the Friendly Name column, type Sales Territory.
6. Click Preview and Filter.
7. Deselect the SalesTerritoryAlternateKey column, and then click Ok.
8. On the Select Tables and Views page, click Finish.
The new table will be added to the model workspace. Objects and data from the
To add the dimSalesTerritory table
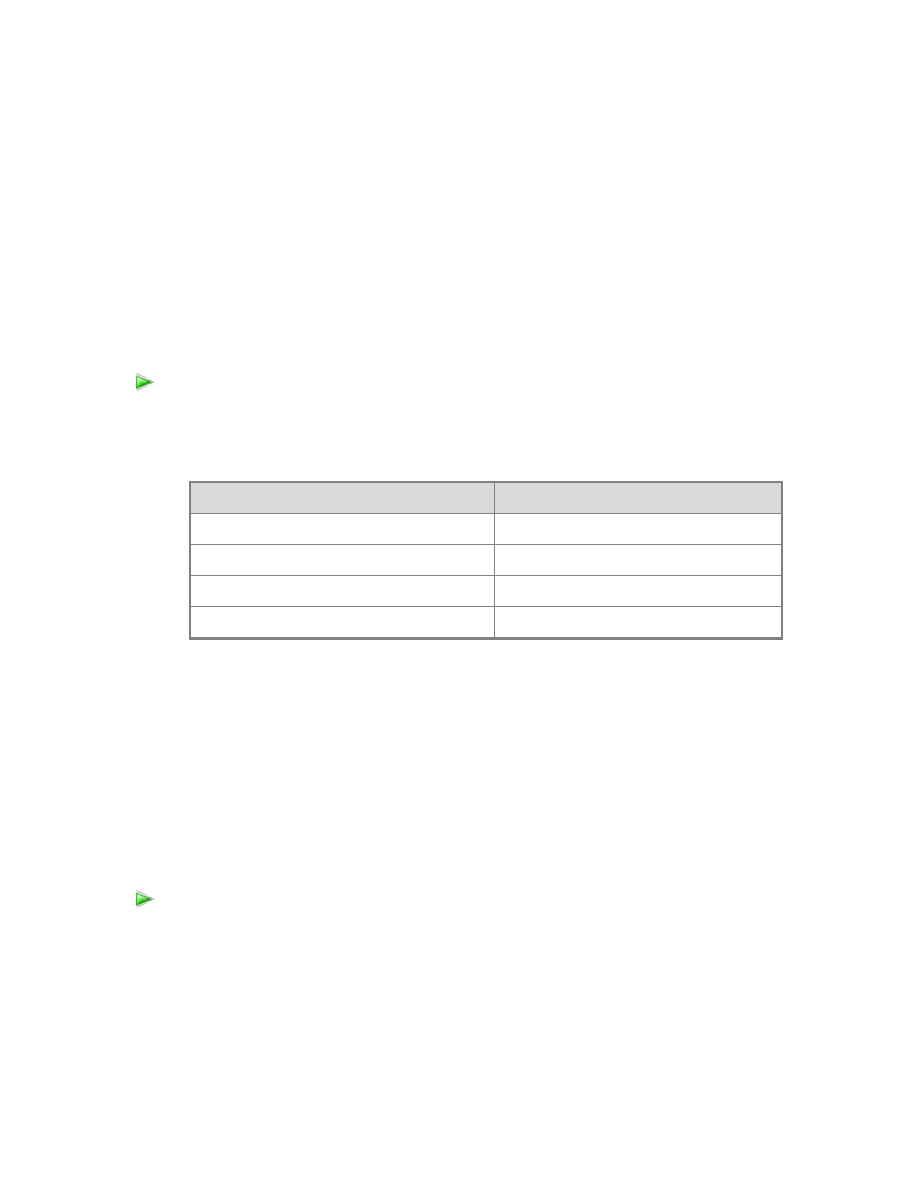
45
source dimSalesTerritory table are then imported into the new Sales Territory
table in your AW Internet Sales Tabular Model.
9. After the table has been imported, click Close.
Give the Columns Friendly Names
In this task, you will rename the columns in the Sales Territory table, giving them friendly
names. It is not always necessary to give tables and/or columns friendly names. It does,
however, make your model project easier to navigate in the model designer as well as for
users browsing model objects and data in a client application field list.
In the model designer, rename the columns in the Sales Territory table:
Sales Territory
Source Name
Friendly Name
SalesTerritoryKey
Sales Territory Id
SalesTerritoryRegion
Sales Territory Region
SalesTerritoryCountry
Sales Territory Country
SalesTerritoryGroup
Sales Territory Group
Add a table with user name data
Because the dimEmployee table in the AdventureWorksDW2012 sample database
contains users from the AdventureWorks domain, and those user names do not exist in
your own environment, you must create a table in your model that contains a small
sample (three) of actual users from your organization. You will then add these users as
members to the new role. You do not need the passwords for the sample user names,
but you will need actual Windows user names from your own domain.
1. Open Microsoft Excel, creating a new worksheet.
2. Copy the following table, including the header row, and then paste it into the
worksheet.
To rename Columns in the Sales Territory Table
To add an Employee Security table
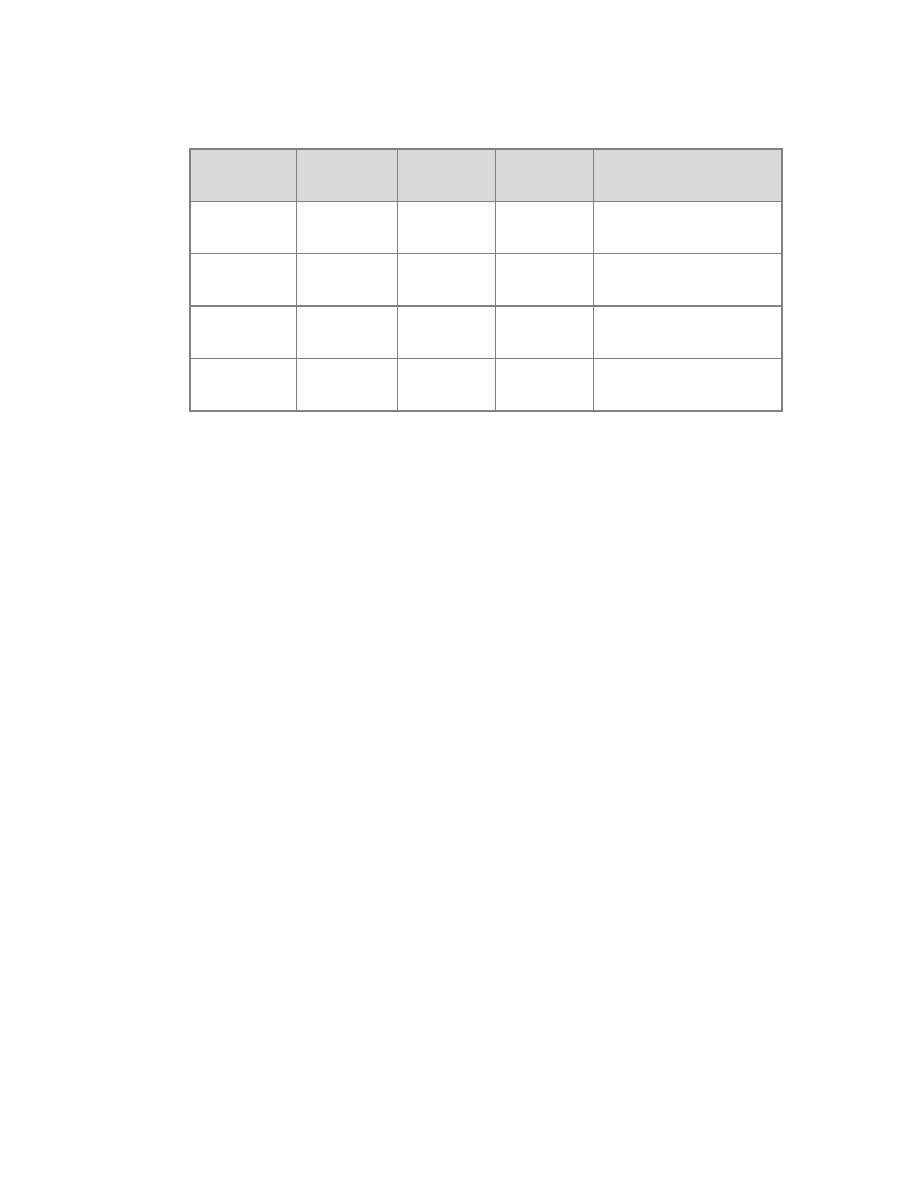
46
Employee Id
Sales
Territory Id
First Name
Last Name
Login Id
1
2
<user first
name>
<user last
name>
<domain\username>
1
3
<user first
name>
<user last
name>
<domain\username>
2
4
<user first
name>
<user last
name>
<domain\username>
3
5
<user first
name>
<user last
name>
<domain\username>
3. In the new worksheet, replace the first name, last name, and domain\username
with the names and login ids of three users in your organization. Put the same
user on the first two rows, for Employee Id 1. This will show this user belongs to
more than one sales territory. Leave the Employee Id and Sales Territory Id fields
as they are.
4. Save the worksheet as Sample Employee.
5. In the worksheet, select all of the cells with employee data, including the headers,
then right click the selected data, and then click Copy.
6. In SQL Server Data Tools, click the Edit menu, and then click Paste.
If Paste is greyed out, click any column in any table in the model designer
window, and then click the Edit menu, and then click Paste.
7. In the Paste Preview dialog box, in Table Name, type Employee Security.
8. In Data to be pasted, verify the data includes all of the user data and headers
from the Sample Employee worksheet.
9. Verify Use first row as column headers is checked, and then click Ok.
A new table named Employee Security with employee data copied from the
Sample Employee worksheet is created.
Create Relationships Between Internet Sales, Geography, and Sales Territory
table
The Internet Sales, Geography, and Sales Territory table all contain a common column,
Sales Territory Id. The Sales Territory Id column in the Sales Territory table contains
values, a different Id for each sales territory.

47
1. In the model designer, in Diagram View, in the Geography table, click and hold
on the Sales Territory Id column, then drag the cursor to the Sales Territory Id
column in the Sales Territory table, and then release.
2. In the Internet Sales table, click and hold on the Sales Territory Id column, then
drag the cursor to the Sales Territory Id column in the Sales Territory table, and
then release.
Notice the Active property for this relationship is False, meaning it is inactive. This
is because the Internet Sales table already has another active relationship that is
used in measures.
Hide the Employee Security Table from Client Applications
In this task, you will hide the Employee Security table, keeping it from appearing in a
client application’s field list. Keep in-mind that hiding a table does not secure it. Users
can still query Employee Security table data if they know how. In order to secure the
Employee Security table data, preventing users from being able to query any of its data,
you will apply a filter in a later task.
In the model designer, in Diagram View, right-click the Employee table heading,
and then click Hide from Client Tools.
Create a Sales Employees by Territory user role
In this task, you will create a new user role. This role will include a row filter defining
which rows of the Sales Territory table are visible to users. The filter is then applied in the
one-to many relationship direction to all other tables related to Sales Territory. You will
also apply a simple filter that secures the entire Employee Security table from being
queryable by any user that is a member of the role.
The Sales Employees by Territory role you create in this lesson restricts members
to browse (or query) only sales data for the sales territory to which they belong. If
you add a user as a member to the Sales Employees by Territory role that also
exists as a member in a role created in
, you will get a
combination of permissions. When a user is a member of multiple roles, the
permissions, and row filters defined for each role are cumulative. That is, the user
will have the greater permissions determined by the combination of roles.
To create relationships between the Internet Sales, Geography, and the Sales
Territory table
To hide the Employee Table from client applications
Note
To create a Sales Employees by Territory user role

48
1. In SQL Server Data Tools, click the Model menu, and then click Roles.
2. In the Role Manager dialog box, click New.
A new role with the None permission is added to the list.
3. Click on the new role, and then in the Name column, rename the role to Sales
Employees by Territory.
4. In the Permissions column, click the dropdown list, and then select the Read
permission.
5. Click on the Members tab, and then click Add.
6. In the Select User or Group dialog box, in Enter the object named to select,
type the first sample user name you used when creating the Employee Security
table. Click Check Names to verify the user name is valid, and then click Ok.
Repeat this step, adding the other sample user names you used when creating
the Employee Security table.
7. Click on the Row Filters tab.
8. For the Employee Security table, in the DAX Filter column, type the following
formula.
=FALSE()
When you have finished building the formula, press ENTER.
This formula specifies that all columns resolve to the false Boolean condition;
therefore, no columns for the Employee Security table can be queried by a
member of the Sales Employees by Territory user role.
9. For the Sales Territory table, type the following formula.
='Sales Territory'[Sales Territory Id]=LOOKUPVALUE('Employee
Security'[Sales Territory Id], 'Employee Security'[Login Id], USERNAME(),
'Employee Security'[Sales Territory Id], 'Sales Territory'[Sales Territory Id])
When you have finished building the formula, press ENTER.
In this formula, the LOOKUPVALUE function returns all values for the Employee
Security[Sales Territory Id] column, where the Employee Security[Login Id] is the
same as the current logged on Windows user name, and Employee Security[Sales
Territory Id] is the same as the Sales Territory[Sales Territory Id].
The set of Sales Territory IDs returned by LOOKUPVALUE is then used to restrict
the rows shown in the Sales Territory table. Only rows where the Sales Territory
ID for the row is in the set of IDs returned by the LOOKUPVALUE function are
displayed.
10. In the Role Manager dialog box, click Ok.

49
Test the Sales Employees by Territory User Role
In this task, you will use the Analyze in Excel feature in SQL Server Data Tools to test the
efficacy of the Sales Employees by Territory user role. You will specify one of the user
names you added to the Employee Security table and as a member of the role. This user
name will then be used as the effective user name in the connection created between
Excel and the model.
1. In SQL Server Data Tools, click the Model menu, and then click Analyze in Excel.
2. In the Analyze in Excel dialog box, in Specify the user name or role to use to
connect to the model, select Other Windows User, and then click Browse.
3. In the Select User or Group dialog box, in Enter the object name to select,
type one of the user names you included in the Employee table, and then click
Check Names.
4. Click Ok to close the Select User or Group dialog box, and then click Ok to close
the Analyze in Excel dialog box.
Excel will open with a new workbook. A Pivot table is automatically created. The
Pivot Table Field List includes most of the data fields available in your new model.
Notice the Employee Security table is not visible in the Pivot Table Field List. This
is because you chose to hide this table from client tools in a previous task.
5. In the Pivot Table Field list, in ∑ Internet Sales (measures), select the Internet
Total Sales measure. The measure will be entered into the Values fields.
6. In the Pivot Table Field list, select the Sales Territory Id column from the Sales
Territory table. The column will be entered into the Row Labels fields.
Notice Internet sales figures appear only for the one region to which the effective
user name you used belongs. If you select another column; for example, City,
from the Geography table as Row Label field, only cities in the sales territory to
which the effective user belongs are displayed.
This user cannot browse or query any Internet sales data for territories other than
the one they belong because the row filter defined for the Sales Territory table in
the Sales Employees by Territory user role effectively secures data for all data
related to other sales territories.
See Also
To test the Sales Employees by Territory user role

50
Configure Reporting Properties for Power View
Reports
In this supplemental lesson, you will set reporting properties for the Adventure Works
Internet Sales Model project. Reporting properties make it easier for end-users to select
and display model data in Power View. You will also set properties to hide certain
columns and tables, and create new data for use in charts.
After completing this lesson and re-deploying the model to a Analysis Services instance
integrated with SharePoint and Reporting Services, you can create a data source, specify
the data connection information, launch Power View, and design reports against the
model.
This lesson does not describe how to create and use Power View reports. This lesson is
meant to provide tabular model authors an introduction to those properties and settings
that affect how model data will appear in Power View. To learn more about creating
Power View reports, see
Tutorial: Create a Sample Report in Power View
Estimated time to complete this lesson: 30 minutes
Prerequisites
This supplemental lesson is part of a tabular modeling tutorial, which should be
completed in order. Before performing the tasks in this supplemental lesson, you should
have completed all previous lessons.
In order to complete this particular supplemental lesson, you must also have the
following:
The Adventure Works Internet Sales Model (completed through this tutorial) ready to
be deployed or already deployed to an Analysis Services instance running in Tabular
mode.
A SharePoint site integrated with SQL Server 2012 Analysis Services (SSAS) running in
Tabular mode and SQL Server 2012 Reporting Services (SSRS), configured to
support Power View reports.
You must have sufficient permissions to create a data connection on the SharePoint
site that points to the Adventure Works Internet Sales Model.
Model Properties that Affect Reporting
When authoring a tabular model, there are certain properties that you can set on
individual columns and tables to enhance the end-user reporting experience in Power
View. In addition, you can create additional model data to support data visualization and
other features specific to the reporting client. For the sample Adventure Works Internet
Sales Model, here are some of the changes you will make:
Add new data – Adding new data in a calculated column by using a DAX formula
creates date information in a format that is easier to display in charts.

51
Hide tables and columns that are not useful to the end user - The Hidden
property controls whether tables and table columns are displayed in the reporting
client. Items with that are hidden are still part of the model and remain available for
queries and calculations.
Enable one-click tables – By default, no action occurs if an end-user clicks a table in
the field list. To change this behavior so that a click on the table adds the table to the
report, you will set Default Field Set on each column that you want to include in the
table. This property is set on the table columns that end users will most likely want to
use.
Set grouping where needed - The Keep Unique Rows property determines if the
values in the column should be grouped by values in a different field, such as an
identifier field. For columns that contain duplicate values such as Customer Name
(for example, multiple customers named John Smith), it is important to group (keep
unique rows) on the Row Identifier field in order to provide your end users with the
correct results.
Set data types and data formats - By default, Power View applies rules based on
column data type to determine whether the field can be used as a measure. Because
each data visualization in Power View also has rules about where measures and non-
measures can be placed, it is important to set the data type in the model, or override
the default, to achieve the behavior you want for your end-user.
Set the Sort by Column property – The Sort By Column property specifies if the
values in the column should be sorted by values in a different field. For example, on
the Month Calendar column that contains the month name, sort by the column
Month Number.
Hide Tables from Client Tools
Because there is already a Product Category calculated column and Product Subcategory
calculated column in the Product table, it is not necessary to have the Product Category
and Product Subcategory tables visible to client applications.
1. In the model designer, right-click on the Product Category table (tab), and then
click Hide from Client Tools.
2. Right-click on the Product Subcategory table (tab), and then click Hide from
Client Tools.
Create New Data for Charts
Sometimes it may be necessary to create new data in your model by using DAX formulas.
In this task, you will add two new calculated columns to the Date table. These new
columns will provide date fields in a format convenient for use in charts.
To hide the Product Category and Product Subcategory tables
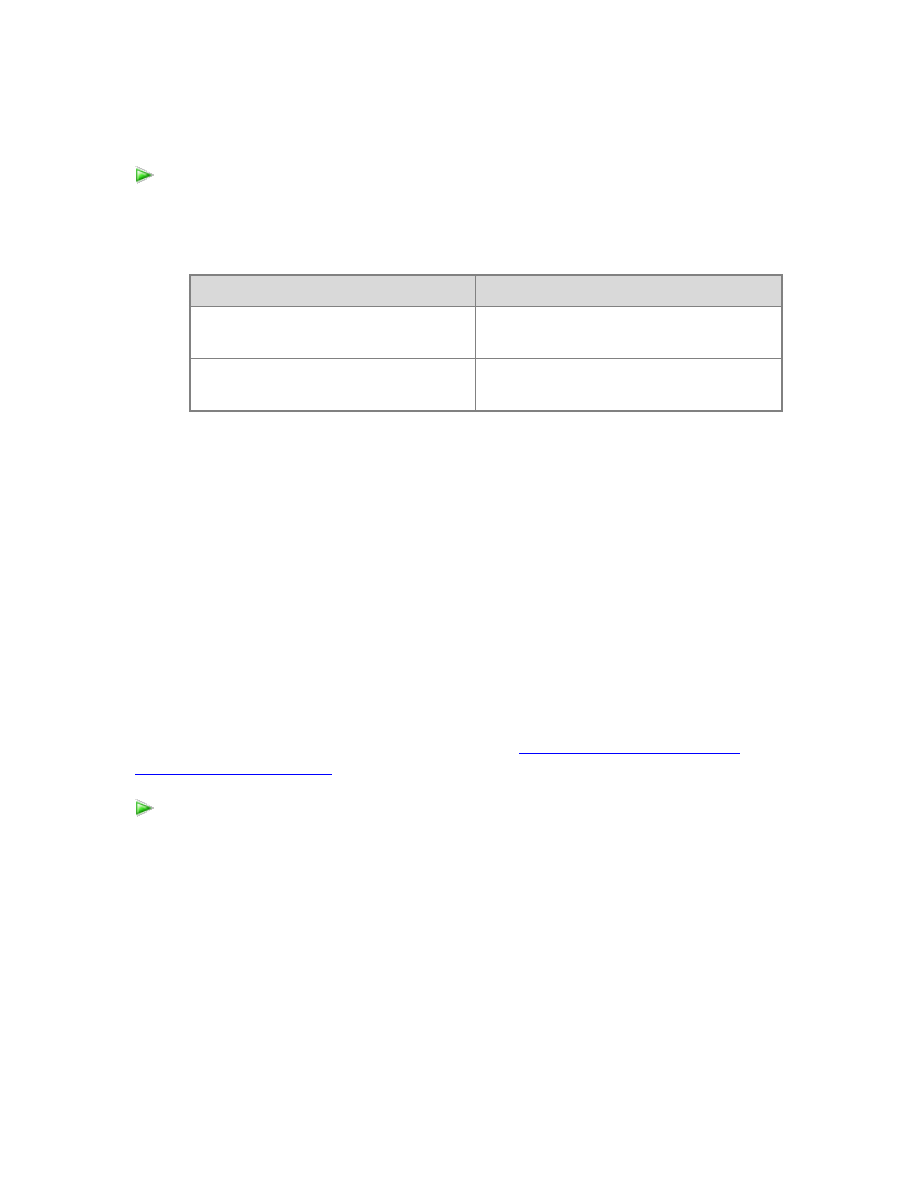
52
1. In the Date table, scroll to the far right, and then click on Add Column.
2. Add two new calculated columns using the following formulas in the formula bar:
Column Name
Formula
Year Quarter
=[Calendar Year] & " Q" & [Calendar
Quarter]
Year Month
=[Calendar Year] &
FORMAT([Month],"#00")
Default Field Set
The Default Field Set is a predefined list of columns and measures for a table that are
automatically added to the Power View report canvas when the table is clicked on in the
report field list. Essentially, you can specify the default columns, measures, and field
ordering users will want to see when this table is visualized in Power View reports. For
the Internet Sales model, you will define a default field set and order for the Customer,
Geography, and Product tables. Included are only those most common columns that
users will want to see when analyzing Adventure Works Internet Sales data by using
Power View reports.
Default Field Set dialog box
02231061-2cd7-4070-833a-2f6742d6175b
For detailed information about Default Field Set, see
Configure Default Field Set for
1. In the model designer, click the Customer table (tab).
2. In the Properties window, under Reporting Properties, in the Default Field Set
property, click Click to edit to open the Default Field Set dialog box.
3. In the Default Field Set dialog box, in the Fields in the table list box, press Ctrl,
and select the following fields, and then click Add.
Birth Date, Customer Alternate Id, First Name, Last Name.
4. In the Default fields, in order window, use the Move Up and Move Down
buttons to put the following order:
Customer Alternate Id
To create new data for charts
To set Default Field Set for tables

53
First Name
Last Name
Birth Date.
5. Click Ok to close the Default Field Set dialog box for the Customer table.
6. Perform these same steps for the Geography table, selecting the following fields
and putting them in this order.
City, State Province Code, State Region Code.
7. Finally, perform these same steps for the Product table, selecting the following
fields and putting them in this order.
Product Alternate Id, Product Name.
Table Behavior
By using Table Behavior properties, you can change the default behavior for different
visualization types and grouping behavior for tables used in Power View reports. This
allows better default placement of identifying information such as names, images, or
titles in tile, card, and chart layouts.
Table Behavior dialog box
3b8932f9-9de2-44a8-b9f8-cd9edeb53b48
For detailed information about Table Behavior properties, see
Properties for Power View Reports (SSAS)
1. In the model designer, click the Customer table (tab).
2. In the Properties window, in the Table Behavior property, click Click to edit, to
open the Table Behavior dialog box.
3. In the Table Behavior dialog box, in the Row Identifier dropdown list box,
select the Customer Id column.
4. In the Keep Unique Rows list box, select First Name and Last Name.
This property setting specifies these columns provide values that should be
treated as unique even if they are duplicates, for example, when two or more
employees share the same name.
5. In the Default Label dropdown list box, select the Last Name column.
This property setting specifies this column provides a display name to represent
row data.
6. Repeat these steps for the Geography table, selecting the Geography Id column
as the Row Identifier, and the City column in the Keep Unique Rows list box.
To set Table Behavior for tables

54
You do not need to set a Default Label for this table.
7. Repeat these steps, for the Product table, selecting the Product Id column as the
Row Identifier, and the Product Name column in the Keep Unique Rows list
box. For Default Label, select Product Alternate Id.
Reporting Properties for Columns
There are a number of basic column properties and specific reporting properties on
columns you can set to improve the model reporting experience. For example, it may not
be necessary for users to see every column in every table. Just as you hid the Product
Category and Product Subcategory tables earlier, by using a column’s Hidden property,
you can hide particular columns from a table that is otherwise shown. Other properties,
such as Data Format and Sort by Column, can also affect how column data can appear in
reports. You will set some of those on particular columns now. Other columns require no
action, and are not shown below.
You will only set a few different column properties here, but there are many others. For
more detailed information about column reporting properties, see
1. In the model designer, click the Customer table (tab).
2. Click on the Customer Id column to display the column properties in the
Properties window.
3. In the Properties window, set the Hidden property to True. The Customer Id
column then becomes greyed out in the model designer.
4. Repeat these steps, setting the following column and reporting properties for
each table specified. Leave all other properties at their default settings.
Customer
Column
Property
Value
Geography Id
Hidden
True
Birth Date
Data Format
Short Date
Date
nNote
Because the Date table was selected as the models date table by using
the Mark as Date Table setting, in Lesson 7: Mark as Date Table, and the
To set properties for columns
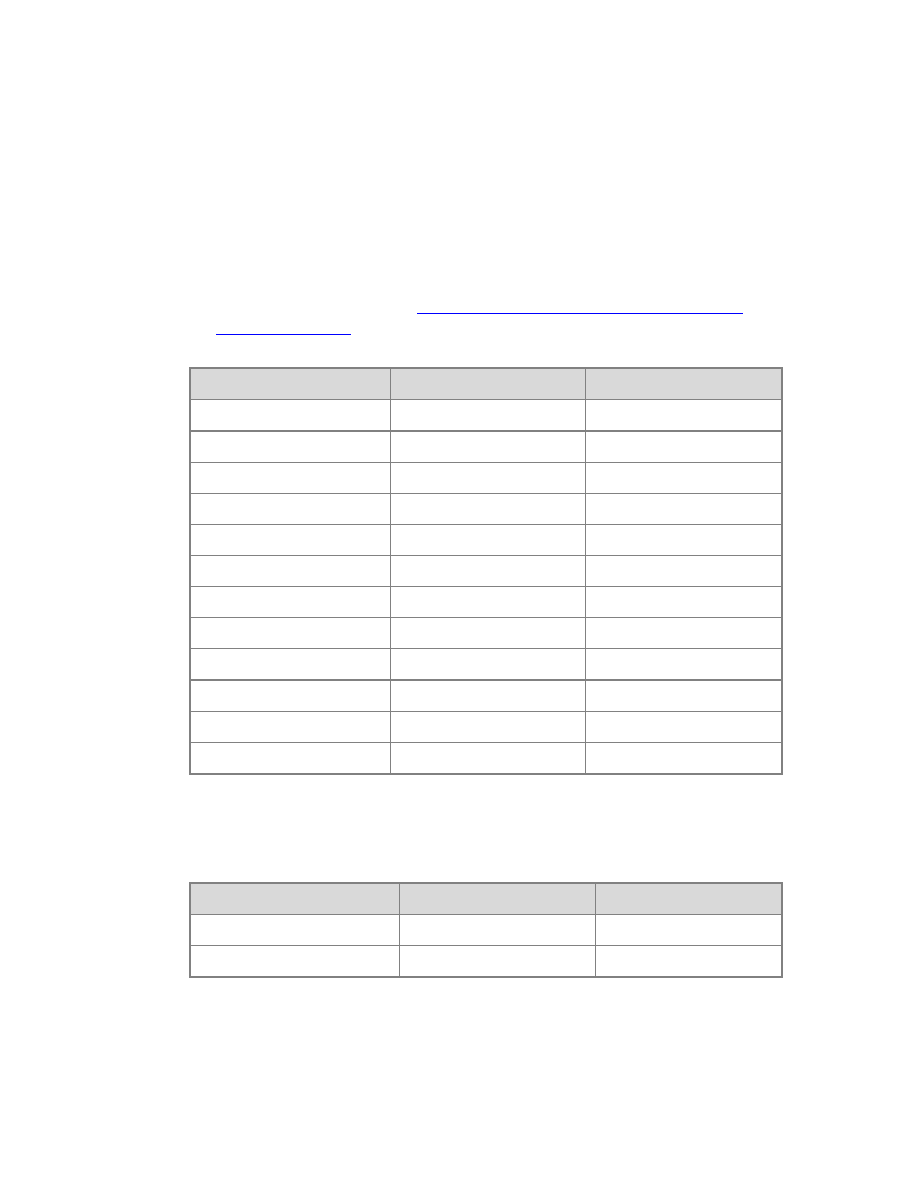
55
Date column in the Date table as the column to be used as the unique
identifier, the Row Identifier property for the Date column will
automatically be set to True, and cannot be changed. When using time-
intelligence functions in DAX formulas, you must specify a date table. In
this model, you created a number of measures using time-intelligence
functions to calculate sales data for various periods such as previous and
current quarters, and also for use in KPIs. For more information about
specifying a date table, see
Specify Mark as Date Table for use with Time
in SQL Server Books Online.
Column
Property
Value
Date
Data Format
Short Date
Day Number of Week
Hidden
True
Day Name
Sort By Column
Day Number of Week
Day of Week
Hidden
True
Day of Month
Hidden
True
Day of Year
Hidden
True
Month Name
Sort By Column
Month
Month
Hidden
True
Month Calendar
Hidden
True
Fiscal Quarter
Hidden
True
Fiscal Year
Hidden
True
Fiscal Semester
Hidden
True
Geography
Column
Property
Value
Geography Id
Hidden
True
Sales Territory Id
Hidden
True
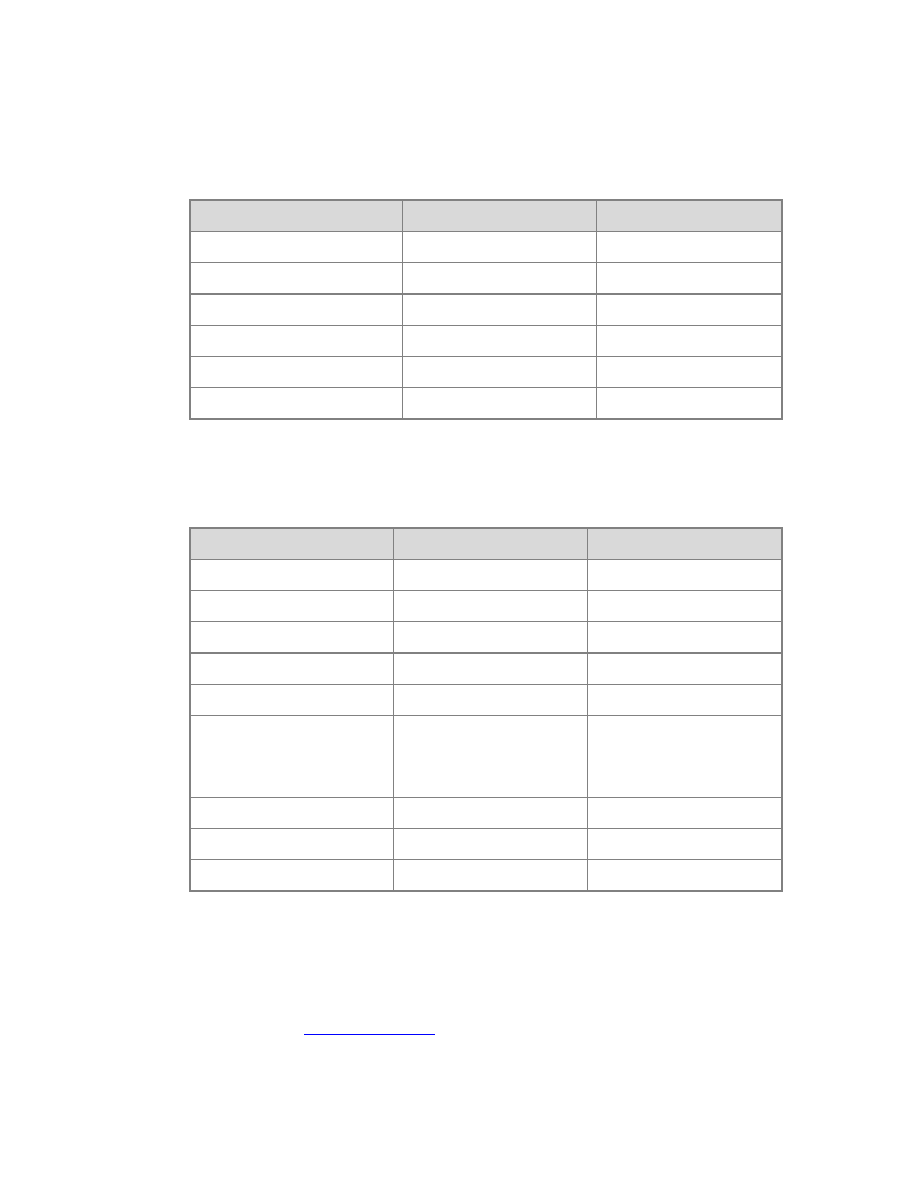
56
Product
Column
Property
Value
Product Id
Hidden
True
Product Alternate Id
Default Label
True
Product Subcategory Id
Hidden
True
Product Start Date
Data Format
Short Date
Product End Date
Data Format
Short Date
Large Photo
Hidden
True
Internet Sales
Column
Property
Value
Product Id
Hidden
True
Customer Id
Hidden
True
Promotion Id
Hidden
True
Currency Id
Hidden
True
Sales Territory Id
Hidden
True
Order Quantity
Data Type
Data Format
Decimal Places
Decimal Number
Decimal Number
0
Order Date
Data Type
Short Date
Due Date
Data Type
Short Date
Ship Date
Data Type
Short Date
Redeploy the Adventure Works Internet Sales tabular model
Because you have changed the model, you must re-deploy it. You will essentially repeat
the tasks performed in

57
In SQL Server Data Tools, click the Build menu, and then click Deploy Adventure
Works Internet Sales Model.
The Deploy dialog box appears and displays the deployment status of the
metadata as well as each table included in the model.
Next Steps
You can now use Power View to visualize data from the model. Ensure the Analysis
Services and Reporting Services accounts on the SharePoint site have read permissions
to the Analysis Services instance where you deployed your model.
To create a Reporting Services report data source that points to your model, see
To redeploy the Adventure Works Internet Sales tabular model
Document Outline
- Cover
- Contents
- Tabular Modeling (Adventure Works Tutorial)
- Lesson 1: Create a New Tabular Model Project
- Lesson 2: Add Data
- Lesson 3: Rename Columns
- Lesson 4: Mark as Date Table
- Lesson 5: Create Relationships
- Lesson 6: Create Calculated Columns
- Lesson 7: Create Measures
- Lesson 8: Create Key Performance Indicators
- Lesson 9: Create Perspectives
- Lesson 10: Create Hierarchies
- Lesson 11: Create Partitions
- Lesson 12: Create Roles
- Lesson 13: Analyze in Excel
- Lesson 14: Deploy
- Supplemental Lessons
Wyszukiwarka
Podobne podstrony:
SQL Server 2012 Tutorials Writing Transact SQL Statements
Microsoft Press eBook Introducing Microsoft SQL Server 2012 PDF
5 Tips for a Smooth SSIS Upgrade to SQL Server 2012
Microsoft SQL Server 2012 Krok po kroku LeBlanc Patrick
Vademecum Administratora Microsoft SQL Server 2012 e 093c
crack para sql server 2012
Apress Pro SQL Server 2005 Reporting Services (2006)
Windows Server 2012 R2 Remote Desktop Services Licensing Datasheet
Apress Pro SQL Server 2005 Reporting Services (2006)
ebook microsoft sql server black book cff45xf7ii4jb4gq3rzk3uhmzhx5z3u62hytpuy CFF45XF7II4JB4GQ3RZK3
Egzamin 70412 Konfigurowanie zaawansowanych uslug Windows Server 2012 R2 Dillard Kurt
więcej podobnych podstron