140
PRZEGLĄD ELEKTROTECHNICZNY, ISSN 0033-2097, R. 84 NR 8/2008
Grażyna GILEWSKA, Marian GILEWSKI
Bialystok Technical University
Digital control methods of LED and LED lamps
Abstract. This paper presents an overview of digital control methods of LEDs that are currently available. There are a few methods of control: PWM
method, pulse level correcting method and digital control of RGB LEDs. Circuit’s examples of supply LED of every method are presented. Optical
frequency response of pulse driving LED is discussed. The questions of thermal and long time stabilization of LEDs power are described too. In the
final part, measure problem of switched light source is presented.
Streszczenie. W referacie opisan
o cyfrowe metody sterowania diod elektroluminescencyjnych i ich zespołów. W szczególności scharakteryzowano
następujące metody: regulacji współczynnika wypełnienia impulsu, regulacji amplitudy impulsu oraz cyfrowego sterowania diod RGB. Przedstawiono
wybra
ne układy pracy diod elektroluminescencyjnych. Omówiono również częstotliwościowe charakterystyki emisyjne diod, zagadnienie stabilizacji
mocy emitowanej oraz techniczne problemy pomiaru parametrów świetlnych źródeł sterowanych impulsowo. (Cyfrowe metody sterowania diod
elektroluminescencyjnych i lamp LED).
Keywords: LED driving techniques, variable current source, digital dimming of LED lamps.
Słowa kluczowe: metody zasilania LED, regulowane źródło prądowe, cyfrowe przygaszanie lamp LED.
Introduction
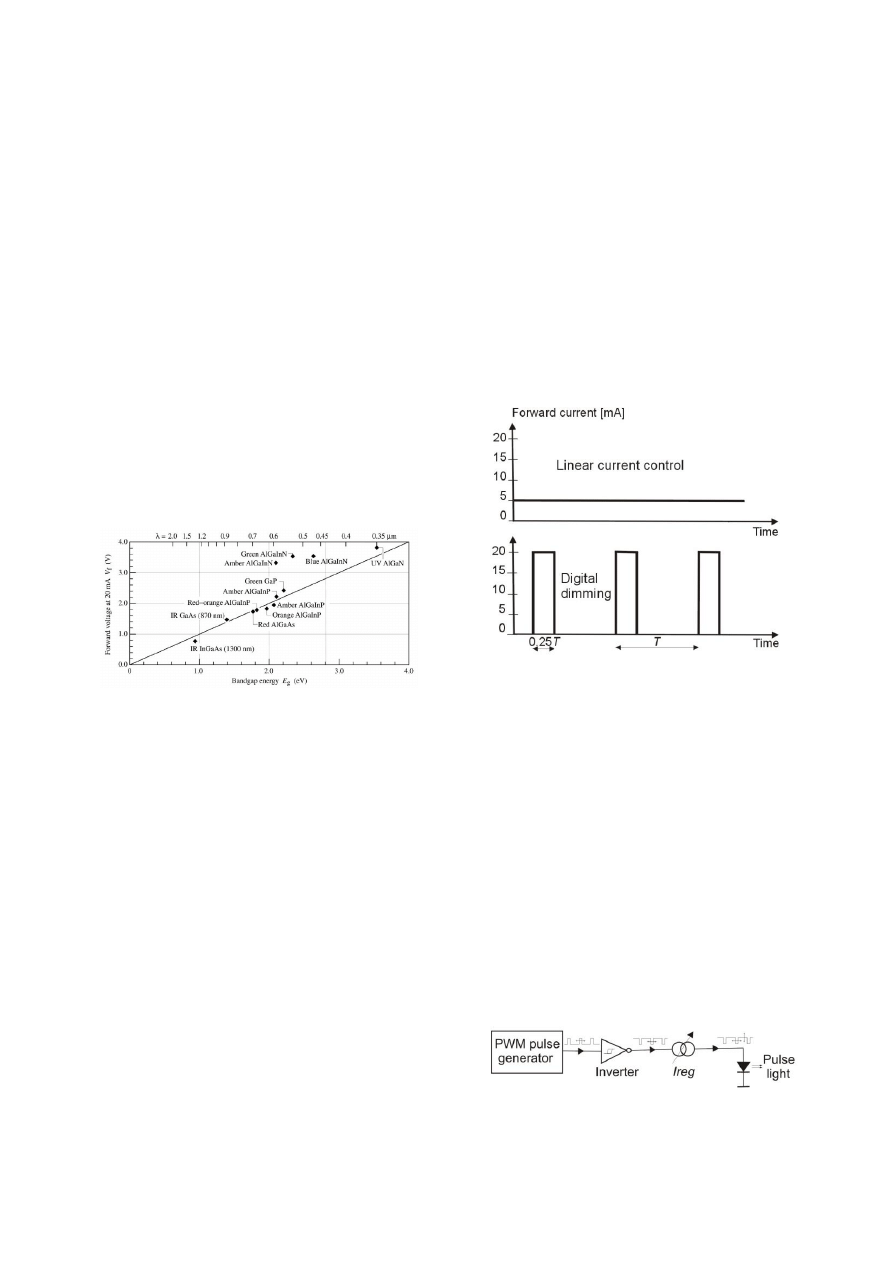
Radiant flux of LED depends on supply power. LEDs
and LED lamps will be controlled by constant value of
forward voltage or forward current.
Value of forward voltage should enable to overcome
bandgap energy. Bandgap energy value depending on light
colour determines the light colour of LED (figure 1).
Fig. 1. Typical diode forward voltage versus bandgap energy for
LEDs made from different materials [1].
In practice, rarely (hardly ever) voltage control method
of LED is applied. Current control permits more stable
diode’s work. It comes from a gradient of current-voltage
characteristic of p-n junction. Circuit with dropping resistor
is the most simple solution. Constant value of diode current
is extracted by dropping resistance. Such solution puts big
power supply losses. Besides, this solution can’t control of
LED’s or LED lamp’s output light. Current sources are
applied more often than not in current driven method. They
extract constant value of diode current independently of
temperature and voltage supply changes. Digital methods
of LEDs control are applied much often. A human eye can’t
detect the high frequency ripple light. It can’t detect
changes smaller than 20% of average supply current too
[2]. Hence in digital dimming of LED lamps is applied pulse
width modulation (PWM) of supply current. When we
change value of duty cycle we have got a visual effect of
linear regulation of output power, because a human eye
integrates and averages pulsed light above 120 Hz (figure
2).
PWM dimming drives at only one current supply level.
Alternative digital driving method is an amplitude
modulation current pulse of supply. Value of duty cycle (D)
of current supply in this method is constant. It is about 10%.
Fig. 2. Convergent visual sensation of linear current and digital
control.
(1)
D = t
on
/T
where:
t
on
– turn on time, T – period of switching frequency f.
Switching frequency f is usually higher than 10 kHz.
Value of pick forward current is 4 to 6 times higher than
maximum DC forward current. Changes of pulse amplitude
causes similar visual effect of luminance changing like in
PWM method. Practical applications of LEDs drivers are
applied either first or second method. This paper presents
an idea of driving circuit which joined both methods.
An idea of alternative circuit driver
Block diagram of the proposed solution is presented in
figure 3. It includes: pulse generator, inverter and variable
current source. Pulse generator produces signal PWM with
controlled frequency.
Fig. 3. Block diagram of the proposed driver.
PRZEGLĄD ELEKTROTECHNICZNY, ISSN 0033-2097, R. 84 NR 8/2008 141
General-purpose generator Sony AFG320 was used to
measurements. Output signal of generator was shaped by
inverter with Schmitt Trigger Input type 74AC14 [3]. Output
current of inverter can drive small power LED.
This current switches current source which is supplying
LEDs. Source works as current diode and it can change an
amplitude of supply current I
reg
. It is made of SIPMOS
transistor type BS107 [4] and variable feedback resistor.
This solution allows to get pulse current with variable
frequency, duty cycle and switched value. Practically we
can change external generator by control circuit (figure 4).
Fig. 4. The modified driver circuit.
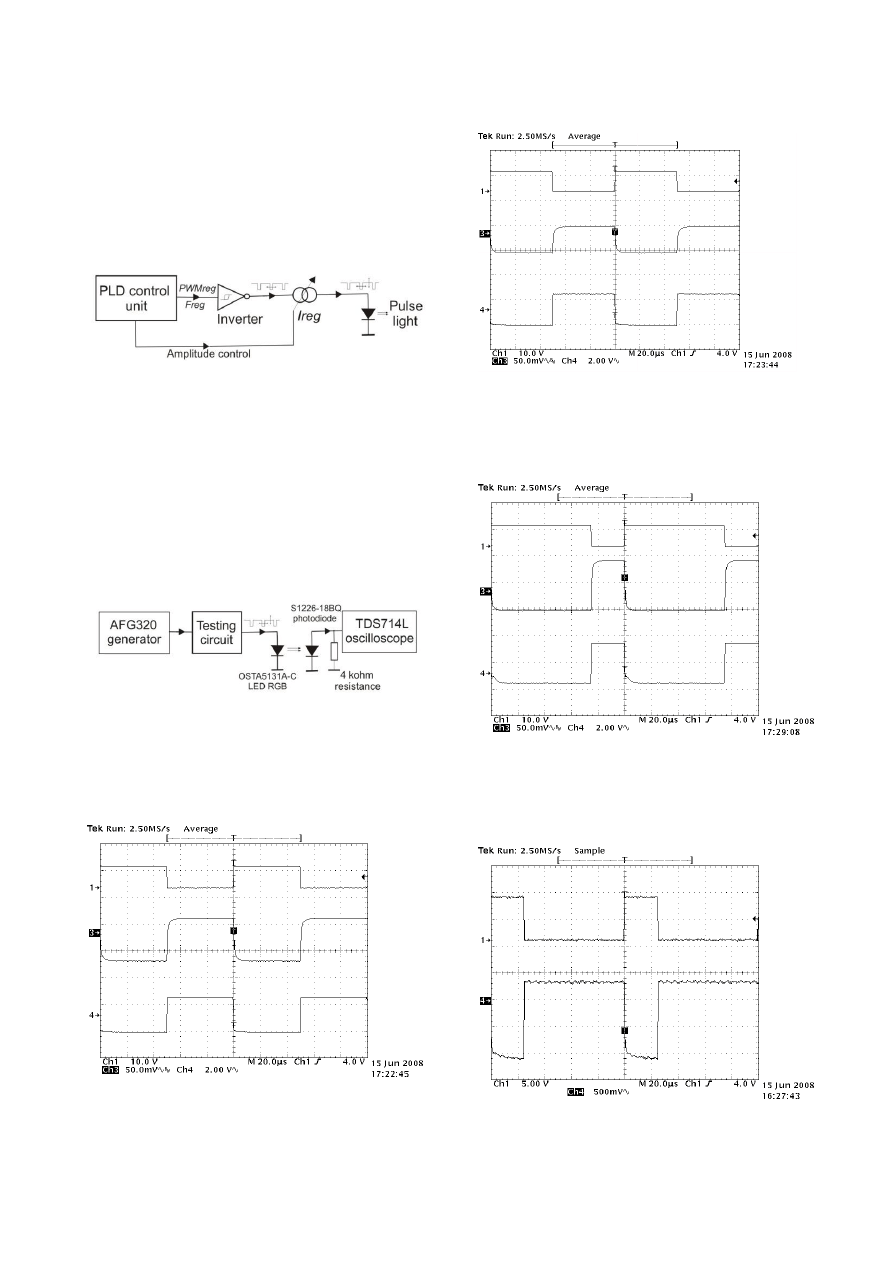
The control circuit may be constructed in Programmable
Logic Devices (PLD). PLD chip can create PWM frequency
variable signal and control LED current I
reg
.
Measurement results
Measuring path (figure 5) included: generator AFG320,
tested circuit, examined LED RGB type OSTA5131A-C [5],
Si photodiode type S1226-18BQ, 4 k
load resistor and
oscilloscope TDS714L. Photodiode S1226-18BQ measured
output light of LED. Voltage signal across photodiode was
registered by digital oscilloscope TDS714L.
Fig. 5. Structure of measuring path.
Examples
of
measurement
characteristics
were
presented on following figures. Figure 6 shows timings
green LED supplied by 11 mA current source. The duty
cycle of pulse current had 50%.
Fig. 6. Timing of green LED driven by 11 mA and 50% duty cycle
current.
Figure 7 shows timings the same LED driven by 5 mA
current. We can see different voltage of photodiode (curves
No 3).
Fig. 7. Timing of green LED driven by 5 mA and 50% duty cycle
current.
The next figure shows timings of blue LED which was
driven by 11 mA and 25% duty cycle current. This diode
has larger forward voltage than green LED (curve No 4).
Fig. 8. Timing of blue LED driven by 11 mA and 25% duty cycle
current.
Driving signals of red photodiode are shown in figure 9.
The first curve represents input voltage of circuit and the
fourth curve displays voltage across red LED.
Fig. 9. Timing of red LED driven by 8 mA and 75% duty cycle
current.
142
PRZEGLĄD ELEKTROTECHNICZNY, ISSN 0033-2097, R. 84 NR 8/2008
Conclusions
Presented driver circuit is very si
mple. It isn’t
commercial solution. When we use RGB LED to synthesis
of colour light we must control work of monochromatic
components (red, green and blue LEDs). It is difficult in
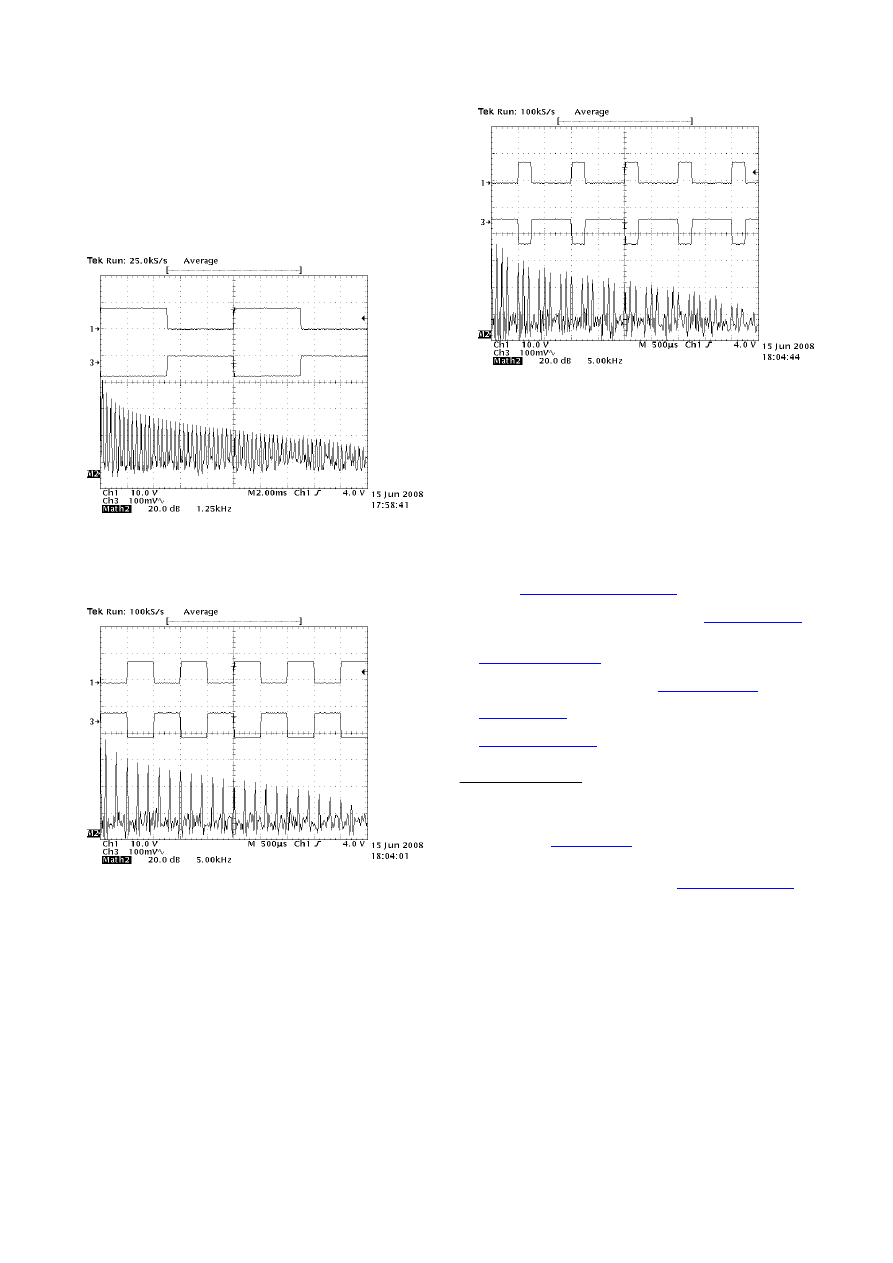
digital driving method. Figure 10 shows frequency spectral
distribution of green LED light. The LED was driven by 100
Hz pulsed current. We can see wide frequency spectral
band. We should have large frequency band apparatus to
measure and control this signals.
Fig. 10. Frequency spectral distribution of green LED light.
Figures 11 and 12 show spectral distributions for different
duty cycles of blue LED.
Fig. 11. Frequency spectral distribution of blue LED driven by 50%
duty cycle current.
Fig. 12. Frequency spectral distribution of blue LED driven by 75%
duty cycle current.
The PWM method is more spectral sensitive than pulse
amplitude modulation method.
This paper was prepared under S/WE/1/2006 grant.
REFERENCES
[1] S c h u b e r t E.F., Light Emitting Diodes and Solid-State
Lighting, Rensselaer Polytechnic Institute, Troy, NY 12180,
(2008),
[2] R i c h a r d s o n C h . , LED Applications and Driving Techniques,
The Sight & Sound of Information, (2007),
[3] Fairchild Semiconductor Corporation:
74AC14 • 74ACT14 Hex
Inverter with Schmitt Trigger Input, DS009917,
[4] Semiconductor Group: BS107 SIPMOS
® Small-Signal
Transistor, Siemens Corporation,
[5]
OptoSupply: Superjasne diody pełnokolorowe OSTA5131A-C,
[6] Hamamatsu Photonics K.K.: Si pin photodiode S1226-18BQ,
Authors
: dr inż. Grażyna Gilewska, Bialystok Technical University,
Faculty of Electrical Engineering, 45D Wiejska Street, 15-351
Bialystok, Poland, Phone: +48 085 7469357, Fax: +48 085
7469400, e-mail:
; dr inż. Marian Gilewski, Bialystok
Technical University, Faculty of Electrical Engineering, 45D
Wiejska Street, 15-351 Bialystok, Poland, Phone: +48 085
7469352, Fax: +48 085 7469400, e-mail:
Wyszukiwarka
Podobne podstrony:
Tai Chi Chuan Method Of Breathing And Ch
using money methods of paying and purchasing 6Q3S45ES3EDKO6KGT3XJX2BUKBHZSD4TR3PXKTI
Microphones Methods of Operation and Type Examples Gerhart Boré, Stephan Peus
The Cambodian Campaign during the Vietnam War The History of the Controversial Invasion of Cambodia
US Patent 382,282 Method Of Converting And Distributing Electric Currents
US Patent 685,953 Method Of Intensifying And Utilizing Effects Transmitted Through Natural Media
PSYCHIC METHODS OF DIAGNOSIS AND TREATMENT IN ACUPUNCTURE …
Modern Methods of Detecting and Eradicating Known and Unknown Viruses
(ebook) Tai Chi Chuan Method Of Breathing And Chi Direction (1)(1)
Tai chi chuan method of breathing and chi direction
US Patent 613,809 Method Of And Apparatus For Controlling Mechanism Of Moving Vessels Or Vehicles
Russian and Chinese Methods of going from Communism to?moc
Methods of Teaching A Kaleidoscope of Models and Strategies
Descartes, Rene Discourse On The Method Of Rightly Conducting The Reason, And Seeking Truth In Th
Instruction of connection and programming of OSCAR N PLUS OBDCAN controller
Method of gravity distortion and time displacement United States Application US20060073976
US Patent 568,179 Method Of And Apparatus For Producing Currents Of High Frequency
Drying kinetics and quality of beetroots dehydrated by combination of convective and vacuum microwav
więcej podobnych podstron