Optimization of Intake System and Filter of an
Automobile using CFD analysis
Ravinder Yerram
and
Nagendra Prasad
Quality Engineering and Software Technologies (QuEST), Bangalore
Prakash Rao Malathkar
and
Vasudeo Halbe
Mahindra & Mahindra Ltd., Nashik
Shashidhara Murthy K
MNR Filters India Pvt. Ltd., Bangalore
1. ABSTRACT
Air intake system and filter play major role in getting
good quality air into automobile engine. It improves the
combustion efficiency and also reduces air pollution.
This paper focuses on optimizing the geometry of an
intake system in automobile industry to reduce the
pressure drop and enhance the filter utilization area.
3D viscous CFD analysis was carried out for an
existing model to understand the flow behavior through
the intake system, air filter geometry and filter media.
Results obtained from CFD analysis of the existing
model showed good correlation with experimental
data. Based on existing model CFD results,
geometrical changes like baffle placement in inlet
plenum of the filter, inclusion of bell mouth in outlet
plenum and dirty pipe , optimization of mesh size,
removal of contraction in clean pipe of intake system
etc are carried out, to improve the flow characteristics.
The CFD analysis of the optimized model was again
carried out and the results showed good improvement
in flow behavior, better filter utilization with
considerable reduction in pressure drop and significant
reduction in re-circulation zones of the air filter
geometry. By using 3D CFD analysis, optimal design
of the intake system for an automobile engine is
achieved with considerable reduction in development
time and cost.
2. INTRODUCTION
The work of an air filter is to filter the dirt particles from
the intake air and supply cleaner air to the automobile
engine. Air enters the filter through dirty pipe and inlet
side plenum, which guides the flow uniformly through
the filter media. Optimum utilization of filter can
significantly reduce the cost of filter replacements
frequently and keep the filter in use for longer time. To
optimize intake system and filter, thorough
understanding of flows and pressure drop through the
system is essential. Computational Fluid Dynamics
(CFD) is considered to be the most cost effective
solution for flow analysis of intake system along with
filter media. This paper focuses on the optimization of
the intake system and filter by CFD analysis results.
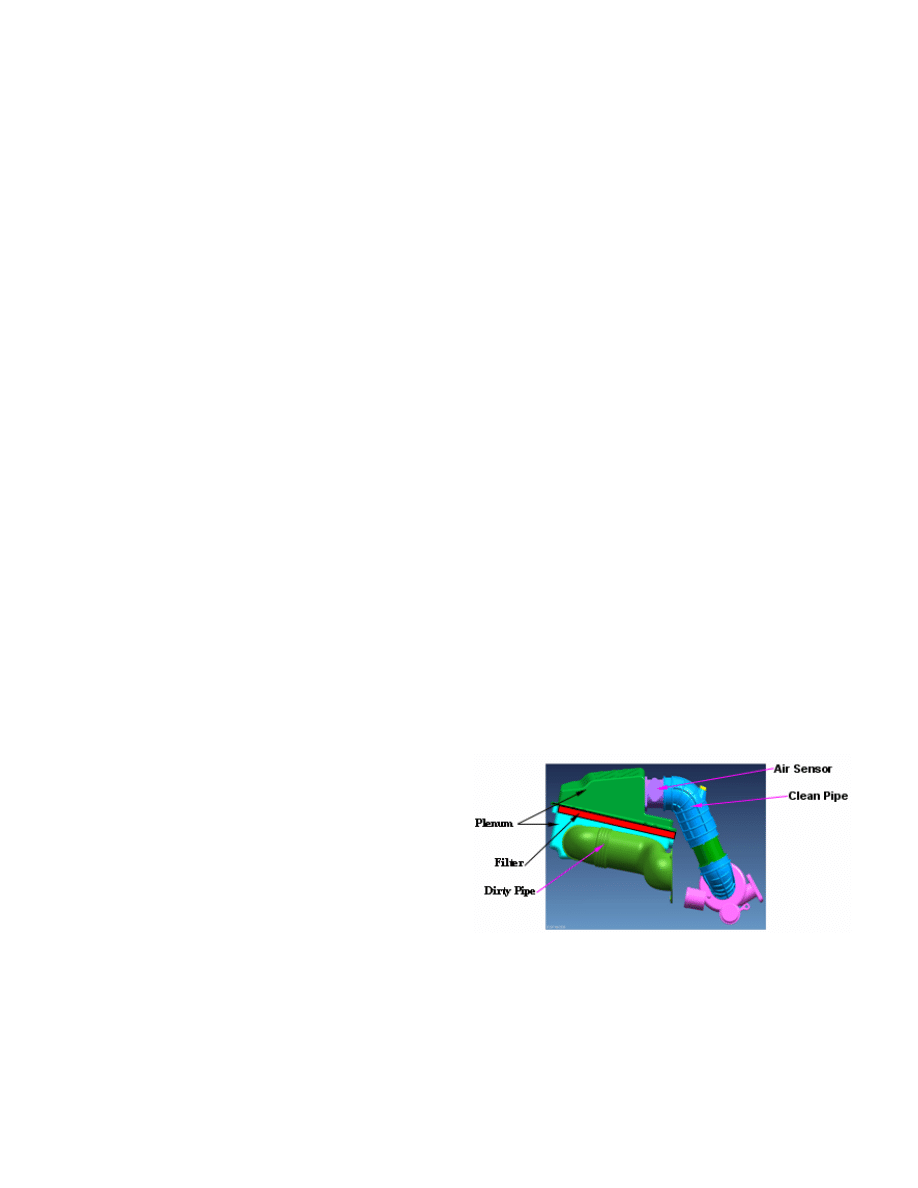
3. GEOMETRY MODEL
Figure (3.1) shows solid model of intake system and
filter. In order to save the CFD computational time and
cost, trivial geometric details that are unimportant from
fluid flow point of view, such as fillets, blends,
stiffeners and steps have been ignored. Ignoring all the
above-mentioned, so called a cleaned geometry was
obtained from solid model.
Figure (3.1): Intake system solid model
Figure (3.2) shows the fluid volume for the existing
intake system and filter and figure (3.3) shows the fluid
volume for the modified intake system with baffles.
where filter media is approximated to rectangular
volume and considered as porous media. For mesh
generation, all surfaces and curves were extracted
from the cleaned model.
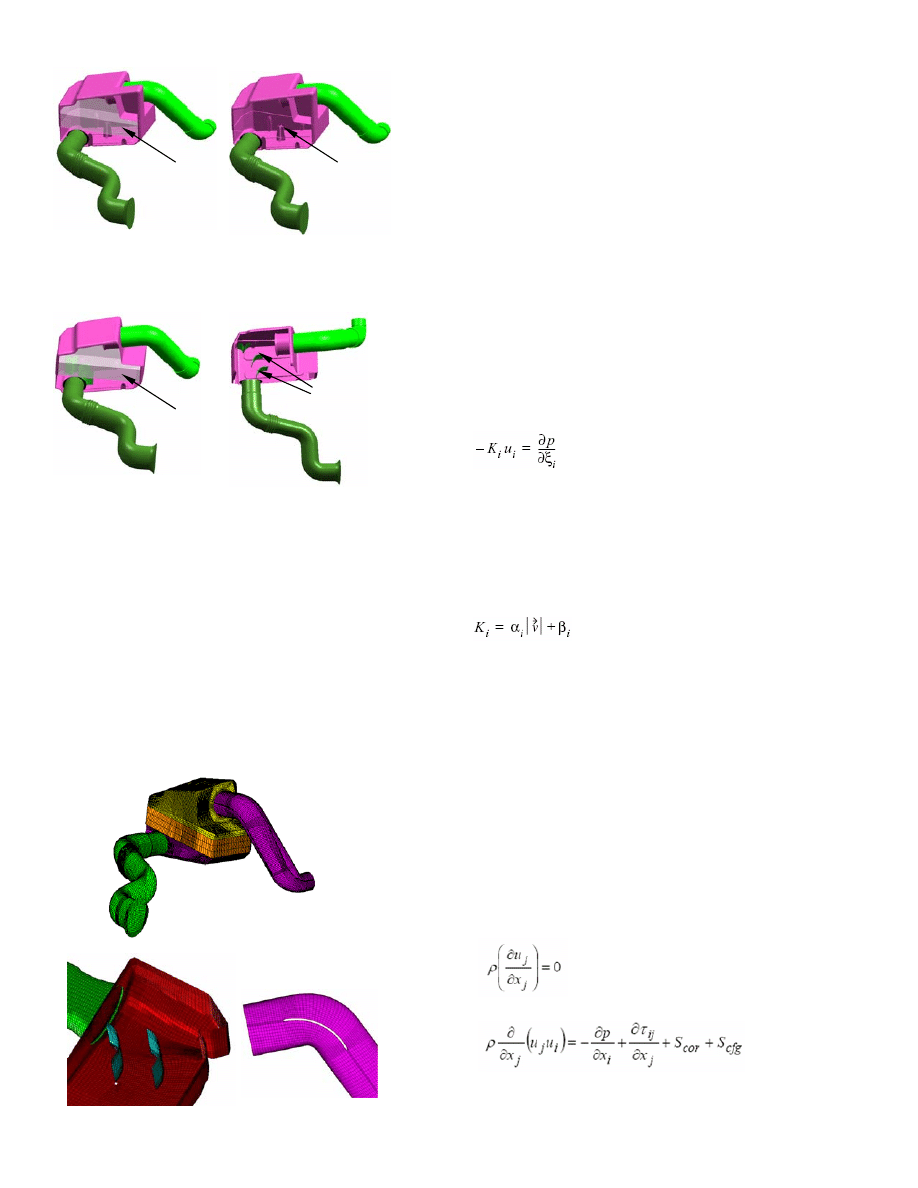
Figure (3.2): Fluid volume of existing intake system
Figure (3.3): Fluid volume of modified intake system
4. CFD MESHING
To capture the three-dimensional flow inside the
domain with reasonable accuracy, one needs good
quality mesh. Multi-block structured hexagonal mesh
was considered to be the best for this case and was
created using commercial mesh generator (ICEM-
CFD). The model was approximately 0.55 million
hexagonal fluid elements. Boundary layer was
resolved for y+ of 40 to 200 to capture physics inside
the complicated regions. Figure (4.1) shows
hexahedral mesh of intake system fluid domain. Figure
(4.2) shows hexahedral mesh near baffles and clean
air pipe elbow.
Figure (4.1): Intake system hexahedral mesh
Figure (4.2): Hexahedral mesh near baffles and elbow
5. CFD MODEL DESCRIPTION
Air was used as fluid media, which was assumed to be
steady and incompressible. High Reynolds number k-
ε
turbulence model [2] was used in the CFD model. This
turbulence model is widely used in industrial
applications. The equations of mass and momentum
were solved using SIMPLE algorithm [1] to get velocity
and pressure in the fluid domain. The assumption of an
isotropic turbulence field used in this turbulence model
was valid for the current application. The near-wall cell
thickness was calculated to satisfy the logarithmic law of
the wall boundary. Other fluid properties were taken as
constants. Filter media of intake system and air sensor
were modeled as porous media using coefficients.
Support
Filter
For porous media, it is assumed that, within the
volume containing the distributed resistance [3], there
exists a local balance everywhere between pressure
and resistance forces such that
Baffles
Filter
(1)
Where
ξ
I
(i = 1, 2, 3) represents the (mutually
orthogonal) orthotropic directions.
K
i
is the permeability
u
i
is the superficial velocity in direction
ξ
i
The permeability K
i
is assumed to be a quasilinear
function of the superficial velocity magnitude of the
form
(2)
Where
α
i
and
β
i
are user-defined coefficients [4].
Superficial velocity at any cross section through the
porous medium is defined as the volume flow rate
divided by the total cross sectional area (i.e. area
occupied by both fluid and solid). In this analysis,
α
i
and
β
i
are assumed to be same.
6. GOVERNING EQUATIONS
Commercial CFD solver Star-CD was used for this
study. It is a finite volume approach based solver
which is widely used in the industries. Governing
equations solved by the software for this study in
tensor Cartesian form are following:
Continuity:
(3)
Momentum:
(4)
Where ρ is density, u
j
is jth Cartesian velocity, p is
static pressure,
τ
ij
is viscous stress tensor.
7. BOUNDARY CONDITIONS
Various boundary conditions for the different
components applied to this study were as follows:
For inlet, the mass flow rate was imposed using the
fixed mass inlet boundary condition. The value of
density (1 kg/m
3
), total pressure (1 atm) and
turbulence intensity (5%) were specified at the inlet
boundary. For outlet, outflow boundary condition was
imposed with flow rate weighting of 1. No slip
boundary condition was applied on all wall surfaces.
For main filter media, porous media boundary was
imposed with
α
i
=
β
I
= 3000. For air sensor, porous
media boundary was imposed with
α
i
=
β
I
= 290.
Whole domain was considered at 1 atm and at 298 K
as initial condition.
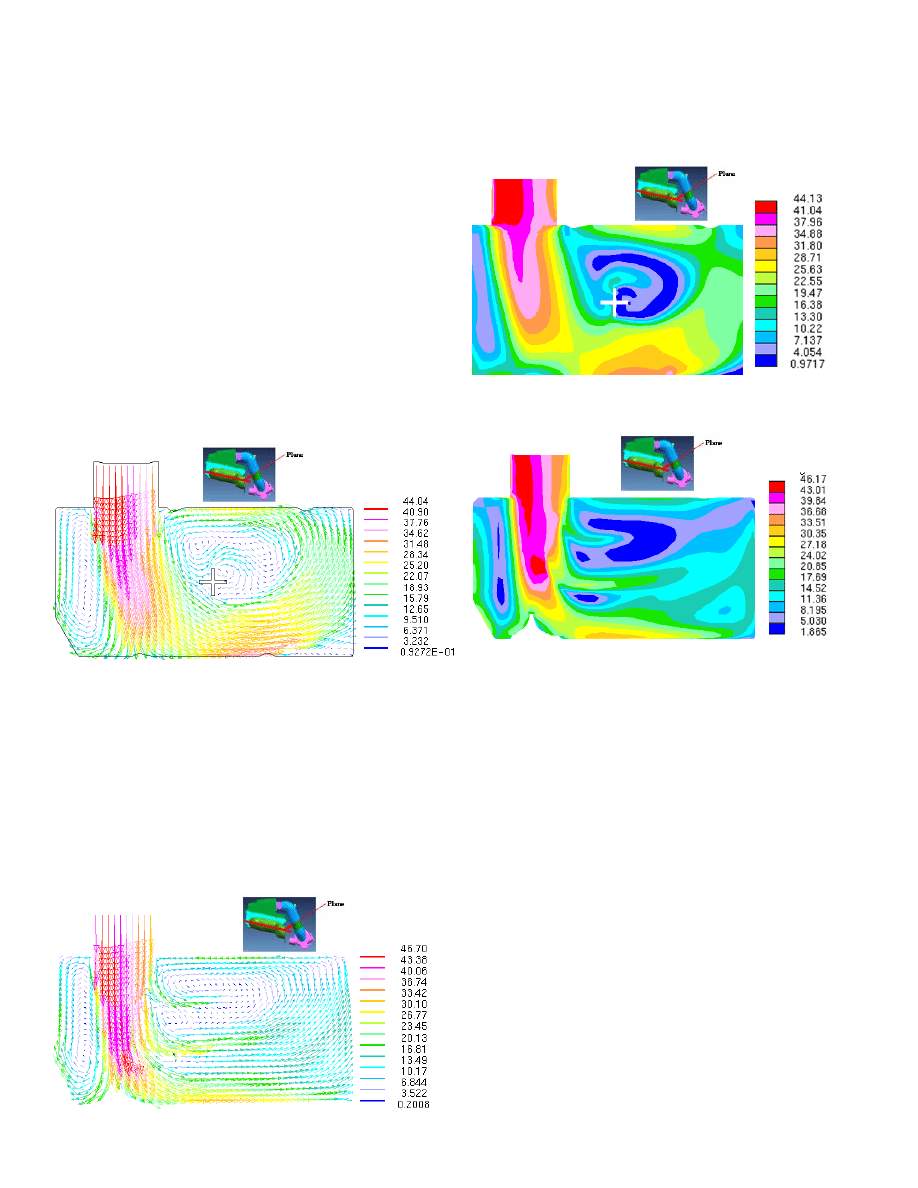
8. RESULTS AND DISCUSSION
To
have effective cleaning of air from filter, it was
suggested to have uniform velocity of air pass through
filter.
Figure (8.1-a): Velocity vector (m/s) plot for the existing model
Figure (8.1-a) shows two recirculation zones right
below the filter needed to be considered for
optimization as the recirculation in flow field causes
energy dissipation. In order to avoid the recirculation,
introducing the baffle was suggested which would
guide the flow to avoid recirculation.
After the baffle was introduced in the existing model,
CFD analysis was again carried out to decide the
location and effect of baffle. Velocity vector plot of
modified model in figure (8.1-b) below gives a clear
picture of less recirculating flow field.
Figure (8.1-b): Velocity vector (m/s) plot for the modified model
It is worth to mention that introducing baffle in the inlet
plenum below the filter has enhanced the efficiency by
guiding the flow and reducing the pressure drop
significantly that was present earlier.
Figure (8.2-a): Velocity magnitude (m/s) contour plot for the existing
model
Figure (8.2-b): Velocity magnitude (m/s) contour plot for the existing
model
Figure (8.2-a) and figure (8.2-b) show the velocity
magnitude contour plot in the critical region in the flow
domain.
In the figure (8.2-b) it can be seen the effect of baffle
as the flow is relaxed and better flow distribution.
Near outlet plenum exit, flow was separating and
recirculating at both the ends. This phenomenon can
be seen figure (8.3-a). To avoid separation and
recirculation in this region, a bell-mouth was
introduced. This can be clearly seen in figure (8.3-b) of
velocity vectors.
Figure (8.4) shows a separation zone at one side after
the first bend of clean pipe. And more concentrated
velocity magnitude contours were seen at the other
end which is typical phenomenon that can be seen in
bends. To overcome such phenomenon of separation,
a baffle was introduced that guides the flow and make
the flow uniform. This will possibly improve engine
performance.
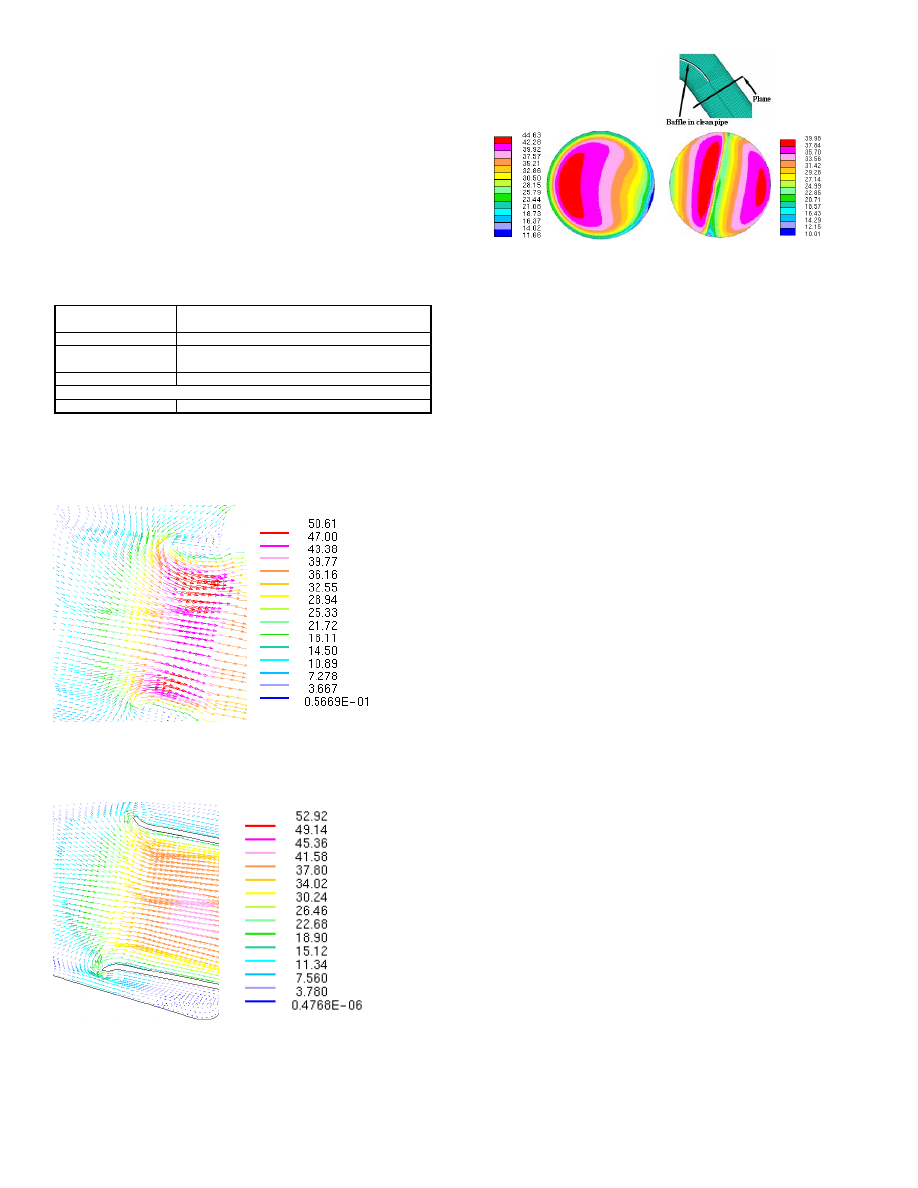
Table (8.1) presents percentage improvement in total
pressure drop (reduction) in the intake system with
various design modifications. By changing mesh type
(simplified rectangular grid) near entry to intake system
and bell-mouth in dirty pipe inlet, pressure drop
improved by 33%.
By placement of baffles in inlet plenum before filter
media the performance has improved by 28% that is
significant in intake system. Bell-mouth and baffle
inside the clean pipe improved the flow and pressure
drop by 6.5%.
Table (8.1): Percentage Improvements in total pressure drop
(reduction) in various regions
Figure (8.3-a): Velocity vectors plot near outlet plenum
before modification
Figure (8.3-b): Velocity vectors plot near outlet plenum
after introducing bell-mouth
a. Without baffle
b. With baffle
Figure (8.4): Velocity magnitude contours after clean pipe baffle
9. CONCLUSION
Percentage improvement (reduction) in Total
Pressure drop with baffles and other modifications
CFD analysis was done using commercial CFD solver
Star-CD to understand the flow phenomenon in an
intake system. CFD results of the existing intake
system had shown recirculation and separation zones
before and after the filter media. Following design
modifications were considered to improve the flow and
pressure drop through the intake system
• Changing of mesh type (simplified rectangular
grid) in dirty pipe.
• Introduction of bell-mouth in dirty and clean pipe
• Introduction of baffles inside inlet plenum just
below filter media.
• Introduction of baffle in clean pipe bend
All the above changes incorporated in the design
improved overall pressure drop by 22%.
10. ACKNOWLEDGMENTS
The authors would like to sincerely thank Mr. Mihir
Desai and Mr. Veerabathra Swamy for their support in
CFD analysis in this project.
11. REFERENCES
(1) Patankar, S.V. 1980, “Numerical Heat Transfer and
Fluid Flow”, Hemisphere, Washington, D.C.
(2) Launder, B.E., and Spalding, D.B. 1974, “The
Numerical Computation of Turbulent Flows”, Comp.
Meth. in Appl. Mech. and Eng., 3, pp. 269-289.
(3) STAR-CD Methodology
(4) MNR Filters India Pvt. Ltd., experimental resources
12. CONTACT
Ravinder Yerram
Senior Technical Leader, CFD Team
Quality Engineering & Software Technologies (QuEST)
#55 QuEST Towers, Whitefield Main Road,
Mahadevapura, Bangalore-560 048
Tel: +91-80-41190909 Extn. 313
Fax: (91) 80-41190901
Dirty pipe with mesh
33
take System, Filter
d Air Sensor
28
ean Pipe
6.5
hrough out the domain
22
In
an
Cl
T
Wyszukiwarka
Podobne podstrony:
Optimization of headspace sampling using SPME for volatile c
A systematic review and meta analysis of the effect of an ankle foot orthosis on gait biomechanics a
21 269 287 Effect of Niobium and Vanadium as an Alloying Elements in Tool Steels
Summary of an artice 'What is meant by style and stylistics'
[Mises org]Hayek,Friedrich A A Free Market Monetary System And Pretense of Knowledge(1)
Design and performance optimization of GPU 3 Stirling engines
Munster Application of an acoustic enhancement system for outdoor venues
Multi objective thermodynamic optimization of combined Brayton and inverse Brayton cycles using gene
54 Shooting and Finishing Progression 3 – A Variety of An
Identification and fault diagnosis of a simulated model of an industrial gas turbine I6C
The Problem Of Order In Society, And The Program Of An Analytical Sociology Talcott Parsons,
Dr Gary L Glum Calling Of An Angel The True Story Of Rene Caisse And An Indian Herbal Medicine Cal
A dynamic model for solid oxide fuel cell system and analyzing of its performance for direct current
Optimization of Extraction Conditions and Fiber Selection fo
A Free Market Monetary System and The Pretense of Knowledge
The story of an hour summary and analisisdocx
więcej podobnych podstron