
2
nd
Mercosur Congress on Chemical Engineering
4
th
Mercosur Congress on Process Systems Engineering
1
MODELLING VACUUM AND CONVECTIVE DEHYDRATION OF
VEGETABLES
Patricia Gerla
*
, Jorge Martínez Garreiro, Berta Zecchi, Leonardo Clavijo
Instituto de Ingeniería Química - Facultad de Ingeniería –
Universidad de la República – Montevideo-Uruguay
Abstract.
Parsley was dried in an air convection cross-flow dryer at three temperatures (35, 45, 55 ºC) and in a
vacuum oven with a continuous weighting system, at the same temperatures and a pressure of 36 mmHg. Only a
falling rate period of drying was found. Experimental values were used to determine the best phenomenological
model for each drying process and for calculate the diffusion model parameters.
For vacuum and convective drying during the falling rate period, a set of simple diffusive models were developed
assuming that diffusion coefficient of water is constant or alternatively considering that water diffusivity is variable
with the Fourier number (Fo).
Different boundary conditions, particularity a constant equilibrium concentration at the interface for the overall
process or a variable surface concentration that varies with the Fourier number (Fo), were considered.
The same theoretical relationship between moisture and the Fourier number was used in modelling solid drying either
for vacuum or convective process.
Results show that the variable diffusion coefficient as potential function of Fo number result the best hypotheses for
modelling convective drying, while a exponential variation of the surface concentration was the best boundary
condition for modelling vacuum drying. These simple diffusive models, which use the effective initial diffusivity,
coupled with vacuum pressure and temperature or with air temperature as parameters, predicted well the drying rates
of parsley for vacuum as well as convective drying. Those models can also be extended to others structured
vegetables and geometries.
Keywords: Vacuum Drying, Convective Drying and Diffusion
1. Introduction
The study of the drying operation started several years ago (Lwikov, 1966; Treybal, 1980; Mujumdar, 1995),
and it is still being intensely investigated. The process offers a particular complexity due to the variety of
concurring heat and mass transfer mechanisms, the peculiarities of the product to be dried and the equipment
involved. In particular, food drying has been the subject of many investigators, (Madamba, 2001; Martínez-Soto,
2001; Chen, 2004), with a wide variety of approaches, being kinetic and modelling still reported, (Alvarez and
Legues, 1986; Efremov, 2002; Reyes et al., 2002; Jaya, 2003), but general solutions giving a phenomenological
description of the process were not found.
Conventional drying of organic raw materials in hot air convection dryers, many often cause undesirables
effects on the dehydrated final product. In the case of food products as vegetables that are sensitive to elevate
temperature, significant thermal degradation of flavour, nutritive substance and original colour can occur. In
order to avoid these undesirable effects, many different techniques of water removal from fruits and vegetables,
such as freeze-drying, microwave drying, osmotic drying and vacuum drying has been applied (Markowski and
Bialobrzewski, 1998; Cui et al., 2003).
•
Patricia Gerla.
Address: Instituto de Ingeniería Química, Facultad de Ingeniería, Universidad de la República, Julio Herrera y Reissig
565; Montevideo- Uruguay CC30, CP 11300.
Email:
gerla@fing.edu.uy

2
nd
Mercosur Congress on Chemical Engineering
4
th
Mercosur Congress on Process Systems Engineering
2
For the case of parsley drying, it is known that temperatures in excess of 60ºC cause a significant loss of herb
volatile oils. Drying of parsley at 40ºC with a large volume of air moving through the material, reduce the loss
of oil while drying the herb before colour is loss, maintaining the flavour in the dried flakes, but long drying
time is required and the quality of the dehydrated product usually is not so good. Convective drying of most
vegetables with hot air is a inefficient and hard method in the last stage of drying, when the transport of moisture
to the product surface is very slow and the velocity of drying decrease while the surface temperature of the
material increase and undesirable effects in the product take place. Vacuum drying may be an adequate drying
method at the last stage of the dehydration process (product moistures between 20% and 5%), maintaining the
drying velocity and prevent the rise of the surface temperature and product degradation.
Selection of the best drying technique or combination of techniques required the knowledge of the drying
kinetic for each particular case (raw material and process). Desirable properties and quality of the dehydrated
product, the required drying equipment and the cost of production between others factors have to be considered,
as well. Considering the installed capacity of conventional air dryers in the national industry and the
requirements of low cost and good quality of the main vegetables products to be dehydrated, a combination of
conventional drying in a hot air convective dryer and vacuum drying, may be the best technological solution for
processing this kind of products in our country, in order to minimize times and cost of drying, enhancing the
product quality
The main reason for measuring the drying kinetics is to provide experimental support to modelling transport
phenomena during drying. The phenomenological model of the process is a starting point in understanding
industrial process, and it allow to predict the effect of change in the main parameters on the drying process, that
have to be established for optimization, scale up or control of process conditions.
The aim of this work was to obtain phenomenological models for the drying kinetics of vacuum drying and
convective air-drying at various temperatures under 60ºC, as a tool on the best performing of a combined drying
process. Experimental determination of the drying curves of parsley in a conventional convective dryer with hot
air and in a vacuum dryer, at three process temperatures (35º, 45 and 55ºC) were released and phenomenological
models of drying kinetics were developed and fitted with the experimental data, in order decide on the best
description for each process.
2. Theory
The drying process can be interpreted like a process of migration and evaporation, in which initially the
present water in the surface of the solid evaporates, taking the latent energy of evaporation from the heat source,
while more water migrates towards the surface. In structured foods, the common approach to modelling mass
transfer is to use an effective diffusion coefficient defined by the Fick´s second law, that associate the water
flow with a moisture gradient, where the diffusion coefficient may be dependent on the moisture content in the
product. It also had been recognized that this effective diffusivity usually lumps others simultaneous
mechanisms of transport as capillarity flow of liquid, vapour diffusion, hydrodynamic flow of liquid and vapour
due to pressure gradients and also condensation-evaporation in a reseeding front. In this way, we use the concept

2
nd
Mercosur Congress on Chemical Engineering
4
th
Mercosur Congress on Process Systems Engineering
3
of effective diffusivity, D
e
, and the Fick´s second law to describe the moisture transport during the drying of
parsley:
⎟
⎠
⎞
⎜
⎝
⎛
∂
∂
∂
∂
=
∂
∂
x
X
D
x
t
X
e
(1)
where X is the moisture content, x is the space variable and t is the process time.
In order to solve Eq. (1), the geometry, initial conditions and boundary conditions must be established for the
considered drying processes, but only simple geometrical configurations and boundary conditions allows to
obtain analytical solutions for this type of partial differential equations. In many cases, the geometry of the solid
to be dried is very complex and can not be directly assimilated to any simple geometry, as occurs with a portion
of parsley leaves in a convective or in a vacuum dryer. So, the most simple assumption is to consider that the
system geometry can be assimilated to an infinite plane of equivalent thickness 2L, and the differential equation
solution for average moisture will be expressed as a function of the Fourier number for mass (Fo=D
e
t/L
2
) were
(D
e
/L
2)
is a parameter of the system that will be determined.
So, in this way, not only the diffusion coefficient is a effective one that may include others mechanisms than
diffusion, but also the assumed geometry and the length of water diffusion in the solid may be not the ones of
the real system. Equivalent volumes and length associated to simple geometries (plane, cylinders or spheres)
should be assumed for modelling. Boundary conditions at interphase, use to be the equilibrium ones, but also is
possible to considerer interphase conditions dependent on solid moisture content or in time, for better
description of real condition in drying process.
In spite of the restrictions and simplification of the real system that are required to obtain an analytical
solution of the partial differential equation, it results to be a simplified but powerful tool that shows the
analytical functionality between the main variables of the process an its evolution in time.
Two possibilities were considered for the dependency of diffusivity with the moisture content of the solid:
firstly, the effective diffusivity remains approximately constant throughout the process, being:
0
t
D
D
0
e
≥
∀
=
(2)
and secondly, diffusivity varies as a consequence of variation of the moisture content and the structural changes
that happen in the solid during dehydration in the falling rate period. This variation can be considered as a
functional relation between the effective diffusivity and the Fourier number (Alvarez and Legues, 1986):
(
)
0
t
Fo
1
D
D
1
0
e
≥
∀
+
=
−
β
(3)
where D
0
is the initial effective diffusivity of moisture in the solid and β is a constant to be determined
experimentally.
It was assumed a homogenous and isotropic behaviour of the product and a uniform distribution of the
moisture, X
0
, in the sample at initial time. This initial condition is:

2
nd
Mercosur Congress on Chemical Engineering
4
th
Mercosur Congress on Process Systems Engineering
4
0
t
L,
x
L
-
X
X
0
=
≤
≤
=
(4)
Two different hypotheses were considered for the boundary conditions of the system: on one hand, at the
interphase the moisture content remains constant in equilibrium condition, X
e
, throughout the process, so:
0
t
,
L
x
X
X
e
≥
±
=
=
(5)
and on the other hand, the interphase concentration changes rapidly but not instantaneously and it was assumed
that the interphase condition vary exponentially with the drying time, as moisture in the solid decrease:
0
t
L,
x
e
X
X
X
X
)
t
L
D
(
0
e
0
2
e
≥
±
=
=
−
−
α
−
(6)
where
α is a parameter of the system.
Furthermore, the diffusion coefficient of water in the solid is a transport property that usually depend on the
temperature of the product. For processes that are carried out at constant temperature, this dependency is not
related with the drying time, although the value of D
e
will depend on the process temperature.
Integrating Eq. (1) for the different hypotheses about diffusivity dependence and interphase conditions, a set
of solutions for the variation of moisture content, in space and time were obtained. Then, the drying curves
showing the average moisture in the whole solid, as a function of the process time, were obtained by integrating
with respect to space variable, x, between the limits –L and +L, resulting the following equations (Crank, 1975;
Martinez, 1998):
Case 1
: Constant surface concentration. Constant effective diffusivity. Uniform initial distribution.
)
1
n
2
(
L
4
t
D
)
1
n
2
(
exp
8
X
X
X
X
0
n
2
2
e
2
2
2
e
0
e
∑
∞
=
+
⎟
⎟
⎠
⎞
⎜
⎜
⎝
⎛
π
+
−
π
=
−
−
(7)
Equation (7) results of solving Eq. (1) with constant diffusivity, Eq. (2), and initial and boundary conditions
given by Eq. (4) and Eq. (5) and then integrating for average moisture in the whole solid product.
Case 2
: Constant surface concentration. Variable effective diffusivity. Uniform initial distribution.
∑
∞
=
β
⎟
⎟
⎟
⎟
⎟
⎟
⎠
⎞
⎜
⎜
⎜
⎜
⎜
⎜
⎝
⎛
β
⎟
⎟
⎠
⎞
⎜
⎜
⎝
⎛
−
⎟⎟
⎠
⎞
⎜⎜
⎝
⎛
+
π
+
−
+
π
=
−
−
0
n
2
e
2
2
2
2
e
0
e
4
1
L
t
D
1
)
1
n
2
(
exp
)
1
n
2
(
1
8
X
X
X
X
(8)
Equation (8), results of solving Eq. (1) with variable diffusivity, Eq. (3), and initial and boundary conditions
given by Eq. (4) and Eq. (5) and then integrating for average moisture in the whole solid product.

2
nd
Mercosur Congress on Chemical Engineering
4
th
Mercosur Congress on Process Systems Engineering
5
Case 3
: Variable surface concentration. Constant effective diffusivity . Uniform initial distribution
∑
∞
=
α
−
⎥
⎥
⎦
⎤
⎢
⎢
⎣
⎡
α
π
+
−
+
⎟
⎟
⎠
⎞
⎜
⎜
⎝
⎛
π
+
−
π
+
⎟
⎠
⎞
⎜
⎝
⎛
α
α
=
−
−
0
n
2
2
2
2
e
2
2
2
2
/
1
)
t
L
D
(
e
0
e
4
)
1
n
2
(
1
)
1
n
2
(
L
4
t
D
)
1
n
2
(
exp
8
tan
e
X
X
X
X
2
e
(9)
Equation (9), results of solving Eq. (1) with constant diffusivity, Eq. (2), and initial and boundary conditions
given by Eq. (4) and Eq. (6) and then integrating for average moisture in the whole solid product.
Case 1 represent the most simple type of diffusion process and the analytical solution given by Eq.(7) is
very frequently proposed for modelling convective drying. For this case, the effective diffusion coefficient is
constant and assumes that interphase is in equilibrium condition. Case 2 that use a variable diffusion coefficient
in time, allows taking into account the effect of changes in moisture and structure that happen in the solid during
drying, affecting diffusivity value. Case 3, which consider a variable interphase condition, may be better
considering that surface concentration changes rapidly but equilibrium conditions are not established
instantaneously at initial time.
3. Materials and Methods.
Two experimental systems were performed for experimental determination of parsley drying curves in a
convective dryer and in a vacuum dryer. Samples of approximately 200g of fresh parsley with initial moistures
around 85% (wb) were dehydrated until moisture content of 5%.
For convective air-drying experiences, a cross-flow convective dryer, instrumented with controls for air
velocity and temperatures, was used. Sensors of air temperature and relative humidity were installed and
connected to data-logger for recording experimental data of air conditions during drying. All tests were carried
out with an air velocity of 1 m/s for three levels of temperatures (35, 45 or 55ºC). The samples were weighted at
periodical intervals during drying process and loss of weigh vs. time was computed.
For vacuum drying, experiments was done in a vacuum oven instrumented with controls for temperature
and pressure, and a continuous weighting system with a load cell into the oven that transmit data (weigh and
time) to a remote balance display and a computer for data storage. Ambient conditions (T, %HR) inside an
outside the vacuum chamber were also registered. Experiences of vacuum drying were done for three different
temperatures (35ºC, 45ºC and 55ºC) and at operating pressure of 36 mmHg.
For all the samples assayed, moisture content of initial and dehydrated product were determined by
reference method in oven at 103ºC, until constant weigh. For best characterization of dehydrated product, water
activity was also determined.
Computational programs for non-linear multiparametric regression were developed using PC-Matlab
software. Fitting was made using a computational program that minimizes the norm, Eq. (10), between
experimental and theoretical values. The numerical method used was the Simplex, which employ the Nealder-
2
nd
Mercosur Congress on Chemical Engineering
4
th
Mercosur Congress on Process Systems Engineering
6
Mead algorithm for the non-linear optimization calculus, determining the resulting values of the parameters that
optimize the fitting of each theoretical model and the corresponding experimental data.
The norm, the deviation percentage and the relative average error percentage between calculated moisture and
experimental value were calculated as:
2
p
1
n
calc
exp
calc
X
X
X
norm
∑
=
⎟⎟
⎠
⎞
⎜⎜
⎝
⎛
−
=
(10)
2
p
1
n
calc
exp
calc
X
X
X
1
p
1
100
d
%
∑
=
⎟⎟
⎠
⎞
⎜⎜
⎝
⎛
−
−
=
(11)
∑
=
−
=
p
1
n
calc
exp
calc
r
X
X
X
p
100
e
%
(12)
4. Results and Discussion
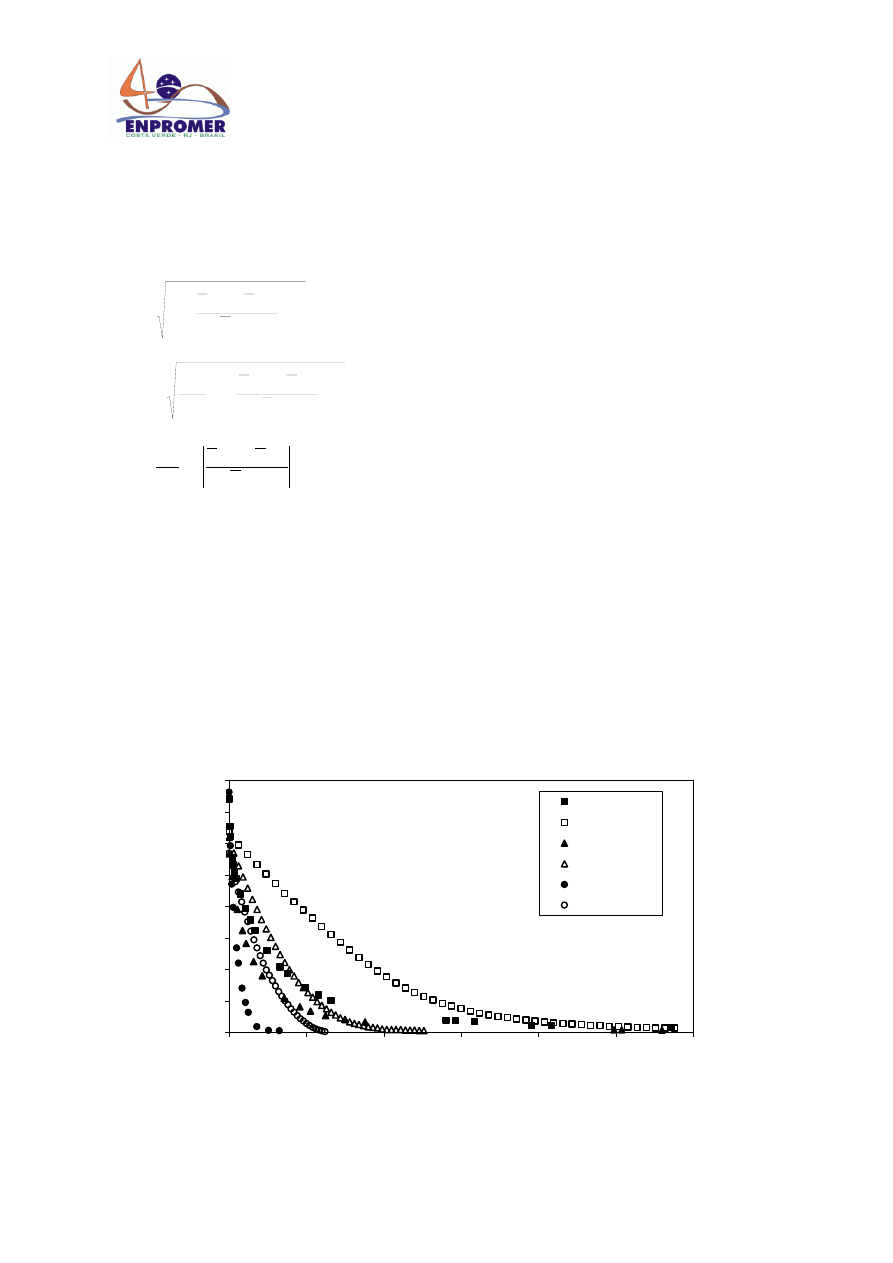
The experimental drying curves obtained for parsley in the convective dryer and in the vacuum dryer at
different conditions process are shown in figure 1, and in figure 2 the experimental drying velocities curves
determined for the three temperatures assayed are presented. Only falling rate period of drying was found in the
complete range of moisture (85% to 5%) for both drying processes. Also, intersections of velocity experimental
curves for convection drying and for vacuum drying determined for the same temperature were found, showing
that at the first stage of drying, convective drying velocities are higher than vacuum drying velocities while the
inverse situation occur at the final stage of each drying processes.
0
1
2
3
4
5
6
7
8
0
500
1000
1500
2000
2500
3000
Time (min)
X
db
Conv - 35 ºC
Vac - 35 ºC
Conv - 45 ºC
Vac - 45 ºC
Conv - 55 ºC
Vac - 55 ºC
Fig. 1. Experimental drying curves.
2
nd
Mercosur Congress on Chemical Engineering
4
th
Mercosur Congress on Process Systems Engineering
7
0
0.005
0.01
0.015
0.02
0.025
0.03
0.035
0.04
0.045
0.05
0
0.2
0.4
0.6
0.8
X
wb
- dX
db
/dt (min
-1
)
Conv - 35 ºC
Vac - 35 ºC
Conv - 45 ºC
Vac - 45 ºC
Conv - 55 ºC
Vac - 55 ºC
Fig. 2. Experimental drying velocity.
The three different theoretical models proposed were fitted with the experimental data (X
db
,t) for each
temperature. The results are presented in Table 1, were the percentages of deviation, %d, between experimental
and theoretical values were calculated by Eq. (11).
Table 1. Parameters of drying models.
Convective drying
Vacuum drying
T (ºC)
35
45
55
35
45
55
HR (%)
46.8
56.8
46.4
Drying Conditions
P (mmHg)
36
36
36
D
e
/L
2
(min
-1
) 0.0014 0.0016 0.0056 0.00042 0.0010 0.0015
norm 1.3
0.65
1.1
17
10
7.2
Model 1 (Eq. 7)
%d 51
57
52
70
162
691
D
e
/L
2
(min
-1
) 0.0019 0.0018 0.0062 0.00020 0.00049 0.00075
β -0.28
0.63
1.70
7.63
7.01
7.18
norm 0.42
0.58
0.25
7.2
3.3
1.8
Model 2 (Eq. 8)
%d 11
25
4
53
50
31
D
e
/L
2
(min
-1
) 0.0043 0.0061 0.023 0.0013 0.0031 0.0048
α 1.33
1.39
1.39
1.38
1.42
1.38
norm 3.0
1.6
1.6
2.2
1.8
1.8
Model 3 (Eq. 9)
%d 58
73
53
15
20
268
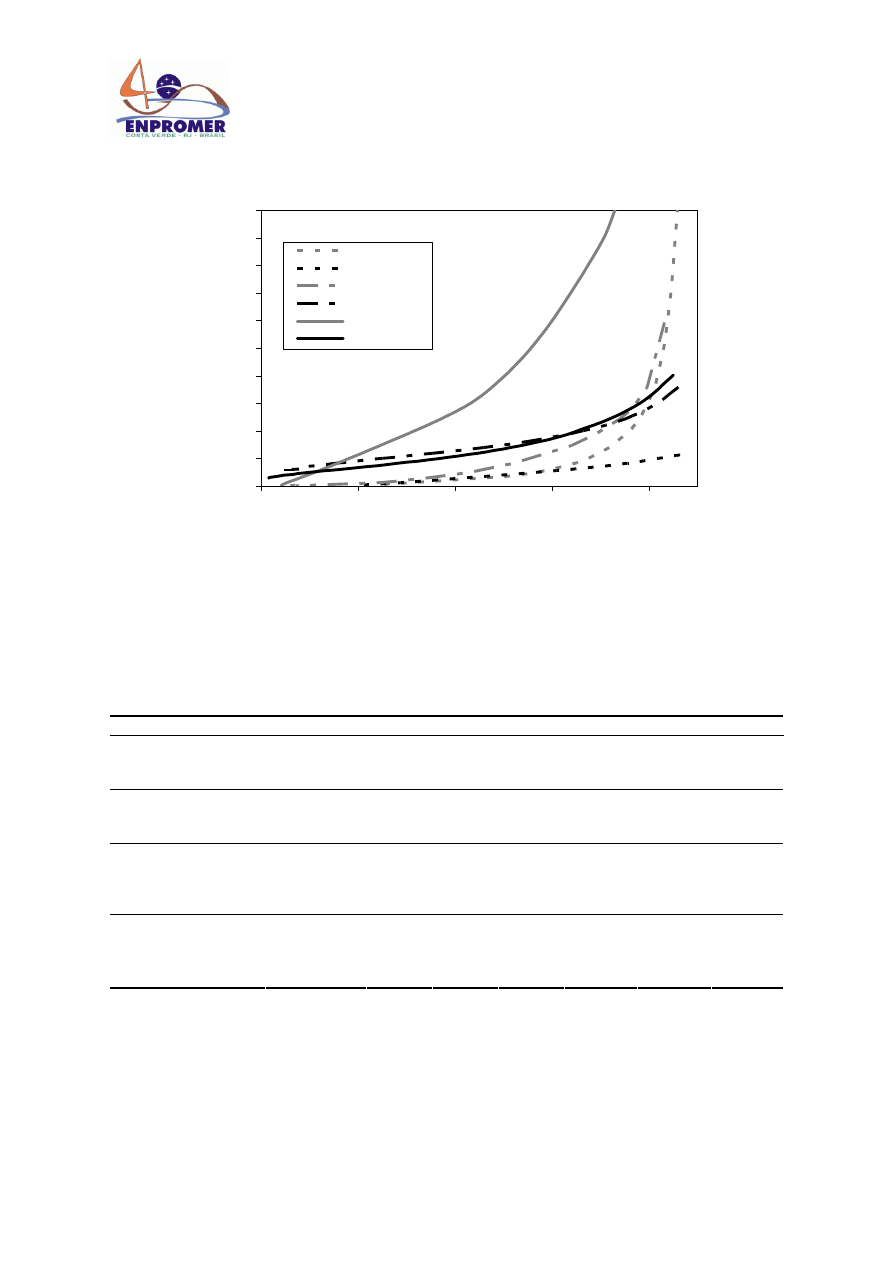
The theoretical curves corresponding to the best models determined for each experimental case, together with
the experimental values are shown in figure 3.
2
nd
Mercosur Congress on Chemical Engineering
4
th
Mercosur Congress on Process Systems Engineering
8
0
1
2
3
4
5
6
7
8
0
500
1000
1500
2000
2500
3000
Time (min)
X
db
Exp: Conv - 35 ºC
Model 2: Conv - 35 ºC
Exp: Vac - 35 ºC
Model 3: Vac - 35 ºC
Exp: Conv - 45 ºC
Model 2: Conv - 45 ºC
Exp: Vac - 45 ºC
Model 3: Vac - 45 ºC
Exp: Conv - 55 ºC
Model 2: Conv - 55 ºC
Exp: Vac - 55 ºC
Model 2: Vac - 55 ºC
Fig. 3. Experimental and theoretical drying curves.
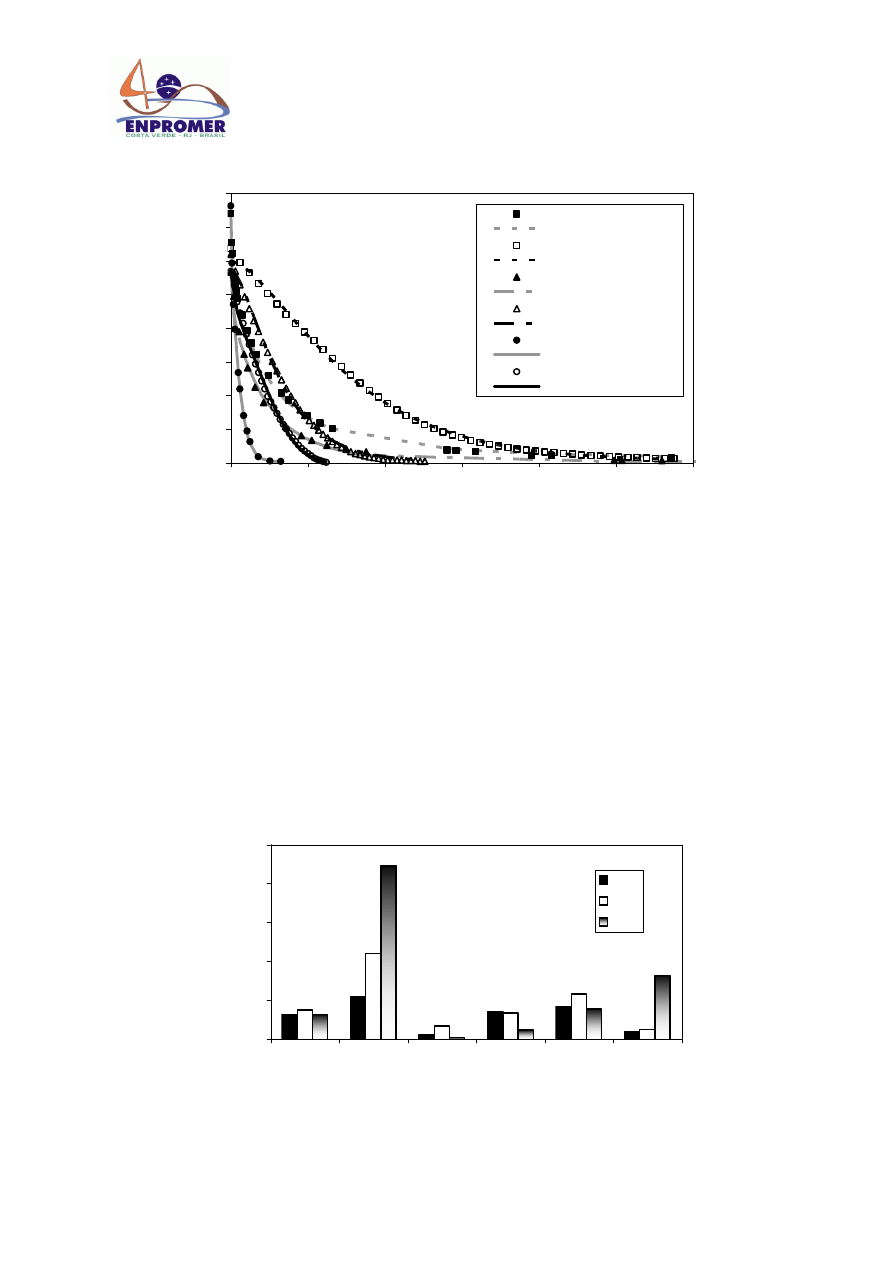
Figure 4 presents the percentage of average relative error defined by Eq. (12) as function of the theoretical
model considered, the drying process (convective or vacuum drying) and temperature.
For lower temperatures (35 and 45ºC) it was found that the best model in predicting the convective drying
process result to be the Model 2, Eq. (8), while for vacuum drying at the same temperatures, Model 3, Eq. (9),
result to be the best one. Considering that temperatures in excess 60ºC produce serious damage of the product,
the highest temperature assayed was 55ºC. For this high temperature, Model 2 result the best, either for
convective drying as for vacuum drying process.
Model 1, Eq. (7), the classical diffusion model with constant effective diffusivity and equilibrium as surface
condition, results not to be adequate for description any of the process and temperature assayed.
0
50
100
150
200
250
1
2
3
4
5
6
% relat
ive error
35ºC
45ºC
55ºC
Convective
Convective
Convective
Vaccum
Vaccum
Vaccum
Model 1
Model 2
Model 3
Fig. 4. Percentage of average relative error between theoretical and experimental
average moisture during drying.

2
nd
Mercosur Congress on Chemical Engineering
4
th
Mercosur Congress on Process Systems Engineering
9
Because of the geometric complexity of the system (portion of parsley), the equivalent length of mass transfer
is unknown. So, the relation [D
e
/L
2
] was considered as one of the parameters of the models to be determined,
instead of considering D
e
and L
2
as two independent parameters.
On one hand, this is an important simplification
of the real system and allows to establish very simple models involving only two parameters to be determined:
[D
e
/L
2
] and β for Model 2 and [D
e
/L
2
] and α for Model 3. On the other hand, these parameters are strongly
associated to the particular drying process (dryers and products), and must be determined for each particular
case. In spite of this, Model 2 and Model 3 are useful tools for predicting time or controlling the evolution of the
process variables during drying, requiring the experimental determination of only two parameters. In the
particular case of drying of parsley in a cross flow convective dryer and in a cabinet vacuum dryer, the models
selected for each case, can predict the evolution of average moisture in time with a percentage of error between
2% and 17%.
The experimental intersection of drying velocities for convective and vacuum drying and the different
velocities for different temperatures, should allows to reduce the total drying time by a combination of both
types of drying processes. Minor total time could be obtained beginning drying with a convective process and
employing a vacuum drying process for the last stage. The obtained theoretical models can be use to determine
the range of moisture and drying conditions for each one of the process to be combined. This combination of
processes could be optimized for minimal drying time, with vacuum drying in the last stage, preserving the
quality of the dehydrated product.
5. Conclusions
For vacuum and convective drying during the falling rate period, a set of simple diffusive models were
developed assuming that diffusion coefficient of water is constant or alternatively considering that water
diffusivity is variable with the Fourier number (Fo). Different boundary conditions, particularity a constant
equilibrium concentration at the interphase for the overall process or a variable surface concentration that varies
with the Fourier number (Fo), were considered. Results allow concluding that this type of models, based in
Fick´s law, are good in predicting the convective and vacuum drying studied. Model 2, obtained for variable
diffusion coefficient as potential function of Fo number resulted the best hypotheses for modelling convective
drying in the overall range of temperatures assayed. Furthermore, Model 2 also results to be the best one for
vacuum drying at high temperature (55ºC). On the other hand, Model 3 considering constant effective diffusivity
and exponential variation in time of the surface moisture content was the best for modelling vacuum drying at
35ºC and 45ºC. These simple pseudo-diffusive models, requiring the experimental determination of only two
parameters, are good in predicting the convective and vacuum drying studied. In the particular case of drying of
parsley in a cross flow convective dryer and in a cabinet vacuum dryer, the models selected for each case, can
predict the evolution of average moisture in time with a percentage of error between 2% and 17%.
Those models can also be extended to others structured vegetables and geometries.

2
nd
Mercosur Congress on Chemical Engineering
4
th
Mercosur Congress on Process Systems Engineering
10
References
Alvarez, P., Legues, P. (1986). A semi theoretical model for the drying of Thomson Seedles grapes. Drying Technology, 4,1.
Chen, Z., Lamb, F. (2004). A Vacuum Drying System for Green Hardwood Parts. Drying Technology, 22, 577.
Crank J. (1998). The Mathematics of Diffusion. Claredon Press. Oxford.
Cui ZW., Xu SY., Sun DW. (2003). Dehydration of Garlic Slices by Combined Microwave-Vaccum and Air Drying. Drying
Technology, 21, 1173.
Efremov, G. (2002). Drying kinetics derived from diffusion equation with flux type boundary conditions. Drying
Technology, 20, 55.
Jaya S., Das S. (2003) “A Vacuum Drying Model for Mango Pulp. Drying Technology 21, 1215.
Madamba P., Libbon F. (2001). Optimization of the vaccum dehydration of celery (Apium Graveolens) using the rsponse
surface methodology. Drying Technology, 19, 611.
Markowski M., Bialobrzewski I. (1998). Kinetics of vaccum drying of celery. Polish Journal of Food and Nutrition
Sciences, 7/48, 707.
Martínez-Soto G., Ocaña-Camacho R., Paredes-López O. (2001). Effect of Pretreatment and Drying on the
Quality of Oyster Mushrooms (Pleurotas Ostreatus). Drying Technology, 19, 661.
Mujumdar, A. (1995). Handbook of Industrial Drying. Marcel Dekker Inc. N.Y.
Reyes, A., Alvarez, P., Marquardt F. (2002). Drying of carrots in a fluidized bed. I. Effect of drying conditions and
modelling. Drying Technology, 20, 1463.
Treybal, R. E. (1980). Mass Transfer Operation. Mc Graw-Hill Book Co., N.Y.
Acknowledgments
The authors acknowledge financial support from PDT (Programa de Desarrollo Tecnológico – Ministerio de
Educación y Cultura – República Oriental del Uruguay).
Wyszukiwarka
Podobne podstrony:
Drying kinetics and rehydration characteristics of microwave vacuum and convective hot air dried mus
Energy Consumption and Colour Characteristics of Nettle Leaves during Microwave, Vacuum and Convecti
Drying kinetics and drying shrinkage of garlic subjected to vacuum microwave dehydration (Figiel)
Drying kinetics and drying shrinkage of garlic subjected to vacuum microwave dehydration (Figiel)
028 Osmotic Dehydration of Fruits and Vegetables
Combined osmotic and microwave vacuum dehydration of Apple and strawberries
Dehydration of Carrots by a Combination of Freeze Drying, Microwave Heating and Air or Vacuum Drying
32 425 436 Ifluence of Vacuum HT on Microstructure and Mechanical Properties of HSS
Effect of vacuum microwave drying on selected mechanical and rheological properties of carrot
Microwave Drying of Parsley Modelling, Kinetics, and Energy Aspects
Headspace Volatiles and Physical Characteristics of Vacuum microwave, Air, and Freeze dried Oregano
Vacuum impregnation for development of new dehydrated products
Microwave vacuum drying of porous media experimental study and qualitative considerations of interna
37 509 524 Microstructure and Wear Resistance of HSS for Rolling Mill Rolls
pacyfic century and the rise of China
Pragmatics and the Philosophy of Language
Haruki Murakami HardBoiled Wonderland and the End of the World
więcej podobnych podstron