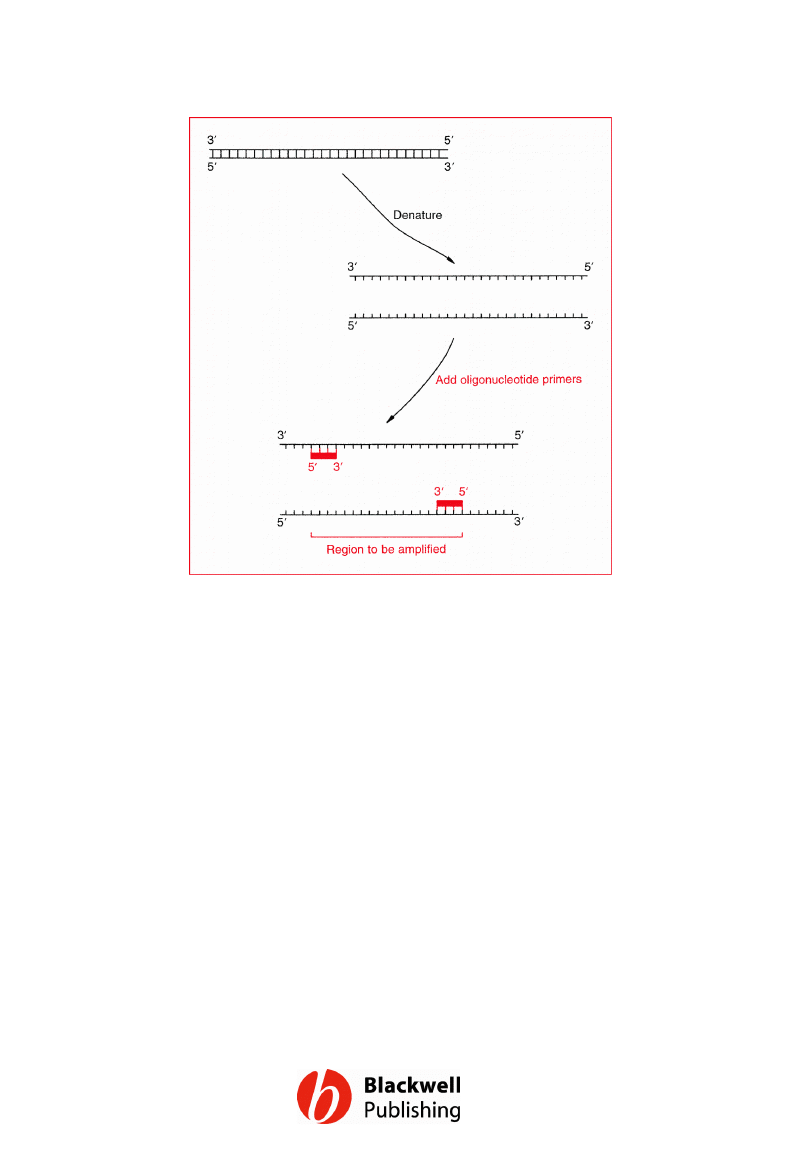
Figure 9.1 Hybridization of the
oligonucleotide primers to the template DNA
at the beginning of a PCR.
Gene Cloning and DNA Analysis by T.A. Brown. © 2006 T.A.
Brown.
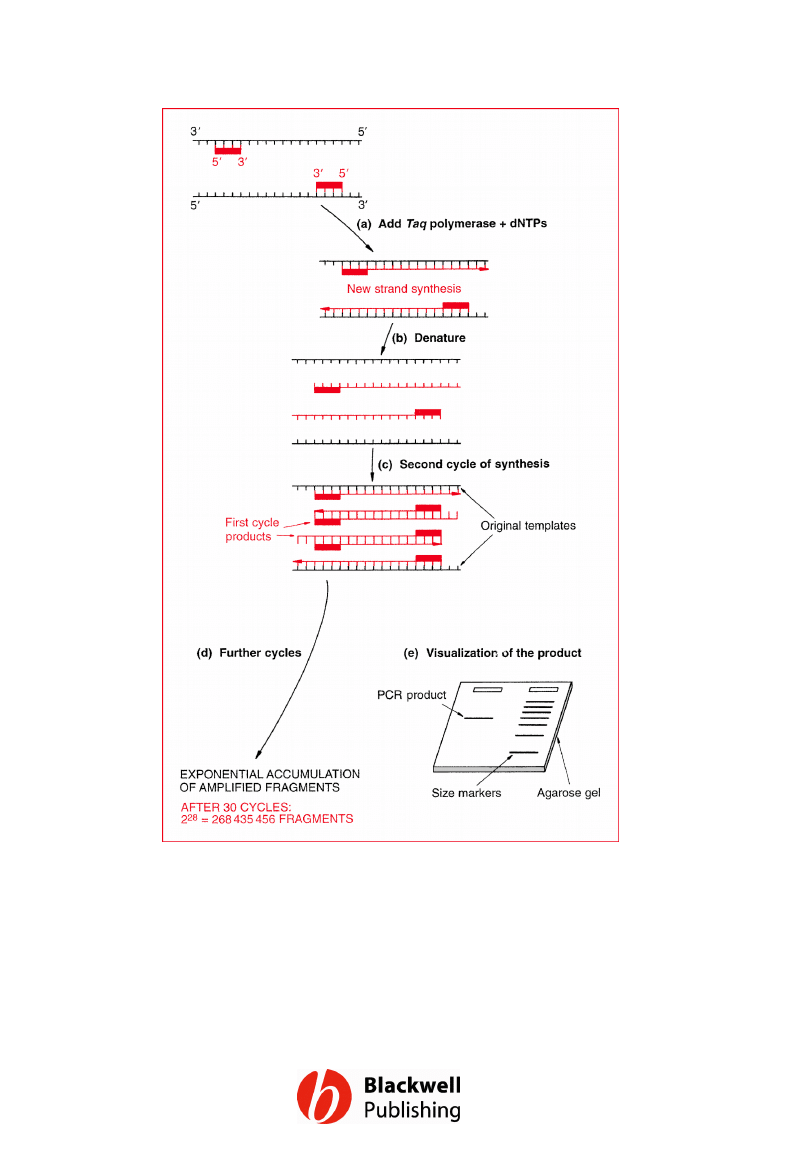
Figure 9.2 The polymerase chain reaction.
dNTPs = 2¢-deoxynucleotide 5¢-
triphosphates.
Gene Cloning and DNA Analysis by T.A. Brown. © 2006 T.A.
Brown.

Figure 9.3 The results of PCRs with well
designed and poorly designed primers. Lane
1 shows a single amplified fragment of the
expected size, the result of a well designed
experiment. In lane 2 there is no amplification
product, suggesting that one or both of the
primers were unable to hybridize to the
template DNA. Lanes 3 and 4 show,
respectively, an amplification product of the
wrong size, and a mixture of products (the
correct product plus two wrong ones); both
results are due to hybridization of one or both
of the primers to non-target sites on the
template DNA molecule.
Gene Cloning and DNA Analysis by T.A. Brown. © 2006 T.A.
Brown.
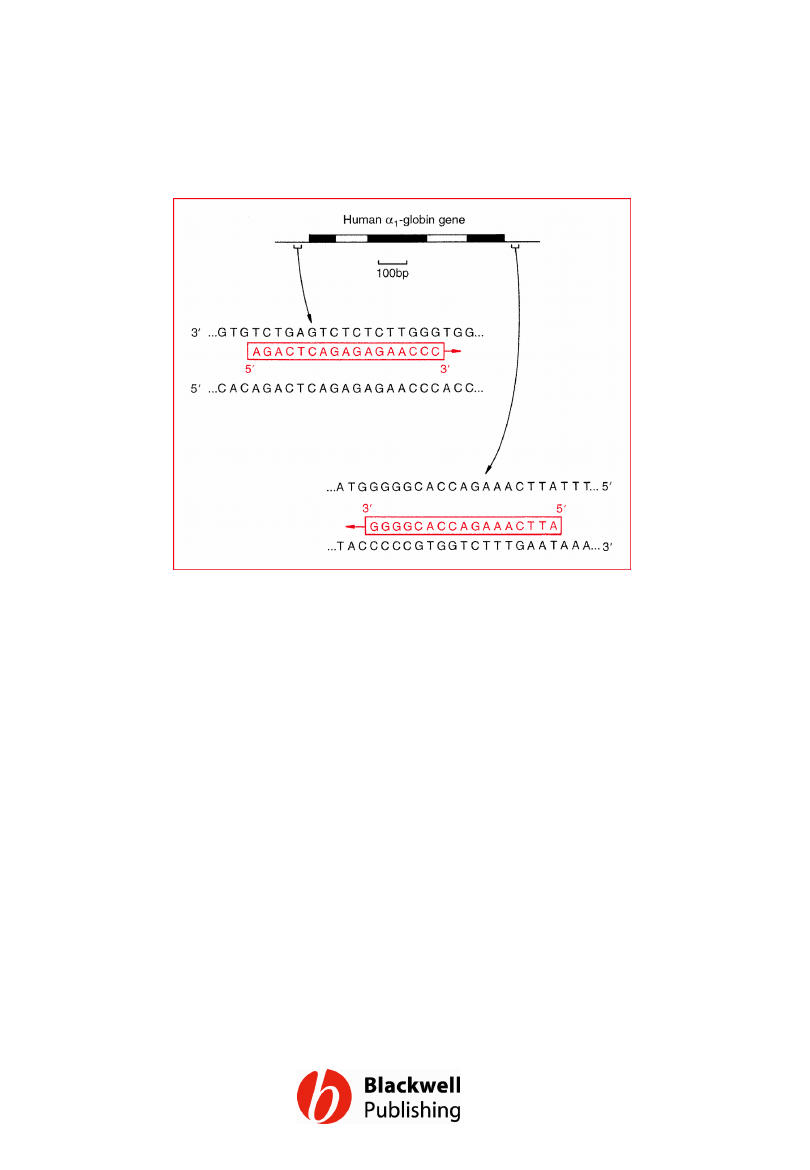
Figure 9.4 A pair of primers designed to
amplify the human a1-globin gene. The exons
of the gene are shown as closed boxes, the
introns as open boxes.
Gene Cloning and DNA Analysis by T.A. Brown. © 2006 T.A.
Brown.
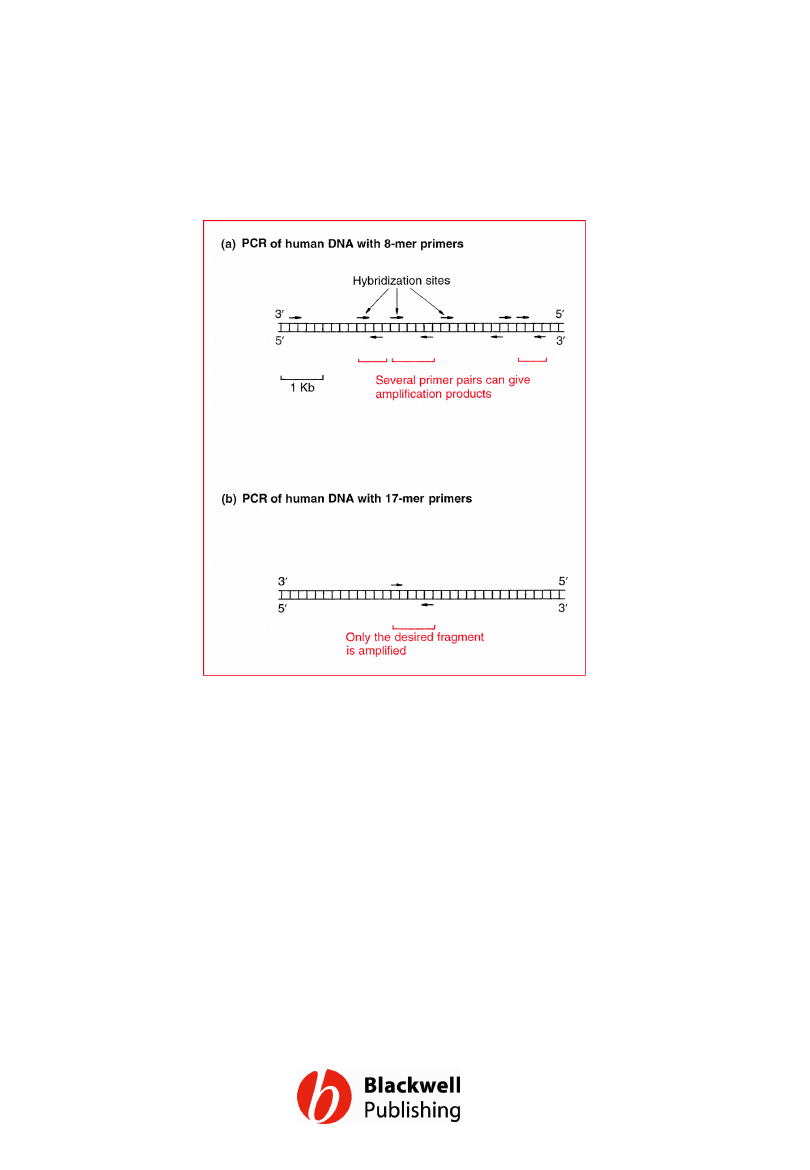
Figure 9.5 The lengths of the primers are
critical for the specificity of the PCR.
Gene Cloning and DNA Analysis by T.A. Brown. © 2006 T.A.
Brown.
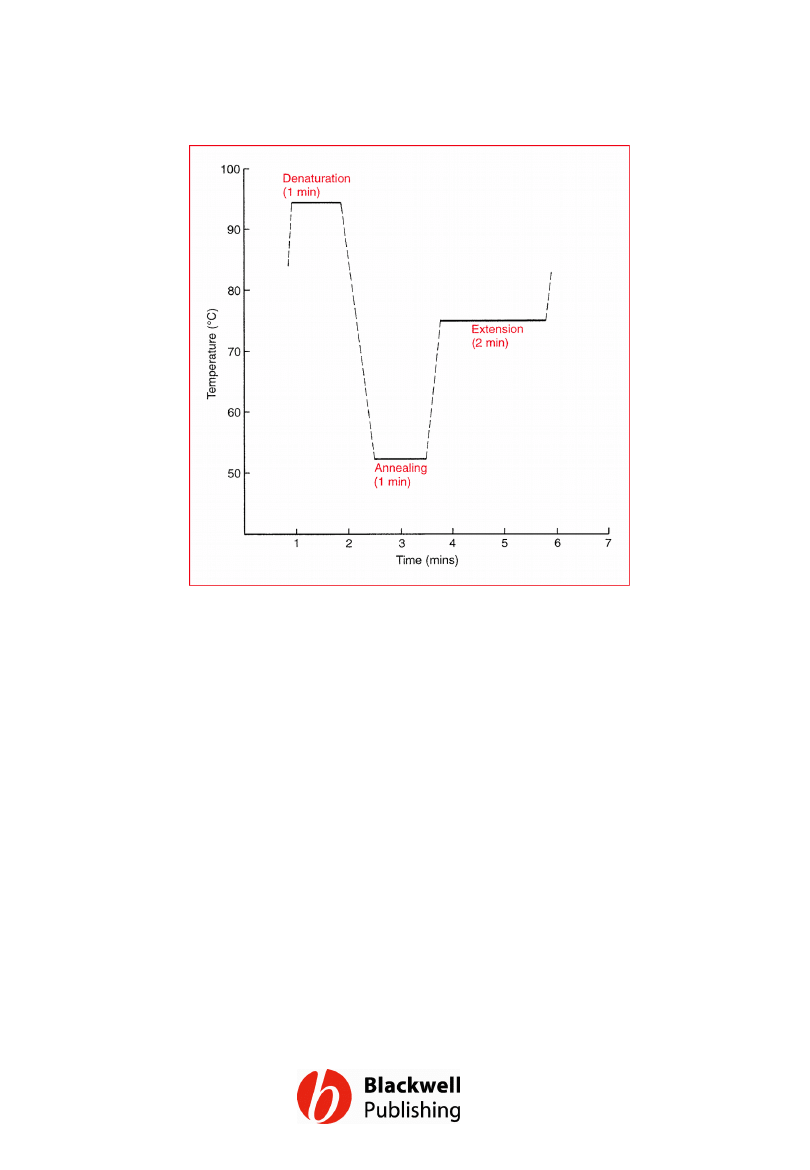
Figure 9.6 A typical temperature profile for a
PCR.
Gene Cloning and DNA Analysis by T.A. Brown. © 2006 T.A.
Brown.
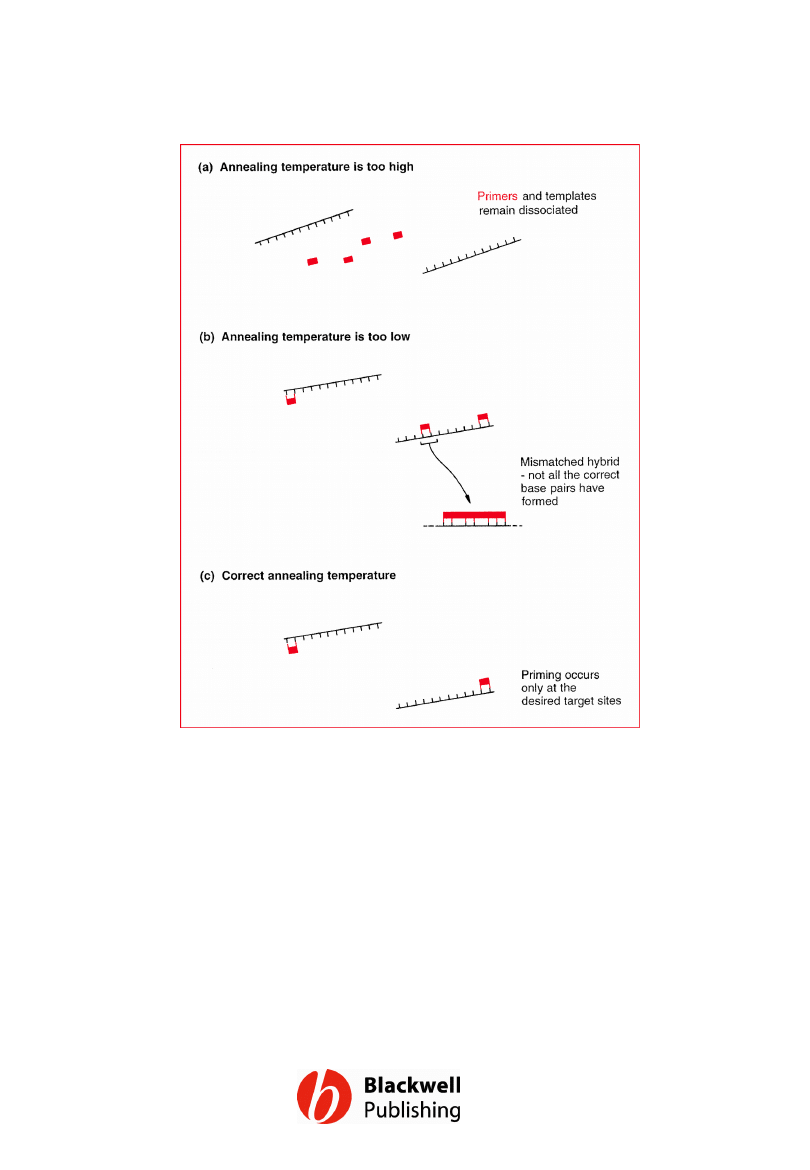
Figure 9.7 Temperature has an important
effect on the hybridization of the primers to
the template DNA.
Gene Cloning and DNA Analysis by T.A. Brown. © 2006 T.A.
Brown.

Figure 9.8 Calculating the Tm of a primer.
Gene Cloning and DNA Analysis by T.A. Brown. © 2006 T.A.
Brown.
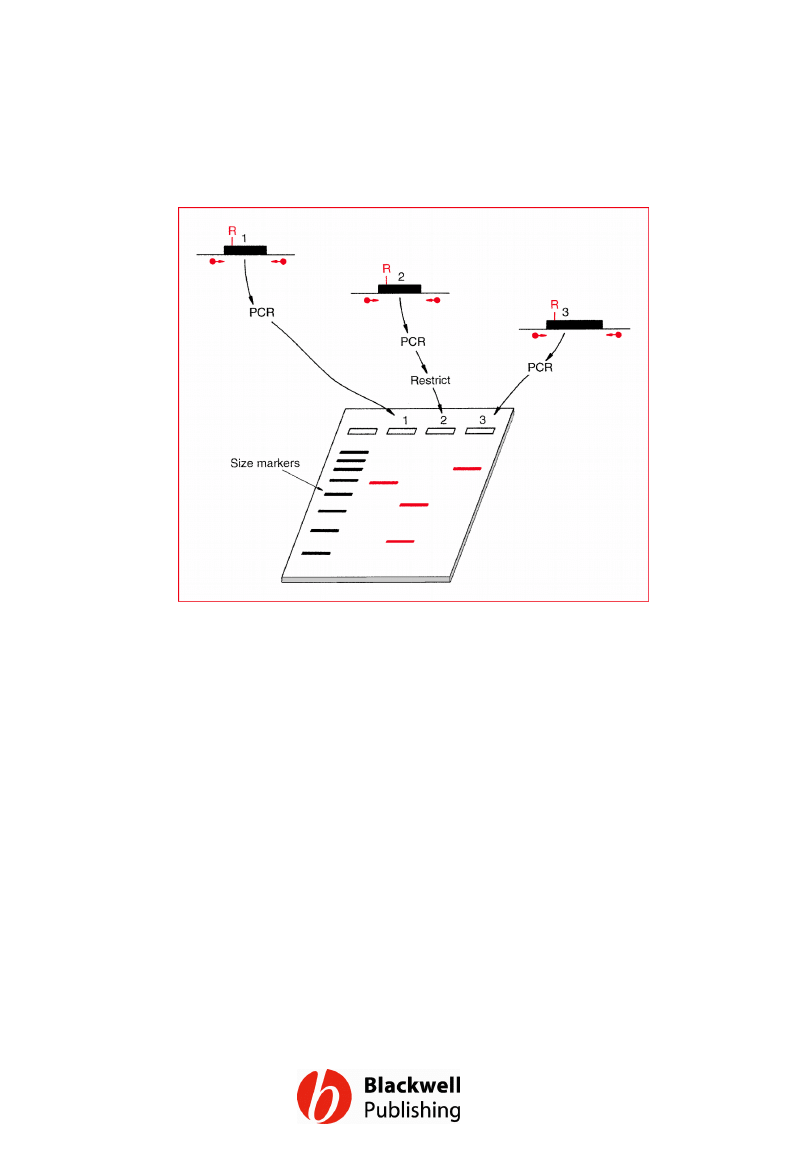
Figure 9.9 Gel electrophoresis of the PCR
product can provide information on the
template DNA molecule. Lanes 1 and 2 show,
respectively, an unrestricted PCR product and
a product restricted with the enzyme that
cuts at site R. Lane 3 shows the result
obtained when the template DNA contains an
insertion in the amplified region.
Gene Cloning and DNA Analysis by T.A. Brown. © 2006 T.A.
Brown.
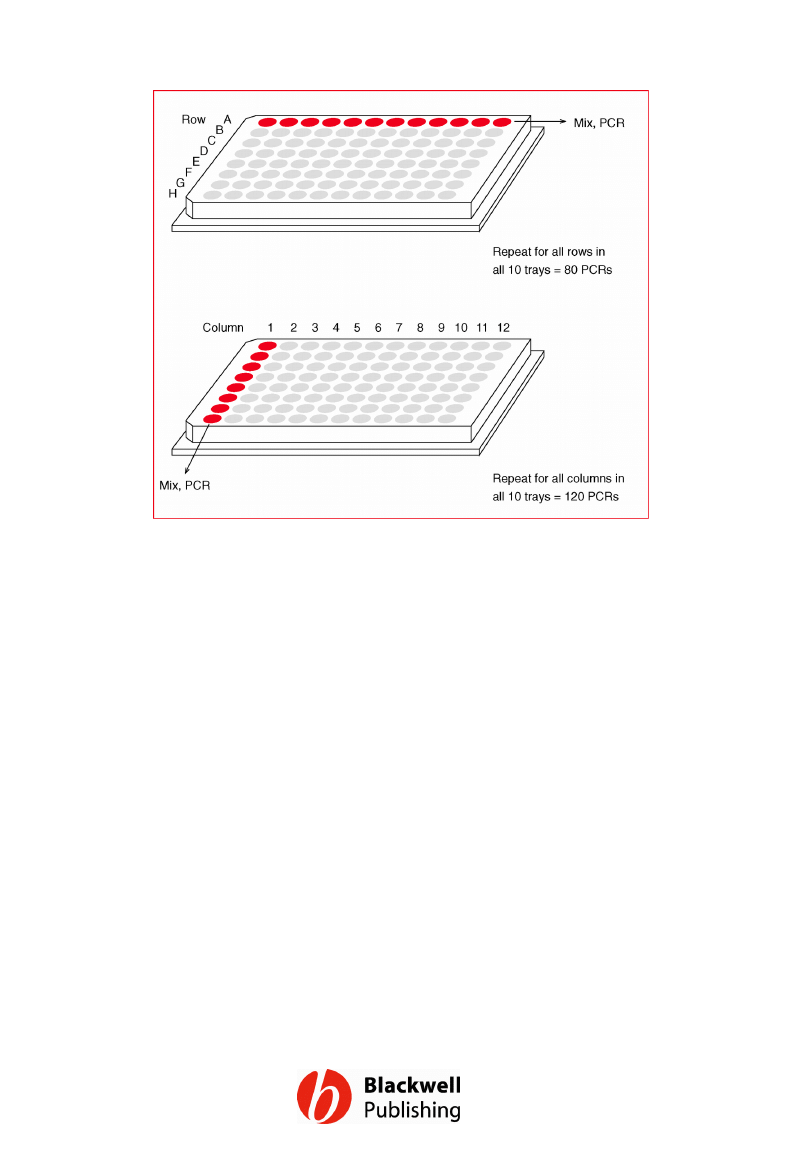
Figure 9.10 Combinatorial screening of
clones in microtitre trays. A library of 960
clones is screened by a series of PCRs, each
with a combination of clones. The clone
combinations that give positive results enable
the well(s) containing positive clone(s) to be
identified. For example, if positive PCRs are
given with row A of tray 2, row D of tray 6,
column 7 of tray 2, and column 9 of tray 6,
then it can be deduced that there are positive
clones in well A7 of tray 2 and well D9 of tray
6. Although there are 960 clones,
unambiguous identification of the positive
clones is therefore achieved after just 200
PCRs.
Gene Cloning and DNA Analysis by T.A. Brown. © 2006 T.A.
Brown.

Figure 9.11 Polynucleotides synthesized by
Taq polymerase often have an extra
adenosine at their 3¢ ends.
Gene Cloning and DNA Analysis by T.A. Brown. © 2006 T.A.
Brown.
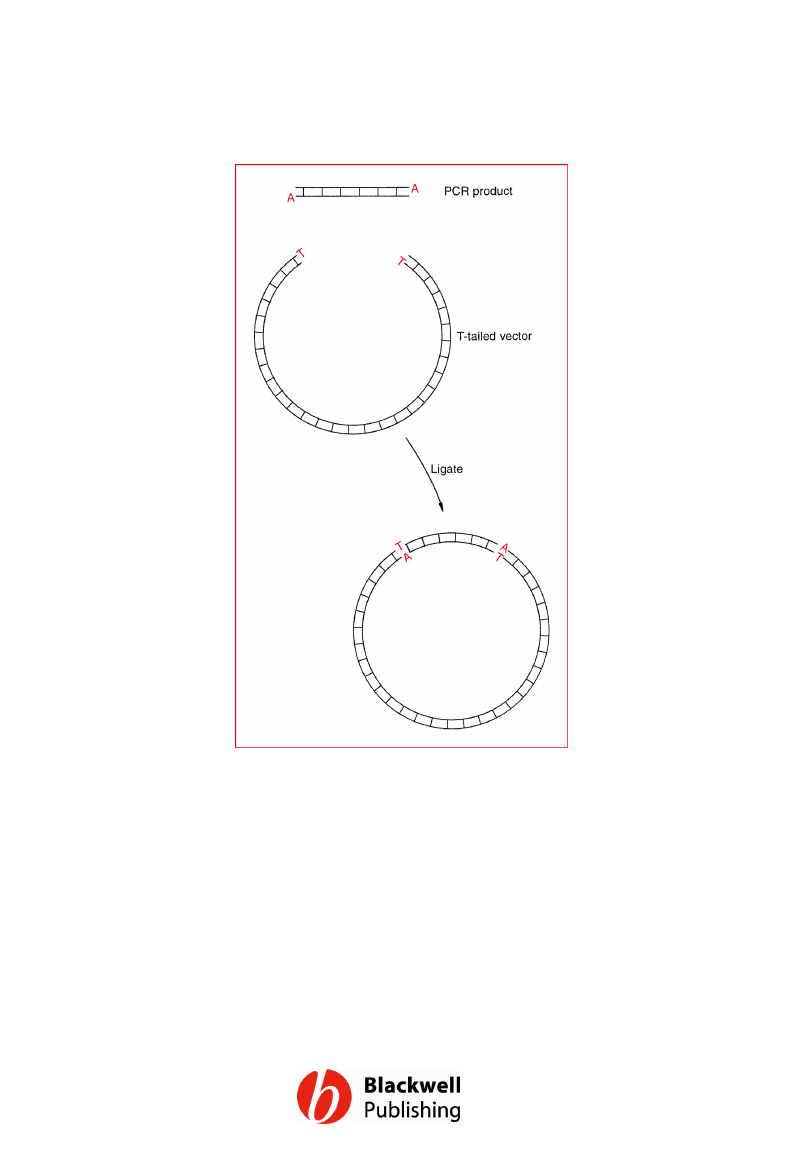
Figure 9.12 Using a special T-tailed vector to
clone a PCR product.
Gene Cloning and DNA Analysis by T.A. Brown. © 2006 T.A.
Brown.
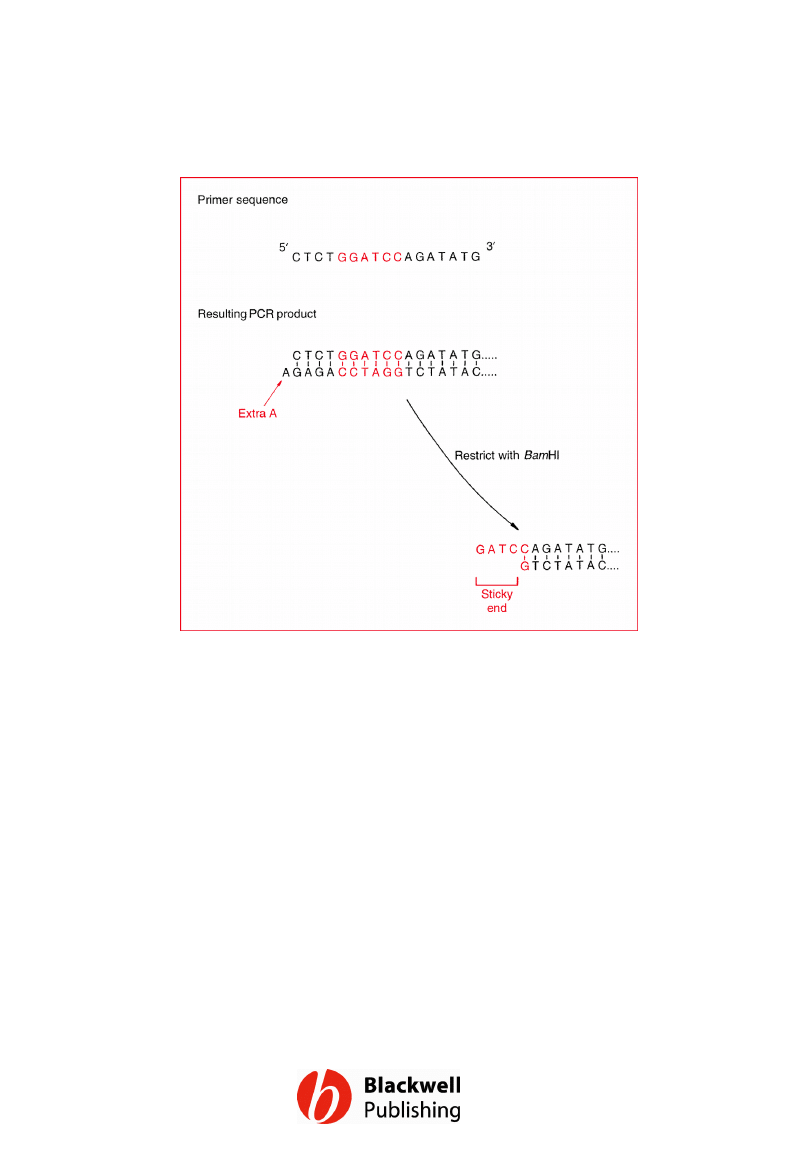
Figure 9.13 Obtaining a PCR product with a
sticky end through use of a primer whose
sequence includes a restriction site.
Gene Cloning and DNA Analysis by T.A. Brown. © 2006 T.A.
Brown.
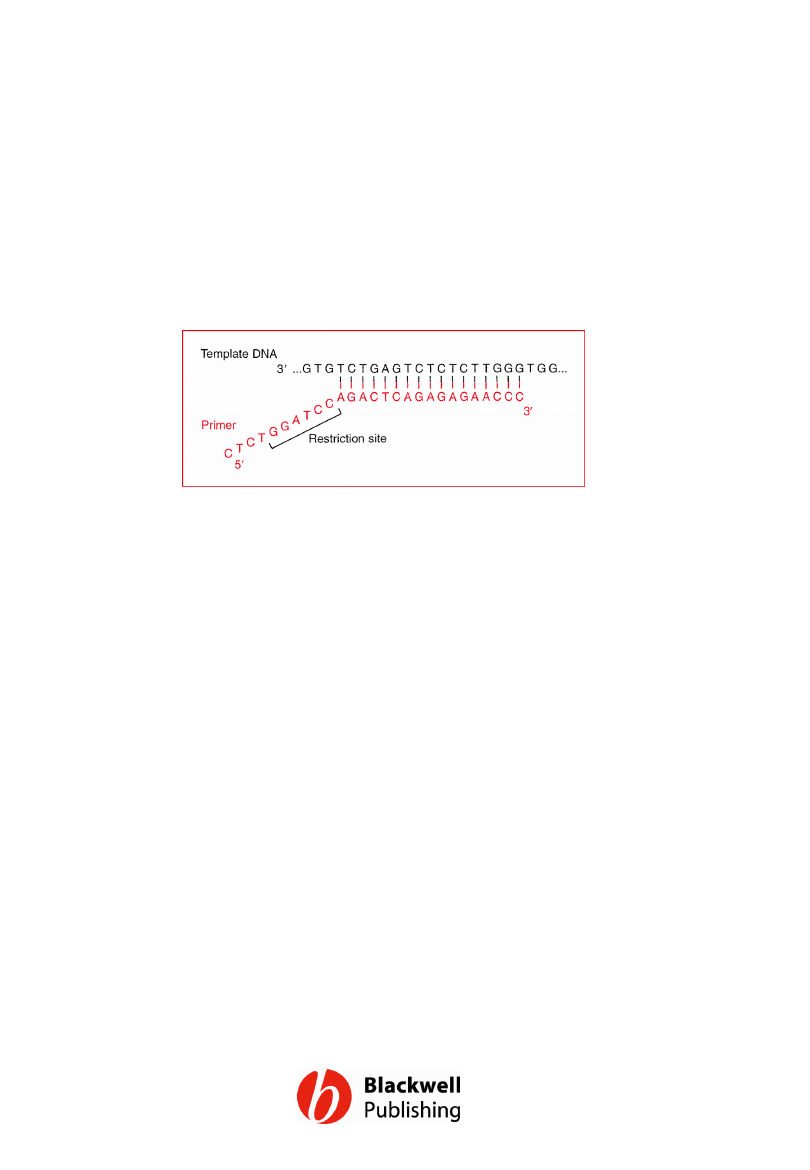
Figure 9.14 A PCR primer with a restriction
site present within an extension at the 5¢
end.
Gene Cloning and DNA Analysis by T.A. Brown. © 2006 T.A.
Brown.
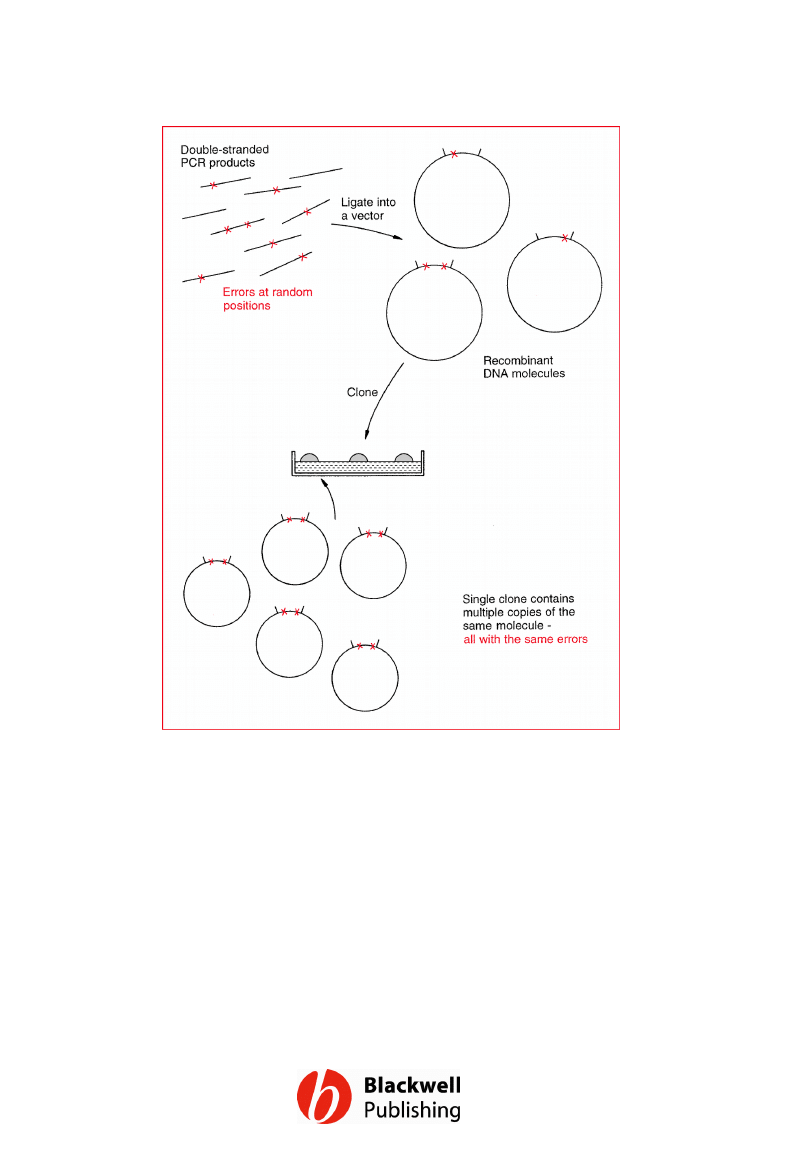
Figure 9.15 The high error rate of Taq
polymerase becomes a factor when PCR
products are cloned.
Gene Cloning and DNA Analysis by T.A. Brown. © 2006 T.A.
Brown.
Document Outline
- Figure 9.1 Hybridization of the oligonucleotide primers to the template DNA at the beginning of a PCR.
- Figure 9.2 The polymerase chain reaction. dNTPs = 2¢-deoxynucleotide 5¢-triphosphates.
- Figure 9.3 The results of PCRs with well designed and poorly designed primers. Lane 1 shows a single amplified fragment of the expected size, the result of a well designed experiment. In lane 2 there is no amplification product, suggesting that one or both of the primers were unable to hybridize to the template DNA. Lanes 3 and 4 show, respectively, an amplification product of the wrong size, and a mixture of products (the correct product plus two wrong ones); both results are due to hybridization of one or both of the primers to non-target sites on the template DNA molecule.
- Figure 9.4 A pair of primers designed to amplify the human a1-globin gene. The exons of the gene are shown as closed boxes, the introns as open boxes.
- Figure 9.5 The lengths of the primers are critical for the specificity of the PCR.
- Figure 9.6 A typical temperature profile for a PCR.
- Figure 9.7 Temperature has an important effect on the hybridization of the primers to the template DNA.
- Figure 9.8 Calculating the Tm of a primer.
- Figure 9.9 Gel electrophoresis of the PCR product can provide information on the template DNA molecule. Lanes 1 and 2 show, respectively, an unrestricted PCR product and a product restricted with the enzyme that cuts at site R. Lane 3 shows the result obtained when the template DNA contains an insertion in the amplified region.
- Figure 9.10 Combinatorial screening of clones in microtitre trays. A library of 960 clones is screened by a series of PCRs, each with a combination of clones. The clone combinations that give positive results enable the well(s) containing positive clone(s) to be identified. For example, if positive PCRs are given with row A of tray 2, row D of tray 6, column 7 of tray 2, and column 9 of tray 6, then it can be deduced that there are positive clones in well A7 of tray 2 and well D9 of tray 6. Although there are 960 clones, unambiguous identification of the positive clones is therefore achieved after just 200 PCRs.
- Figure 9.11 Polynucleotides synthesized by Taq polymerase often have an extra adenosine at their 3¢ ends.
- Figure 9.12 Using a special T-tailed vector to clone a PCR product.
- Figure 9.13 Obtaining a PCR product with a sticky end through use of a primer whose sequence includes a restriction site.
- Figure 9.14 A PCR primer with a restriction site present within an extension at the 5¢ end.
- Figure 9.15 The high error rate of Taq polymerase becomes a factor when PCR products are cloned.
Wyszukiwarka
Podobne podstrony:
Figures for chapter 5
Figures for chapter 12
Figures for chapter 6
Figures for chapter 14
Figures for chapter 10
Figures for chapter 11
Figures for chapter 8
Figures for chapter 2
Figures for chapter 16
Figures for chapter 13
Figures for chapter 3
Figures for chapter 7
Figures for chapter 15
Figures for chapter 1
Figures for chapter 5
Figures for chapter 12
Figures for chapter 6
Figures for chapter 14
Figures for chapter 10
więcej podobnych podstron